2014 clinical indicators report - healthpartnershp/@public/... · antidepressant medication...
TRANSCRIPT

2013/2014 Results
The Clinical Indicators Report features
comparative provider performance on
measures of clinical quality, patient
experience and affordability.
2014 Clinical Indicators Report

October 2014
Dear friends and colleagues,
Welcome to the HealthPartners 2014 Clinical Indicators Report. This report continues our commitment to the Triple Aim of improving health, experience and cost and the transparent reporting of meaningful measures that refl ect the quality of care delivered to our members and patients by the community of providers.
During the years this report has been distributed, we have seen consecutive year-over-year improvement in quality measures due to the impressive work by provider groups focused on quality and effectiveness of care. However, there is still much work to be done. In particular, in the last fi ve years we have seen a national trend towards steady or declining rates on major preventive care screenings including chlamydia, as well as breast, cervical, and colorectal cancer. This trend serves as a call to action to fi nd innovative ways to improve the health of our population and reverse this course. Your partnership and commitment to achieving the Triple Aim in the everyday care of your patients has a signifi cant impact on our members, their families and our communities.
The goal of these measures is to align with and support efforts that are important to our community and the over-all health of the population. In collaboration with Minnesota Community Measurement, our measures overlap with the Healthcare Effectiveness Data and Information Set. This combines local and national sources to create a broad list of quality measures that refl ect better care for our members and patients and improved outcomes for the populations we serve.
This report would not be possible without the trust, engagement and partnership of all the provider groups that care for our members. Going forward we will continue to improve and innovate by partnering with these groups to strive for the best health and experience of care at the most affordable cost, which is the value our members deserve and expect.
On behalf of HealthPartners and our members, thank you for your ongoing dedication and proven ability to im-prove the health of our community.
Sincerely,
Andrew Zinkel, MD, FACEP, FAAEMAssociate Medical Director for QualityHealthPartners Health [email protected]
P.O. Box 1309Minneapolis, MN 55440-1309healthpartners.com

2014 CLINICAL INDICATORS REPORT2013/2014 Results
Report prepared by:
Stacy Bussey, Senior AnalystKarla Warner, Analyst
Health Informatics
Key contributors:
Health InformaticsMarket Research
Please direct questions or comments to:
Andrew Zinkel, MD, FACEP, FAAEM René Fisher Associate Medical Director for Quality Sr. Manager HealthPartners Health Plan Health Informatics 952-883-7603 952-883-5113 [email protected] rene.k.fi [email protected]

Introduction ..................................................................................................................................1
Behavioral HealthADHD Follow-Up Visit after New Medication ............................................................................4
Antidepressant Medication Management......................................................................................6
Initiation and Engagement of Alcohol and Other Drug Dependence Treatment ..........................8
Follow-Up after Hospitalization for Mental Illness .....................................................................13
Optimal Health Management for Severe Mental Illness ..............................................................15
Diabetes CareDiabetes Eye Exam ......................................................................................................................17
Healthy Behaviors Body Mass Index (BMI) ..............................................................................................................20
Alcohol Assessment - Adult Primary Care ..................................................................................23
Alcohol Assessment - Adult OB/GYN ........................................................................................25
Optimal Lifestyle - Adults ...........................................................................................................27
Optimal Lifestyle - Children ........................................................................................................ 32
Medication ManagementGeneric Drug Use - Primary Care ................................................................................................ 36
Generic Drug Use - Specialty Care .............................................................................................. 39
Generic Drug Use - Pharmacy ..................................................................................................... 46
Annual Monitoring for Patients on Persistent Medications - Primary Care ................................ 48
Annual Monitoring for Patients on Persistent Medications - Cardiology .................................... 53
Medication Adherence for Asthma/COPD - Pharmacy ............................................................... 56
Medication Adherence for Diabetes - Pharmacy ......................................................................... 58
Potentially Inappropriate Medications - Pharmacy ...................................................................... 60
2014 CLINICAL INDICATORS REPORTTable of Contents
............. .............. ...................................HEDIS
............. ............ ..........................HEDIS
................. ................. ......................................HEDIS
gg pp
...................... ......................................HEDIS
......................... ........................................HEDIS
...................... .......................................HEDIS
..............................................................HEDIS
HealthPartners Clinical Indicators Report — 2013/2014 Results

HealthPartners Clinical Indicators Report — 2013/2014 Results
Musculoskeletal Optimal Care for Acute Low Back Pain .....................................................................................62
Preventive ServicesPreventive Services Members Up-to-Date - Adult Primary Care ................................................68
Preventive Services Members Up-to-Date - Adult OB/GYN ......................................................71
Preventive Services Members Up-to-Date - Child and Adolescent .............................................73
Evidence-Based Cervical Cancer Screening - Primary Care .......................................................78
Evidence-Based Cervical Cancer Screening - OB/GYN .............................................................80
Child & Teen Check-Ups (Medicaid Population) ........................................................................82
Lead Screening (Medicaid Population)........................................................................................84
SafetyClinic Safety Assessment Survey .................................................................................................86
Patient Experience Medication Safety - Primary Care ................................................................90
Patient Experience Medication Safety - Specialty Care ..............................................................93
Tobacco Use and CessationTobacco Use and Cessation ........................................................................................................102
Total Cost of CareTotal Cost of Care and Resource Use - Primary Care .................................................................106
Total Cost Index and Resource Use - Specialty Care .................................................................109
Total Cost Index - Hospitals ........................................................................................................118
HEDIS Identifi cation of measures, or elements of measures that are consistent with HEDIS measurement specifi cations
............... ........... .............................HEDIS
........................... ......................................................HEDIS
..................... ...................................HEDIS

HealthPartners Clinical Indicators Report — 2013/2014 Results1
INTRODUCTIONPurposeThis annual Clinical Indicators Report features comparative provider performance on measures of clinical quality, patient experience and affordability. The Triple Aim approach improves the health of the population, enhances the patient experience of care and helps make care more affordable. Measurement results displayed relate to preven-tive and chronic care, behavioral health, pharmacy, specialty care, hospital care and total cost of care. The primary purpose is to provide valid and reliable information for providers to use in their efforts to improve patient care and outcomes.
ContentThis year’s Clinical Indicators Report includes comparative provider performance on 75 measures. Rates are reported by primary provider group, specialty provider group, pharmacy or hospital. The HealthPartners Partners in Excellence (PIE) program recognizes provider groups achieving superior outcomes in heart disease, diabetes, depression, prevention, medication management, low back care and patient experience. This year 25 primary care provider groups, 12 specialty care provider groups and 13 pharmacies met one or more PIE targets.
The report includes:• Measurement defi nitions and methodologies based on the following categories: chart review (may include
data from electronic medical records), administrative data, hybrid (combination administrative and chart review), provider self-reported data, provider survey and member survey
• Graphs of provider rates with 95th percentile confi dence intervals, where applicable• HealthPartners rate: weighted population average for measures that are sampled• Average group/hospital: an average provider group rate (the average of the reported provider groups) is
displayed on the graph. The average provider group rate is highlighted to allow for easy comparison.• Partners in Excellence goals, where applicable• Identifi cation of measures, or elements of measures, that are consistent with HEDIS measurement specifi -
cations ficacaatitititionononon o of mss HEDIS
• A list of provider groups, clinics and hospitals contributing data to this report
Risk AdjustmentsHealthPartners has adopted NCQA’s approach to risk adjustment for quality measures. Risk adjustment is consid-ered when developing quality measures. The measurement methodology will describe when case-mix or severity adjustment is applied. Clinical measures are consistent with evidenced-based clinical guidelines. Case-mix and severity is only applied when the guideline specifi cally defi nes different treatment protocols or expected outcomes based on variations in the health of the population. For the purpose of comparing provider performance, using the same measurement criteria for all patients produces valid comparative provider results when there is no evidence to suggest there is signifi cant variation in patient populations across our provider groups.
Key ImpactsThe following clinical indicators statistically improved from the previous year:
• Body Mass Index (BMI) Assessment - Child and Adolescent• Alcohol Use Assessment - Adult Primary Care• Alcohol Use Assessment - OB/GYN Providers• Generic Drug Use - Primary Care• Generic Drug Use - Behavioral Health• Generic Drug Use - Cardiology• Generic Drug Use - OB/GYN• Generic Drug Use - Pharmacy Chains• Medication Adherence for Asthma/COPD - Pharmacy Chains

HealthPartners Clinical Indicators Report — 2013/2014 Results2
• Medication Adherence for Diabetes - Pharmacy Chains• Preventive Services - Adult - Primary Care, Combination 3• Evidence-Based Cervical Cancer Screening - Primary Care• Evidence-Based Cervical Cancer Screening - OB/GYN• Patient Experience Medication Safety - explanation for prescribed medications - Orthopaedics• Patient Experience Medication Safety - information received about side effects - Orthopaedics
Retired Measures• Optimal Depression Care - was retired from the report this year. MNCM Depression Remission or
Response at 6 months will be used for the PIE program.
• Alcohol Screening - Depression Care - was retired from the report this year as it was a component of the Optimal Depression Care measure.
Measurement Changes• Antidepressant Medication Management – the focus of this measure was changed from diagnosis of
depression to the start of an antidepressant prescription. The denominator is defi ned by the antidepressant prescription start date and requires a diagnosis of depression in the 60 days before and after. The continu-ous enrollment and negative medication history periods have been changed accordingly
• Preventive Services - Adult - Primary Care: the previously reported combination 2 measure has been retired from the Clinical Indicators set of measures, and combination 6 has been added to the report. Combination 6 adds BMI to the list of required components.
• Preventive Services - OB/GYN: the previously reported combination 2 measure has been retired from the Clinical Indicators set of measures.
• Preventive Services - Child and Adolescent:. the previously reported combination 2 and combination 3 measures have been retired from the Clinical Indicators set of measures, and combination 6 has been added to the report. Combination 6 includes the components of combination 4, replacing height and weight recorded on the same date with BMI.
All of the preventive services matrices of required services by age and gender are included in the 2014 Clinical Indicators Report Technical Supplement, which can be found at healthpartners.com/quality.
Participating ProvidersRates are displayed for HealthPartners provider groups based on patient volume, Partners in Excellence program participation, geographic location and strategic relationship with HealthPartners. Primary care provider groups in-cluded in this year’s Clinical Indicators Report serve over 90 percent of HealthPartners membership.
Data Display Each graph displays provider group performance (light red bars) and average group performance (dark red bar). Comparative provider data are only made available for a sample size or population denominator of at least 30. If the measure is included in the Partners in Excellence program, target performance is indicated by the dashed black lines. While health plan rates provided on the measure description pages are weighted as described within the measure, the average medical group bar on the graphs represents the unweighted average performance of the displayed provider groups only.
The upper and lower confi dence intervals represent the 95th percentile confi dence intervals. In addition, for all hybrid measures (which include medical record abstraction), a fi nite population correction factor is used to best account for the percentage of the total of a provider group’s population that the sample represents. For example, when calculating the Optimal Health Management for Severe Mental Illness measure, a group whose sample col-lected approaches the entire HealthPartners measure eligible population at that group will have a very narrow

HealthPartners Clinical Indicators Report — 2013/2014 Results3
confi dence interval. If the entire HealthPartners measure eligible population of that group is used, there will be no confi dence interval. This refl ects more confi dence that the rate derived from the sample actually constitutes the true rate for their full population. Graphs using a fi nite population correction factor will include a footnote indicat-ing this application.
Provider Group
Average Group
Provider Group
Provider Group
Confidence IntervalAverage Provider Group RateProvider Group RateGoal
0% 10% 20% 30% 40% 50% 60% 70% 80% 90% 100%
The 2014 Clinical Indicators Report Technical Supplement is available online and includes measurement detail, optimal component rates, trended plan rates over time and external benchmarks. The 2014 Clinical Indicators Report and 2014 Clinical Indicators Report Technical Supplement are both available at healthpartners.com/quality.

HealthPartners Clinical Indicators Report — 2013/2014 Results4
ATTENTION DEFICIT HYPERACTIVITY DISORDER (ADHD) Follow-Up Visit after New MedicationJanuary 1, 2013 – December 31, 2013
DescriptionThe percentage of children ages six to 17 with an ambulatory prescription dispensed for ADHD medication be-tween January 1, 2013 and December 1, 2013, that had a minimum of one follow-up visit with a practitioner with prescribing authority within 30 days of starting the medication.
Methodology — AdministrativeElements of this measure are consistent with the HEDIS 2014 Follow-Up Care for Children Prescribed ADHD Medication measure and includes all members ages six to 17 years old as of prescription fi ll date, from Commercial and Medicaid products with a pharmacy benefi t who were continuously enrolled for 120 days prior to starting ADHD medication through 30 days after. Population identifi cation is based on claim and membership databases. Rates are calculated using administrative data only. Members are attributed to the provider group of the practitioner who prescribed the ADHD medication.
Results
Total eligible members 1,755Members with follow-up visit(s) 721
ADHD Follow-Up Visit Rate 41.1%

HealthPartners Clinical Indicators Report — 2013/2014 Results5
0% 10% 20% 30% 40% 50% 60% 70% 80% 90% 100%
Essentia Health - SMDC Health System
Park Nicollet Health Services
HealthPartners Clinics
Average Group
Allina Health
Fairview Clinics
Children's Physician Network
Southdale Pediatric Associates, Ltd
Percent with Visits within 30 Days
ADHD Follow-up Visit after New Medication1/1/2013 - 12/31/2013

HealthPartners Clinical Indicators Report — 2013/2014 Results6
ANTIDEPRESSANT MEDICATION MANAGEMENTMay 1, 2012 – December 31, 2013
DescriptionThe percentage of members ages 18 and older with a diagnosis of major depression, and newly treated with an-tidepressant medication who remained on the medication for 90 days (acute phase) and 180 days (continuation phase).
This measure is consistent with the HEDIS 2014 Antidepressant Medication Management measurement specifi cations.
Methodology — AdministrativeThis measure includes all members ages 18 and older as of April 30, 2013, from all products with a pharmacy benefi t who were continuously enrolled for 90 days prior to the new episode of depression through 245 days after. Population identifi cation is based on claim and membership databases. Rates are calculated using administrative data only. Members are attributed to the provider group of the practitioner, regardless of specialty, who diagnosed the new episode of depression.
Results
Total eligible members 6,691
Members remaining on medication for 90 days (acute phase) 4,723
Members remaining on medication for 180 days (continuation phase) 3,650
Antidepressant Medication Management Rate - Acute Phase 70.6%
Antidepressant Medication Management Rate -Continuation Phase 54.6%

HealthPartners Clinical Indicators Report — 2013/2014 Results7
0% 10% 20% 30% 40% 50% 60% 70% 80% 90% 100%
West Side Community Health Center
HealthPartners Central Minnesota Clinics, Inc
University of MN Physicians
BHSI, LLC
North Memorial Health Care
Integrity - Buffalo
Mayo Health System Clinics MN
Hennepin County Medical Center
Lakeview Clinic, Ltd
Sanford Health - Fargo
CentraCare Clinics
Associated Clinic of Psychology
Average Group
HealthPartners Clinics
Psych Recovery, Inc
Park Nicollet Health Services
Ridgeview Clinics
Fairview Clinics
Stillwater Medical Group
HealthEast
Entira Family Clinics
Nystrom & Associates, Ltd
Essentia Health - SMDC Health System
North Clinic, PA
St. Luke's Clinics
Allina Health
Western Wisconsin Medical Associates, SC Clinics
Essentia Health - St. Joseph's Medical Center
Percent Managed
Antidepressant Medication Management1/1/2013 - 12/31/2013
Acute Phase (90 days) Continuation Phase (180 days)

HealthPartners Clinical Indicators Report — 2013/2014 Results8
INITIATION AND ENGAGEMENT OF ALCOHOL AND OTHER DRUG DEPENDENCE TREATMENTJanuary 1, 2013 – December 31, 2013
DescriptionThe percentage of members ages 13 and older who were diagnosed with a new episode of alcohol or other drug (AOD) dependence who initiated treatment through an inpatient AOD admission, outpatient visit, intensive out-patient encounter or partial hospitalization within 14 days of diagnosis (initiation) and had two or more additional services with an alcohol or other drug dependence diagnosis within 30 days of the initiation visit (engagement).
Methodology — AdministrativeThis measure is consistent with the HEDIS 2014 Initiation and Engagement of Alcohol and Other Drug Dependence Treament measurement specifi cations and includes all members ages 13 and older as of December 31, 2013, from all products who were continuously enrolled for 60 days prior to the new AOD diagnosis through 44 days after. Population identifi cation is based on claim and membership databases. Rates are calculated using administrative data only. Members are attributed to the provider group or hospital of the practi-tioner who diagnosed the new episode of AOD dependence.
Results
Members Attributed to Provider GroupsTotal eligible members 3,290Members initiating treatment within 14 days of diagnosis 640Members engaged in treatment within 30 days of initiation visit 296
Initiation of AOD Treatment Rate 19.5%Engagement of AOD Treatment Rate 9.0%
Members Attributed to Chemical Dependency ProgramsTotal eligible members 557Members initiating treatment within 14 days of diagnosis 216Members engaged in treatment within 30 days of initiation visit 177
Initiation of AOD Treatment Rate 38.8%Engagement of AOD Treatment Rate 31.8%
Members Attributed to HospitalsTotal eligible members 3,745Members initiating treatment within 14 days of diagnosis 1,787Members engaged in treatment within 30 days of initiation visit 705
Initiation of AOD Treatment Rate 47.7%
Engagement of AOD Treatment Rate 18.8%

HealthPartners Clinical Indicators Report — 2013/2014 Results9
0% 10% 20% 30% 40% 50% 60% 70% 80% 90% 100%
Stillwater Medical Group - NBH
Essentia Health - SMDC Health System - NBH
Park Nicollet Health Services - NBH
Allina Health - NBH
HealthPartners Central Minnesota Clinics, Inc - NBH
Fairview Clinics - NBH
Park Nicollet Health Services - BH
Medical Advanced Pain Specialists - NBH
HealthEast - NBH
University of MN Physicians - NBH
Allina Health - BH
Average Group
Entira Family Clinics - NBH
Psych Recovery, Inc - BH
Options Family & Behavior Services - BH
HealthPartners Clinics - NBH
HealthPartners Clinics - BH
Canvas Health, Inc - BH
Nystrom & Associates, Ltd - BH
Associated Clinic of Psychology - BH
Initiation and Engagement of Alcohol and Other Drug Dependence TreatmentPrimary Care and Behavioral Health Provider Groups
1/1/2013 - 12/31/2013
Initiation Engagement
Initiation - treatment initiated within 14 days of diagnosis Engagement - Initiation plus two additional follow - up visits within 30 days
Percent Initiation and Engagement
BH - Behavioral Health Provider Group NBH - Non-Behavioral Health Provider Group

HealthPartners Clinical Indicators Report — 2013/2014 Results10
0% 10% 20% 30% 40% 50% 60% 70% 80% 90% 100%
Dakota County Receiving Center
Center for Alcohol & Drug Treatment
Riverplace Counseling Center
C.R.E.A.T.E., Inc
Haven Chemical Health Systems
Park Avenue Center
Avalon Progams LLC
River Ridge Treatment Center
Anthony Louis Center
Average Group
Living Free Recovery Services
We Care Counseling Center
Club Recovery, LLC
Specialized Treatment Services, Inc
Hazelden Foundation
Percent Initiation and Engagement
Initiation and Engagement of Alcohol and Other Drug Dependence TreatmentChemical Dependency Programs
1/1/2013 - 12/31/2013
Initiation Engagement
Initiation - treatment initiated within 14 days of diagnosis Engagement - Initiation plus two additional follow - up visits within 30 days
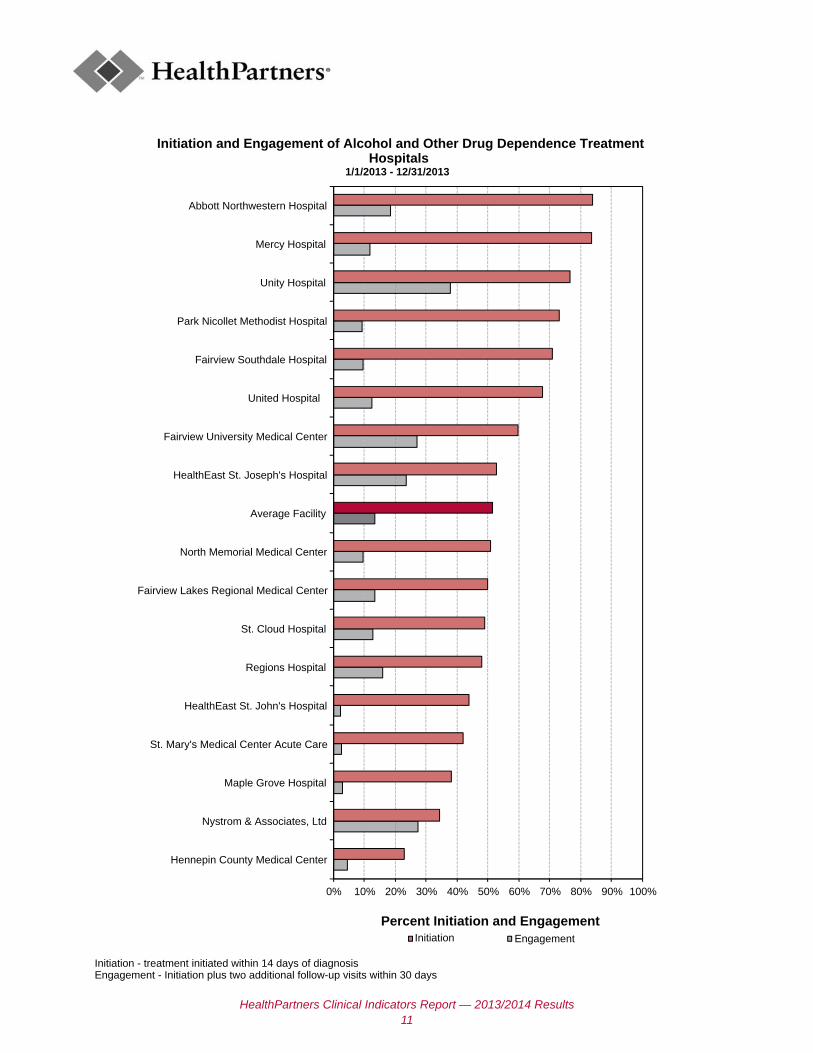
HealthPartners Clinical Indicators Report — 2013/2014 Results11
Initiation Engagement
0% 10% 20% 30% 40% 50% 60% 70% 80% 90% 100%
Hennepin County Medical Center
Nystrom & Associates, Ltd
Maple Grove Hospital
St. Mary's Medical Center Acute Care
HealthEast St. John's Hospital
Regions Hospital
St. Cloud Hospital
Fairview Lakes Regional Medical Center
North Memorial Medical Center
Average Facility
HealthEast St. Joseph's Hospital
Fairview University Medical Center
United Hospital
Fairview Southdale Hospital
Park Nicollet Methodist Hospital
Unity Hospital
Mercy Hospital
Abbott Northwestern Hospital
Percent Initiation and Engagement
Initiation and Engagement of Alcohol and Other Drug Dependence TreatmentHospitals
1/1/2013 - 12/31/2013
Initiation - treatment initiated within 14 days of diagnosis Engagement - Initiation plus two additional follow-up visits within 30 days

HealthPartners Clinical Indicators Report — 2013/2014 Results12
0% 10% 20% 30% 40% 50% 60% 70% 80% 90% 100%
Unity Hospital
United Hospital
St. Mary's Medical Center Acute Care
St. Cloud Hospital
Regions Hospital
Park Nicollet Methodist Hospital
Nystrom & Associates, Ltd
North Memorial Medical Center
Mercy Hospital
Maple Grove Hospital
Hennepin County Medical Center
HealthEast St. Joseph's Hospital
HealthEast St. John's Hospital
Fairview University Medical Center
Fairview Southdale Hospital
Fairview Lakes Regional Medical Center
Abbott Northwestern Hospital
Percent by Category
Initiation and Engagement of Alcohol and Other Drug Dependence TreatmentHospitals - Initial Diagnosis Location
1/1/2013 - 12/31/2013
Detox ED Inpatient Outpatient
Groups sorted alphabetically

HealthPartners Clinical Indicators Report — 2013/2014 Results13
FOLLOW-UP AFTER HOSPITALIZATION FOR MENTAL ILLNESSJanuary 1, 2013 – December 31, 2013
DescriptionThe percentage of members ages six and older who were hospitalized for treatment of selected mental health dis-orders in 2013, who were seen on an outpatient basis or were in intermediate treatment with a mental health pro-vider within seven days of discharge.
Methodology — AdministrativeThis measure is consistent with the HEDIS 2014 Follow-Up after Hospitalization for Mental Illness measurement specifi cations and includes all members ages six years and older as of discharge date from all products who were continuously enrolled for 30 days after hospital discharge date. Population identifi cation is based on claim and membership databases. Rates are calculated using administrative data only. Members are attributed to the hospital from which they were discharged.
Results
Total eligible members 1,601Members with follow-up visit(s) 964
Follow-Up Visit Rate 60.2%

HealthPartners Clinical Indicators Report — 2013/2014 Results14
0% 10% 20% 30% 40% 50% 60% 70% 80% 90% 100%
Essentia Health - Duluth
Hennepin County Medical Center
North Memorial Medical Center
Mayo Clinic Hospital
Mercy Hospital
HealthEast St. Joseph's Hospital
St. Cloud Hospital
Prairie St. John's
Abbott Northwestern Hospital
Average Facility
United Hospital
Fairview Southdale Hospital
Fairview University Medical Center
Regions Hospital
Percent with Visits within 7 Days
Follow-up after Hospitalization for Mental Illness1/1/2013 - 12/31/2013

HealthPartners Clinical Indicators Report — 2013/2014 Results15
OPTIMAL HEALTH MANAGEMENT FOR SEVERE MENTAL ILLNESS January 1, 2013 – December 31, 2013
DescriptionThe percentage of members ages 18 to 65 by December 31, 2013, who have a diagnosis of schizophrenia or bipo-lar disorder and had at least one fi ll of an antipsychotic or mood stabilizer medication and have documentation of optimal care.
Methodology — HybridThis measure includes members from all products who were continuously enrolled from January 1, 2013 to December 31, 2013, who had a clinic visit in 2013 and were prescribed an antipsychotic or mood stabilizer in 2013. Population identifi cation is based on claim and membership databases. This measure includes a random sample of 66 members (60 + 10% oversample) per medical group. Members are attributed to the provider group with the most offi ce visits during the measurement year. If no offi ce visit, members are attributed to the provider group of the practitioner who prescribed the antipsychotic or mood stabilizer medication.
Results*
Total eligible members 1,116Members sampled 653Members optimally managed 252
Members Optimally Managed 39.7% (± 4.7)
Behavioral health provider groupsTotal eligible members 517Members sampled 399Members optimally managed 119Members Optimally Managed 30.1% (± 4.8)
Non-behavioral health provider groupsTotal eligible members 599Members sampled 254Members optimally managed 133Members Optimally Managed 48.0% (± 7.8)
Completion Rate by Individual Component Behavioral Health Non-Behavioral Health Total
Tobacco Assessment 93.0% (± 2.6) 97.2% (± 2.9) 95.2% (± 2.0)
BMI Assessment (in 2013) 82.1% (± 3.8) 93.7% (± 4.0) 88.3% (± 2.8)
Alcohol Assessment (in 2013) 84.9% (± 3.5) 87.1% (± 5.4) 86.1% (± 3.3)
Blood Pressure (in 2013) 86.1% (± 3.4) 97.6% (± 2.4) 92.3% (± 2.1)
LDL Screening (in 2013) 42.1% (± 5.1) 62.4% (± 7.7) 53.0% (± 4.8)
Fasting Glucose or HbA1c [if diabetes] (in 2013) 51.6% (± 5.2) 67.3% (± 7.5) 60.0% (± 4.7)
* All rates are weighted by the eligible population of the provider groups displayed.

HealthPartners Clinical Indicators Report — 2013/2014 Results16
0% 10% 20% 30% 40% 50% 60% 70% 80% 90% 100%
Psych Recovery, Inc - BH
BHSI, LLC - BH
Nystrom & Associates, Ltd - BH
HealthPartners Clinics - BH
Associated Clinic of Psychology - BH
Average Group
Park Nicollet Health Services - BH
Allina Health - BH
HealthPartners Clinics - NBH
Allina Health - NBH
Park Nicollet Health Services - NBH
Fairview Clinics - NBH
Percent Reaching All Targets
Optimal Health Management for Severe Mental Illness1/1/2013 - 12/31/2013
Confidence Interval Finite population correction factor applied
BH - Behavioral Health Provider Group NBH - Non-Behavioral Health Provider Group

HealthPartners Clinical Indicators Report — 2013/2014 Results17
DIABETIC EYE EXAMJanuary 1, 2013 – December 31, 2013
DescriptionThe rate represents the percentage of members with diabetes (Type 1 and Type 2) who had a retinal eye exam per-formed in the measurement year.
Methodology — AdministrativeThis measure is consistent with the HEDIS 2014 Comprehensive Diabetes Care measurement specifi cations and includes members ages 18 to 75 years as of December 31, 2013, from all products who were continuously en-rolled from January 1, 2013 to December 31, 2013, and who had during the measurement year or year prior:
two or more encounters in an ambulatory or non-acute inpatient setting, • or;
one or more encounters in an acute inpatient or emergency room setting with a diagnosis of diabetes • or;
who were dispensed insulin or oral hypoglycemic prescriptions.•
Population identifi cation is based on pharmacy, claim and membership databases. Members are attributed to the provider group with the most offi ce visits for diabetic care in the measurement year.
Note: the health plan HEDIS rate refl ects a sample population and includes chart review while this is an adminis-trative measure that includes total eligible members.
Results
Total eligible members 22,945Members with eye exam 12,821
Diabetic Eye Exam Rate 55.9%

HealthPartners Clinical Indicators Report — 2013/2014 Results18
0% 10% 20% 30% 40% 50% 60% 70% 80% 90% 100%
Mayo Clinic Health System - Red Wing
University of MN Physicians
Mayo Health System Clinics MN
Average Group
MN Center for Obesity, Metabolism & Endocrinology, PA
Richfield Medical Group
HealthEast
Avera Health Clinics
Integrity - St. Cloud
Entira Family Clinics
Park Nicollet Health Services
Amery Regional Medical Center Clinics
Allina Health
North Clinic, PA
Lakeview Clinic, Ltd
North Memorial Health Care
Stillwater Medical Group
Burnsville Family Physicians, PA
Essentia Health - Innovis Health, LLC
CentraCare Clinics
Essentia Health - St. Joseph's Medical Center
St. Luke's Clinics
HealthPartners Clinics
Integrity - Northern
Mayo Clinic
Essentia Health - SMDC Health System
France Avenue Family Physicians, PA
Endocrinology Clinic of Minneapolis, PA
Winona Health Services
HealthPartners Central Minnesota Clinics, Inc
Percent with Eye Exam
Diabetic Eye Exam1/1/2013 - 12/31/2013
Part 1 of a 2 Part Graph

HealthPartners Clinical Indicators Report — 2013/2014 Results19
0% 10% 20% 30% 40% 50% 60% 70% 80% 90% 100%
Hutchinson Health
Mankato Clinic, Ltd
Osceola Medical Center
West Side Community Health Center
River Falls Medical Clinic
Unity Family Healthcare
New Richmond Clinic
Integrity - Buffalo
Altru Clinics
Gundersen Lutheran Clinics
St. Croix Regional Medical Center
Children's Health Care
Multicare Associates of the Twin Cities
Western Wisconsin Medical Associates, SC Clinics
Minnesota Rural Health Cooperative Clinics
Affiliated Community Medical Centers, PA
Open Cities Health Center
Apple Valley Medical Clinic, Ltd
Olmsted Medical Center Clinics
NorthPoint Health & Wellness Center
Northwest Family Physicians, PA
Sanford Health - Fargo
Fairview Clinics
Ridgeview Clinics
Hennepin County Medical Center
Hudson Physicians
Mayo Health System Clinics WI
United Family Medicine
Grand Itasca Clinic & Hospital
Percent with Eye Exam
Diabetic Eye Exam1/1/2013 - 12/31/2013
Part 2 of a 2 Part Graph

HealthPartners Clinical Indicators Report — 2013/2014 Results20
BODY MASS INDEX (BMI) January 1, 2013 – December 31, 2013
DescriptionThe rate represents the percent of enrolled members with a documented BMI value in the medical record (BMI Assessment) in the measurement year.
Methodology — HybridElements of this measure are consistent with the HEDIS 2014 Adult BMI assessment specifi cations. This measure includes members from all products and all ages three and older who were continuously enrolled from January 1, 2013 to December 31, 2013, who had a clinic visit in 2013. Population identifi cation is based on claim and membership databases. The sample includes members from the adult and child and adolescent preventive services measures.
BMI Assessment - Adult: the percentage of members ages 19 and older within the sample with a docu-mented BMI value in the medical record.
BMI Percentile Rate - Child and Adolescent: the percentage of members ages three to 18 within the sample with a BMI percentile or BMI plotted in the medical record, or for members ≥ age 16 with a docu-mented BMI in the medical record.
Results*
Total eligible members 314,641Members sampled - adult 5,277Members with documented BMI 4,752
BMI Assessment Rate - Adult 90.7% (± 1.9)
Total eligible members 105,392Members sampled - child and adolescent 4,758
Members with BMI percentile or BMI plotted 3,901
BMI Percentile Rate - Child and Adolescent 82.8% (± 2.5)
* All rates are weighted by the eligible population of the provider groups displayed.
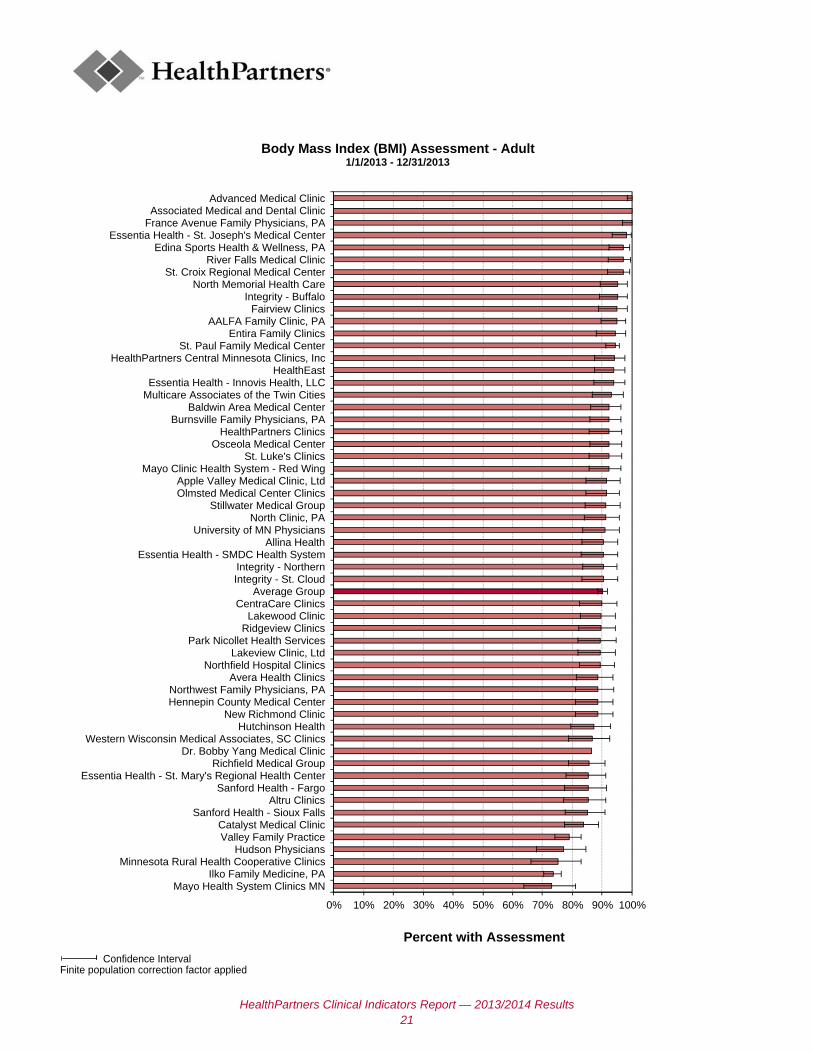
HealthPartners Clinical Indicators Report — 2013/2014 Results21
0% 10% 20% 30% 40% 50% 60% 70% 80% 90% 100%
Mayo Health System Clinics MNIlko Family Medicine, PA
Minnesota Rural Health Cooperative ClinicsHudson Physicians
Valley Family PracticeCatalyst Medical Clinic
Sanford Health - Sioux FallsAltru Clinics
Sanford Health - FargoEssentia Health - St. Mary's Regional Health Center
Richfield Medical GroupDr. Bobby Yang Medical Clinic
Western Wisconsin Medical Associates, SC ClinicsHutchinson Health
New Richmond ClinicHennepin County Medical CenterNorthwest Family Physicians, PA
Avera Health ClinicsNorthfield Hospital Clinics
Lakeview Clinic, LtdPark Nicollet Health Services
Ridgeview ClinicsLakewood Clinic
CentraCare ClinicsAverage Group
Integrity - St. CloudIntegrity - Northern
Essentia Health - SMDC Health SystemAllina Health
University of MN PhysiciansNorth Clinic, PA
Stillwater Medical GroupOlmsted Medical Center ClinicsApple Valley Medical Clinic, Ltd
Mayo Clinic Health System - Red WingSt. Luke's Clinics
Osceola Medical CenterHealthPartners Clinics
Burnsville Family Physicians, PABaldwin Area Medical Center
Multicare Associates of the Twin CitiesEssentia Health - Innovis Health, LLC
HealthEastHealthPartners Central Minnesota Clinics, Inc
St. Paul Family Medical CenterEntira Family Clinics
AALFA Family Clinic, PAFairview Clinics
Integrity - BuffaloNorth Memorial Health Care
St. Croix Regional Medical CenterRiver Falls Medical Clinic
Edina Sports Health & Wellness, PAEssentia Health - St. Joseph's Medical Center
France Avenue Family Physicians, PAAssociated Medical and Dental Clinic
Advanced Medical Clinic
Percent with Assessment
Body Mass Index (BMI) Assessment - Adult1/1/2013 - 12/31/2013
Confidence IntervalFinite population correction factor applied

HealthPartners Clinical Indicators Report — 2013/2014 Results22
0% 10% 20% 30% 40% 50% 60% 70% 80% 90% 100%
Lakewood ClinicIlko Family Medicine, PA
Sanford Health - FargoAltru Clinics
Mayo Health System Clinics MNAALFA Family Clinic, PA
Sanford Health - Sioux FallsEssentia Health - St. Mary's Regional Health Center
Minnesota Rural Health Cooperative ClinicsLakeview Clinic, Ltd
Northfield Hospital ClinicsCentraCare Clinics
Allina HealthPark Nicollet Health Services
Olmsted Medical Center ClinicsSouthdale Pediatric Associates, Ltd
Integrity - NorthernCatalyst Medical Clinic
New Richmond ClinicChildren's Physician Network
HealthPartners Central Minnesota Clinics, IncAverage Group
Stillwater Medical GroupSt. Paul Family Medical Center
Western Wisconsin Medical Associates, SC ClinicsRidgeview Clinics
Avera Health ClinicsHealthPartners Clinics
Essentia Health - Innovis Health, LLCAdvanced Medical Clinic
Hudson PhysiciansNorth Memorial Health Care
Northwest Family Physicians, PASt. Luke's Clinics
Essentia Health - St. Joseph's Medical CenterHealthEast
North Clinic, PAEssentia Health - SMDC Health SystemMayo Clinic Health System - Red Wing
Osceola Medical CenterEdina Sports Health & Wellness, PA
Hutchinson HealthRiver Falls Medical Clinic
Burnsville Family Physicians, PAEntira Family Clinics
Multicare Associates of the Twin CitiesBaldwin Area Medical Center
Hennepin County Medical CenterUniversity of MN Physicians
St. Croix Regional Medical CenterApple Valley Medical Clinic, Ltd
Integrity - St. CloudFairview Clinics
Dr. Bobby Yang Medical ClinicFrance Avenue Family Physicians, PA
Integrity - Buffalo
Percent with Assessment
Body Mass Index (BMI) Assessment - Child and Adolescent 1/1/2013 - 12/31/2013
Confidence IntervalFinite population correction factor applied

HealthPartners Clinical Indicators Report — 2013/2014 Results23
ALCOHOL ASSESSMENT — ADULT PRIMARY CAREJanuary 1, 2013 – December 31, 2013
DescriptionThe rate represents the percentage of members ages 19 and older by December 31, 2013, whose alcohol use status is documented in the medical record in the measurement year. Documentation of alcohol assessment must be dated and include the amount and frequency of alcohol use.
Methodology — Chart ReviewThis measure includes members from all products who were continuously enrolled from January 1, 2013 to December 31, 2013, who had a clinic visit in 2013. Population identifi cation is based on claim and membership databases. The sample includes members from the adult preventive services measure.
Results*
Total eligible members 309,947Members sampled 5,275Members with assessment 2,893
Alcohol Assessment Rate 65.0% (± 3.1)
* All rates are weighted by the eligible population of the provider groups displayed.

HealthPartners Clinical Indicators Report — 2013/2014 Results24
0% 10% 20% 30% 40% 50% 60% 70% 80% 90% 100%
Integrity - St. CloudLakeview Clinic, LtdIntegrity - Northern
Advanced Medical ClinicBaldwin Area Medical Center
Northfield Hospital ClinicsEdina Sports Health & Wellness, PA
Lakewood ClinicBurnsville Family Physicians, PAMayo Health System Clinics MN
Mayo Clinic Health System - Red WingRichfield Medical Group
North Clinic, PANorthwest Family Physicians, PA
Essentia Health - St. Mary's Regional Health CenterCentraCare Clinics
Ridgeview ClinicsHutchinson Health
Avera Health ClinicsEssentia Health - Innovis Health, LLC
Apple Valley Medical Clinic, LtdIntegrity - Buffalo
Altru ClinicsRiver Falls Medical Clinic
Essentia Health - St. Joseph's Medical CenterEntira Family Clinics
Minnesota Rural Health Cooperative ClinicsFrance Avenue Family Physicians, PA
St. Croix Regional Medical CenterHennepin County Medical Center
St. Luke's ClinicsWestern Wisconsin Medical Associates, SC Clinics
Hudson PhysiciansAverage Group
Stillwater Medical GroupEssentia Health - SMDC Health System
HealthEastMulticare Associates of the Twin Cities
New Richmond ClinicOlmsted Medical Center Clinics
Allina HealthDr. Bobby Yang Medical Clinic
North Memorial Health CareHealthPartners Clinics
Sanford Health - FargoUniversity of MN Physicians
Osceola Medical CenterFairview Clinics
HealthPartners Central Minnesota Clinics, IncIlko Family Medicine, PA
Park Nicollet Health ServicesValley Family Practice
St. Paul Family Medical CenterAssociated Medical and Dental Clinic
Sanford Health - Sioux FallsCatalyst Medical Clinic
AALFA Family Clinic, PA
Percent with Assessment
Alcohol Assessment - Adult - Primary Care 1/1/2013 - 12/31/2013
Confidence IntervalFinite population correction factor applied

HealthPartners Clinical Indicators Report — 2013/2014 Results25
ALCOHOL ASSESSMENT — ADULT OB/GYNJanuary 1, 2013 – December 31, 2013
DescriptionThe rate represents the percentage of women ages 19 and older by December 31, 2013, whose alcohol use status is documented in the medical record in the measurement year. Documentation of alcohol assessment must be dated and include the amount and frequency of alcohol use.
Methodology — Chart ReviewThis measure includes women from all products who were continuously enrolled from January 1, 2013 to December 31, 2013, who had a clinic visit in 2013. Population identifi cation is based on claim and membership databases. The sample includes members from the OB/GYN preventive services measure.
Results*
Total eligible members 60,685Members sampled 2,092Members with assessment 1465
Alcohol Assessment Rate 77.1% (± 3.0)
* All rates are weighted by the eligible population of the provider groups displayed.

HealthPartners Clinical Indicators Report — 2013/2014 Results26
0% 10% 20% 30% 40% 50% 60% 70% 80% 90% 100%
Essentia Health - SMDC Health System
CentraCare Clinics
Mayo Clinic
Comprehensive Healthcare for Women, PA
Integrity - Buffalo
Multicare Associates of the Twin Cities
St. Luke's Clinics
North Clinic, PA
Mayo Health System Clinics MN
John A. Haugen Associates, PA
Average Group
Ridgeview Clinics
Stillwater Medical Group
Allina Health
Adefris & Toppin Women's Specialists, MD, PC
HealthPartners Clinics
Fairview Clinics
Clinic Sofia OB/GYN, PA
HealthPartners Central Minnesota Clinics, Inc
HealthEast
Mankato Clinic, Ltd
Premier ObGyn of Minnesota
Obstetrics and Gynecology Associates
University of MN Physicians
Minnesota Gynecology and Surgery, LLC
Park Nicollet Health Services
Paul Larson OB/GYN Clinic, PA
Percent with Assessment
Alcohol Assessment - Adult - OB/GYN Providers1/1/2013 - 12/31/2013
Confidence IntervalFinite population correction factor applied
HealthPartners Clinical Indicators Report — 2013/2014 Results27
OPTIMAL LIFESTYLE — ADULTS2013 Member Survey
DescriptionThe rate represents the percent of surveyed members who reported adherence with all components of an optimal lifestyle: physical activity, healthy eating, moderate alcohol consumption and non-tobacco use during the past year. Alcohol consumption is excluded from optimal lifestyle calculations for respondents < 21 years old.
Optimal lifestyle is defi ned as:• Physical activity for a total of 30 minutes throughout the day for four or more days a week• Healthy eating of fi ve or more fruits and vegetables in a typical day• Female respondents who reported consuming seven servings or less of alcohol per week; male respon-
dents who reported consuming 14 servings or less of alcohol per week• Non-tobacco use
Methodology — Member SurveyOptimal lifestyle status was determined through a mail survey conducted by HealthPartners in November andDecember 2013. Results were distributed to provider groups second quarter, 2014. The measures include a ran-dom sample of commercial members ages 18 years and older from 38 primary care medical groups. The data were weighted to equal sample sizes of 200 for adults and to control for self-reported health status. Members are attrib-uted to the primary care provider group with the most offi ce visits during the measurement year.
Survey Questions1. Do you do physical activities such as brisk walking, bicycling or gardening for a total of 30 minutes through-
out the day for four or more days a week? 2. How many servings of fruits and vegetables do you eat in a typical day?3. On average, how many alcoholic beverages do you drink in a week?4. During the past year, have you used tobacco products such as cigarettes, cigars, pipes, snuff or chewing
tobacco?
Results*
Total members completing survey 7,152Members with all optimal lifestyles 563
Optimal Lifestyle Rate 7.5% (± 0.6)
Rate by ComponentPhysical activity 67.4% (± 1.1)Healthy eating 10.7% (± 0.7)Moderate alcohol use 96.4% (± 0.4)Non-tobacco use1 91.0% (± 0.7)
1 Derived from tobacco prevalence member survey rates. Graphic display of medical group tobacco prevalence included in Tobacco Use and Cessation section.* All rates are weighted using graphically displayed provider group populations.

HealthPartners Clinical Indicators Report — 2013/2014 Results28
0% 10% 20% 30% 40% 50% 60% 70% 80% 90% 100%
Apple Valley Medical Clinic, Ltd
Essentia Health - Innovis Health, LLC
Mayo Health System Clinics WI
Minnesota Rural Health Cooperative Clinics
Essentia Health - St. Joseph's Medical Center
Multicare Associates of the Twin Cities
Lakeview Clinic, Ltd
CentraCare Clinics
North Memorial Health Care
Allina Health
Affiliated Community Medical Centers, PA
Olmsted Medical Center Clinics
Entira Family Clinics
Amery Regional Medical Center Clinics
Mayo Health System Clinics MN
Hutchinson Medical Center, PA
Sanford Health - Fargo
Integrity - St. Cloud
Average Group
University of MN Physicians
St. Croix Regional Medical Center
Integrity - Buffalo
Mayo Clinic
HealthPartners Clinics
Essentia Health
Northwest Family Physicians, PA
Stillwater Medical Group
New Richmond Clinic
Altru Clinics
HealthPartners Central Minnesota Clinics, Inc
HealthEast
Western Wisconsin Medical Associates, SC Clinics
Ridgeview Clinics
Fairview Clinics
Park Nicollet Health Services
Mayo Clinic Health System - Red Wing
North Clinic, PA
St. Luke's Clinics
Essentia Health - St. Mary's Regional Health Center
Percent Reaching All Targets----- 2013 Goal (Silver 18%, Gold 20%)
Optimal Lifestyle - Adult 2013 Member Survey
Confidence Interval

HealthPartners Clinical Indicators Report — 2013/2014 Results29
0% 10% 20% 30% 40% 50% 60% 70% 80% 90% 100%
Multicare Associates of the Twin Cities
Essentia Health
Affiliated Community Medical Centers, PA
Minnesota Rural Health Cooperative Clinics
Integrity - St. Cloud
Sanford Health - Fargo
Olmsted Medical Center Clinics
Allina Health
CentraCare Clinics
Ridgeview Clinics
Lakeview Clinic, Ltd
Hutchinson Medical Center, PA
St. Croix Regional Medical Center
Mayo Health System Clinics WI
Mayo Health System Clinics MN
Essentia Health - Innovis Health, LLC
Northwest Family Physicians, PA
Integrity - Buffalo
HealthPartners Clinics
Amery Regional Medical Center Clinics
Average Group
Essentia Health - St. Joseph's Medical Center
New Richmond Clinic
Mayo Clinic Health System - Red Wing
HealthPartners Central Minnesota Clinics, Inc
Park Nicollet Health Services
Fairview Clinics
Apple Valley Medical Clinic, Ltd
Entira Family Clinics
North Memorial Health Care
Stillwater Medical Group
Altru Clinics
HealthEast
Western Wisconsin Medical Associates, SC Clinics
Mayo Clinic
North Clinic, PA
University of MN Physicians
St. Luke's Clinics
Essentia Health - St. Mary's Regional Health Center
Percent Physically Active
Optimal Lifestyle - Adult - Physical Activity 2013 Member Survey
Confidence Interval
HealthPartners Clinical Indicators Report — 2013/2014 Results30
0% 10% 20% 30% 40% 50% 60% 70% 80% 90% 100%
Minnesota Rural Health Cooperative Clinics
Multicare Associates of the Twin Cities
CentraCare Clinics
Apple Valley Medical Clinic, Ltd
Essentia Health - Innovis Health, LLC
Lakeview Clinic, Ltd
Amery Regional Medical Center Clinics
Mayo Health System Clinics WI
Entira Family Clinics
North Memorial Health Care
Affiliated Community Medical Centers, PA
Integrity - St. Cloud
Essentia Health - St. Joseph's Medical Center
Olmsted Medical Center Clinics
Mayo Health System Clinics MN
Hutchinson Medical Center, PA
Sanford Health - Fargo
Allina Health
Altru Clinics
Integrity - Buffalo
St. Croix Regional Medical Center
Mayo Clinic
Average Group
Western Wisconsin Medical Associates, SC Clinics
HealthPartners Central Minnesota Clinics, Inc
Essentia Health
New Richmond Clinic
Northwest Family Physicians, PA
HealthEast
HealthPartners Clinics
North Clinic, PA
University of MN Physicians
Stillwater Medical Group
Mayo Clinic Health System - Red Wing
Ridgeview Clinics
Fairview Clinics
Essentia Health - St. Mary's Regional Health Center
St. Luke's Clinics
Park Nicollet Health Services
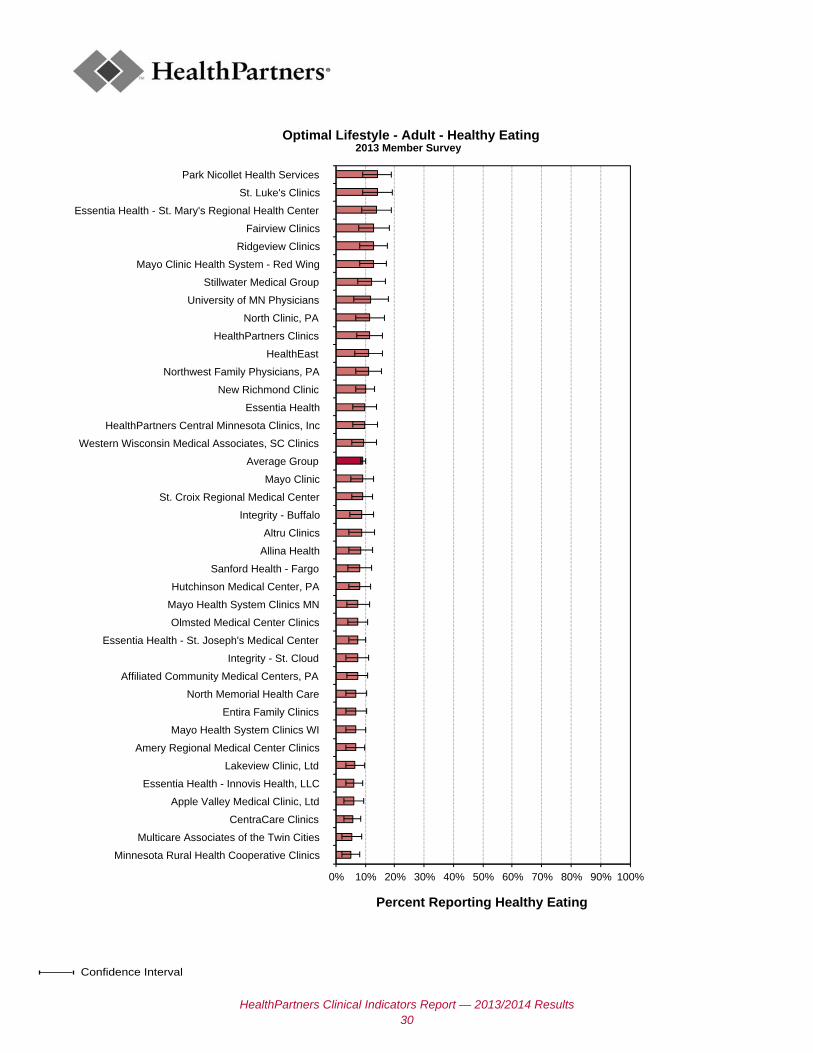
Percent Reporting Healthy Eating
Optimal Lifestyle - Adult - Healthy Eating 2013 Member Survey
Confidence Interval

HealthPartners Clinical Indicators Report — 2013/2014 Results31
0% 10% 20% 30% 40% 50% 60% 70% 80% 90% 100%
Fairview Clinics
Essentia Health - St. Mary's Regional Health Center
Mayo Clinic Health System - Red Wing
Essentia Health - St. Joseph's Medical Center
Apple Valley Medical Clinic, Ltd
University of MN Physicians
Western Wisconsin Medical Associates, SC Clinics
CentraCare Clinics
Ridgeview Clinics
Mayo Health System Clinics MN
Amery Regional Medical Center Clinics
Hutchinson Medical Center, PA
Park Nicollet Health Services
Mayo Health System Clinics WI
Altru Clinics
Northwest Family Physicians, PA
Lakeview Clinic, Ltd
Stillwater Medical Group
Average Group
St. Croix Regional Medical Center
Multicare Associates of the Twin Cities
New Richmond Clinic
North Memorial Health Care
Integrity - St. Cloud
Essentia Health
St. Luke's Clinics
Olmsted Medical Center Clinics
HealthPartners Clinics
Mayo Clinic
Entira Family Clinics
North Clinic, PA
Sanford Health - Fargo
Minnesota Rural Health Cooperative Clinics
Affiliated Community Medical Centers, PA
HealthEast
Essentia Health - Innovis Health, LLC
HealthPartners Central Minnesota Clinics, Inc
Allina Health
Integrity - Buffalo
Percent Moderate to No Use
Optimal Lifestyle - Adult - Reporting Moderate to No Alcohol Use 2013 Member Survey
Confidence Interval

HealthPartners Clinical Indicators Report — 2013/2014 Results32
OPTIMAL LIFESTYLE — CHILDREN2013 Member Survey
DescriptionThe rate represents the percent of surveyed members who reported adherence with all components of an optimal lifestyle: physical activity, healthy eating and secondhand tobacco exposure during the past year.
Optimal lifestyle is defi ned as:• Physical activity for a total of 30 minutes throughout the day for four or more days a week• Healthy eating of fi ve or more fruits and vegetables in a typical day• No exposure to secondhand smoke
Methodology — Member SurveyOptimal lifestyle status was determined through a mail survey conducted by HealthPartners in November andDecember 2013. Results were distributed to provider groups second quarter, 2014. The measures include a ran-dom sample of commercial members ages 17 years and younger from 21 primary care medical groups. For the children’s survey, the adult most knowledgeable about the child’s medical care was asked to complete the survey. The data were weighted to equal sample sizes of 100 for children and to control for self-reported health status. Members are attributed to the primary care provider group with the most offi ce visits during the measurement year.
Survey Questions Is your child physically active for a total of 30 minutes throughout the day for four or more days a week? 1. How many servings of fruits and vegetables does your child eat in a typical day?2. During the past year, have any of your children been exposed to secondhand smoke at home or in day c3. are?
Results*
Total members completing survey 2,019Members with all optimal lifestyles 221
Optimal Lifestyle Rate 10.9% (± 1.4)
Rate by Service
Physical activity 95.5% (± 0.9)Healthy eating 10.5% (± 1.3)No exposure to secondhand smoke 1 96.8% (± 0.8)
1 Derived from secondhand smoke exposure member survey rates. Graphic display of medical group secondhand smoke exposure is included in Tobacco Use and Cessation section.* All rates are weighted by the eligible population of the provider groups displayed.

HealthPartners Clinical Indicators Report — 2013/2014 Results33
0% 10% 20% 30% 40% 50% 60% 70% 80% 90% 100%
Park Nicollet Health Services
Western Wisconsin Medical Associates, SC Clinics
Lakeview Clinic, Ltd
Southdale Pediatric Associates, Ltd
HealthPartners Central Minnesota Clinics, Inc
North Memorial Health Care
St. Luke's Clinics
Affiliated Community Medical Centers, PA
HealthEast
Minnesota Rural Health Cooperative Clinics
Average Group
Children's Physician Network
Stillwater Medical Group
Essentia Health - St. Mary's Regional Health Center
Allina Health
Fairview Clinics
HealthPartners Clinics
CentraCare Clinics
Entira Family Clinics
Integrity - Buffalo
Mayo Health System Clinics MN
Sanford Health - Fargo
Percent Reaching All Targets
Optimal Lifestyle - Children 2013 Member Survey
Confidence Interval

HealthPartners Clinical Indicators Report — 2013/2014 Results34
0% 10% 20% 30% 40% 50% 60% 70% 80% 90% 100%
HealthPartners Central Minnesota Clinics, Inc
Park Nicollet Health Services
Children's Physician Network
Lakeview Clinic, Ltd
CentraCare Clinics
Southdale Pediatric Associates, Ltd
HealthPartners Clinics
HealthEast
Stillwater Medical Group
Allina Health
Essentia Health - St. Mary's Regional Health Center
Average Group
Minnesota Rural Health Cooperative Clinics
St. Luke's Clinics
North Memorial Health Care
Entira Family Clinics
Sanford Health - Fargo
Western Wisconsin Medical Associates, SC Clinics
Integrity - Buffalo
Mayo Health System Clinics MN
Fairview Clinics
Affiliated Community Medical Centers, PA
Percent Physically Active
Optimal Lifestyle - Children - Physical Activity 2013 Member Survey
Confidence Interval

HealthPartners Clinical Indicators Report — 2013/2014 Results35
0% 10% 20% 30% 40% 50% 60% 70% 80% 90% 100%
Affiliated Community Medical Centers, PA
HealthPartners Central Minnesota Clinics, Inc
Essentia Health - St. Mary's Regional Health Center
Entira Family Clinics
North Memorial Health Care
Allina Health
Fairview Clinics
Western Wisconsin Medical Associates, SC Clinics
CentraCare Clinics
Average Group
Sanford Health - Fargo
Integrity - Buffalo
Southdale Pediatric Associates, Ltd
Minnesota Rural Health Cooperative Clinics
Children's Physician Network
Mayo Health System Clinics MN
Park Nicollet Health Services
Stillwater Medical Group
HealthEast
Lakeview Clinic, Ltd
HealthPartners Clinics
St. Luke's Clinics
Percent Reporting Healthy Eating
Optimal Lifestyle - Children - Healthy Eating 2013 Member Survey
Confidence Interval

HealthPartners Clinical Indicators Report — 2013/2014 Results36
GENERIC DRUG USE — PRIMARY CAREJanuary 1, 2014 – June 30, 2014
DescriptionThe rate represents the percentage of all prescriptions fi lled with generic drugs for HealthPartners members with a drug benefi t.
Methodology — AdministrativeThis measure includes all prescriptions for members with a drug benefi t fi lled between January 1, 2014 and June 30, 2014, whose prescription was fi lled with a generic drug. This rate is calculated with pharmacy claims data. Members are attributed to the primary provider group of the prescribing physician.
Results*
Total prescriptions 3,169,137Generic drug prescriptions 2,810,527
Generic Drug Use Rate 88.7%
* Results include all prescriptions regardless of prescribing physician specialty. Results from medical groups who are current or anticipated HealthPartners Partners in Excellence (PIE) participants are graphically displayed.

HealthPartners Clinical Indicators Report — 2013/2014 Results37
0% 10% 20% 30% 40% 50% 60% 70% 80% 90% 100%
CentraCare Clinics
Hudson Physicians
Apple Valley Medical Clinic, Ltd
Baldwin Area Medical Center
Minnesota Rural Health Cooperative Clinics
River Falls Medical Clinic
HealthPartners Clinics
Allina Health
Western Wisconsin Medical Associates, SC Clinics
Northwest Family Physicians, PA
Multicare Associates of the Twin Cities
HealthEast
Ridgeview Clinics
Integrity - Buffalo
North Clinic, PA
Sanford - Bismarck
Lakeview Clinic, Ltd
Olmsted Medical Center Clinics
Integrity - St. Cloud
Hutchinson Health
Avera Health Clinics
Richfield Medical Group
Northfield Hospital Clinics
Mayo Health System Clinics MN
HealthPartners Central Minnesota Clinics, Inc
New Richmond Clinic
Burnsville Family Physicians, PA
Essentia Health - St. Mary's Regional Health Center
Essentia Health - St. Joseph's Medical Center
Catalyst Medical Clinic
Percent Generic Drug Use------- 2014 Goals - Primary Care (Silver 91%, Gold 93%)
2014 Goals - Pediatrics (Silver 88%, Gold 90%)
Generic Drug Use - Primary Care 1/1/2014 - 6/30/2014
Part 1 of a 2 Part Graph

HealthPartners Clinical Indicators Report — 2013/2014 Results38
0% 10% 20% 30% 40% 50% 60% 70% 80% 90% 100%
Dr. Bobby Yang Medical Clinic
Ilko Family Medicine, PA
Lakewood Clinic
St. Paul Family Medical Center
AALFA Family Clinic, PA
Southdale Pediatric Associates, Ltd
University of MN Physicians
Altru Clinics
Valley Family Practice
St. Croix Regional Medical Center
Hennepin County Medical Center
Children's Physician Network
Advanced Medical Clinic
France Avenue Family Physicians, PA
Sanford Health - Sioux Falls
Edina Sports Health & Wellness, PA
St. Luke's Clinics
Essentia Health - SMDC Health System
Entira Family Clinics
Essentia Health - Innovis Health, LLC
Associated Medical and Dental Clinic
Osceola Medical Center
Stillwater Medical Group
Sanford Health - Fargo
Average Group
North Memorial Health Care
Mayo Clinic Health System - Red Wing
Integrity - Northern
Park Nicollet Health Services
Fairview Clinics
Percent Generic Drug Use------- 2014 Goals - Primary Care (Silver 91%, Gold 93%)
2014 Goals - Pediatrics (Silver 88%, Gold 90%)
Generic Drug Use - Primary Care 1/1/2014 - 6/30/2014
Part 2 of a 2 Part Graph

HealthPartners Clinical Indicators Report — 2013/2014 Results39
GENERIC DRUG USE — SPECIALTY CAREJanuary 1, 2014 – June 30, 2014
DescriptionThe rate represents the percentage of all prescriptions fi lled with generic drugs for HealthPartners members with a drug benefi t.
Methodology — AdministrativeThis measure includes all prescriptions for members with a drug benefi t fi lled between January 1, 2014 and June 30, 2014, whose prescription was fi lled with a generic drug. This rate is calculated with pharmacy claims data. Members are attributed to the specialty provider group of the prescribing physician.
Results*
Behavioral HealthTotal prescriptions 90,347Generic drug prescriptions 87,854
Behavioral Health Generic Drug Use Rate 97.2%
CardiologyTotal prescriptions 114,897Generic drug prescriptions 104,752
Cardiology Generic Drug Use Rate 91.2%
OB/GYNTotal prescriptions 211,803Generic drug prescriptions 184,991
OB/GYN Generic Drug Use Rate 87.3%
OrthopaedicsTotal prescriptions 30,516Generic drug prescriptions 28,814
Orthopaedics Generic Drug Use Rate 94.4%
* Results include all prescriptions from applicable provider specialties. Results from medical groups who are current or anticipated HealthPartners Partners in Excellence (PIE) participants are graphically displayed.

HealthPartners Clinical Indicators Report — 2013/2014 Results40
0% 10% 20% 30% 40% 50% 60% 70% 80% 90% 100%Hennepin County Human Services & Public Health Dept
Juliette Petersen, MD
Innovative Psychological Consultants
Canvas Health, Inc
Oak Ridge Center, PLLC
HealthPartners Clinics
Essentia Health - SMDC Health System
Lakeland Mental Health Center, Inc
Hutchinson Health
Mayo Health System Clinics MN
PrairieCare Medical Group
Park Nicollet Health Services
Hazelden Foundation
Psych Business Services, Ltd
Central Minnesota Mental Health Center
Kevin A. O'Connor, MD
Hennepin County Medical Center
Family Life Mental Health Center
The Calli Institute, LLC
Clinical Psychopharmacology Consultants, PA
The Emily Program
University of MN Physicians
Mental Health Counseling Services, LLC
Gundersen Lutheran Clinics
Paul T. Richardson, MD LLC
People Incorporated
Mayo Clinic
Washburn Center For Children
Sanford Health - Fargo
Ramsey County Mental Health Center
Mankato Clinic, Ltd
HealthEast
David L. Sudduth, MD
Percent Generic Drug Use------- 2014 Goal (Silver 92%, Gold 94%)
Medical Groups with <200 prescriptions are not displayed
Generic Drug Use - Behavioral Health Providers 1/1/2014 - 6/30/2014
Part 1 of a 2 Part Graph
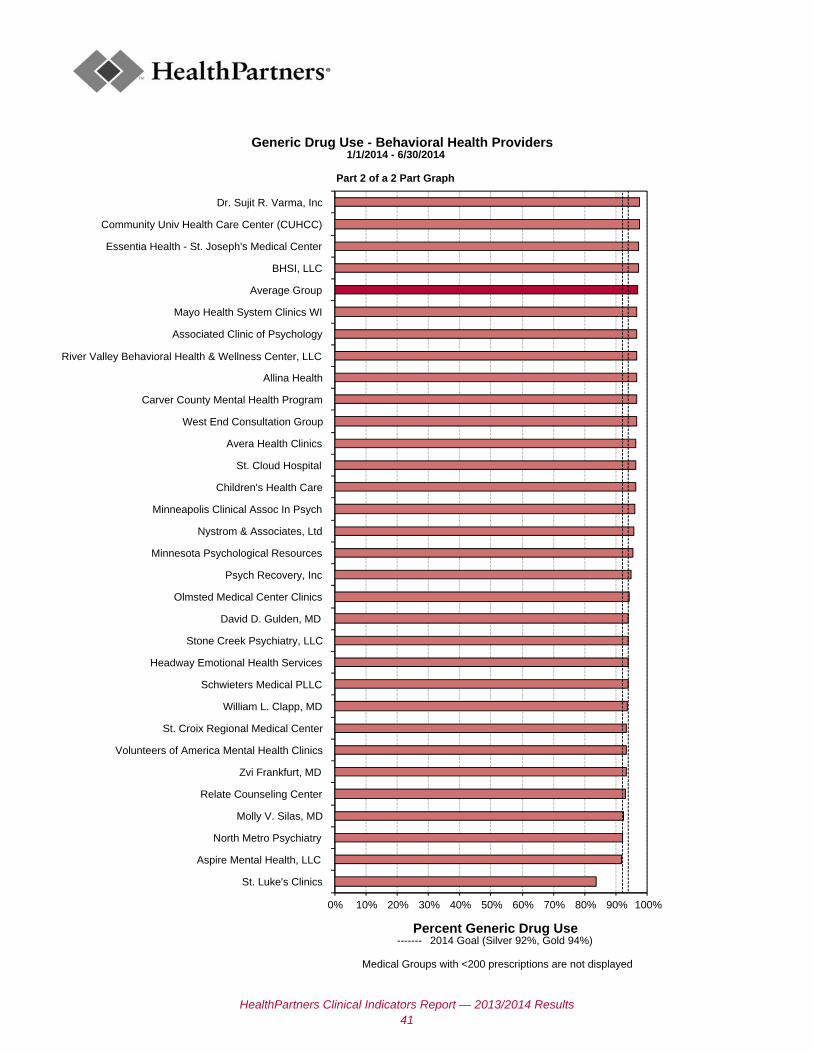
HealthPartners Clinical Indicators Report — 2013/2014 Results41
0% 10% 20% 30% 40% 50% 60% 70% 80% 90% 100%
St. Luke's Clinics
Aspire Mental Health, LLC
North Metro Psychiatry
Molly V. Silas, MD
Relate Counseling Center
Zvi Frankfurt, MD
Volunteers of America Mental Health Clinics
St. Croix Regional Medical Center
William L. Clapp, MD
Schwieters Medical PLLC
Headway Emotional Health Services
Stone Creek Psychiatry, LLC
David D. Gulden, MD
Olmsted Medical Center Clinics
Psych Recovery, Inc
Minnesota Psychological Resources
Nystrom & Associates, Ltd
Minneapolis Clinical Assoc In Psych
Children's Health Care
St. Cloud Hospital
Avera Health Clinics
West End Consultation Group
Carver County Mental Health Program
Allina Health
River Valley Behavioral Health & Wellness Center, LLC
Associated Clinic of Psychology
Mayo Health System Clinics WI
Average Group
BHSI, LLC
Essentia Health - St. Joseph's Medical Center
Community Univ Health Care Center (CUHCC)
Dr. Sujit R. Varma, Inc
Percent Generic Drug Use------- 2014 Goal (Silver 92%, Gold 94%)
Medical Groups with <200 prescriptions are not displayed
Generic Drug Use - Behavioral Health Providers 1/1/2014 - 6/30/2014
Part 2 of a 2 Part Graph

HealthPartners Clinical Indicators Report — 2013/2014 Results42
0% 10% 20% 30% 40% 50% 60% 70% 80% 90% 100%
PrimeCare Health Group
Murad Heart Care
OakLeaf Medical Network
The Heart Institute of North Dakota
St. Luke's Clinics
Avera Health Hospitals
Mark W. Erhard, MD, PA
Sanford Health - Sioux Falls
Essentia Health - SMDC Health System
Mayo Clinic
Allina Health
University of MN Physicians Heart at Fairview
HealthEast Heart Care
Sanford Health - Fargo
Mayo Clinic Health System - Red Wing
Average Group
Altru Clinics
Mayo Health System Clinics MN
David G. Fine, MD
Park Nicollet Health Services
HealthPartners Clinics
Stillwater Medical Group
Hennepin County Medical Center
North Memorial Health Care
Mayo Health System Clinics WI
CentraCare Clinics
Gundersen Lutheran Clinics
Aspirus Network, Inc
Preventive Cardiology Consultants, PA
Children's Heart Clinic, PA
Essentia Health - Innovis Health, LLC
Lyle J. Swenson, MD, PA
Essentia Health - St. Joseph's Medical Center
North Memorial Cardiolvascular Services
Olmsted Medical Center Clinics
Prairie Lakes Health Care System
Mankato Clinic, Ltd
Percent Generic Drug Use
Generic Drug Use - Cardiology Providers 1/1/2014-6/30/2014

Technical Supplement to HealthPartners Clinical Indicators Report — 2013/2014 Results48
0% 10% 20% 30% 40% 50% 60% 70% 80% 90% 100%
Northfield Hospital Clinics
Winona Health Services
Hennepin County Medical Center
Lakeview Clinic, Ltd
Fairview Clinics
Ridgeview Clinics
Douglas County Hospital
Unity Family Healthcare
Comprehensive Healthcare for Women, PA
Affiliated Community Medical Centers, PA
Mayo Health System Clinics MN
Sanford Health - Fargo
CentraCare Clinics
Essentia Health - Brainerd Medical Center, Inc.
Integrity - St. Cloud
Sanford Health - Sioux Falls
Gundersen Lutheran Clinics
Olmsted Medical Center Clinics
North Clinic, PA
HealthEast
Integrity - Northern
Multicare Associates of the Twin Cities
Western Wisconsin Medical Associates, SC Clinics
Adefris & Toppin Women's Specialists, MD, PC
Hutchinson Health
Essentia Health - St. Mary's Regional Health Center
New Richmond Clinic
Minnesota Rural Health Cooperative Clinics
Lake Region Hospital
Children's Physician Network
FirstLight Health System
Integrity - Buffalo
Avera Health Clinics
Percent Generic Drug Use-----2014 Goal (Silver 88%, Gold 90%)
Medical Groups w ith <200 prescriptions are not displayed.
Generic Drug Use - OB/GYN Providers 1/1/2014 - 6/30/2014
Part 1 of a 2 Part Graph
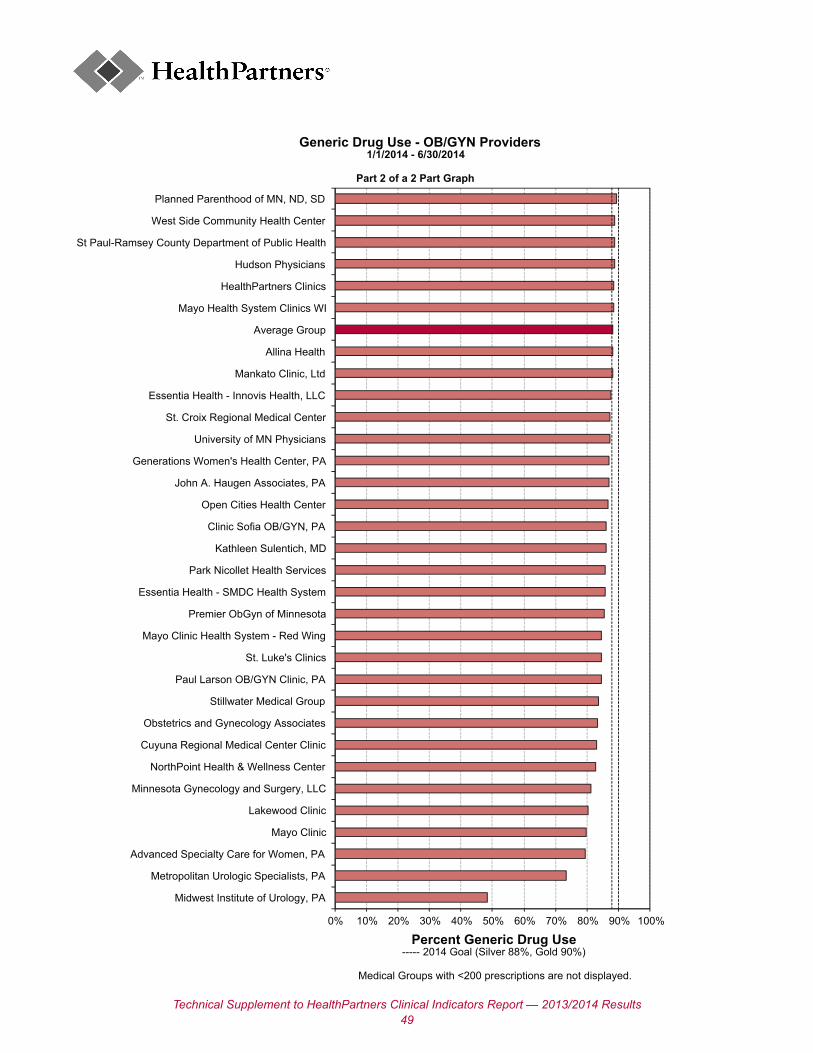
Technical Supplement to HealthPartners Clinical Indicators Report — 2013/2014 Results49
0% 10% 20% 30% 40% 50% 60% 70% 80% 90% 100%
Midwest Institute of Urology, PA
Metropolitan Urologic Specialists, PA
Advanced Specialty Care for Women, PA
Mayo Clinic
Lakewood Clinic
Minnesota Gynecology and Surgery, LLC
NorthPoint Health & Wellness Center
Cuyuna Regional Medical Center Clinic
Obstetrics and Gynecology Associates
Stillwater Medical Group
Paul Larson OB/GYN Clinic, PA
St. Luke's Clinics
Mayo Clinic Health System - Red Wing
Premier ObGyn of Minnesota
Essentia Health - SMDC Health System
Park Nicollet Health Services
Kathleen Sulentich, MD
Clinic Sofia OB/GYN, PA
Open Cities Health Center
John A. Haugen Associates, PA
Generations Women's Health Center, PA
University of MN Physicians
St. Croix Regional Medical Center
Essentia Health - Innovis Health, LLC
Mankato Clinic, Ltd
Allina Health
Average Group
Mayo Health System Clinics WI
HealthPartners Clinics
Hudson Physicians
St Paul-Ramsey County Department of Public Health
West Side Community Health Center
Planned Parenthood of MN, ND, SD
Percent Generic Drug Use----- 2014 Goal (Silver 88%, Gold 90%)
Medical Groups with <200 prescriptions are not displayed.
Generic Drug Use - OB/GYN Providers 1/1/2014 - 6/30/2014
Part 2 of a 2 Part Graph

HealthPartners Clinical Indicators Report — 2013/2014 Results45
0% 10% 20% 30% 40% 50% 60% 70% 80% 90% 100%
Essentia Health - Innovis Health, LLC
Mayo Clinic
Douglas County Hospital
Unity Family Healthcare
Twin Cities Orthopedics, PA
Institute for Low Back and Neck Care
Allina Health
Park Nicollet Health Services
St. Croix Orthopaedics, PA
Midwest Spine Institute, LLC
St. Croix Regional Medical Center
Average Group
Mayo Health System Clinics WI
Gundersen Lutheran Clinics
St. Cloud Orthopedic Associates, Ltd
OakLeaf Medical Network
Advanced Spine Associates, PA
Summit Orthopedics, Ltd
Integrity - Northern
Orthopaedic & Fracture Clinic, PA
Mayo Health System Clinics MN
University of MN Physicians
HealthPartners Clinics
Essentia Health - SMDC Health System
Sanford Health - Fargo
Fairview Clinics
Mayo Clinic Health System - Red Wing
Northern Orthopedics, Ltd
Hennepin County Medical Center
Percent Generic Drug Use
Medical Groups with <100 prescriptions are not displayed.
Generic Drug Use - Orthopaedic Providers 1/1/2014 - 6/30/2014

HealthPartners Clinical Indicators Report — 2013/2014 Results46
GENERIC DRUG USE — PHARMACYJanuary 1, 2014 – June 30, 2014
DescriptionThe rate represents the percentage of all prescriptions fi lled with generic drugs for HealthPartners members with a drug benefi t.
Methodology — AdministrativeThis measure includes all prescriptions for members with a drug benefi t fi lled between January 1, 2014 and June 30, 2014, whose prescription was fi lled with a generic drug. This rate is calculated with pharmacy claims data. Each prescription is attributed to the pharmacy that fi lled the prescription.
Results
Total prescriptions 5,219,199Generic drug prescriptions 4,549,117
Generic Drug Use Rate 87.2%

HealthPartners Clinical Indicators Report — 2013/2014 Results47
0% 10% 20% 30% 40% 50% 60% 70% 80% 90% 100%
Essentia Health - SMDC Health System
HealthPartners Mail Order Pharmacy
Setzer Pharmacy
Mattson Pharmacy
Fairview Clinics
Park Nicollet Health Services
St. Paul Corner Drug
Walgreens
Lunds and Byerly's
CVS Pharmacy
SuperValu/Cub
Kmart
HealthPartners Clinics
Average Pharmacy
Shopko
Target
Thrifty Drug Stores
Regions Hospital
Coborn's/Cash Wise
Wal-Mart/Sam’s Club
The Medicine Shoppe
Costco
HealthPartners Central Minnesota Clinics, Inc
Allina Health
Goodrich Pharmacy
Boynton Health Service Pharmacy
Percent Generic Drug Use----- 2014 Goal (Silver 89%, Gold 91%)
Generic Drug Use - Pharmacy 1/1/2014 - 6/30/2014

HealthPartners Clinical Indicators Report — 2013/2014 Results48
ANNUAL MONITORING FOR PATIENTS ON PERSISTENT MEDICATIONS PRIMARY CAREJanuary 1, 2013 – December 31, 2013
DescriptionThe percentage of members ages 18 and older who received at least a 180-day supply of ambulatory medication therapy for Angiotensin Converting Enzyme (ACE) inhibitors, Angiotensin Receptor Blockers (ARB) and/or diuretics during the measurement year and had at least one therapeutic monitoring event for the therapeutic agent in the measurement year.
A therapeutic monitoring event is defi ned as:
• At least one serum potassium (K+) and either a serum creatinine (SCr) or a blood urea nitrogen (BUN) for prescribed ACE inhibitors, ARBs and/or diuretics.
Methodology — AdministrativeThis measure is consistent with the HEDIS 2014 Annual Monitoring for Patients on Persistent Medications measurement specifi cations and includes all members ages 18 years and older as of December 31, 2013, from all products except Medicare Cost with a drug benefi t who were continuously enrolled from January 1, 2013 to December 31, 2013. Population identifi cation is based on claim and membership databases. Rates are calculated using administrative data only. Members are attributed to the medical group of the prescribing provider’s pri-mary location of the most recent script that qualifi ed the member for the denominator. Only scripts written by a provider with a primary care specialty are included; however, therapeutic monitoring claims from all providers are included.
Results
ACE/ARB monitoringTotal eligible members 20,737Members with monitoring event 17,702
Annual Monitoring Rate 85.4%
Diuretics monitoringTotal eligible members 16,664Members with monitoring event 14,235
Annual Monitoring Rate 85.4%

HealthPartners Clinical Indicators Report — 2013/2014 Results49
0% 10% 20% 30% 40% 50% 60% 70% 80% 90% 100%
Sanford Health - Sioux Falls
Mayo Health System Clinics WI
Amery Regional Medical Center Clinics
West Side Community Health Center
New Richmond Clinic
Allina Health
Burnsville Family Physicians, PA
Ridgeview Clinics
Essentia Health - Innovis Health, LLC
Winona Health Services
North Memorial Health Care
Douglas County Hospital
Fairview Clinics
Olmsted Medical Center Clinics
Park Nicollet Health Services
Essentia Health - St. Joseph's Medical Center
Northwest Family Physicians, PA
Essentia Health - SMDC Health System
HealthPartners Clinics
River Falls Medical Clinic
HealthEast
Osceola Medical Center
Gundersen Lutheran Clinics
Integrity - St. Cloud
HealthPartners Central Minnesota Clinics, Inc
Integrity - Buffalo
Entira Family Clinics
Multicare Associates of the Twin Cities
France Avenue Family Physicians, PA
Mayo Clinic Health System - Red Wing
Percent with Monitoring----- 2013 Goal (Silver 90%, Gold 95%)
Annual Monitoring for Patients on Persistent Medications - Primary Care ACE/ARB
1/1/2013 - 12/31/2013
Part 1 of a 2 Part Graph

HealthPartners Clinical Indicators Report — 2013/2014 Results50
0% 10% 20% 30% 40% 50% 60% 70% 80% 90% 100%
Surgical Consultants
Mankato Clinic, Ltd
Altru Clinics
Tri-County Hospital, Inc
Richfield Medical Group
Minnesota Rural Health Cooperative Clinics
Grand Itasca Clinic & Hospital
Essentia Health - St. Mary's Regional Health Center
Integrity - Northern
Avera Health Clinics
Sanford Health - Fargo
Mayo Clinic
Mayo Health System Clinics MN
Apple Valley Medical Clinic, Ltd
University of MN Physicians
Stillwater Medical Group
Hudson Physicians
Lakeview Clinic, Ltd
Affiliated Community Medical Centers, PA
St. Luke's Clinics
Open Cities Health Center
CentraCare Clinics
Average Group
Unity Family Healthcare
Hennepin County Medical Center
United Family Medicine
North Clinic, PA
St. Croix Regional Medical Center
Hutchinson Health
Percent with Monitoring----- 2013 Goal (Silver 90%, Gold 95%)
Annual Monitoring for Patients on Persistent Medications - Primary Care ACE/ARB
1/1/2013 - 12/31/2013
Part 2 of a 2 Part Graph

HealthPartners Clinical Indicators Report — 2013/2014 Results51
0% 10% 20% 30% 40% 50% 60% 70% 80% 90% 100%
Hennepin County Medical Center
Ridgeview Clinics
Essentia Health - St. Joseph's Medical Center
Affiliated Community Medical Centers, PA
Stillwater Medical Group
North Memorial Health Care
HealthEast
Park Nicollet Health Services
Essentia Health - Innovis Health, LLC
United Family Medicine
Essentia Health - SMDC Health System
Winona Health Services
Northwest Family Physicians, PA
Hutchinson Health
Allina Health
Fairview Clinics
HealthPartners Clinics
Multicare Associates of the Twin Cities
Burnsville Family Physicians, PA
Integrity - St. Cloud
Mayo Health System Clinics WI
HealthPartners Central Minnesota Clinics, Inc
Entira Family Clinics
Mayo Clinic Health System - Red Wing
New Richmond Clinic
Percent with Monitoring----- 2013 Goal (Silver 90%, Gold 95%)
Annual Monitoring for Patients on Persistent Medications - Primary Care Diuretics
1/1/2013 - 12/31/2013
Part 1 of a 2 Part Graph

HealthPartners Clinical Indicators Report — 2013/2014 Results52
0% 10% 20% 30% 40% 50% 60% 70% 80% 90% 100%
Mankato Clinic, Ltd
Altru Clinics
Essentia Health - St. Mary's Regional Health Center
Minnesota Rural Health Cooperative Clinics
Avera Health Clinics
Open Cities Health Center
Amery Regional Medical Center Clinics
Sanford Health - Fargo
Mayo Health System Clinics MN
Mayo Clinic
University of MN Physicians
Hudson Physicians
Lakeview Clinic, Ltd
Grand Itasca Clinic & Hospital
CentraCare Clinics
St. Croix Regional Medical Center
West Side Community Health Center
Integrity - Buffalo
St. Luke's Clinics
Average Group
Olmsted Medical Center Clinics
North Clinic, PA
Unity Family Healthcare
Apple Valley Medical Clinic, Ltd
Percent with Monitoring----- 2013 Goal (Silver 90%, Gold 95%)
Annual Monitoring for Patients on Persistent Medications - Primary Care Diuretics
1/1/2013 - 12/31/2013
Part 2 of a 2 Part Graph

HealthPartners Clinical Indicators Report — 2013/2014 Results53
ANNUAL MONITORING FOR PATIENTS ON PERSISTENT MEDICATIONS CARDIOLOGYJanuary 1, 2013 – December 31, 2013
DescriptionThe percentage of members ages 18 and older who received at least a 180-day supply of ambulatory medication therapy for Angiotensin Converting Enzyme (ACE) inhibitors, Angiotensin Receptor Blockers (ARB) and/or di-uretics during the measurement year and had at least one therapeutic monitoring event for the therapeutic agent in the measurement year.
A therapeutic monitoring event is defi ned as:
• At least one serum potassium (K+) and either a serum creatinine (SCr) or a blood urea nitrogen (BUN) for prescribed ACE inhibitors, ARBs and/or diuretics.
Methodology — AdministrativeThis measure is consistent with the HEDIS 2014 Annual Monitoring for Patients on Persistent Medications measurement specifi cations and includes all members ages 18 years and older as of December 31, 2013, from all products except Medicare Cost with a drug benefi t who were continuously enrolled from January 1, 2013 to December 31, 2013. Population identifi cation is based on claim and membership databases. Rates are calculated using administrative data only. Members are attributed to the medical group of the prescribing provider’s primary location of the most recent script that qualifi ed the member for the denominator. Only scripts written by a provider with a cardiology specialty are included; however, therapeutic monitoring claims from all providers are included.
Results
ACE/ARB monitoringTotal eligible members 1,366Members with monitoring event 1,157Annual Monitoring Rate 84.7%
Diuretics monitoringTotal eligible members 689Members with monitoring event 633Annual Monitoring Rate 91.9%

HealthPartners Clinical Indicators Report — 2013/2014 Results54
0% 10% 20% 30% 40% 50% 60% 70% 80% 90% 100%
Mayo Clinic
University of MN Physicians Heart at Fairview
Fairview Clinics
North Memorial Cardiovascular Services
Allina Health
Average Group
HealthEast
HealthPartners Clinics
Essentia Health - SMDC Health System
Park Nicollet Health Services
CentraCare Clinics
Percent with Monitoring----- 2013 Goal (Silver 90%, Gold 95%)
Annual Monitoring for Patients on Persistent Medications - Cardiology ACE/ARB
1/1/2013 - 12/31/2013

HealthPartners Clinical Indicators Report — 2013/2014 Results55
0% 10% 20% 30% 40% 50% 60% 70% 80% 90% 100%
Fairview Clinics
Allina Health
University of MN Physicians Heart at Fairview
North Memorial Cardiovascular Services
Average Group
HealthPartners Clinics
HealthEast
Park Nicollet Health Services
Percent with Monitoring----- 2013 Goal (Silver 90%, Gold 95%)
Annual Monitoring for Patients on Persistent Medications - Cardiology Diuretics
1/1/2013 - 12/31/2013

HealthPartners Clinical Indicators Report — 2013/2014 Results56
MEDICATION ADHERENCE FOR ASTHMA/COPD – PHARMACY July 1, 2013 – June 30, 2014
DescriptionThe percentage of members with a diagnosis of asthma or chronic obstructive pulmonary disease (COPD) who re-main on a controller medication1 and meet an 80 percent portion of days covered (PDC) for the controller medica-tion as measured by the days’ supply fi lled divided by the number of days from the date of the fi rst fi ll to the end of the measurement period.
Methodology — AdministrativeThis measure includes members age 5–64 years with a diagnosis of asthma and members age 40 years and older with a diagnosis of COPD from commercial products and who were continuously enrolled from July 1, 2013 to June 30, 2014.
The eligible population for members with a diagnosis of asthma is defi ned as having had, within the previous 24 months:
one or more inpatient or emergency department encounters with a discharge diagnosis of asthma • or;
two or more outpatient encounters with a diagnosis of asthma on different dates of service and two or • more distinct claim dates for inhaled/oral anti-infl ammatory or inhaled/oral bronchodilator medications or;
three or more distinct claim dates for inhaled bronchodilator or anti-infl ammatory medications and no• diagnosis of COPD.
The eligible population for members with a diagnosis of COPD is defi ned as having had, within the previous 24 months:
two or more distinct dates of service with a diagnosis of COPD • or;
one diagnosis of COPD and one claim on a different date of service for oxygen or a nebulizer.•
Rates are calculated administratively using outpatient claims. Members are attributed to the pharmacy where they have the greatest amount of days’ supply fi lled during the measurement period.
Results
Commercial Members
Total treated members 5,992
Members with 80% portion of days covered 2,822
Medication Adherence Rate 47.1%
1 Antiasthmatic combinations, antibody inhibitor, inhaled corticosteroids, Leukotriene modifi ers, mast cell stabilizers, bronchodilators, systemic corticosteroids

HealthPartners Clinical Indicators Report — 2013/2014 Results57
0% 10% 20% 30% 40% 50% 60% 70% 80% 90% 100%
Goodrich Pharmacy
Coborn's/Cash Wise
Lunds and Byerly's
Costco
Park Nicollet Health Services
HealthPartners Clinics
Wal-Mart/Sam’s Club
Walgreens
Fairview Clinics
CVS Pharmacy
Target
Average Pharmacy
SuperValu/Cub
Kmart
Setzer Pharmacy
Regions Hospital
Shopko
Thrifty Drug Stores
Essentia Health - SMDC Health System
HealthPartners Mail Order Pharmacy
Percent Adherence----- 2014 Goal (Silver 50%, Gold 63%)
Medication Adherence for Asthma/COPDPharmacy
7/1/2013 - 6/30/2014

HealthPartners Clinical Indicators Report — 2013/2014 Results58
MEDICATION ADHERENCE FOR DIABETES – PHARMACYJuly 1, 2013 – June 30, 2014
DescriptionThe percentage of members with a diagnosis of diabetes who remain on oral hypoglycemic medication1 and meet an 80 percent portion of days covered (PDC) for the medication as measured by the days’ supply fi lled divided by the number of days from the date of the fi rst fi ll to the end of the measurement period.
Methodology — AdministrativeThis measure includes members age 18 and older from commercial products and who were continuously enrolled from July 1, 2013 to June 30, 2014.
The eligible population for members with a diagnosis of diabetes is defi ned as having had, within the previous 15 months:
one or more prescription fi lls of insulin or oral hypoglycemic/antihyperglycemic agents • or;
two or more outpatient or non-acute inpatient encounters with a diagnosis of diabetes on different dates of • service or;
one or more acute inpatient or ED encounters with a diagnosis of diabetes.•
Rates are calculated administratively using outpatient pharmacy claims. Members are attributed to the pharmacy where they have the greatest amount of days’ supply fi lled during the measurement period.
Results
Commercial Members
Total treated members 9,004
Members with 80% portion of days covered 7,272
Medication Adherence Rate 80.8%
1 Oral Hypogleycemic drugs are defi ned using GPI code 27 and route of admin of Oral
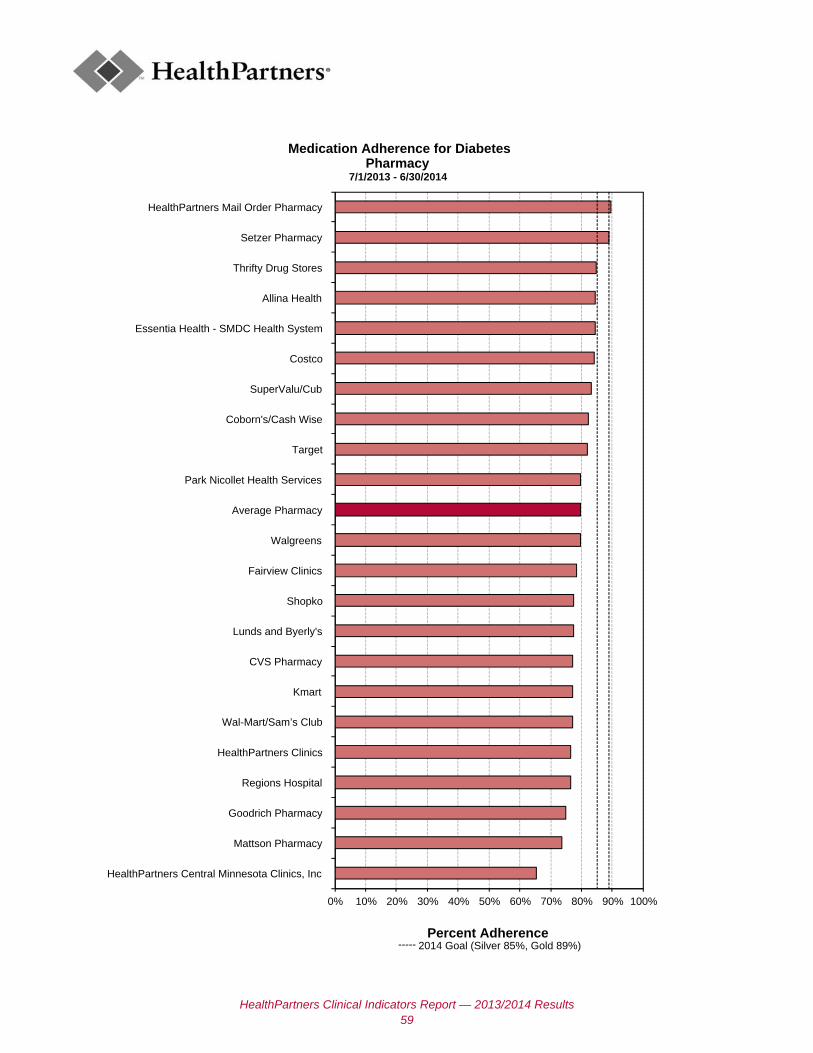
HealthPartners Clinical Indicators Report — 2013/2014 Results59
0% 10% 20% 30% 40% 50% 60% 70% 80% 90% 100%
HealthPartners Central Minnesota Clinics, Inc
Mattson Pharmacy
Goodrich Pharmacy
Regions Hospital
HealthPartners Clinics
Wal-Mart/Sam’s Club
Kmart
CVS Pharmacy
Lunds and Byerly's
Shopko
Fairview Clinics
Walgreens
Average Pharmacy
Park Nicollet Health Services
Target
Coborn's/Cash Wise
SuperValu/Cub
Costco
Essentia Health - SMDC Health System
Allina Health
Thrifty Drug Stores
Setzer Pharmacy
HealthPartners Mail Order Pharmacy
Percent Adherence----- 2014 Goal (Silver 85%, Gold 89%)
Medication Adherence for DiabetesPharmacy
7/1/2013 - 6/30/2014

HealthPartners Clinical Indicators Report — 2013/2014 Results60
POTENTIALLY INAPPROPRIATE MEDICATIONS – PHARMACYJuly 1, 2013 – June 30, 2014
DescriptionThe percentage of members ages 65 and older who were taking more than one contraindicated (high-risk) medica-tion from July 1, 2013 to June 30, 2014.
Methodology — AdministrativeThis measure includes members ages 65 and older as of June 30, 2014 from all products who were continuously enrolled from July 1, 2013 to June 30, 2014. Population is identifi ed using membership databases. Rates are calculated administratively using outpatient pharmacy claims. Members are attributed to the pharmacy where they have the greatest amount of days’ supply fi lled during the measurement period.
Results
Commercial Members
Total eligible members 52,434
Members with more than one contraindicated medication 4,826
Potentially Inappropriate Medications Rate1 9.2%
1 A lower percentage is desirable.

HealthPartners Clinical Indicators Report — 2013/2014 Results61
0% 10% 20% 30% 40% 50% 60% 70% 80% 90% 100%
Coborn's/Cash Wise
HealthPartners Central Minnesota Clinics, Inc
Thrifty Drug Stores
Fairview Clinics
St. Paul Corner Drug
Essentia Health - SMDC Health System
CVS Pharmacy
Kmart
The Medicine Shoppe
Regions Hospital
HealthPartners Mail Order Pharmacy
SuperValu/Cub
Walgreens
Average Pharmacy
Lunds and Byerly's
Target
Allina Health
Wal-Mart/Sam’s Club
Costco
HealthPartners Clinics
Park Nicollet Health Services
Goodrich Pharmacy
Shopko
Setzer Pharmacy
Percent Potentially Inappropriate----- 2014 Goal (Silver <9%, Gold <7%)
Potentially Inappropriate MedicationsPharmacy
7/1/2013 - 6/30/2014
Note: A lower index is desirable

HealthPartners Clinical Indicators Report — 2013/2014 Results62
OPTIMAL CARE FOR ACUTE LOW BACK PAINJanuary 1, 2013 – December 31, 2013
DescriptionThe rate represents the percentage of members ages 18 and older with newly diagnosed acute low back pain who received optimal care for acute low back pain.
Optimal care for acute low back pain is defi ned as an initial offi ce visit for low back pain and does NOT include any of the following services in the fi rst six weeks of care:
• Imaging• Injection therapy referral• Narcotic prescription• Surgical consultation
Methodology — AdministrativeThis measure includes members ages 18 years and older as of December 31, 2013, from commercial and Medicaid products with a pharmacy benefi t. A newly diagnosed episode of acute low back pain for a member is defi ned as having no non-pharmacy low back pain claims at any facility in the 180 days prior to the diagnosis visit. Members with cancer, trauma, neurological impairment, IV drug abuse or pregnancy diagnoses prior to the end of the fi rst six weeks following diagnosis are excluded. Population identifi cation is based on claim and mem-bership databases. Rates are calculated using administrative data only. Members are attributed to the provider group of the diagnosing practitioner.
ResultsTotal eligible members 11,464Members with appropriate care 8,081
Members Optimally Managed 70.5%
Rate by ServiceNo imaging in fi rst six weeks 90.8%No injection in fi rst six weeks 97.7%No narcotic prescription in fi rst six weeks 78.6%No surgical consultation in fi rst six weeks 98.8%

HealthPartners Clinical Indicators Report — 2013/2014 Results63
0% 10% 20% 30% 40% 50% 60% 70% 80% 90% 100%
Open Cities Health CenterIntegrity - Buffalo
Amery Regional Medical Center ClinicsDouglas County Hospital
Altru ClinicsLakeview Clinic, Ltd
Minnesota Rural Health Cooperative ClinicsIntegrity - NorthernIntegrity - St. Cloud
Essentia Health - Innovis Health, LLCCentraCare Clinics
HealthPartners Central Minnesota Clinics, IncSt. Croix Regional Medical Center
Sanford Health - FargoNorthwest Family Physicians, PA
Apple Valley Medical Clinic, LtdRiver Falls Medical ClinicWinona Health Services
West Side Community Health CenterAllina Health
North Memorial Health CareNorth Clinic, PA
Stillwater Medical GroupAverage GroupFairview Clinics
Essentia Health - SMDC Health SystemHudson Physicians
HealthEastMayo Health System Clinics WI
Multicare Associates of the Twin CitiesEntira Family Clinics
Ridgeview ClinicsMayo Health System Clinics MN
Essentia Health - St. Joseph's Medical CenterGrand Itasca Clinic & Hospital
Hennepin County Medical CenterOlmsted Medical Center Clinics
United Family MedicineSt. Luke's Clinics
Osceola Medical CenterPark Nicollet Health Services
HealthPartners ClinicsHutchinson Health
Mayo ClinicCommunity Univ Health Care Center (CUHCC)
NorthPoint Health & Wellness CenterNew Richmond Clinic
University of MN Physicians
Percent with No Imaging, Injections, Surgery Referralor Narcotics within 6 weeks
Optimal Care for Acute Low Back Pain1/1/2013 - 12/31/2013

HealthPartners Clinical Indicators Report — 2013/2014 Results64
0% 10% 20% 30% 40% 50% 60% 70% 80% 90% 100%
Altru ClinicsDouglas County Hospital
Olmsted Medical Center ClinicsIntegrity - Northern
Integrity - St. CloudMinnesota Rural Health Cooperative Clinics
North Memorial Health CareIntegrity - Buffalo
Apple Valley Medical Clinic, LtdLakeview Clinic, Ltd
Amery Regional Medical Center ClinicsHealthPartners Central Minnesota Clinics, Inc
Essentia Health - SMDC Health SystemHealthEast
CentraCare ClinicsOsceola Medical Center
Mayo Health System Clinics WIHutchinson Health
Essentia Health - Innovis Health, LLCNorthwest Family Physicians, PA
Fairview ClinicsAverage Group
Multicare Associates of the Twin CitiesHennepin County Medical Center
Stillwater Medical GroupSanford Health - Fargo
St. Luke's ClinicsNorth Clinic, PA
Park Nicollet Health ServicesAllina Health
Hudson PhysiciansSt. Croix Regional Medical Center
Winona Health ServicesEntira Family Clinics
HealthPartners ClinicsRiver Falls Medical Clinic
Ridgeview ClinicsUniversity of MN Physicians
Community Univ Health Care Center (CUHCC)Open Cities Health Center
Grand Itasca Clinic & HospitalMayo Health System Clinics MN
Mayo ClinicWest Side Community Health Center
Essentia Health - St. Joseph's Medical CenterNorthPoint Health & Wellness Center
New Richmond ClinicUnited Family Medicine
Percent with No Imaging within 6 weeks
Low Back Pain - Imaging 1/1/2013 - 12/31/2013

HealthPartners Clinical Indicators Report — 2013/2014 Results65
0% 10% 20% 30% 40% 50% 60% 70% 80% 90% 100%
Integrity - NorthernIntegrity - Buffalo
Lakeview Clinic, LtdSanford Health - Fargo
St. Croix Regional Medical CenterRidgeview Clinics
Essentia Health - St. Joseph's Medical CenterNorth Clinic, PA
Mayo ClinicCentraCare Clinics
Mayo Health System Clinics WIMulticare Associates of the Twin Cities
Minnesota Rural Health Cooperative ClinicsOpen Cities Health Center
Entira Family ClinicsAverage Group
NorthPoint Health & Wellness CenterHudson Physicians
Park Nicollet Health ServicesNorth Memorial Health Care
Douglas County HospitalStillwater Medical Group
Allina HealthApple Valley Medical Clinic, Ltd
Mayo Health System Clinics MNHealthEast
St. Luke's ClinicsHealthPartners Central Minnesota Clinics, Inc
Hutchinson HealthEssentia Health - SMDC Health System
Essentia Health - Innovis Health, LLCWest Side Community Health Center
Fairview ClinicsAmery Regional Medical Center Clinics
HealthPartners ClinicsNorthwest Family Physicians, PA
Integrity - St. CloudUniversity of MN Physicians
Winona Health ServicesUnited Family Medicine
River Falls Medical ClinicOsceola Medical Center
Olmsted Medical Center ClinicsNew Richmond Clinic
Hennepin County Medical CenterGrand Itasca Clinic & Hospital
Community Univ Health Care Center (CUHCC)Altru Clinics
Percent with No Injection within 6 weeks
Low Back Pain - Injections 1/1/2013 - 12/31/2013

HealthPartners Clinical Indicators Report — 2013/2014 Results66
0% 10% 20% 30% 40% 50% 60% 70% 80% 90% 100%
Open Cities Health CenterAmery Regional Medical Center Clinics
Integrity - BuffaloMinnesota Rural Health Cooperative Clinics
Douglas County HospitalSt. Croix Regional Medical Center
Lakeview Clinic, LtdAltru Clinics
Integrity - St. CloudCentraCare Clinics
Northwest Family Physicians, PAEssentia Health - Innovis Health, LLCWest Side Community Health Center
Hudson PhysiciansRiver Falls Medical Clinic
Sanford Health - FargoWinona Health Services
HealthPartners Central Minnesota Clinics, IncAllina Health
North Clinic, PAGrand Itasca Clinic & Hospital
Average GroupMayo Health System Clinics MN
Fairview ClinicsHennepin County Medical Center
Stillwater Medical GroupUnited Family Medicine
Apple Valley Medical Clinic, LtdMulticare Associates of the Twin Cities
Essentia Health - SMDC Health SystemEntira Family Clinics
HealthEastMayo Health System Clinics WI
Essentia Health - St. Joseph's Medical CenterRidgeview Clinics
North Memorial Health CareNorthPoint Health & Wellness Center
Integrity - NorthernHealthPartners Clinics
Osceola Medical CenterNew Richmond Clinic
Park Nicollet Health ServicesHutchinson Health
St. Luke's ClinicsMayo Clinic
University of MN PhysiciansCommunity Univ Health Care Center (CUHCC)
Olmsted Medical Center Clinics
Percent with No Narcotics within 6 weeks
Low Back Pain - Narcotics Use 1/1/2013 - 12/31/2013

HealthPartners Clinical Indicators Report — 2013/2014 Results67
0% 10% 20% 30% 40% 50% 60% 70% 80% 90% 100%
Lakeview Clinic, LtdStillwater Medical Group
Amery Regional Medical Center ClinicsCommunity Univ Health Care Center (CUHCC)
River Falls Medical ClinicOsceola Medical Center
Integrity - BuffaloWinona Health Services
New Richmond ClinicMayo Health System Clinics WI
Essentia Health - SMDC Health SystemEntira Family Clinics
St. Croix Regional Medical CenterHealthEast
Allina HealthRidgeview Clinics
Mayo Health System Clinics MNNorth Memorial Health Care
Minnesota Rural Health Cooperative ClinicsAverage Group
Apple Valley Medical Clinic, LtdNorth Clinic, PA
St. Luke's ClinicsHealthPartners Clinics
Park Nicollet Health ServicesFairview Clinics
HealthPartners Central Minnesota Clinics, IncUniversity of MN Physicians
West Side Community Health CenterUnited Family MedicineSanford Health - Fargo
Open Cities Health CenterOlmsted Medical Center Clinics
Northwest Family Physicians, PANorthPoint Health & Wellness Center
Multicare Associates of the Twin CitiesMayo Clinic
Integrity - St. CloudIntegrity - NorthernHutchinson Health
Hudson PhysiciansHennepin County Medical Center
Grand Itasca Clinic & HospitalEssentia Health - St. Joseph's Medical Center
Essentia Health - Innovis Health, LLCDouglas County Hospital
CentraCare ClinicsAltru Clinics
Percent with No Surgical Consult within 6 weeks
Low Back Pain - Surgical Consult 1/1/2013 - 12/31/2013

HealthPartners Clinical Indicators Report — 2013/2014 Results68
PREVENTIVE SERVICES — ADULT PRIMARY CAREJanuary 1, 2013 – December 31, 2013
DescriptionThe rate represents the percent of enrolled members ages 19 and older by December 31, 2013, who are up-to-date (UTD) for all appropriate preventive services and the percent up-to-date rate by each service type. The measure includes preventive screening appropriate to each member’s age and gender. (The Adult Preventive Services matrix of required services by age and gender is included in the 2014 Clinical Indicators Report Technical Supplement at healthpartners.com/quality.)
Methodology — HybridElements of this measure are consistent with HEDIS 2014 measures. This measure includes members from all products who were continuously enrolled from January 1, 2013 to December 31, 2013, who had a clinic visit in 2013. Population identifi cation is based on claim and membership databases. This measure includes a random sample of 105 members (100 + 5% oversample) per medical group. The UTD rate refl ects a combination of administrative and chart abstracted data. Members are attributed to the primary care provider group with the most offi ce visits during the measurement year. In addition to the members UTD rate, also displayed is an UTD rate that includes a tobacco assessment component. The Institute for Clinical Systems Improvement (ICSI) preventive services guideline for adults lists tobacco assessment as a Level I Component.
Results*Total eligible members 314,641Members sampled 5,359Members up-to-date (Combination 3) 3,870
Members Up-to-Date - Primary Care (Combination 3) 78.1% (± 2.6)Members Up-to-Date - Primary Care (Combination 6) 73.8% (± 2.8)
Rate by Service Combo 3 Combo 6Cholesterol, total and HDL (last fi ve years) 90.8% (± 2.2) √ √Colorectal cancer screening (colonoscopy last ten years, fl ex sig last fi ve years or FOBT in 2013)
pypyy l llasasasastt t teten y) HEDIS
80.2% (± 3.4) √ √
Breast cancer screening (last two years ) ) ) HEDIS 86.5% (± 2.8) √ √
Cervical cancer screening (last three years) ) ) HEDIS 81.3% (± 4.0) √ √Chlamydia screening (in 2013 for sexually active women per HEDIS specifi cations)
2001313133 ff f fffffffffffffororo s ex) HEDIS
33.7% (± 8.0) √ √
Pneumococcal vaccine ( ≥ 65 yrs) ) ) HEDIS 87.0% (± 4.8) √ √
Blood pressure (last two years) 98.3% (± 0.7) √ √Tobacco assessment (in 2013) 98.4% (± 0.5) √ √BMI (in 2013) 91.2% (± 1.8) √
* All rates are weighted by the eligible population of the provider groups displayed.

HealthPartners Clinical Indicators Report — 2013/2014 Results69
Finite population correction factor applied
0% 10% 20% 30% 40% 50% 60% 70% 80% 90% 100%
Advanced Medical ClinicSt. Paul Family Medical Center
Integrity - NorthernRiver Falls Medical Clinic
Olmsted Medical Center ClinicsMinnesota Rural Health Cooperative Clinics
Apple Valley Medical Clinic, LtdSt. Luke's Clinics
CentraCare ClinicsIntegrity - Buffalo
Hennepin County Medical CenterDr. Bobby Yang Medical Clinic
Northwest Family Physicians, PALakeview Clinic, Ltd
Baldwin Area Medical CenterSt. Croix Regional Medical Center
Osceola Medical CenterHudson Physicians
Western Wisconsin Medical Associates, SC ClinicsNorthfield Hospital Clinics
Sanford Health - FargoHutchinson Health
Avera Health ClinicsAltru Clinics
Sanford Health - Sioux FallsRidgeview Clinics
France Avenue Family Physicians, PABurnsville Family Physicians, PA
Average GroupIntegrity - St. Cloud
Mayo Clinic Health System - Red WingEssentia Health - St. Joseph's Medical Center
Essentia Health - Innovis Health, LLCEntira Family Clinics
Stillwater Medical GroupLakewood Clinic
New Richmond ClinicUniversity of MN Physicians
Essentia Health - SMDC Health SystemIlko Family Medicine, PA
Multicare Associates of the Twin CitiesMayo Health System Clinics MN
Essentia Health - St. Mary's Regional Health CenterAALFA Family Clinic, PA
North Memorial Health CareValley Family Practice
Park Nicollet Health ServicesEdina Sports Health & Wellness, PA
North Clinic, PARichfield Medical Group
Allina HealthFairview Clinics
HealthEastHealthPartners ClinicsCatalyst Medical Clinic
Associated Medical and Dental ClinicHealthPartners Central Minnesota Clinics, Inc
Percent Receiving All Appropriate Services----- 2013 Goal (Silver 90%, Gold 93%)
Preventive Services - Adult - Primary Care Members Up-to-Date, Combination 3 (includes Tobacco Assessment)
1/1/2013 - 12/31/2013
Confidence Interval

HealthPartners Clinical Indicators Report — 2013/2014 Results70
0% 10% 20% 30% 40% 50% 60% 70% 80% 90% 100%
St. Paul Family Medical CenterAdvanced Medical Clinic
Minnesota Rural Health Cooperative ClinicsIntegrity - Northern
Hudson PhysiciansRiver Falls Medical Clinic
Olmsted Medical Center ClinicsIlko Family Medicine, PA
CentraCare ClinicsDr. Bobby Yang Medical Clinic
Lakeview Clinic, LtdApple Valley Medical Clinic, Ltd
Sanford Health - Sioux FallsHennepin County Medical CenterMayo Health System Clinics MN
St. Luke's ClinicsSanford Health - Fargo
Hutchinson HealthBaldwin Area Medical Center
Western Wisconsin Medical Associates, SC ClinicsNorthwest Family Physicians, PA
Avera Health ClinicsAltru Clinics
Northfield Hospital ClinicsIntegrity - Buffalo
Osceola Medical CenterIntegrity - St. Cloud
St. Croix Regional Medical CenterAverage Group
Ridgeview ClinicsBurnsville Family Physicians, PA
Valley Family PracticeMayo Clinic Health System - Red Wing
New Richmond ClinicLakewood Clinic
Entira Family ClinicsEssentia Health - St. Mary's Regional Health Center
Essentia Health - Innovis Health, LLCUniversity of MN Physicians
France Avenue Family Physicians, PACatalyst Medical Clinic
Stillwater Medical GroupEssentia Health - St. Joseph's Medical Center
Essentia Health - SMDC Health SystemRichfield Medical Group
AALFA Family Clinic, PAMulticare Associates of the Twin Cities
Park Nicollet Health ServicesNorth Memorial Health Care
Allina HealthHealthPartners Clinics
HealthEastEdina Sports Health & Wellness, PA
North Clinic, PAFairview Clinics
HealthPartners Central Minnesota Clinics, IncAssociated Medical and Dental Clinic
Percent Receiving All Appropriate Services
Preventive Services - Adult - Primary Care Members Up-to-Date, Combination 6
1/1/2013 - 12/31/2013
Confidence Interval Finite population correction factor applied

HealthPartners Clinical Indicators Report — 2013/2014 Results71
PREVENTIVE SERVICES — ADULT OB/GYN January 1, 2013 – December 31, 2013
DescriptionThe rate represents the percent of enrolled female members ages 19 and older by December 31, 2013, who are up-to-date (UTD) for all appropriate preventive services and the percent up-to-date rate by each service type. The measure includes preventive screening appropriate to each member’s age. (The Adult Preventive Services matrix of required services by age and gender is included in the 2014 Clinical Indicators Report Technical Supplement at healthpartners.com/quality.)
Methodology — HybridElements of this measure are consistent with HEDIS 2014 measures. This measure includes members from all products who were continuously enrolled from January 1, 2013 to December 31, 2013, who had a clinic visit in 2013. Population identifi cation is based on claim and membership databases. This measure includes a random sample of 84 members (80 + 5% oversample) per medical group. The UTD rate refl ects a combination of administrative and chart abstracted data. Members are attributed to the OB/GYN provider group with the most offi ce visits during the measurement year. In addition to the members UTD rate, also displayed is an UTD rate that includes a tobacco assessment component. The Institute for Clinical Systems Improvement (ICSI) preventive services guideline for adults lists tobacco assessment as a Level I Component.
Results*Total eligible members 61,349Members sampled 2,177Members up-to-date (Combination 3) 1,862
Members Up-to-Date - OB/GYN (Combination 3) 90.2% (± 2.0)
Rate by ServiceCholesterol, total and HDL (last fi ve years) 96.0% (± 1.9)Colorectal cancer screening (colonoscopy last ten years, fl ex sig last fi ve years or FOBT in 2013)
osscococoopypypypypypypypypypypypypypypy l l asa t ) HEDIS
82.6% (± 5.7)
Breast cancer screening (last two years) ) ) HEDIS 95.8% (± 2.6)
Cervical cancer screening (last three years) ) ) HEDIS 97.1% (± 1.0)Chlamydia screening (in 2013 for sexually active women per HEDIS specifi cations)
2001313133 f f f fffffffffffffororo s ex) HEDIS
84.5% (± 7.3)
Pneumococcal vaccine ( ≥ 65 yrs) ) ) HEDIS 89.9% (± 5.5)
Blood pressure (last two years) 98.9% (± 0.6)Tobacco assessment (in 2013) 99.1% (± 0.6)
* All rates are weighted by the eligible population of the provider groups displayed.

HealthPartners Clinical Indicators Report — 2013/2014 Results72
0% 10% 20% 30% 40% 50% 60% 70% 80% 90% 100%
Mayo Clinic
St. Luke's Clinics
Minnesota Gynecology and Surgery, LLC
Comprehensive Healthcare for Women, PA
Mayo Health System Clinics MN
Multicare Associates of the Twin Cities
University of MN Physicians
Ridgeview Clinics
John A. Haugen Associates, PA
Stillwater Medical Group
Average Group
Essentia Health - SMDC Health System
Premier ObGyn of Minnesota
Fairview Clinics
North Clinic, PA
Park Nicollet Health Services
Mankato Clinic, Ltd
Clinic Sofia OB/GYN, PA
Paul Larson OB/GYN Clinic, PA
CentraCare Clinics
Allina Health
HealthEast
Obstetrics and Gynecology Associates
HealthPartners Central Minnesota Clinics, Inc
HealthPartners Clinics
Adefris & Toppin Women's Specialists, MD, PC
Integrity - Buffalo
Percent Receiving All Appropriate Services
Preventive Services - Adult - OB/GYN Providers Members Up-to-Date, Combination 3
1/1/2013 -12/31/2013
Confidence IntervalFinite population correction factor applied

HealthPartners Clinical Indicators Report — 2013/2014 Results73
PREVENTIVE SERVICES — CHILD AND ADOLESCENTJanuary 1, 2013 – December 31, 2013
DescriptionThe rate represents the percent of enrolled members ages 18 and younger on December 31, 2013, who are up-to-date (UTD) for all appropriate preventive services and the up-to-date rate by each service type. The measure includes preventive screening appropriate to each member’s age and gender. (The Child and Adolescent Preventive Services matrix of required services by age and gender is included in the 2014 Clinical Indicators Report Technical Supplement at healthpartners.com/quality.)
Methodology — HybridElements of this measure are consistent with HEDIS 2014 measures. This measure includes members from all products who were continuously enrolled from January 1, 2013 to December 31, 2013, who had a clinic visit in 2013. Population identifi cation is based on claim and membership databases. This measure includes a random sample of 105 members (100 + 5% oversample) per medical group. The UTD rate refl ects a combination of ad-ministrative and chart abstracted data. Members are attributed to the primary care provider group with the most offi ce visits during the measurement year. In addition to the members UTD rate, also displayed is an UTD rate that includes a tobacco assessment component. The Institute for Clinical Systems Improvement (ICSI) preventive services guideline for adults lists tobacco assessment as a Level I Component.
Results*Total eligible members 112,617Members sampled 5,055Members up-to-date Combination 4 3,005Members up-to-date Combination 5 2,795Members up-to-date Combination 6 2,902
Members Up-to-Date - Child and Adolescent (Combination 4) 67.0% (± 2.9)Members Up-to-Date - Child and Adolescent (Combination 5) 63.7% (± 3.0)Members Up-to-Date - Child and Adolescent (Combination 6) 66.3% (± 3.0)
Rate by Service Combo 4 Combo 5 Combo 6Vision screening (by 12/31/2013) 91.4% (± 2.9) √ √ √Height and weight (recorded on same date in 2013, ages 3–18) 84.0% (± 2.3) √ √
Chlamydia screening1 (in 2013) ) HEDIS 57.6% (± 12.9) √ √ √
Tetanus, adolescent (by age 13) ) HEDIS 97.2% (± 1.3) √ √ √
Meningococcol immunization (by age 13) ) ) HEDIS 78.1% (± 6.6) √ √ √
HPV ages 13-18 (UTD by 12/31/13) series of 3 40.7% (± 7.1) √ √ √Imm combination ages 2–4 (UTD by 12/31/13) 4 DTaP, 3 Polio, 1 MMR, 3 HiB, 3 HepB, 1 VZV, 4 Pneumococcal)
1 M MMMMRMRMRM , , 3 H) HEDIS
86.4% (± 4.2) √ √
Imm combination ages 2–4 (UTD by 12/31/13)4 DTaP, 3 Polio, 1 MMR, 3 HiB, 3 HepB, 1 VZV, 4 Pneumococcal, 1 HepA, 2-3 Rotavirus, 2 Infl uenza)
ocococcccccccalalaa , ,, 1 H) HEDIS
65.9% (± 5.2) √

HealthPartners Clinical Indicators Report — 2013/2014 Results74
Rate by Service, continued Combo 4 Combo 5 Combo 6Imm combination ages 7–8 (UTD by age 7) DTaP #5, MMR #2, Polio #4, VZV #2 86.2% (± 5.8) √ √ √
Tobacco assessment (in 2013) 91.1% (± 1.5) √ √ √BMI (in 2013) 83.0% (± 2.3) √
1 Ages 16–18 if member meets HEDIS criteria as sexually active.* All rates are weighted by the eligible population of the provider groups displayed.

HealthPartners Clinical Indicators Report — 2013/2014 Results75
Finite population correction factor applied
0% 10% 20% 30% 40% 50% 60% 70% 80% 90% 100%
Hennepin County Medical CenterSanford Health - Fargo
Altru ClinicsLakeview Clinic, Ltd
Olmsted Medical Center ClinicsEssentia Health - St. Mary's Regional Health Center
Mayo Clinic Health System - Red WingNorth Memorial Health Care
Minnesota Rural Health Cooperative ClinicsNorthfield Hospital Clinics
Apple Valley Medical Clinic, LtdIlko Family Medicine, PA
Mayo Health System Clinics MNSanford Health - Sioux Falls
North Clinic, PAAvera Health Clinics
Edina Sports Health & Wellness, PASt. Paul Family Medical Center
St. Luke's ClinicsAALFA Family Clinic, PAOsceola Medical Center
Average GroupBurnsville Family Physicians, PA
Catalyst Medical ClinicHudson PhysiciansCentraCare Clinics
Ridgeview ClinicsIntegrity - Northern
Park Nicollet Health ServicesBaldwin Area Medical Center
Allina HealthLakewood Clinic
France Avenue Family Physicians, PANorthwest Family Physicians, PA
New Richmond ClinicEssentia Health - Innovis Health, LLC
St. Croix Regional Medical CenterEssentia Health - St. Joseph's Medical Center
Dr. Bobby Yang Medical ClinicHutchinson Health
HealthPartners Central Minnesota Clinics, IncEntira Family Clinics
Advanced Medical ClinicWestern Wisconsin Medical Associates, SC Clinics
Integrity - BuffaloHealthEast
Children's Physician NetworkHealthPartners Clinics
Integrity - St. CloudRiver Falls Medical Clinic
Multicare Associates of the Twin CitiesSouthdale Pediatric Associates, Ltd
Stillwater Medical GroupUniversity of MN Physicians
Essentia Health - SMDC Health SystemFairview Clinics
Percent Receiving All Appropriate Services----- 2013 Goal (Silver 85%, Gold 90%)
Preventive Services - Child and Adolescent Members Up-to-Date, Combination 4
1/1/2013 - 12/31/2013
Confidence Interval

HealthPartners Clinical Indicators Report — 2013/2014 Results76
0% 10% 20% 30% 40% 50% 60% 70% 80% 90% 100%
Hennepin County Medical CenterAltru Clinics
Sanford Health - FargoEssentia Health - St. Mary's Regional Health Center
Lakeview Clinic, LtdOlmsted Medical Center Clinics
Minnesota Rural Health Cooperative ClinicsNorthfield Hospital Clinics
Mayo Clinic Health System - Red WingApple Valley Medical Clinic, Ltd
North Memorial Health CareAvera Health Clinics
Sanford Health - Sioux FallsSt. Paul Family Medical Center
North Clinic, PAAALFA Family Clinic, PA
Mayo Health System Clinics MNIlko Family Medicine, PA
Catalyst Medical ClinicSt. Luke's ClinicsLakewood Clinic
Hudson PhysiciansEdina Sports Health & Wellness, PA
Average GroupRidgeview Clinics
Osceola Medical CenterBurnsville Family Physicians, PA
CentraCare ClinicsAllina Health
St. Croix Regional Medical CenterPark Nicollet Health Services
New Richmond ClinicWestern Wisconsin Medical Associates, SC Clinics
Integrity - NorthernBaldwin Area Medical Center
Essentia Health - Innovis Health, LLCHutchinson Health
HealthPartners Central Minnesota Clinics, IncFrance Avenue Family Physicians, PA
Advanced Medical ClinicNorthwest Family Physicians, PA
Integrity - St. CloudHealthEast
Essentia Health - St. Joseph's Medical CenterChildren's Physician Network
Dr. Bobby Yang Medical ClinicIntegrity - Buffalo
Entira Family ClinicsRiver Falls Medical Clinic
HealthPartners ClinicsMulticare Associates of the Twin Cities
Southdale Pediatric Associates, LtdStillwater Medical Group
University of MN PhysiciansEssentia Health - SMDC Health System
Fairview Clinics
Percent Receiving All Appropriate Services
Preventive Services - Child and Adolescent Members Up-to-Date, Combination 5
1/1/2013 - 12/31/2013
Confidence Interval Finite population correction factor applied
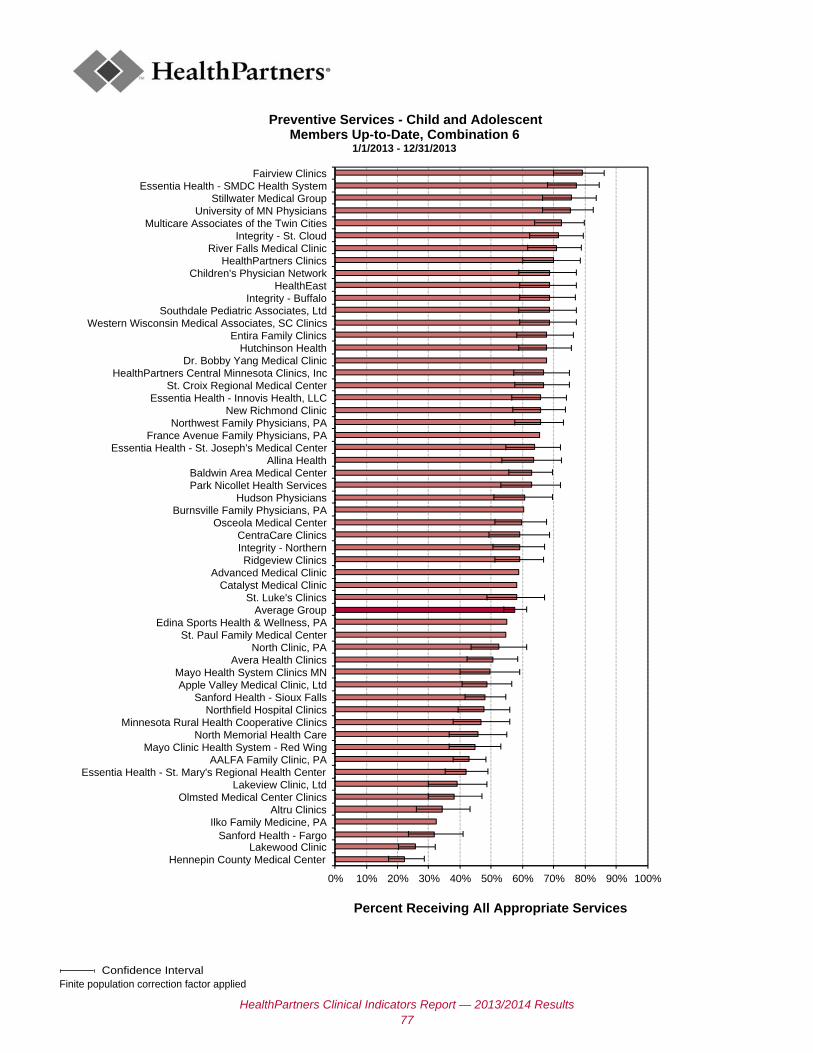
HealthPartners Clinical Indicators Report — 2013/2014 Results77
0% 10% 20% 30% 40% 50% 60% 70% 80% 90% 100%
Hennepin County Medical CenterLakewood Clinic
Sanford Health - FargoIlko Family Medicine, PA
Altru ClinicsOlmsted Medical Center Clinics
Lakeview Clinic, LtdEssentia Health - St. Mary's Regional Health Center
AALFA Family Clinic, PAMayo Clinic Health System - Red Wing
North Memorial Health CareMinnesota Rural Health Cooperative Clinics
Northfield Hospital ClinicsSanford Health - Sioux Falls
Apple Valley Medical Clinic, LtdMayo Health System Clinics MN
Avera Health ClinicsNorth Clinic, PA
St. Paul Family Medical CenterEdina Sports Health & Wellness, PA
Average GroupSt. Luke's Clinics
Catalyst Medical ClinicAdvanced Medical Clinic
Ridgeview ClinicsIntegrity - NorthernCentraCare Clinics
Osceola Medical CenterBurnsville Family Physicians, PA
Hudson PhysiciansPark Nicollet Health ServicesBaldwin Area Medical Center
Allina HealthEssentia Health - St. Joseph's Medical Center
France Avenue Family Physicians, PANorthwest Family Physicians, PA
New Richmond ClinicEssentia Health - Innovis Health, LLC
St. Croix Regional Medical CenterHealthPartners Central Minnesota Clinics, Inc
Dr. Bobby Yang Medical ClinicHutchinson Health
Entira Family ClinicsWestern Wisconsin Medical Associates, SC Clinics
Southdale Pediatric Associates, LtdIntegrity - Buffalo
HealthEastChildren's Physician Network
HealthPartners ClinicsRiver Falls Medical Clinic
Integrity - St. CloudMulticare Associates of the Twin Cities
University of MN PhysiciansStillwater Medical Group
Essentia Health - SMDC Health SystemFairview Clinics
Percent Receiving All Appropriate Services
Preventive Services - Child and Adolescent Members Up-to-Date, Combination 6
1/1/2013 - 12/31/2013
Confidence Interval Finite population correction factor applied

HealthPartners Clinical Indicators Report — 2013/2014 Results78
EVIDENCE-BASED CERVICAL CANCER SCREENING — PRIMARY CAREAverage Risk Asymptomatic WomenJanuary 1, 2011 – December 31, 2013
DescriptionThe rate represents the percentage of women ages 21 and older in the measurement year screened in accordance with evidence-based standards:
• One screening pap test in measurement year or two years prior for women ages 21 to 64 and no history ofhysterectomy
• No screening pap test in the measurement year for women ages 65 and older or women ages 21 and older with history of hysterectomy
Not screened:• No screening pap test in measurement year or two years prior for women ages 21 to 64 and no history of
hysterectomyScreened more frequently:
• Two or more screening pap tests in measurement year or two years prior for women ages 21 to 64 and no history of hysterectomy
• One or more screening pap tests in the measurement year for women ages 65 and older• One or more screening pap tests for women ages 21 and older with history of hysterectomy
Methodology — AdministrativeDue to a three year measurement period, this measure includes all women ages 24 and older as of December 31, 2013, from all products who were continuously enrolled for three years. Population identifi cation is based on claim and membership databases. Rates are calculated using administrative data only. Members with a history of any abnormal cervical cancer screening, including cervical HPV, within fi ve years or with a history of cervi-cal cancer are excluded. Each pap test is attributed to the provider’s medical group who performed the service. Members who do not have a pap test are attributed to the medical group visited the most.
ResultsTotal eligible pap tests or members (those without a pap test) 122,313
Evidence-based screening 77,740
Evidence-Based Screening Rate 63.6%Not screened1 18.7%Screened more frequently1 17.7%
1 Lower rates are better.

HealthPartners Clinical Indicators Report — 2013/2014 Results79
0% 10% 20% 30% 40% 50% 60% 70% 80% 90% 100%
Regions HospitalIntegrity - St. Cloud
Burnsville Family Physicians, PAFrance Avenue Family Physicians, PA
University of MN PhysiciansUnity Family Healthcare
Mankato Clinic, LtdAffiliated Community Medical Centers, PA
Essentia Health - SMDC Health SystemApple Valley Medical Clinic, Ltd
Sanford Health - FargoAltru Clinics
Hutchinson HealthOsceola Medical Center
Minnesota Rural Health Cooperative ClinicsLakeview Clinic, Ltd
Gateway Family Health ClinicMulticare Associates of the Twin Cities
Winona Health ServicesMayo Health System Clinics WI
CentraCare ClinicsWestern Wisconsin Medical Associates, SC Clinics
St. Croix Regional Medical CenterSt. Luke's ClinicsIntegrity - Buffalo
Essentia Health - Innovis Health, LLCNorthwest Family Physicians, PA
Douglas County HospitalMayo Health System Clinics MN
Average GroupHealthPartners Central Minnesota Clinics, Inc
Edina Sports Health & Wellness, PAIntegrity - Northern
Grand Itasca Clinic & HospitalNorth Memorial Health Care
North Clinic, PAEssentia Health - St. Joseph's Medical Center
Mayo ClinicFairview Clinics
Allina HealthOlmsted Medical Center Clinics
Amery Regional Medical Center ClinicsEntira Family Clinics
Mayo Clinic Health System - Red WingHealthEast
Ridgeview ClinicsPark Nicollet Health ServicesGundersen Lutheran Clinics
United Family MedicineStillwater Medical Group
Hennepin County Medical CenterHealthPartners Clinics
Sanford Health - Sioux FallsFairview Health Services Hospitals
Park Nicollet Health Services Hospitals
Percent Evidence-Based Screening
Medical Groups with <200 records are not displayed.
Evidence-Based Cervical Cancer Screening - Primary Care Pap Test Attribution
1/1/2011 - 12/31/2013
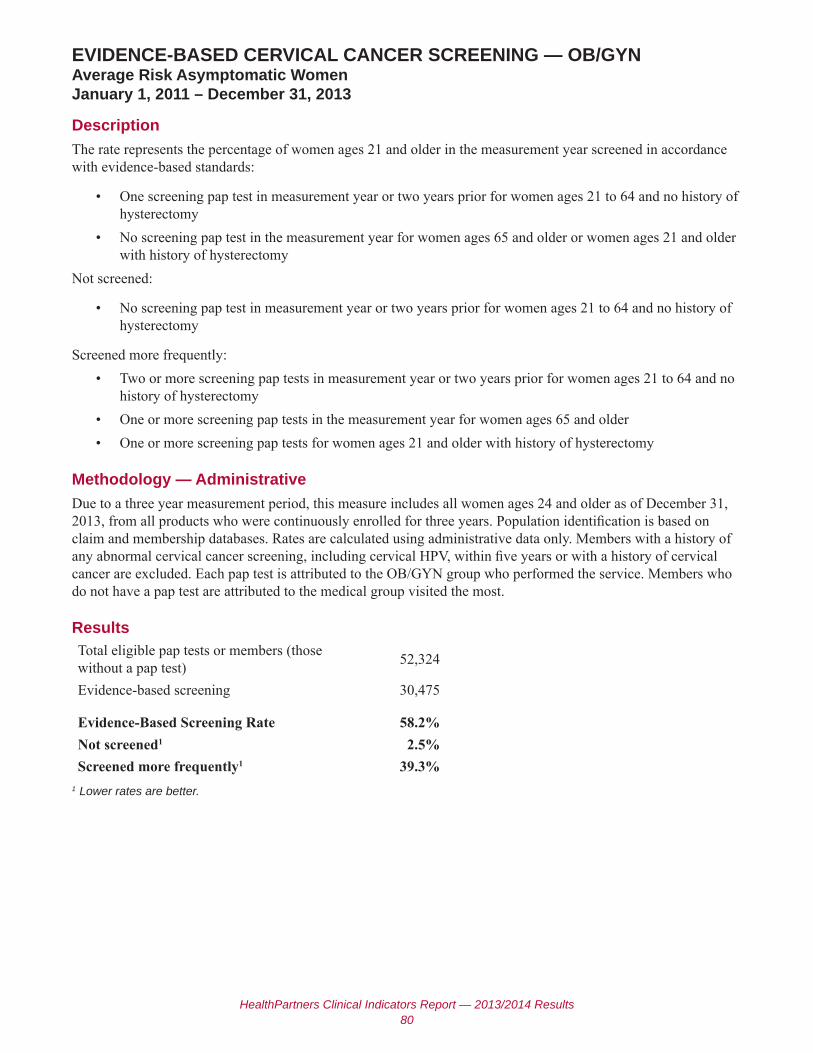
HealthPartners Clinical Indicators Report — 2013/2014 Results80
EVIDENCE-BASED CERVICAL CANCER SCREENING — OB/GYNAverage Risk Asymptomatic WomenJanuary 1, 2011 – December 31, 2013
DescriptionThe rate represents the percentage of women ages 21 and older in the measurement year screened in accordance with evidence-based standards:
• One screening pap test in measurement year or two years prior for women ages 21 to 64 and no history ofhysterectomy
• No screening pap test in the measurement year for women ages 65 and older or women ages 21 and older with history of hysterectomy
Not screened:
• No screening pap test in measurement year or two years prior for women ages 21 to 64 and no history of hysterectomy
Screened more frequently:• Two or more screening pap tests in measurement year or two years prior for women ages 21 to 64 and no
history of hysterectomy• One or more screening pap tests in the measurement year for women ages 65 and older• One or more screening pap tests for women ages 21 and older with history of hysterectomy
Methodology — AdministrativeDue to a three year measurement period, this measure includes all women ages 24 and older as of December 31, 2013, from all products who were continuously enrolled for three years. Population identifi cation is based on claim and membership databases. Rates are calculated using administrative data only. Members with a history of any abnormal cervical cancer screening, including cervical HPV, within fi ve years or with a history of cervical cancer are excluded. Each pap test is attributed to the OB/GYN group who performed the service. Members who do not have a pap test are attributed to the medical group visited the most.
ResultsTotal eligible pap tests or members (those without a pap test) 52,324
Evidence-based screening 30,475
Evidence-Based Screening Rate 58.2%Not screened1 2.5%Screened more frequently1 39.3%
1 Lower rates are better.

HealthPartners Clinical Indicators Report — 2013/2014 Results81
0% 10% 20% 30% 40% 50% 60% 70% 80% 90% 100%
Minnesota Gynecology and Surgery, LLCHealthPartners Central Minnesota Clinics, Inc
Clinic Sofia OB/GYN, PAOpen Cities Health Center
Stillwater Medical GroupLake Region Hospital
Obstetrics and Gynecology AssociatesPaul Larson OB/GYN Clinic, PA
St. Luke's ClinicsPremier ObGyn of MinnesotaPark Nicollet Health Services
Mankato Clinic, LtdCentraCare Clinics
Ridgeview ClinicsEssentia Health - SMDC Health System
Lakeview Clinic, LtdMayo Clinic
University of MN PhysiciansIntegrity - St. Cloud
Average GroupWestern Wisconsin Medical Associates, SC Clinics
Comprehensive Healthcare for Women, PAJohn A. Haugen Associates, PA
Women's Health ConsultantsPlanned Parenthood of MN, ND, SD
Fairview ClinicsMetropolitan Urologic Specialists, PA
HealthPartners ClinicsIntegrity - Buffalo
Hennepin County Medical CenterHealthEast
Allina HealthNorth Clinic, PA
St. Croix Regional Medical CenterMayo Clinic Health System - Red Wing
Sanford Health - FargoMayo Health System Clinics MN
Northfield Hospital ClinicsOlmsted Medical Center Clinics
FirstLight Health SystemHutchinson Health
Multicare Associates of the Twin CitiesAdvanced Specialty Care for Women, PA
Percent Evidence-Based Screening
Evidence-Based Cervical Cancer Screening - OB/GYN Providers Pap Test Attribution
1/1/2011 - 12/31/2013

HealthPartners Clinical Indicators Report — 2013/2014 Results82
CHILD AND TEEN CHECK-UPSJuly 1, 2012 – June 30, 2014
DescriptionThe rate represents the percentage of children ages six months to 20 years as of June 30, 2014, enrolled in Prepaid Medical Assistance Program (PMAP) or MinnesotaCare (MNCare) who had a preventive care visit within Child & Teen Check-Ups (C&TC) defi ned time periods:
• Last six months if age is six months through 17 months
• Last one year if age is 18 months through six years
• Last two years if age is seven years through 20 years
Methodology — AdministrativeThis measure includes all children ages six months to 20 years old from PMAP or MNCare products who were enrolled on June 30, 2014. Population identifi cation is based on encounter, claim and membership databases. Rates are calculated using administrative data only. Members are attributed to the provider group they were enrolled with on June 30, 2014.
Results
Total eligible members 50,799Preventive visits 26,815
C&TC Rate 52.8% (± 0.4)

HealthPartners Clinical Indicators Report — 2013/2014 Results83
0% 10% 20% 30% 40% 50% 60% 70% 80% 90% 100%
Mille Lacs Health System
Minnesota Rural Health Cooperative Clinics
Unity Family Healthcare
Osceola Medical Center
CentraCare Clinics
Integrity - St. Cloud
HealthEast
Foley Medical Center
Axis Medical Center
Fairview Lakes Clinics
Primary Care and Rehabilitation Clinics
Parkview Medical Clinic
Neighborhood Healthsource
Average Group
Stillwater Medical Group
Integrity - Buffalo
HealthPartners Central Minnesota Clinics, Inc
Lakeview Clinic, Ltd
Allina Health
Entira Family Clinics
Cedar Riverside People's Center
West Side Community Health Center
Park Nicollet Health Services
University of MN Physicians
Open Cities Health Center
Advanced Medical Clinic
St. Paul Family Medical Center
NorthPoint Health & Wellness Center
United Family Medicine
HealthPartners Clinics
Native American Community Clinic
Community Univ Health Care Center (CUHCC)
Indian Health Board of Minneapolis
Southside Community Health Services
Dr. Bobby Yang Medical Clinic
Percent with C&TC Visit
Child & Teen Check-Ups (C&TC)7/1/2012 - 6/30/2014
Confidence Interval

HealthPartners Clinical Indicators Report — 2013/2014 Results84
LEAD SCREENINGJuly 1, 2013 – June 30, 2014
DescriptionThe rate represents the percentage of children ages 12 to 30 months as of June 30, 2014, enrolled in Prepaid Medical Assistance Program (PMAP) or MinnesotaCare (MNCare) who had at least one lead test between July 1, 2013 and June 30, 2014.
Methodology — AdministrativeThis measure includes all children ages 12 to 30 months from PMAP or MNCare products who were enrolled on June 30, 2014. Population identifi cation is based on encounter, claim and membership databases. Rates are calcu-lated using administrative data only. Members are attributed to the provider group they were enrolled with on June 30, 2014.
Results
Total eligible members 4,687Lead screening test 2,737
Lead Screening Rate 58.4% (± 1.4)
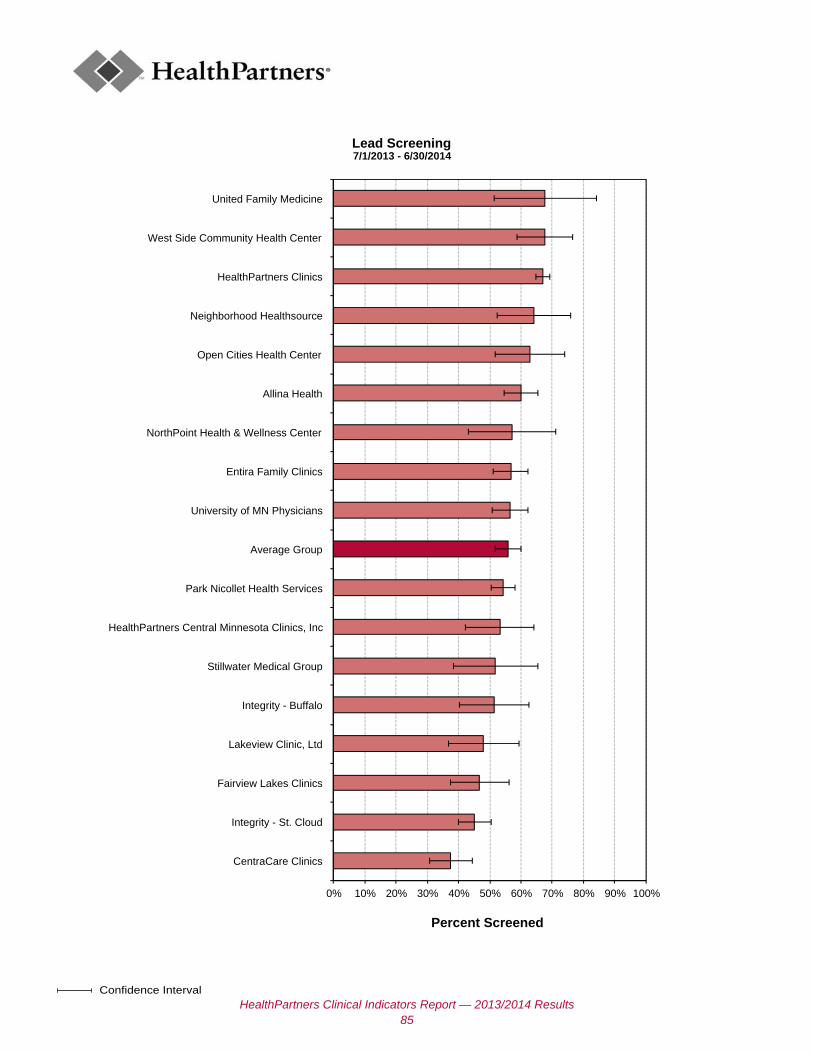
HealthPartners Clinical Indicators Report — 2013/2014 Results85
0% 10% 20% 30% 40% 50% 60% 70% 80% 90% 100%
CentraCare Clinics
Integrity - St. Cloud
Fairview Lakes Clinics
Lakeview Clinic, Ltd
Integrity - Buffalo
Stillwater Medical Group
HealthPartners Central Minnesota Clinics, Inc
Park Nicollet Health Services
Average Group
University of MN Physicians
Entira Family Clinics
NorthPoint Health & Wellness Center
Allina Health
Open Cities Health Center
Neighborhood Healthsource
HealthPartners Clinics
West Side Community Health Center
United Family Medicine
Percent Screened
Lead Screening7/1/2013 - 6/30/2014
Confidence Interval

HealthPartners Clinical Indicators Report — 2013/2014 Results86
CLINIC SAFETY ASSESSMENT SURVEY2014
DescriptionThis measure displays current provider group efforts related to six ambulatory patient safety topics.
Methodology — Provider Group SurveyPrimary care and specialty providers are surveyed on an annual basis. Results are self-reported. The six topics and related survey questions are:
1. Has your provider group developed and completed a Safety Culture Assessment Survey?
No assessmentAssessment completed; includes reporting system of incidents and near misses
Assessment and implementation of action plan(s) based on analysis of reported incidents
2. Has your provider group established a protocol for dispensing sample medications?
No protocolIf samples are provided to patients, there is a protocol established and implemented at all clinic sites.
Sampling eliminated at all clinic sites
3. Has your provider group established a protocol for members on chronic anticoagulation therapy?
No protocol Protocol established and implemented at all clinic sites
100% of all patients on chronic anticoagulation therapy are managed by protocol; protocol compliance monitored and documented
NA = We do not manage patients on anticoagulation therapy. 4. Has your provider group established a protocol for safe use of abbreviations?
No protocol Protocol established or EMR support implemented at all clinic sites
Compliance monitored and documented
5. Has your provider group established a protocol for medication refi lls?
No protocol Protocol established and implemented at all clinic sites
Compliance monitored and documented
6. Has your provider group established a protocol for use of controlled substances?
No protocol Protocol established and implemented at all clinic sites
Compliance monitored and documented
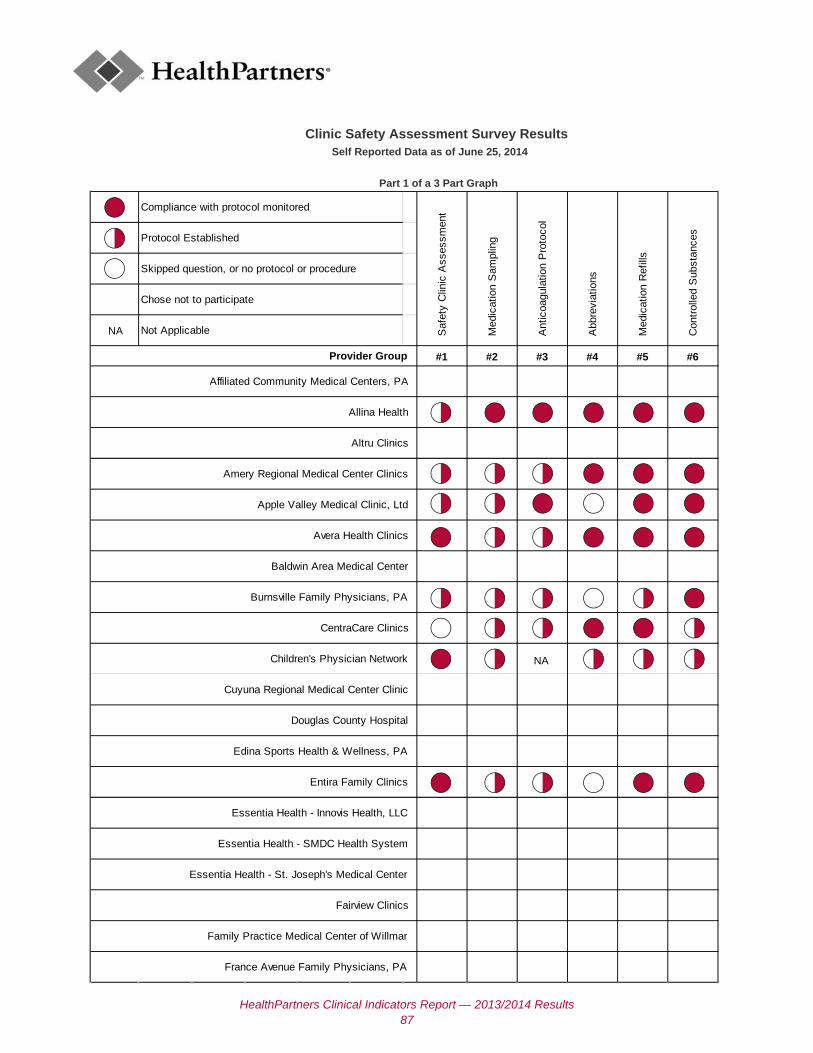
HealthPartners Clinical Indicators Report — 2013/2014 Results87
Clinic Safety Assessment Survey ResultsSelf Reported Data as of June 25, 2014
Part 1 of a 3 Part Graph
#1 #2 #3 #4 #5 #6
France Avenue Family Physicians, PA
Entira Family Clinics
Essentia Health - Innovis Health, LLC
Essentia Health - SMDC Health System
Essentia Health - St. Joseph's Medical Center
Fairview Clinics
Family Practice Medical Center of Willmar
Burnsville Family Physicians, PA
CentraCare Clinics
Children's Physician Network
Cuyuna Regional Medical Center Clinic
Douglas County Hospital
Edina Sports Health & Wellness, PA
Allina Health
Altru Clinics
Amery Regional Medical Center Clinics
Apple Valley Medical Clinic, Ltd
Avera Health Clinics
Baldwin Area Medical Center
Protocol Established
Skipped question, or no protocol or procedure
Chose not to participate
Not Applicable
Provider Group
Affiliated Community Medical Centers, PA
Compliance with protocol monitored
Saf
ety
Clin
ic A
sses
smen
t
Med
icat
ion
Sam
plin
g
Ant
icoa
gula
tion
Pro
toco
l
Abb
revi
atio
ns
Med
icat
ion
Ref
ills
Con
trolle
d S
ubst
ance
s
NA
NA

HealthPartners Clinical Indicators Report — 2013/2014 Results88
Clinic Safety Assessment Survey ResultsSelf Reported Data as of June 25, 2014
Part 2 of a 3 Part Graph
#1 #2 #3 #4 #5 #6
Mayo Health System Clinics WI
Multicare Associates of the Twin Cities
North Clinic, PA
Lake Region Hospital
Lakeview Clinic, Ltd
Lakewood Clinic
Mankato Clinic, Ltd
Mayo Clinic
Mayo Clinic Health System - Red Wing
Hennepin County Medical Center
Hutchinson Health
Integrity - Buffalo
Integrity - Northern
Integrity - St. Cloud
John A. Haugen Associates, PA
Grand Itasca Clinic & Hospital
Gundersen Lutheran Clinics
HealthEast
HealthPartners Clinics
HealthPartners Central Minnesota Clinics, Inc
Protocol Established
Skipped question, or no protocol or procedure
Chose not to participate
Not Applicable
Provider Group
Compliance with protocol monitored
Saf
ety
Clin
ic A
sses
smen
t
Med
icat
ion
Sam
plin
g
Ant
icoa
gula
tion
Pro
toco
l
Abb
revi
atio
ns
Med
icat
ion
Ref
ills
Con
trolle
d S
ubst
ance
s
NA

HealthPartners Clinical Indicators Report — 2013/2014 Results89
Clinic Safety Assessment Survey ResultsSelf Reported Data as of June 25, 2014
Part 3 of a 3 Part Graph
#1 #2 #3 #4 #5 #6
Med
icat
ion
Sam
plin
g
Ant
icoa
gula
tion
Pro
toco
l
Abb
revi
atio
ns
Med
icat
ion
Ref
ills
Con
trolle
d S
ubst
ance
s
Compliance with protocol monitored
Protocol Established
Chose not to participate
Not Applicable
Skipped question, or no protocol or procedure
Saf
ety
Clin
ic A
sses
smen
t
Winona Health Services
River Falls Medical Clinic
Sanford Health - Fargo
Southdale Pediatric Associates, Ltd
St. Croix Regional Medical Center
St. Luke's Clinics
Stillwater Medical Group
North Memorial Health Care
Northfield Hospital Clinics
Northwest Family Physicians, PA
OakLeaf Medical Network
Obstetrics and Gynecology Associates
Provider Group
University of MN Physicians
Unity Family Healthcare
Park Nicollet Health Services
Paul Larson OB/GYN Clinic, PA
Premier ObGyn of Minnesota
Ridgeview Clinics
Olmsted Medical Center Clinics
Osceola Medical Center
NA
NA
NA

HealthPartners Clinical Indicators Report — 2013/2014 Results90
PATIENT EXPERIENCE — MEDICATION SAFETY — PRIMARY CARE2013 Member Survey
DescriptionOn an annual basis, members with medications prescribed by primary care physicians are asked if they are satis-fi ed with the explanation provided by their clinic concerning the reasons for and side effects of the prescribed medication. The rate represents the percent of surveyed members responding with “very satisfi ed” on questions related to medication safety.
Methodology — Member SurveyPatient experience was determined through mail surveys conducted by HealthPartners in November and December 2013. Results were distributed to provider groups second quarter, 2014. The measures include a random sample of members ages 18 years and older. Primary care results include commercial members only. The data were weighted to equal sample sizes of 200. The results were also weighted to control for self-reported health status. Results are reported for 38 primary care groups.
Survey Questions - Primary CareHow satisfi ed were you with your clinic on explanations you received about the reason for any prescribed 1. medicines? How satisfi ed were you with your clinic on information you received about any side effects of your 2. medicines?
Results
Primary Care - 2013 Explanation InformationTotal members responding 7,453 6,460Total members with prescribed medications 2,919 2,103Very satisfi ed 39.2% 32.6%

HealthPartners Clinical Indicators Report — 2013/2014 Results91
0% 10% 20% 30% 40% 50% 60% 70% 80% 90% 100%
Altru Clinics
Hutchinson Medical Center, PA
Mayo Health System Clinics MN
Mayo Clinic Health System - Red Wing
Sanford Health - Fargo
Apple Valley Medical Clinic, Ltd
Essentia Health - St. Mary's Regional Health Center
St. Croix Regional Medical Center
Affiliated Community Medical Centers, PA
Western Wisconsin Medical Associates, SC Clinics
Multicare Associates of the Twin Cities
Ridgeview Clinics
CentraCare Clinics
Amery Regional Medical Center Clinics
Essentia Health
Integrity - St. Cloud
Stillwater Medical Group
Fairview Clinics
Average Group
Integrity - Buffalo
Lakeview Clinic, Ltd
Northwest Family Physicians, PA
Minnesota Rural Health Cooperative Clinics
HealthPartners Clinics
Park Nicollet Health Services
New Richmond Clinic
Mayo Health System Clinics WI
HealthPartners Central Minnesota Clinics, Inc
North Clinic, PA
Allina Health
North Memorial Health Care
Essentia Health - St. Joseph's Medical Center
HealthEast
St. Luke's Clinics
Olmsted Medical Center Clinics
University of MN Physicians
Essentia Health - Innovis Health, LLC
Mayo Clinic
Entira Family Clinics
Percent Very Satisfied
Patient Experience Medication Safety - Primary Care 2013 Member Survey
How satisfied are you with the explanations you received about the reason for the medicines?

HealthPartners Clinical Indicators Report — 2013/2014 Results92
0% 10% 20% 30% 40% 50% 60% 70% 80% 90% 100%
Altru Clinics
Mayo Clinic Health System - Red Wing
Hutchinson Medical Center, PA
Multicare Associates of the Twin Cities
CentraCare Clinics
Affiliated Community Medical Centers, PA
Fairview Clinics
Apple Valley Medical Clinic, Ltd
HealthPartners Clinics
Mayo Health System Clinics MN
Lakeview Clinic, Ltd
Sanford Health - Fargo
Western Wisconsin Medical Associates, SC Clinics
Allina Health
North Memorial Health Care
Integrity - St. Cloud
Essentia Health - St. Mary's Regional Health Center
Stillwater Medical Group
Ridgeview Clinics
Average Group
New Richmond Clinic
Park Nicollet Health Services
Essentia Health - St. Joseph's Medical Center
HealthPartners Central Minnesota Clinics, Inc
Amery Regional Medical Center Clinics
HealthEast
Essentia Health
University of MN Physicians
Northwest Family Physicians, PA
Minnesota Rural Health Cooperative Clinics
Integrity - Buffalo
North Clinic, PA
St. Croix Regional Medical Center
Mayo Health System Clinics WI
Olmsted Medical Center Clinics
St. Luke's Clinics
Mayo Clinic
Entira Family Clinics
Essentia Health - Innovis Health, LLC
Percent Very Satisfied
Patient Experience Medication Safety - Primary Care 2013 Member Survey
How satisfied are you with the information you received about any side effects of the medicines?

HealthPartners Clinical Indicators Report — 2013/2014 Results93
PATIENT EXPERIENCE — MEDICATION SAFETY — SPECIALTY CARE2014 Member Survey
DescriptionOn an annual basis, members with medications prescribed by specialty care physicians are asked if they are sat-isfi ed with the explanation provided by their clinic concerning the reasons for and side effects of the prescribed medication. The rate represents the percent of surveyed members responding with “very satisfi ed” on questions related to medication safety.
Methodology — Member SurveyPatient experience was determined through mail surveys conducted by HealthPartners in February and March 2014. Results were distributed to provider groups second quarter, 2014. OB/GYN includes a random sample of members ages 18 years and older. Cardiology, ENT and Orthopaedics include a random sample of members that includes both adults and children. Specialty care results include members enrolled in commercial, Medicare or Medicaid products. The data were weighted to equal sample sizes of 100. The results were also weighted to control for self-reported health status. Results are reported for 12 cardiology, 16 ENT, 16 OB/GYN and 17 orthopaedic groups.
Survey Questions - Specialty CareHow satisfi ed are you with the explanations you received about the reason for the medicines? 1. How satisfi ed are you with the information you received about any side effects of the medicines?2.
Results
Cardiology - 2014Total members responding 1288Total members with prescribed medications 772Very satisfi ed - explanation for prescribed medications 58.0%Very satisfi ed - information received about side effects 50.3%
ENT - 2014 Total members responding 1157Total members with prescribed medications 545Very satisfi ed - explanation for prescribed medications 58.1%Very satisfi ed - information received about side effects 50.4%
OB/GYN - 2014 Total members responding 1252Total members with prescribed medications 711
Very satisfi ed - explanation for prescribed medications 63.5%
Very satisfi ed - information received about side effects 57.7%
Orthopaedics - 2014 Total members responding 1647Total members with prescribed medications 733
Very satisfi ed - explanation for prescribed medications 64.5%
Very satisfi ed - information received about side effects 57.2%

HealthPartners Clinical Indicators Report — 2013/2014 Results94
0% 10% 20% 30% 40% 50% 60% 70% 80% 90% 100%
HealthPartners Clinics
HealthEast Heart Care
CentraCare Clinics
United Heart and Vascular Clinic
Park Nicollet Health Services
Minneapolis Heart Institute
Average Group
Fairview Clinics
Essentia Health - SMDC Health System
Metropolitan Heart & Vascular Institute
North Memorial Cardiovascular Services
Children's Health Care
Mayo Clinic
Percent Very Satisfied
Patient Experience Medication Safety - Cardiology Providers 2014 Member Survey
How satisfied are you with the explanations you receivedabout the reason for the medicines?

HealthPartners Clinical Indicators Report — 2013/2014 Results95
0% 10% 20% 30% 40% 50% 60% 70% 80% 90% 100%
HealthEast Heart Care
CentraCare Clinics
HealthPartners Clinics
Minneapolis Heart Institute
United Heart and Vascular Clinic
Park Nicollet Health Services
North Memorial Cardiovascular Services
Average Group
Fairview Clinics
Metropolitan Heart & Vascular Institute
Essentia Health - SMDC Health System
Children's Health Care
Mayo Clinic
Percent Very Satisfied
Patient Experience Medication Safety - Cardiology Providers 2014 Member Survey
How satisfied are you with the information you received about any side effects of the medicines?

HealthPartners Clinical Indicators Report — 2013/2014 Results96
0% 10% 20% 30% 40% 50% 60% 70% 80% 90% 100%
St. Cloud Ear, Nose & Throat - Head & Neck Clinic
Stillwater Medical Group
Minneapolis Otolaryngology, PA
Allina Health
Integrity - Northern
Ridgeview Clinics
Children's Health Care
Fairview Clinics
Average Group
Paparella Ear Head & Neck Institute, PA
HealthPartners Clinics
Midwest Ear, Nose & Throat Specialists
ENT Specialty Care
Park Nicollet Health Services
Essentia Health - SMDC Health System
Oakdale Ear, Nose and Throat Clinic, PA
University of MN Physicians
Percent Very Satisfied
Patient Experience Medication Safety - ENT Providers2014 Member Survey
How satisfied are you with the explanations you receivedabout the reason for the medicines?
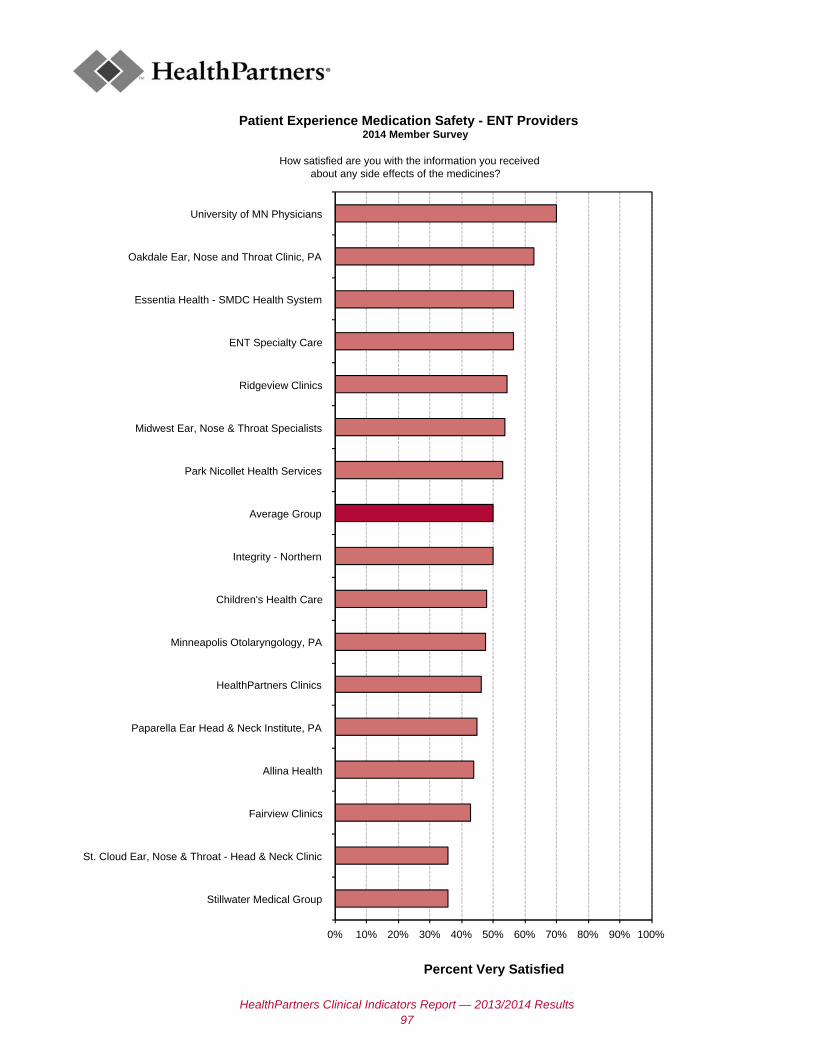
HealthPartners Clinical Indicators Report — 2013/2014 Results97
0% 10% 20% 30% 40% 50% 60% 70% 80% 90% 100%
Stillwater Medical Group
St. Cloud Ear, Nose & Throat - Head & Neck Clinic
Fairview Clinics
Allina Health
Paparella Ear Head & Neck Institute, PA
HealthPartners Clinics
Minneapolis Otolaryngology, PA
Children's Health Care
Integrity - Northern
Average Group
Park Nicollet Health Services
Midwest Ear, Nose & Throat Specialists
Ridgeview Clinics
ENT Specialty Care
Essentia Health - SMDC Health System
Oakdale Ear, Nose and Throat Clinic, PA
University of MN Physicians
Percent Very Satisfied
Patient Experience Medication Safety - ENT Providers 2014 Member Survey
How satisfied are you with the information you received about any side effects of the medicines?

HealthPartners Clinical Indicators Report — 2013/2014 Results98
0% 10% 20% 30% 40% 50% 60% 70% 80% 90% 100%
North Clinic, PA
CentraCare Clinics
Integrity - Buffalo
Fairview Clinics
Stillwater Medical Group
John A. Haugen Associates, PA
St. Luke's Clinics
Premier ObGyn of Minnesota
Ridgeview Clinics
Average Group
Women's Health Consultants
Mayo Health System Clinics MN
Allina Health
Obstetrics and Gynecology Associates
Park Nicollet Health Services
Essentia Health - SMDC Health System
HealthPartners Clinics
Percent Very Satisfied
Patient Experience Medication Safety - OB/GYN Providers 2014 Member Survey
How satisfied are you with the explanations you receivedabout the reason for the medicines?

HealthPartners Clinical Indicators Report — 2013/2014 Results99
0% 10% 20% 30% 40% 50% 60% 70% 80% 90% 100%
Stillwater Medical Group
North Clinic, PA
CentraCare Clinics
Fairview Clinics
St. Luke's Clinics
Premier ObGyn of Minnesota
Obstetrics and Gynecology Associates
Allina Health
Integrity - Buffalo
Average Group
John A. Haugen Associates, PA
Women's Health Consultants
Mayo Health System Clinics MN
Ridgeview Clinics
Essentia Health - SMDC Health System
HealthPartners Clinics
Park Nicollet Health Services
Percent Very Satisfied
Patient Experience Medication Safety - OB/GYN Providers 2014 Member Survey
How satisfied are you with the information you received about any side effects of the medicines?

HealthPartners Clinical Indicators Report — 2013/2014 Results100
0% 10% 20% 30% 40% 50% 60% 70% 80% 90% 100%
St. Cloud Orthopedic Associates, Ltd
Integrity - Northern
St. Croix Orthopaedics, PA
Summit Orthopedics, Ltd
University of MN Physicians
Northern Orthopedics, Ltd
Fairview Clinics
Orthopaedic & Fracture Clinic, PA
HealthPartners Clinics
Allina Health
Average Group
Park Nicollet Health Services
Essentia Health - SMDC Health System
TRIA Orthopaedic Center, LLC
Twin Cities Orthopedics, PA
Twin Cities Spine Center
Mayo Clinic
Gillette Children's Specialty Healthcare
Percent Very Satisfied
Patient Experience Medication Safety - Orthopaedic Providers 2014 Member Survey
How satisfied are you with the explanations you receivedabout the reason for the medicines?

HealthPartners Clinical Indicators Report — 2013/2014 Results101
0% 10% 20% 30% 40% 50% 60% 70% 80% 90% 100%
Integrity - Northern
St. Croix Orthopaedics, PA
St. Cloud Orthopedic Associates, Ltd
Northern Orthopedics, Ltd
Summit Orthopedics, Ltd
Orthopaedic & Fracture Clinic, PA
University of MN Physicians
Park Nicollet Health Services
Fairview Clinics
Average Group
Allina Health
HealthPartners Clinics
Mayo Clinic
Twin Cities Spine Center
TRIA Orthopaedic Center, LLC
Twin Cities Orthopedics, PA
Essentia Health - SMDC Health System
Gillette Children's Specialty Healthcare
Percent Very Satisfied
Patient Experience Medication Safety - Orthopaedic Providers 2014 Member Survey
How satisfied are you with the information you received about any side effects of the medicines?

HealthPartners Clinical Indicators Report — 2013/2014 Results102
TOBACCO USE AND CESSATION2013 Member Survey
DescriptionThe rate represents the percent of members who indicated they used tobacco products and recalled receiving tobacco cessation assistance or preventive advice related to tobacco use during the past year.
Methodology — Member SurveyTobacco status was determined through a mail survey conducted by HealthPartners in November and December 2013. The measures include a random sample of commercial members ages 18 years and older from 38 primary care medical groups for the adult survey and 21 primary care medical groups for the children’s survey. The data were weighted to equal sample sizes of 200 for adults and 100 for children and to control for self-reported health status. For the child’s portion of the interview, the adult most knowledgeable about the child’s medical care was asked to complete the survey.
Survey QuestionsDuring the past year, have you used tobacco products such as cigarettes, cigars, pipes, snuff or chewing 1. tobacco?At your last appointment, were you offered assistance to help you stop using tobacco? Assistance could 2. include the nicotine patch, Zyban, phone counseling, a follow-up appointment at your clinic or written materials.During the past year, have any of your children been exposed to secondhand smoke at home or day care?3.
Results*
Adult Tobacco Prevalence Rate1 9.0% (± 0.7)Adult Tobacco Assist Rate 65.2% (± 3.7)Secondhand Smoke Exposure Rate1 3.2% (± 0.8)
1 A lower percentage is desirable.* All rates are weighted by the eligible population of the provider groups displayed.

HealthPartners Clinical Indicators Report — 2013/2014 Results103
0% 10% 20% 30% 40% 50% 60% 70% 80% 90% 100%
Altru Clinics
Northwest Family Physicians, PA
Integrity - Buffalo
Amery Regional Medical Center Clinics
Essentia Health
Hutchinson Medical Center, PA
Integrity - St. Cloud
Sanford Health - Fargo
HealthPartners Clinics
Essentia Health - St. Joseph's Medical Center
Mayo Health System Clinics WI
Affiliated Community Medical Centers, PA
Ridgeview Clinics
Olmsted Medical Center Clinics
Entira Family Clinics
North Memorial Health Care
New Richmond Clinic
Mayo Health System Clinics MN
St. Croix Regional Medical Center
HealthEast
Average Group
Stillwater Medical Group
Multicare Associates of the Twin Cities
Essentia Health - St. Mary's Regional Health Center
Fairview Clinics
Minnesota Rural Health Cooperative Clinics
HealthPartners Central Minnesota Clinics, Inc
Apple Valley Medical Clinic, Ltd
Western Wisconsin Medical Associates, SC Clinics
CentraCare Clinics
Allina Health
Essentia Health - Innovis Health, LLC
St. Luke's Clinics
Lakeview Clinic, Ltd
University of MN Physicians
Mayo Clinic
Mayo Clinic Health System - Red Wing
Park Nicollet Health Services
North Clinic, PA
Percent Reporting Tobacco Use
Tobacco - Adult - Prevalence 2013 Member Survey
Confidence Interval
Note: A lower percent is desirable
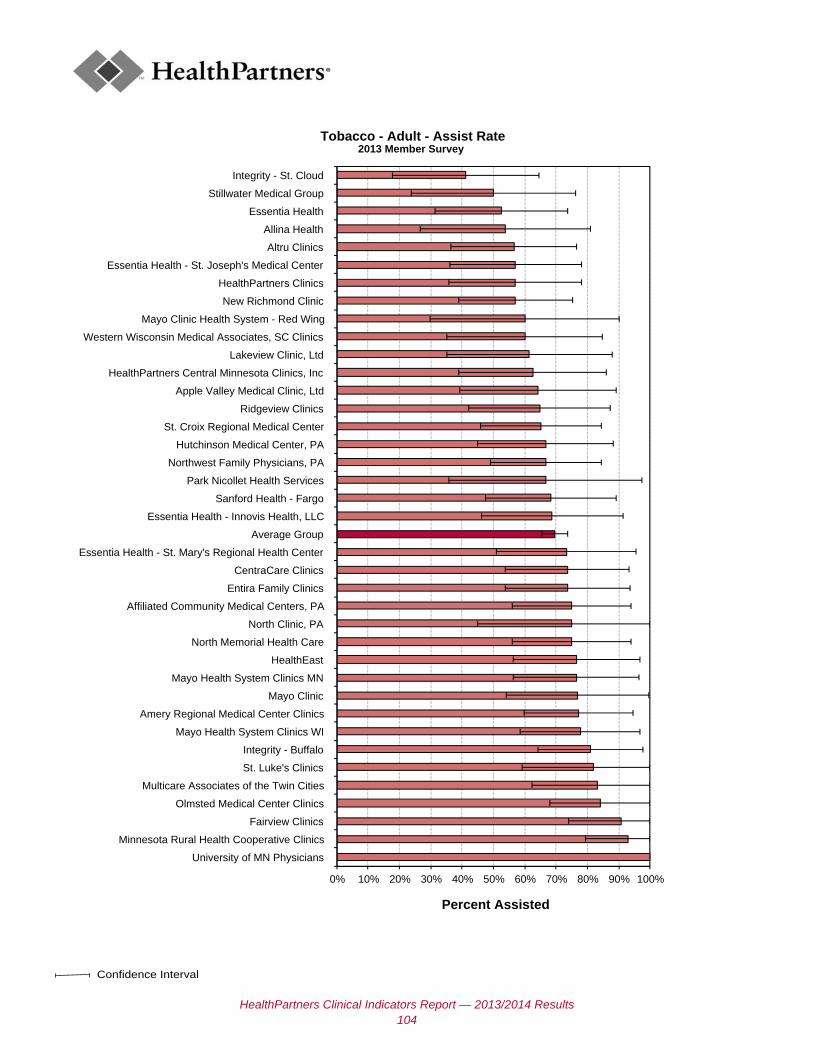
HealthPartners Clinical Indicators Report — 2013/2014 Results104
0% 10% 20% 30% 40% 50% 60% 70% 80% 90% 100%
University of MN Physicians
Minnesota Rural Health Cooperative Clinics
Fairview Clinics
Olmsted Medical Center Clinics
Multicare Associates of the Twin Cities
St. Luke's Clinics
Integrity - Buffalo
Mayo Health System Clinics WI
Amery Regional Medical Center Clinics
Mayo Clinic
Mayo Health System Clinics MN
HealthEast
North Memorial Health Care
North Clinic, PA
Affiliated Community Medical Centers, PA
Entira Family Clinics
CentraCare Clinics
Essentia Health - St. Mary's Regional Health Center
Average Group
Essentia Health - Innovis Health, LLC
Sanford Health - Fargo
Park Nicollet Health Services
Northwest Family Physicians, PA
Hutchinson Medical Center, PA
St. Croix Regional Medical Center
Ridgeview Clinics
Apple Valley Medical Clinic, Ltd
HealthPartners Central Minnesota Clinics, Inc
Lakeview Clinic, Ltd
Western Wisconsin Medical Associates, SC Clinics
Mayo Clinic Health System - Red Wing
New Richmond Clinic
HealthPartners Clinics
Essentia Health - St. Joseph's Medical Center
Altru Clinics
Allina Health
Essentia Health
Stillwater Medical Group
Integrity - St. Cloud
Percent Assisted
Tobacco - Adult - Assist Rate 2013 Member Survey
Confidence Interval

HealthPartners Clinical Indicators Report — 2013/2014 Results105
0% 10% 20% 30% 40% 50% 60% 70% 80% 90% 100%
Sanford Health - Fargo
Mayo Health System Clinics MN
Integrity - Buffalo
Entira Family Clinics
CentraCare Clinics
HealthPartners Clinics
Fairview Clinics
Essentia Health - St. Mary's Regional Health Center
Allina Health
Stillwater Medical Group
Children's Physician Network
Average Group
Minnesota Rural Health Cooperative Clinics
HealthEast
Affiliated Community Medical Centers, PA
St. Luke's Clinics
North Memorial Health Care
HealthPartners Central Minnesota Clinics, Inc
Southdale Pediatric Associates, Ltd
Lakeview Clinic, Ltd
Western Wisconsin Medical Associates, SC Clinics
Park Nicollet Health Services
Percent Exposed
Tobacco - Children - Second Hand Smoke Exposure 2013 Member Survey
Confidence Interval
Note: A lower percent is desirable

HealthPartners Clinical Indicators Report — 2013/2014 Results106
TOTAL COST OF CARE AND RESOURCE USE — PRIMARY CARE January 1, 2013 – December 31, 2013
DescriptionMedical groups risk adjusted cost and resource use effectiveness at managing their primary care attributed popula-tion. Total cost of care is a measure of effi ciency, intensity and price of care delivered compared to the average for similar primary care providers while resource use is a measure of effi ciency and intensity, removing the effects of price. The total cost and resource use measures include all services and procedures across all sectors of care (e.g.: physician services, lab tests, x-rays, pharmacy, specialists, and hospitals). In 2013, this HealthPartners-developed measure became one of the fi rst measures of resource use and cost to be endorsed by the National Quality Forum.
MethodologyThese measures are based on commercial fully insured and self insured members ages 64 and under who are enrolled for a minimum of nine months. These members are attributed to the medical group that provides the majority of primary care offi ce visits as determined by the specialty of the servicing physician. These include family practice, internal medicine, pediatrics, geriatrics and obstetrics and gynecology specialties. All care members receive are assigned a relative resource use value using HealthPartners’ patented algorithm, Total Care Relative Resource Values or TCRRVs. These values quantify resource use for all procedures and services across all sectors of the health care system.
Attributed members are assigned Adjusted Clinical Groups (ACG) risk adjustment scores based on all diagnoses, age and gender and are aggregated to the provider group level. ACGs, developed by Johns Hopkins University, represent the illness burden of a population and allow comparisons between populations with varying illness burdens.
Medical costs, pharmacy costs and resources use for each attributed member are totaled with outliers being capped at $100,000. Each provider group’s attributed member costs, resource use and risk scores are aggregated to create risk adjusted per member per month values. Total cost of care and resource use indices are created by dividing each provider’s risk adjusted per member per month value by the respective 11 county metro area risk adjusted per member per month value.
ResultsHealthPartners 11 County Metro Network Average: 1.000
Total Cost Indices > 1.000 represent providers that are more expensive than average
Total Cost Indices < 1.000 represent providers that are less expensive than average
Resource Use Indices > 1.000 represent providers that have higher resource use than average
Resource Use Indices < 1.000 represent providers that have lower resource use than average

HealthPartners Clinical Indicators Report — 2013/2014 Results107
HealthPartners 11 County Metro Network Average: 1.000Indices > 1.000 represent providers that are more expensive than averageIndices < 1.000 represent providers that are less expensive than average
0.0 0.5 1.0 1.5 2.0 2.5
Mayo ClinicGundersen Lutheran Clinics
Olmsted Medical Center ClinicsWinona Health Services
Sanford Health - Sioux FallsMayo Health System Clinics MN
Essentia Health - East RegionAvera Health Clinics
University of MN PhysiciansLakewood Health System
Integrity - NorthernMankato Clinic, Ltd
Altru ClinicsMayo Clinic Health System - Red Wing
Lake Region HospitalSt. Croix Regional Medical Center
St. Luke's ClinicsOsceola Medical Center
Minnesota Rural Health Cooperative ClinicsHutchinson Health
Baldwin Area Medical CenterWestern Wisconsin Medical Associates, SC Clinics
Affiliated Community Medical Centers, PAHennepin County Medical Center
Grand Itasca Clinic & HospitalWestfields Hospital
Unity Family HealthcareSanford Health - Fargo
Essentia Health - Central RegionApple Valley Medical Clinic, LtdEssentia Health - West Region
Allina HealthNorthfield Hospital Clinics
Park Nicollet Health ServicesLakeview Clinic, Ltd
Multicare Associates of the Twin CitiesCentraCare Clinics
Amery Regional Medical Center ClinicsRidgeview Clinics
HealthEastFairview Clinics
11 County Metro AverageHudson Physicians
France Avenue Family Physicians, PAEntira Family Clinics
Integrity - BuffaloHealthPartners Clinics
North Memorial Health CareStillwater Medical Group
HealthPartners Central Minnesota Clinics, IncBurnsville Family Physicians, PANorthwest Family Physicians, PA
Integrity - St. CloudDouglas County Hospital
North Clinic, PA
Total Cost Index (TCI)Providers with <600 attributed members are not displayed.
Total Cost of Care - Primary Care, Total Cost Index (TCI) 1/1/2013 - 12/31/2013
Note: A lower index is desirable

HealthPartners Clinical Indicators Report — 2013/2014 Results108
HealthPartners 11 County Metro Network Average: 1.000Indices > 1.000 represent providers that are more expensive than averageIndices < 1.000 represent providers that are less expensive than average
0.0 0.5 1.0 1.5 2.0 2.5
Mayo ClinicUniversity of MN Physicians
Unity Family HealthcareLake Region Hospital
Multicare Associates of the Twin CitiesWestfields Hospital
St. Croix Regional Medical CenterApple Valley Medical Clinic, Ltd
Ridgeview ClinicsLakeview Clinic, Ltd
Essentia Health - East RegionAltru Clinics
Osceola Medical CenterEntira Family Clinics
North Memorial Health CareHudson Physicians
Hennepin County Medical CenterHealthEast
St. Luke's ClinicsPark Nicollet Health Services
Integrity - NorthernHutchinson HealthCentraCare Clinics
Avera Health ClinicsAllina Health
Western Wisconsin Medical Associates, SC ClinicsMinnesota Rural Health Cooperative Clinics
France Avenue Family Physicians, PAStillwater Medical Group
Mankato Clinic, LtdEssentia Health - Central Region
HealthPartners ClinicsHealthPartners Central Minnesota Clinics, Inc
Fairview ClinicsSanford Health - Sioux Falls
Baldwin Area Medical CenterSanford Health - Fargo
Northwest Family Physicians, PANorth Clinic, PA
Integrity - BuffaloEssentia Health - West Region
Mayo Clinic Health System - Red WingIntegrity - St. Cloud
Winona Health ServicesOlmsted Medical Center Clinics
Gundersen Lutheran ClinicsBurnsville Family Physicians, PA
Affiliated Community Medical Centers, PALakewood Health System
Grand Itasca Clinic & HospitalNorthfield Hospital Clinics
Mayo Health System Clinics MNDouglas County Hospital
Amery Regional Medical Center Clinics
Resource Use Index (RUI)Providers with <600 attributed members are not displayed.
Total Cost of Care - Primary Care, Resource Use Index (RUI) 1/1/2013 - 12/31/2013
Note: A lower index is desirable

HealthPartners Clinical Indicators Report — 2013/2014 Results109
TOTAL COST INDEX AND RESOURCE USE — SPECIALTY CARE October 1, 2011 – September 30, 2013
DescriptionMedical group’s case mix and risk adjusted cost and resource use effectiveness at managing their attributed patient’s episodes of care.
The total cost index is a measure of the effi ciency, intensity and price of care delivered compared to the same specialty average for the same case mix and risk profi le of episodes. The resource use index is identical to the total cost index; however it removes the effects of price. Total cost and resource use measures include all care includ-ing: hospital, professional, ancillary and pharmacy costs.
MethodologyThese measures are based on episodes treatment groups (ETGs) for commercial fully insured and self insured members where episodes are completed, non outliers and the member is continuously enrolled throughout the duration of the episode. ETGs group all care received related to a condition into a defi ned episode of care. All care members receive are assigned a relative resource use value using HealthPartners’ patented algorithm, Total Care Relative Resource Values or TCRRVs. These values quantify resource use for all procedures and services across all sectors of the health care system. Providers are attributed to episodes where they represent at least 25% of management and surgery resources for the episode. The episodes included in the measures are case mix and severity adjusted by specialty and excludes all trauma and transplants. Total cost of care and resource use indices are created for each specialty by dividing each provider’s risk actual cost or resource use by the 11 county metro expected values.
ResultsHealthPartners 11 County Metro Network Average: 1.000
Total Cost Indices > 1.000 represent providers that are more expensive than average
Total Cost Indices < 1.000 represent providers that are less expensive than average
Resource Use Indices > 1.000 represent providers that have higher resource use than average
Resource Use Indices < 1.000 represent providers that have lower resource use than average

HealthPartners Clinical Indicators Report — 2013/2014 Results110
0.0 0.5 1.0 1.5 2.0 2.5
Mayo Clinic
Essentia Health - SMDC Health System
Allina Health
HealthEast Heart Care
11 County Metro Average
Park Nicollet Health Services
HealthPartners Clinics
University of MN Physicians Heart at Fairview
CentraCare Clinics
North Memorial Cardiovascular Services
Total Cost Index (TCI)Providers with <300 attributed members are not displayed.
Total Cost Index (TCI) - Cardiology Providers 10/1/2011 - 9/30/2013
Note: A lower index is desirable
HealthPartners 11 County Metro Network Average: 1.000Indices > 1.000 represent providers that are more expensive than averageIndices < 1.000 represent providers that are less expensive than average

HealthPartners Clinical Indicators Report — 2013/2014 Results111
0.0 0.5 1.0 1.5 2.0 2.5
Mayo Clinic
HealthPartners Clinics
Park Nicollet Health Services
HealthEast Heart Care
North Memorial Cardiovascular Services
Allina Health
University of MN Physicians Heart at Fairview
CentraCare Clinics
Essentia Health - SMDC Health System
Resource Use Index (RUI)Providers with <300 attributed members are not displayed.
Resource Use Index (RUI) - Cardiology Providers 10/1/2011 - 9/30/2013
Note: A lower index is desirable
HealthPartners 11 County Metro Network Average: 1.000Indices > 1.000 represent providers that have higher than average resource useIndices < 1.000 represent providers that have lower than average resource use

HealthPartners Clinical Indicators Report — 2013/2014 Results112
0.0 0.5 1.0 1.5 2.0 2.5
Mayo Clinic
University of MN Physicians
Mayo Health System Clinics MN
St. Croix Regional Medical Center
Essentia Health - SMDC Health System
Allina Health
Oakdale Ear, Nose And Throat Clinic, PA
Park Nicollet Health Services
Fairview Clinics
Ear, Nose & Throat SpecialtyCare of Minnesota, PA
11 County Metro Average
Ear, Nose and Throat Clinic and Hearing Center
Paparella Ear Head & Neck Institute, PA
HealthPartners Clinics
Ridgeview Clinics
Minneapolis Otolaryngology, PA
Integrity - Northern
St. Cloud Ear, Nose & Throat - Head & Neck Clinic
Midwest Ear, Nose & Throat Specialists
Southdale Otolaryngology, PA
Stillwater Medical Group
Total Cost Index (TCI)Providers with <300 attributed members are not displayed.
Total Cost Index (TCI) - ENT Providers 10/1/2011 - 9/30/2013
Note: A lower index is desirable
HealthPartners 11 County Metro Network Average: 1.000Indices > 1.000 represent providers that are more expensive than averageIndices < 1.000 represent providers that are less expensive than average

HealthPartners Clinical Indicators Report — 2013/2014 Results113
0.0 0.5 1.0 1.5 2.0 2.5
Mayo Clinic
University of MN Physicians
Oakdale Ear, Nose And Throat Clinic, PA
Paparella Ear Head & Neck Institute, PA
Ear, Nose and Throat Clinic and Hearing Center
St. Croix Regional Medical Center
Fairview Clinics
St. Cloud Ear, Nose & Throat - Head & Neck Clinic
Minneapolis Otolaryngology, PA
Ear, Nose & Throat SpecialtyCare of Minnesota, PA
HealthPartners Clinics
Essentia Health - SMDC Health System
Park Nicollet Health Services
Midwest Ear, Nose & Throat Specialists
Allina Health
Ridgeview Clinics
Southdale Otolaryngology, PA
Mayo Health System Clinics MN
Integrity - Northern
Stillwater Medical Group
Resource Use Index (RUI)Providers with <300 attributed members are not displayed.
Resource Use Index (RUI) - ENT Providers 10/1/2011 - 9/30/2013
Note: A lower index is desirable
HealthPartners 11 County Metro Network Average: 1.000Indices > 1.000 represent providers that have higher than average resource useIndices < 1.000 represent providers that have lower than average resource use

HealthPartners Clinical Indicators Report — 2013/2014 Results114
HealthPartners 11 County Metro Network Average: 1.000Indices > 1.000 represent providers that are more expensive than averageIndices < 1.000 represent providers that are less expensive than average
0.0 0.5 1.0 1.5 2.0 2.5
Mayo Health System Clinics MN
Essentia Health - SMDC Health System
Mankato Clinic, Ltd
University of MN Physicians
St. Croix Regional Medical Center
St. Luke's Clinics
Allina Health
Park Nicollet Health Services
Fairview Clinics
Adefris & Toppin Women’s Specialists, MD, PC
Western Wisconsin Medical Associates, SC Clinics
CentraCare Clinics
11 County Metro Average
Clinic Sofia OB/GYN, PA
Multicare Associates of the Twin Cities
HealthPartners Clinics
Obstetrics and Gynecology Associates
Premier ObGyn of Minnesota
Minnesota Gynecology and Surgery, LLC
Paul Larson OB/GYN Clinic, PA
John A. Haugen Associates, PA
Integrity - Buffalo
HealthEast
Comprehensive Healthcare for Women, PA
North Clinic, PA
Ridgeview Clinics
Stillwater Medical Group
Total Cost Index (TCI)Providers with <600 attributed members are not displayed.
Total Cost Index (TCI) - OB/GYN Providers 10/1/2011 - 9/30/2013
Note: A lower index is desirable

HealthPartners Clinical Indicators Report — 2013/2014 Results115
HealthPartners 11 County Metro Network Average: 1.000Indices > 1.000 represent providers that are more expensive than averageIndices < 1.000 represent providers that are less expensive than average
0.0 0.5 1.0 1.5 2.0 2.5
Clinic Sofia OB/GYN, PA
Multicare Associates of the Twin Cities
St. Croix Regional Medical Center
Adefris & Toppin Women’s Specialists, MD, PC
University of MN Physicians
Essentia Health - SMDC Health System
CentraCare Clinics
Obstetrics and Gynecology Associates
Fairview Clinics
St. Luke's Clinics
Premier ObGyn of Minnesota
North Clinic, PA
Mankato Clinic, Ltd
Park Nicollet Health Services
HealthPartners Clinics
Ridgeview Clinics
Paul Larson OB/GYN Clinic, PA
Allina Health
Western Wisconsin Medical Associates, SC Clinics
Minnesota Gynecology and Surgery, LLC
Integrity - Buffalo
HealthEast
Comprehensive Healthcare for Women, PA
Stillwater Medical Group
John A. Haugen Associates, PA
Mayo Health System Clinics MN
Resource Use Index (RUI)Providers with <600 attributed members are not displayed.
Resource Use Index (RUI) - OB/GYN Providers 10/1/2011 - 9/30/2013
Note: A lower index is desirable

HealthPartners Clinical Indicators Report — 2013/2014 Results116
HealthPartners 11 County Metro Network Average: 1.000Indices > 1.000 represent providers that are more expensive than averageIndices < 1.000 represent providers that are less expensive than average
0.0 0.5 1.0 1.5 2.0 2.5
Mayo Clinic
Essentia Health - SMDC Health System
Integrity - Northern
University of MN Physicians
Allina Health
Northern Orthopedics, Ltd
Orthopaedic & Fracture Clinic, PA
Twin Cities Orthopedics, PA
St. Cloud Orthopedic Associates, Ltd
Fairview Clinics
11 County Metro Average
St. Croix Orthopaedics, PA
Summit Orthopedics, Ltd
Park Nicollet Health Services
HealthPartners Clinics
Total Cost Index (TCI)Providers with <300 attributed members are not displayed.
Total Cost Index (TCI) - Orthopaedic Providers 10/1/2011 - 9/30/2013
Note: A lower index is desirable

HealthPartners Clinical Indicators Report — 2013/2014 Results117
HealthPartners 11 County Metro Network Average: 1.000Indices > 1.000 represent providers that are more expensive than averageIndices < 1.000 represent providers that are less expensive than average
0.0 0.5 1.0 1.5 2.0 2.5
University of MN Physicians
Mayo Clinic
Essentia Health - SMDC Health System
St. Croix Orthopaedics, PA
Allina Health
HealthPartners Clinics
St. Cloud Orthopedic Associates, Ltd
Park Nicollet Health Services
Twin Cities Orthopedics, PA
Summit Orthopedics, Ltd
Northern Orthopedics, Ltd
Orthopaedic & Fracture Clinic, PA
Integrity - Northern
Fairview Clinics
Resource Use Index (RUI)Providers with <300 attributed members are not displayed.
Resource Use Index (RUI) - Orthopaedic Providers 10/1/2011 - 9/30/2013
Note: A lower index is desirable

HealthPartners Clinical Indicators Report — 2013/2014 Results118
TOTAL COST INDEX — HOSPITALS AND SURGERY CENTERSJanuary 1, 2013 – December 31, 2013
DescriptionHospitals and surgery centers case mix and place of service mix adjusted cost index. The cost index measures a facility’s inpatient and outpatient total costs relative to all other facilities.
MethodologyThis measure is based on inpatient and outpatient commercial fully insured and self insured non-outlier inpatient admissions and outpatient visits. Facility case mix is adjusted by DRG for inpatient admissions and APC and RVUs for outpatient visits. The inpatient/outpatient case mix is accounted for by weighting the percent of business in each component by facility. Total cost of care indices are created for each facility by dividing each facility’s case and place of service risk actual costs by the 11 county metro expected values.
ResultsHealthPartners 11 County Metro Network Average: 1.000
Total Cost Indices > 1.000 represent hospitals and surgery centers that are more expensive than average
Total Cost Indices < 1.000 represent hospitals and surgery centers that are less expensive than average

HealthPartners Clinical Indicators Report — 2013/2014 Results119
Total Cost Index (TCI)
HealthPartners 11 County Metro Network Average: 1.000Indices > 1.000 represent providers that are more expensive than averageIndices < 1.000 represent providers that are less expensive than average
0.0 0.5 1.0 1.5 2.0 2.5 3.0 3.5 4.0
Unity HospitalFairview Lakes Regional Medical Center
Melrose Area HospitalSt. Francis Regional Medical Center
United HospitalRegina Medical Center
CentraCare Health - Long PrairieHealthEast St. Joseph's Hospital
St. Gabriel's HospitalRice County District One
Westfields HospitalAbbott Northwestern Hospital
Mercy HospitalHennepin County Medical CenterHealthEast Woodwinds Hospital
Essentia Health - DuluthAltru Clinics
Brainerd Lakes Surgery CenterDouglas County Hospital
Lakewalk Surgery Center, LtdMercy Medical Center - Des Moines
HealthEast St. John's HospitalRidgeview Medical Center11 County Metro Average
Park Nicollet Methodist HospitalFairview Ridges Hospital
Fairview Southdale HospitalSt. Cloud Hospital
Hudson Hospital & ClinicsNorth Memorial Medical Center
Lakeview HospitalMaple Grove Hospital
Regions HospitalPavilion Surgery Center, LLC
Park Nicollet Methodist Hospital - Ambulatory Surgery CenterCentraCare Surgery Center
St. Cloud Surgical CenterHealthEast Surgery Center - Maplewood
MNGI Endoscopy - MaplewoodMNGI Endoscopy - Bloomington Clinic and Endoscopy Center
WestHealth SurgeryRiverside Endoscopy Center
HealthPartners Same Day Surgery CenterFairview Maple Grove Surgery Center
North Memorial Ambulatory Surgical Center at Maple GroveHigh Pointe Surgery Center
Midwest Surgery CenterChaska Plaza Surgery Center, LLC
Minnesota Orthopedic Surgery Center, LLCCrosstown Surgery CenterLandmark Surgery Center
Woodbury Ambulatory Surgery CenterTRIA Orthopaedic Center, LLC
Total Cost Index (TCI) - Hospitals and Surgery Centers 1/1/2013 - 12/31/2013
Part 1 of a 3 Part Graph
Note: A lower index is desirable

HealthPartners Clinical Indicators Report — 2013/2014 Results120
Total Cost Index (TCI)
HealthPartners 11 County Metro Network Average: 1.000Indices > 1.000 represent providers that are more expensive than averageIndices < 1.000 represent providers that are less expensive than average
0.0 0.5 1.0 1.5 2.0 2.5 3.0 3.5 4.0
Baldwin Area Medical CenterUniversity of Iowa Hospitals & Clinics
Redwood Area HospitalRiver Falls Area HospitalLakeview Medical Center
Mercy Health Services - Iowa CorpMayo Clinic Health System - Red Cedar
Lakeview Memorial Hospital, IncAvera McKennan Hospital & University Health Center
Hocking Valley Community HospitalSanford Medical Center Fargo
St. Mary's HospitalEssentia Health - Sandstone Health Center
University Medical Center - MesabaFinley Hospital
Sanford Bemidji Medical CenterCambridge Medical Center
Tri-County HospitalCuyuna Regional Medical Center
Essentia Health - St. Mary's Hospital - SuperiorChippewa County Montevideo Hospital
Mayo Clinic Health System - Franciscan Medical CenterAurora Baycare Medical Center
Mayo Clinic Health System - Albert Lea and AustinMeeker Memorial Hospital
Owatonna HospitalHutchinson Health Hospital
St. Croix Regional Medical CenterSt. Joseph's Hospital
Northfield City HospitalAmery Regional Medical Center Clinics
Sanford Thief River FallsEssentia Health - Fargo
Avera Marshall Regional Medical CenterBuffalo Hospital
University of Wisconsin Hospital & ClinicsEssentia Health - St. Mary's Hospital - Detroit Lakes
St. Luke's HospitalNew Ulm Medical Center
Lakes Regional HealthcareMayo Clinic Health System Hospital - Red Wing
Glencoe Regional Health ServicesMayo Clinic Health System - Mankato
Essentia Health - St. Mary's Medical CenterMayo Clinic Health System - Fairmont
Essentia Health - St. Joseph's Medical CenterRice Memorial Hospital
CentraCare Health - Monticello HospitalFairview Northland Regional Hospital
Minnesota Valley Surgery CenterOlmsted Medical Center/Hospital
University of Minnesota Medical Center, Fairview
Total Cost Index (TCI) - Hospitals and Surgery Centers 1/1/2013 - 12/31/2013
Part 2 of a 3 Part Graph
Note: A lower index is desirable

HealthPartners Clinical Indicators Report — 2013/2014 Results121
Total Cost Index (TCI)
HealthPartners 11 County Metro Network Average: 1.000Indices > 1.000 represent providers that are more expensive than averageIndices < 1.000 represent providers that are less expensive than average
0.0 0.5 1.0 1.5 2.0 2.5 3.0 3.5 4.0
Spooner Health SystemLakewood Health Center
Mayo Clinic Health System - Cannon FallsBigfork Valley Hospital
Ely-Bloomenson Community HospitalKosciusko Community Hospital - Warsaw
Sleepy Eye Municipal HospitalSibley Medical Center
Renville County HospitalUnited Hospital District - Blue Earth
FirstLight Health SystemCommunity Memorial Hospital
Prairie Ridge Hospital and Health ServicesMemorial Medical Center, IncGrand Itasca Clinic & Hospital
Lakewood Health SystemCumberland Memorial Hospital & Extended Care Unit
St. Joseph's Area Health ServicesMass General Hospital
Mayo Clinic Health System - St. JamesWise Regional Health System
Mille Lacs Health SystemGlacial Ridge Hospital
Aitkin Community HospitalRiverview Healthcare Association
Stevens Community Medical CenterHayward Area Memorial Hospital
Paynesville Area HospitalWinona Health Services
Avera Holy Family HospitalCentraCare Health - Sauk Centre Hospital
Moose Lake Community HospitalPrairie du Chien Memorial Hospital
River's Edge HospitalLake Region Hospital
Mayo Clinic Health System - Eau Claire HospitalMarion General Hospital
Essentia Health - Deer RiverEssentia Health - Virginia
Sacred Heart HospitalSanford USD Medical Center
Gundersen Lutheran Medical Center, IncOsceola Medical Center
Mayo Clinic Health System Hospital - New PragueAlbany Area Hospital
Froedtert HospitalEssentia Health - Holy Trinity Hospital
Burnett Medical CenterSpencer Municipal Hospital
Rochester Methodist HospitalPerham Memorial Hospital and Home
Essentia Health Fosston
Total Cost Index (TCI) - Hospitals and Surgery Centers 1/1/2013 - 12/31/2013
Part 3 of a 3 Part Graph
Note: a lower index is desirable
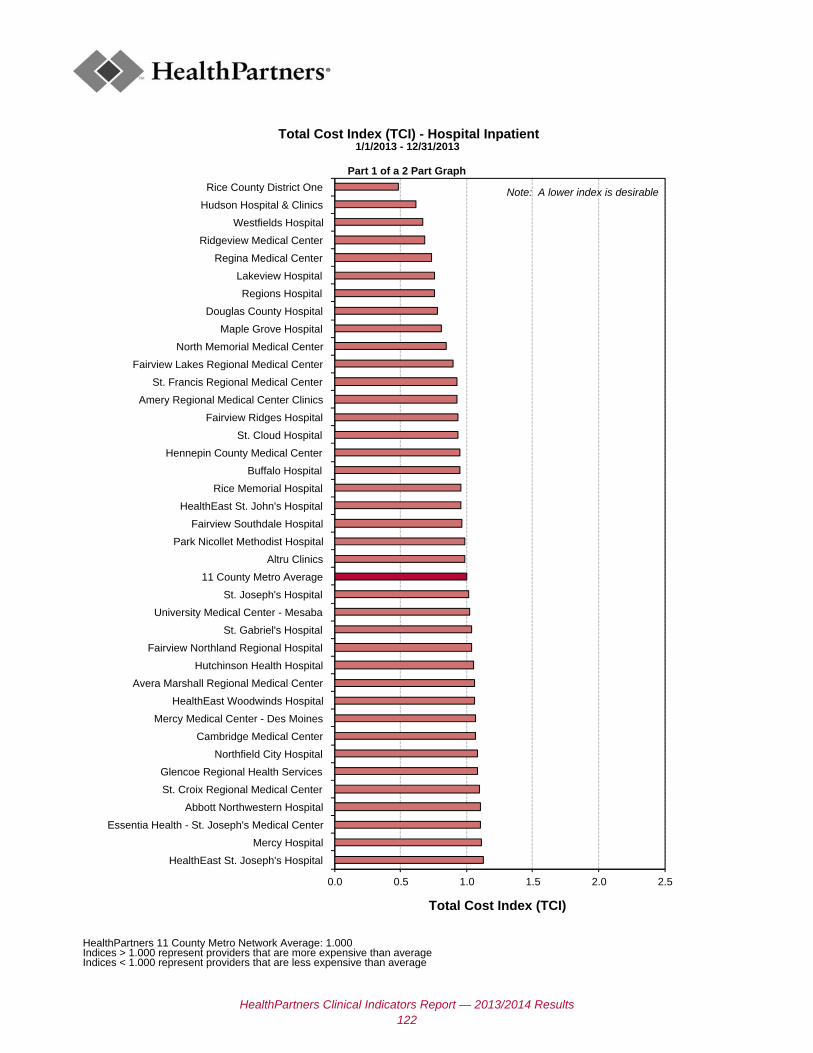
HealthPartners Clinical Indicators Report — 2013/2014 Results122
0.0 0.5 1.0 1.5 2.0 2.5
HealthEast St. Joseph's Hospital
Mercy Hospital
Essentia Health - St. Joseph's Medical Center
Abbott Northwestern Hospital
St. Croix Regional Medical Center
Glencoe Regional Health ServicesNorthfield City Hospital
Cambridge Medical Center
Mercy Medical Center - Des Moines
HealthEast Woodwinds Hospital
Avera Marshall Regional Medical Center
Hutchinson Health Hospital
Fairview Northland Regional Hospital
St. Gabriel's Hospital
University Medical Center - Mesaba
St. Joseph's Hospital
11 County Metro Average
Altru Clinics
Park Nicollet Methodist Hospital
Fairview Southdale Hospital
HealthEast St. John's Hospital
Rice Memorial Hospital
Buffalo Hospital
Hennepin County Medical Center
St. Cloud Hospital
Fairview Ridges Hospital
Amery Regional Medical Center Clinics
St. Francis Regional Medical Center
Fairview Lakes Regional Medical Center
North Memorial Medical Center
Maple Grove Hospital
Douglas County Hospital
Regions Hospital
Lakeview Hospital
Regina Medical Center
Ridgeview Medical Center
Westfields Hospital
Hudson Hospital & Clinics
Rice County District One
Total Cost Index (TCI)
Total Cost Index (TCI) - Hospital Inpatient1/1/2013 - 12/31/2013
Part 1 of a 2 Part Graph
Note: A lower index is desirable
HealthPartners 11 County Metro Network Average: 1.000Indices > 1.000 represent providers that are more expensive than averageIndices < 1.000 represent providers that are less expensive than average

HealthPartners Clinical Indicators Report — 2013/2014 Results123
0.0 0.5 1.0 1.5 2.0 2.5
St. Joseph's Area Health Services
Sanford USD Medical Center
Lakewood Health System
Mayo Clinic Health System - Eau Claire Hospital
St. Mary's Hospital
Avera McKennan Hospital & University Health Center
Gundersen Lutheran Medical Center, Inc
Lake Region Hospital
Rochester Methodist Hospital
Hayward Area Memorial Hospital
Sacred Heart Hospital
River Falls Area Hospital
Mayo Clinic Health System - Red Cedar
Mayo Clinic Health System - Franciscan Medical CenterSanford Medical Center Fargo
Grand Itasca Clinic & Hospital
Lakeview Medical Center
Osceola Medical Center
Winona Health Services
Memorial Medical Center, Inc
Unity Hospital
Essentia Health - Fargo
Mayo Clinic Health System - Albert Lea and Austin
Sanford Bemidji Medical Center
Essentia Health - St. Mary's Medical Center
St. Luke's Hospital
Meeker Memorial Hospital
Cuyuna Regional Medical Center
University of Minnesota Medical Center, Fairview
LifeCare Medical Center
Mayo Clinic Health System - Mankato
United Hospital
Mayo Clinic Health System Hospital - Red Wing
Essentia Health - St. Mary's Hospital - Detroit Lakes
New Ulm Medical Center
Essentia Health - Duluth
Owatonna Hospital
Olmsted Medical Center/Hospital
Total Cost Index (TCI)
Total Cost Index (TCI) - Hospital Inpatient 1/1/2013 - 12/31/2013
Part 2 of a 2 Part Graph
Note: A lower index is desirable
HealthPartners 11 County Metro Network Average: 1.000Indices > 1.000 represent providers that are more expensive than averageIndices < 1.000 represent providers that are less expensive than average

HealthPartners Clinical Indicators Report — 2013/2014 Results124
0.0 0.5 1.0 1.5 2.0 2.5 3.0 3.5 4.0
Regina Medical CenterCentraCare Health - Monticello Hospital
Minnesota Valley Surgery CenterWestfields Hospital
University of Minnesota Medical Center, FairviewRidgeview Medical Center
Douglas County HospitalHennepin County Medical CenterHealthEast Woodwinds Hospital
Melrose Area HospitalSt. Gabriel's Hospital
HealthEast St. Joseph's HospitalAbbott Northwestern Hospital
CentraCare Health - Long PrairieHealthEast St. John's Hospital
Mercy HospitalUnited Hospital
Unity HospitalAltru Clinics
Hudson Hospital & ClinicsEssentia Health - Duluth
Brainerd Lakes Surgery CenterLakewalk Surgery Center, Ltd
Lakeview HospitalMaple Grove Hospital
North Memorial Medical CenterPark Nicollet Methodist Hospital
Fairview Ridges Hospital11 County Metro Average
St. Cloud HospitalFairview Southdale Hospital
Regions HospitalPavilion Surgery Center, LLC
Park Nicollet Methodist Hospital - Ambulatory Surgery CenterCentraCare Surgery Center
St. Cloud Surgical CenterHealthEast Surgery Center - Maplewood
MNGI Endoscopy - MaplewoodMNGI Endoscopy - Bloomington Clinic and Endoscopy Center
WestHealth SurgeryRiverside Endoscopy Center
HealthPartners Same Day Surgery CenterFairview Maple Grove Surgery Center
North Memorial Ambulatory Surgical Center at Maple GroveHigh Pointe Surgery Center
Midwest Surgery CenterChaska Plaza Surgery Center, LLC
Minnesota Orthopedic Surgery Center, LLCCrosstown Surgery CenterLandmark Surgery Center
Woodbury Ambulatory Surgery CenterTRIA Orthopaedic Center, LLC
Total Cost Index (TCI)
Total Cost Index (TCI) - Outpatient Hospitals and Surgery Centers 1/1/2013 - 12/31/2013
Part 1 of a 3 Part Graph
Note: A lower index is desirable
HealthPartners 11 County Metro Network Average: 1.000Indices > 1.000 represent providers that are more expensive than averageIndices < 1.000 represent providers that are less expensive than average

HealthPartners Clinical Indicators Report — 2013/2014 Results125
HealthPartners 11 County Metro Network Average: 1.000Indices > 1.000 represent providers that are more expensive than averageIndices < 1.000 represent providers that are less expensive than average
0.0 0.5 1.0 1.5 2.0 2.5 3.0 3.5 4.0
Sanford Bemidji Medical CenterSt. Mary's Hospital
Buffalo HospitalEssentia Health - Holy Trinity Hospital
Burnett Medical CenterSpencer Municipal Hospital
Perham Memorial Hospital and HomeEssentia Health - Fosston
Mayo Clinic Health System - Red CedarBaldwin Area Medical Center
University of Iowa Hospitals & ClinicsRedwood Area HospitalRice Memorial Hospital
Sanford USD Medical CenterRochester Methodist Hospital
Owatonna HospitalNorthfield City Hospital
Essentia Health - St. Mary's Hospital - Detroit LakesMercy Health Services - Iowa Corp
Lakeview Memorial Hospital, IncHocking Valley Community Hospital
Hutchinson Health HospitalCuyuna Regional Medical Center
Essentia Health - Sandstone Health CenterAvera McKennan Hospital & University Health Center
St. Croix Regional Medical CenterMayo Clinic Health System - Albert Lea and Austin
Mayo Clinic Health System - MankatoEssentia Health - St. Joseph's Medical Center
Amery Regional Medical Center ClinicsMeeker Memorial Hospital
Finley HospitalEssentia Health - Fargo
Essentia Health - St. Mary's Medical CenterSt. Luke's Hospital
Mayo Clinic Health System - Franciscan Medical CenterMayo Clinic Health System Hospital - Red Wing
Tri - County HospitalEssentia Health - St. Mary's Hospital - Superior
Chippewa County Montevideo HospitalNew Ulm Medical Center
Aurora Baycare Medical CenterGlencoe Regional Health Services
Fairview Northland Regional HospitalSanford Thief River FallsRice County District One
University of Wisconsin Hospital & ClinicsLakes Regional Healthcare
Fairview Lakes Regional Medical CenterOlmsted Medical Center/Hospital
Mayo Clinic Health System - FairmontSt. Francis Regional Medical Center
Total Cost Index (TCI)
Total Cost Index (TCI) - Outpatient Hospitals and Surgery Centers 1/1/2013 - 12/31/2013
Part 2 of a 3 Part Graph
Note: A lower index is desirable

HealthPartners Clinical Indicators Report — 2013/2014 Results126
HealthPartners 11 County Metro Network Average: 1.000Indices > 1.000 represent providers that are more expensive than averageIndices < 1.000 represent providers that are less expensive than average
0.0 0.5 1.0 1.5 2.0 2.5 3.0 3.5 4.0
Spooner Health SystemLakewood Health Center
Mayo Clinic Health System - Cannon FallsBigfork Valley Hospital
Ely-Bloomenson Community HospitalGrand Itasca Clinic & HospitalMemorial Medical Center, Inc
Kosciusko Community Hospital - WarsawSleepy Eye Municipal Hospital
Sibley Medical CenterRenville County Hospital
United Hospital District - Blue EarthLakewood Health System
Sacred Heart HospitalFirstLight Health SystemWinona Health Services
St. Joseph's Area Health ServicesCommunity Memorial Hospital
Prairie Ridge Hospital and Health ServicesLake Region Hospital
Cumberland Memorial Hospital & Extended Care UnitMass General Hospital
Mayo Clinic Health System - St. JamesWise Regional Health System
Mille Lacs Health SystemHayward Area Memorial Hospital
Glacial Ridge HospitalAitkin Community Hospital
Riverview Healthcare AssociationStevens Community Medical Center
Gundersen Lutheran Medical Center, IncOsceola Medical Center
Mayo Clinic Health System - Eau Claire HospitalAvera Marshall Regional Medical Center
Paynesville Area HospitalUniversity Medical Center - Mesaba
St. Joseph's HospitalAvera Holy Family Hospital
CentraCare Health - Sauk Centre HospitalMercy Hospital
Prairie du Chien Memorial HospitalRiver's Edge Hospital
Marion General HospitalCambridge Medical Center
Lakeview Medical CenterEssentia Health - Deer River
Essentia Health VirginiaSanford Medical Center Fargo
Mayo Clinic Health System Hospital - New PragueAlbany Area Hospital
River Falls Area HospitalFroedtert Hospital
Total Cost Index (TCI)
Total Cost Index (TCI) - Outpatient Hospitals and Surgery Centers 1/1/2013 - 12/31/2013
Part 3 of a 3 Part Graph
Note: A lower index is desirable

HealthPartners Clinical Indicators Report — 2013/2014 Results127
PARTICIPATING PROVIDERS
AALFA Family Clinic, PA (21, 22, 24, 38, 69, 70, 75, 76, 77)Abbott Northwestern Hospital (11, 12, 14, 119, 122, 124)Adefris & Toppin Women’s Specialists, MD, PC (114, 115, 26,
43, 72)Advanced Medical Clinic (21, 22, 24, 38, 69, 70, 75, 76, 77,
83)Advanced Specialty Care for Women, PA (44, 81)Advanced Spine Associates, PA (45)Affi liated Community Medical Centers, PA (19, 28, 29, 30, 31,
33, 34, 35, 43, 50, 51, 79, 87, 91, 92, 103, 104, 105, 107, 108)
Aitkin Community Hospital (121, 126)Albany Area Hospital (121, 126)Allina Health (5, 7, 9, 9, 16, 16, 18, 21, 22, 24, 26, 28, 29, 30,
31, 37, 41, 42, 44, 45, 47, 49, 51, 54, 55, 59, 61, 63, 65, 66, 67, 69, 70, 72, 75, 76, 77, 79, 81, 83, 85, 87, 91, 92, 96, 97, 98, 99, 100, 101, 103, 104, 107, 108, 110, 111, 112, 113, 114, 115, 116, 117, 33, 34, 35, 105)
Altru Clinics (19, 21, 22, 24, 28, 29, 30, 31, 38, 42, 50, 52, 63, 65, 66, 67, 69, 70, 75, 76, 77, 79, 87, 91, 92, 103, 104, 107, 108, 119, 122, 124)
Amery Regional Medical Center Clinics (18, 28, 29, 30, 31, 49, 52, 63, 65, 66, 67, 79, 87, 91, 92, 103, 104, 107, 108, 120, 122, 125)
Anthony Louis Center (10)Apple Valley Medical Clinic, Ltd (19, 21, 22, 24, 28, 29, 30,
31, 37, 50, 52, 63, 65, 66, 67, 69, 70, 75, 76, 77, 79, 87, 91, 92, 103, 104, 107, 108)
Aspire Mental Health, LLC (41)Aspirus Network, Inc (42)Associated Clinic of Psychology (7, 9, 16, 41)Associated Medical and Dental Clinic (21, 24, 38, 69, 70)Aurora Baycare Medical Center (120, 125)Avalon Progams LLC (10)Avera Health Clinics (18, 21, 22, 24, 37, 41, 43, 50, 52, 69,
70, 75, 76, 77, 87, 107, 108)Avera Health Hospitals (42)Avera Holy Family Hospital (121, 126)Avera Marshall Regional Medical Center (120, 122, 126)Avera McKennan Hospital & University Health Center (120,
123, 125)Axis Medical Center (83)Baldwin Area Medical Center (21, 22, 24, 37, 69, 70, 75, 76,
77, 87, 107, 108, 120, 125)BHSI, LLC (7, 16, 41)Bigfork Valley Hospital (121, 126)Boynton Health Service Pharmacy (47)Brainerd Lakes Surgery Center (119, 124)Buffalo Hospital (120, 122, 125)Burnett Medical Center (121, 125)Burnsville Family Physicians, PA (18, 21, 22, 24, 37, 49, 51,
69, 70, 75, 76, 77, 79, 87, 107, 108)C.R.E.A.T.E., Inc (10)Cambridge Medical Center (120, 122, 126)Canvas Health, Inc (9, 40)Carver County Mental Health Program (41)Catalyst Medical Clinic (21, 22, 24, 37, 69, 70, 75, 76, 77)Cedar Riverside People’s Center (83)Center for Alcohol & Drug Treatment (10)
CentraCare Clinics (7, 18, 21, 22, 24, 26, 28, 29, 30, 31, 33, 34, 35, 37, 42, 43, 50, 52, 54, 63, 65, 66, 67, 69, 70, 72, 75, 76, 77, 79, 81, 83, 85, 87, 91, 92, 94, 95, 98, 99, 103, 104, 105, 107, 108, 110, 111, 114, 115)
CentraCare Health - Long Prairie Hospital (119, 124)CentraCare Health - Monticello Hospital (120, 124)CentraCare Health - Sauk Centre Hospital (121, 126)CentraCare Surgery Center (119, 124)Central Minnesota Mental Health Center (40)Chaska Plaza Surgery Center, LLC (119, 124)Children’s Health Care (19, 41, 94, 95, 96, 97)Children’s Heart Clinic, PA (42)Children’s Physician Network (5, 22, 33, 34, 35, 38, 43, 75,
76, 77, 87, 105)Chippewa County Montevideo Hospital (120, 125)Clinic Sofi a OB/GYN, PA (26, 44, 72, 81, 114, 115)Clinical Psychopharmacology Consultants, PA (40)Club Recovery, LLC (10)Coborn’s/Cash Wise (47, 57, 59, 61)Community Memorial Hospital (121, 126)Community Univ Health Care Center (CUHCC) (41, 63, 65,
66, 67, 83)Comprehensive Healthcare for Women, PA (26, 43, 72, 81,
114, 115)Costco (47, 57, 59, 61)Crosstown Surgery Center (119, 124)Cumberland Memorial Hospital & Extended Care Unit, Inc
(121, 126)Cuyuna Regional Medical Center (120, 123, 125)Cuyuna Regional Medical Center Clinic (44, 87)CVS Pharmacy (47, 57, 59, 61)Dakota County Receiving Center (10)David D. Gulden, MD (41)David G. Fine, MD (42)David L. Sudduth, MD (40)Douglas County Hospital (43, 45, 49, 63, 65, 66, 67, 79, 87,
107, 108, 119, 122, 124)Dr. Bobby Yang Medical Clinic (21, 22, 24, 38, 69, 70, 75, 76,
77, 83)Dr. Sujit R. Varma, Inc (41)Ear, Nose & Throat SpecialtyCare of Minnesota, PA (112, 113)Ear, Nose and Throat Clinic and Hearing Center (112, 113)Edina Sports Health & Wellness, PA (21, 22, 24, 38, 69, 70,
75, 76, 77, 79, 87)Ely-Bloomenson Community Hospital (121, 126)Endocrinology Clinic of Minneapolis, PA (18)ENT Specialty Care (96, 97)Entira Family Clinics (7, 9, 18, 21, 22, 24, 28, 29, 30, 31, 33,
34, 35, 38, 49, 51, 63, 65, 66, 67, 69, 70, 75, 76, 77, 79, 83, 85, 87, 91, 92, 103, 104, 105, 107, 108)
Essentia Health - Brainerd Medical Center, Inc. (43)Essentia Health - Central Region (107, 108)Essentia Health - Deer River (121, 126)Essentia Health - Duluth (14, 119, 123, 124)Essentia Health - East Region (107, 108)Essentia Health - Fargo (120, 123, 125)Essentia Health - Fosston (121, 125)Essentia Health - Holy Trinity Hospital (121, 125)Essentia Health - Innovis Health, LLC (18, 21, 22, 24, 28, 29,
Recognition must be extended to participating provider groups whose cooperation and support make this report possible and whose efforts to improve care are refl ected in these results.

HealthPartners Clinical Indicators Report — 2013/2014 Results128
PARTICIPATING PROVIDERS30, 31, 38, 42, 44, 45, 49, 51, 63, 65, 66, 67, 69, 70, 75, 76, 77, 79, 87, 91, 92, 103, 104)
Essentia Health - Sandstone Health Center (120, 125)Essentia Health - SMDC Health System (5, 7, 9, 18, 21, 22,
24, 26, 38, 40, 42, 44, 45, 47, 49, 51, 54, 57, 59, 61, 63, 65, 66, 67, 69, 70, 72, 75, 76, 77, 79, 81, 87, 94, 95, 96, 97, 98, 99, 100, 101, 110, 111, 112, 113, 114, 115, 116, 117)
Essentia Health - St. Joseph’s Medical Center (7, 18, 21, 22, 24, 28, 29, 30, 31, 37, 41, 42, 49, 51, 63, 65, 66, 67, 69, 70, 75, 76, 77, 79, 87, 91, 92, 103, 104, 120, 122, 125)
Essentia Health - St. Mary’s Hospital - Detroit Lakes (123, 125)
Essentia Health - St. Mary’s Hospital - Superior (120, 125)Essentia Health - St. Mary’s Medical Center (120, 123, 125)Essentia Health - St. Mary’s Regional Health Center (21, 22,
24, 28, 29, 30, 31, 33, 34, 35, 37, 43, 50, 52, 69, 70, 75, 76, 77, 91, 92, 103, 104, 105)
Essentia Health - Virginia (121, 126)Essentia Health - West Region (107, 108)Essentia Health (28, 29, 30, 31, 91, 92, 103, 104)Essentia Health St. Mary’s Hospital - Detroit Lakes (120)Fairview Clinics (5, 7, 9, 16, 19, 21, 22, 24, 26, 28, 29, 30, 31,
33, 34, 35, 38, 43, 45, 47, 49, 51, 54, 55, 57, 59, 61, 63, 65, 66, 67, 69, 70, 72, 75, 76, 77, 79, 81, 87, 91, 92, 94, 95, 96, 97, 98, 99, 100, 101, 103, 104, 105, 107, 108, 112, 113, 114, 115, 116, 117)
Fairview Health Services Hospitals (79)Fairview Lakes Clinics (83, 85)Fairview Lakes Regional Medical Center (11, 12, 119, 122,
125)Fairview Maple Grove Surgery Center (119, 124)Fairview Northland Regional Hospital (120, 122, 125)Fairview Ridges Hospital (119, 122, 124)Fairview Southdale Hospital (11, 12, 14, 119, 122, 124)Fairview University Medical Center (11, 12, 14)Family Life Mental Health Center (40)Family Practice Medical Center of Willmar (87)Finley Hospital (120, 125)FirstLight Health System (43, 81, 121, 126)Foley Medical Center (83)France Avenue Family Physicians, PA (18, 21, 22, 24, 38, 49,
69, 70, 75, 76, 77, 79, 87, 107, 108)Froedtert Hospital (121, 126)Gateway Family Health Clinic (79)Generations Women’s Health Center, PA (44)Gillette Children’s Specialty Healthcare (100, 101)Glacial Ridge Hospital (121, 126)Glencoe Regional Health Services (120, 122, 125)Goodrich Pharmacy (47, 57, 59, 61)Grand Itasca Clinic & Hospital (19, 50, 52, 63, 65, 66, 67, 79,
88, 107, 108, 121, 123, 126)Gundersen Lutheran Clinics (19, 40, 42, 43, 45, 49, 79, 88,
107, 108)Gundersen Lutheran Medical Center, Inc (121, 123, 126)Haven Chemical Health Systems (10)Hayward Area Memorial Hospital (121, 123, 126)Hazelden Foundation (10, 40)Headway Emotional Health Services (41)HealthEast (7, 9, 18, 21, 22, 24, 26, 28, 29, 30, 31, 33, 34,
35, 37, 40, 43, 49, 51, 54, 55, 63, 65, 66, 67, 69, 70, 72,
75, 76, 77, 79, 81, 83, 88, 91, 92, 103, 104, 105, 107, 108, 114, 115)
HealthEast Heart Care (42, 94, 95, 110, 111)HealthEast St. John’s Hospital (11, 12, 119, 122, 124)HealthEast St. Joseph’s Hospital (11, 12, 14, 119, 122, 124)HealthEast Surgery Center - Maplewood (119, 124)HealthEast Woodwinds Hospital (119, 122, 124)HealthPartners Central Minnesota Clinics, Inc (7, 9, 18, 21,
22, 24, 26, 28, 29, 30, 31, 33, 34, 35, 37, 47, 49, 51, 59, 61, 63, 65, 66, 67, 69, 70, 72, 75, 76, 77, 79, 81, 83, 85, 88, 91, 92, 103, 104, 105, 107, 108)
HealthPartners Clinics (5, 7, 9, 9, 16, 16, 18, 21, 22, 24, 26, 28, 29, 30, 31, 33, 34, 35, 37, 40, 42, 44, 45, 47, 49, 51, 54, 55, 57, 59, 61, 63, 65, 66, 67, 69, 70, 72, 75, 76, 77, 79, 81, 83, 85, 88, 91, 92, 94, 95, 96, 97, 98, 99, 100, 101, 103, 104, 105, 107, 108, 110, 111, 112, 113, 114, 115, 116, 117)
HealthPartners Mail Order Pharmacy (47, 57, 59, 61)HealthPartners Same Day Surgery Center (119, 124)Hennepin County Human Services & Public Health Depart-
ment (40)Hennepin County Medical Center (7, 11, 12, 14, 19, 21, 22,
24, 38, 40, 42, 43, 45, 50, 51, 63, 65, 66, 67, 69, 70, 75, 76, 77, 79, 81, 88, 107, 108, 119, 122, 124)
High Pointe Surgery Center (119, 124)Hocking Valley Community Hospital (120, 125)Hudson Hospital & Clinics (119, 122, 124)Hudson Physicians (19, 21, 22, 24, 37, 44, 50, 52, 63, 65, 66,
67, 69, 70, 75, 76, 77, 107, 108)Hutchinson Health (19, 21, 22, 24, 37, 40, 43, 50, 51, 63, 65,
66, 67, 69, 70, 75, 76, 77, 79, 81, 88, 107, 108)Hutchinson Health Hospital (120, 122, 125)Hutchinson Medical Center, PA (28, 29, 30, 31, 91, 92, 103,
104)Ilko Family Medicine, PA (21, 22, 24, 38, 69, 70, 75, 76, 77)Indian Health Board of Minneapolis (83)Innovative Psychological Consultants (40)Institute for Low Back and Neck Care (45)Integrity - Buffalo (7, 19, 21, 22, 24, 26, 28, 29, 30, 31, 33, 34,
35, 37, 43, 49, 52, 63, 65, 66, 67, 69, 70, 72, 75, 76, 77, 79, 81, 83, 85, 88, 91, 92, 98, 99, 103, 104, 105, 107, 108, 114, 115)
Integrity - Northern (18, 21, 22, 24, 38, 43, 45, 50, 63, 65, 66, 67, 69, 70, 75, 76, 77, 79, 88, 96, 97, 100, 101, 107, 108, 112, 113, 116, 117)
Integrity - St. Cloud (18, 21, 22, 24, 28, 29, 30, 31, 37, 43, 49, 51, 63, 65, 66, 67, 69, 70, 75, 76, 77, 79, 81, 83, 85, 88, 91, 92, 103, 104, 107, 108)
John A. Haugen Associates, PA (26, 44, 72, 81, 88, 98, 99, 114, 115)
Juliette Petersen, MD (40)Kathleen Sulentich, MD (44)Kevin A. O’Connor, MD (40)Kmart (47, 57, 59, 61)Kosciusko Community Hospital - Warsaw (121, 126)Lake Region Hospital (43, 81, 88, 107, 108, 121, 123, 126)Lakeland Mental Health Center, Inc (40)Lakes Regional Healthcare (120, 125)Lakeview Clinic, Ltd (7, 18, 21, 22, 24, 28, 29, 30, 31, 33, 34,
35, 37, 43, 50, 52, 63, 65, 66, 67, 69, 70, 75, 76, 77, 79, 81, 83, 85, 88, 91, 92, 103, 104, 105, 107, 108)

HealthPartners Clinical Indicators Report — 2013/2014 Results129
PARTICIPATING PROVIDERSMinneapolis Clinical Assoc In Psych (41)Minneapolis Heart Institute (94, 95)Minneapolis Otolaryngology, PA (96, 97, 112, 113)Minnesota Gynecology and Surgery, LLC (26, 44, 72, 81, 114,
115)Minnesota Orthopedic Surgery Center, LLC (119, 124)Minnesota Psychological Resources (41)Minnesota Rural Health Cooperative Clinics (19, 21, 22, 24,
28, 29, 30, 31, 33, 34, 35, 37, 43, 50, 52, 63, 65, 66, 67, 69, 70, 75, 76, 77, 79, 83, 91, 92, 103, 104, 105, 107, 108)
Minnesota Valley Surgery Center (120, 124)MN Center for Obesity, Metabolism & Endocrinology, PA (18)MNGI Endoscopy - Bloomington Clinic and Endoscopy Center
(119, 124)MNGI Endoscopy - Maplewood (119, 124)Molly V. Silas, MD (41)Moose Lake Community Hosp (121)Multicare Associates of the Twin Cities (19, 21, 22, 24, 26, 28,
29, 30, 31, 37, 43, 49, 51, 63, 65, 66, 67, 69, 70, 72, 75, 76, 77, 79, 81, 88, 91, 92, 103, 104, 107, 108, 114, 115)
Murad Heart Care (42)Native American Community Clinic (83)Neighborhood Healthsource (83, 85)New Richmond Clinic (see also Westfi elds Hospital) (19, 21,
22, 24, 28, 29, 30, 31, 37, 43, 49, 51, 63, 65, 66, 67, 69, 70, 75, 76, 77, 91, 92, 103, 104)
New Ulm Medical Center (120, 123, 125)North Clinic, PA (7, 18, 21, 22, 24, 26, 28, 29, 30, 31, 37, 43,
50, 52, 63, 65, 66, 67, 69, 70, 72, 75, 76, 77, 79, 81, 88, 91, 92, 98, 99, 103, 104, 107, 108, 114, 115)
North Memorial Ambulatory Surgical Center at Maple Grove (119, 124)
North Memorial Cardiolvascular Services (42, 54, 55, 94, 95, 110, 111)
North Memorial Health Care (7, 18, 21, 22, 24, 28, 29, 30, 31, 33, 34, 35, 38, 42, 49, 51, 63, 65, 66, 67, 69, 70, 75, 76, 77, 79, 89, 91, 92, 103, 104, 105, 107, 108)
North Memorial Medical Center (11, 12, 14, 119, 122, 124)North Metro Psychiatry (41)Northern Orthopedics, Ltd (45, 100, 101, 116, 117)Northfi eld City Hospital (120, 122, 125)Northfi eld Hospital Clinics (21, 22, 24, 37, 43, 69, 70, 75, 76,
77, 81, 89, 107, 108)NorthPoint Health & Wellness Center (19, 44, 63, 65, 66, 67,
83, 85)Northwest Family Physicians, PA (19, 21, 22, 24, 28, 29, 30,
31, 37, 49, 51, 63, 65, 66, 67, 69, 70, 75, 76, 77, 79, 89, 91, 92, 103, 104, 107, 108)
Nystrom & Associates, Ltd (7, 9, 11, 12, 16, 41)Oak Ridge Center, PLLC (40)Oakdale Ear, Nose and Throat Clinic, PA (96, 97, 112, 113)OakLeaf Medical Network (42, 45, 89)Obstetrics and Gynecology Associates (26, 44, 72, 81, 89, 98,
99, 114, 115)Olmsted Medical Center Clinics (19, 21, 22, 24, 28, 29, 30,
31, 37, 41, 42, 43, 49, 52, 63, 65, 66, 67, 69, 70, 75, 76, 77, 79, 81, 89, 91, 92, 103, 104, 107, 108)
Olmsted Medical Center/Hospital (120, 123, 125)Open Cities Health Center (19, 44, 50, 52, 63, 65, 66, 67, 81,
83, 85)Options Family & Behavior Services (9)
Lakeview Hospital (119, 122, 124)Lakeview Medical Center (120, 123, 126)Lakeview Memorial Hospital, Inc (120, 125)Lakewalk Surgery Center, Ltd (119, 124)Lakewood Clinic (21, 22, 24, 38, 44, 69, 70, 75, 76, 77, 88)Lakewood Health Center (107, 108, 121, 123, 126)Lakewood Health System (121, 126)Landmark Surgery Center (119, 124)LifeCare Medical Center (123)Living Free Recovery Services (10)Lunds and Byerly’s (47, 57, 59, 61)Lyle J. Swenson, MD, PA (42)Mankato Clinic, Ltd (19, 26, 40, 42, 44, 50, 52, 72, 79, 81, 88,
107, 108, 114, 115)Maple Grove Hospital (11, 12, 119, 122, 124)Marion General Hospital (121, 126)Mark W. Erhard, MD, PA (42)Mass General Hospital (121, 126)Mattson Pharmacy (47, 59)Mayo Clinic (18, 26, 28, 29, 30, 31, 40, 42, 44, 45, 50, 52,
54, 63, 65, 66, 67, 72, 79, 81, 88, 91, 92, 94, 95, 100, 101, 103, 104, 107, 108, 110, 111, 112, 113, 116, 117)
Mayo Clinic Health System - Albert Lea and Austin (120, 123, 125)
Mayo Clinic Health System - Cannon Falls (121, 126)Mayo Clinic Health System - Eau Claire Hospital, Inc (121,
123, 126)Mayo Clinic Health System - Fairmont (120, 125)Mayo Clinic Health System - Franciscan Medical Center, Inc
(120, 123, 125)Mayo Clinic Health System - Mankato (120, 123, 125)Mayo Clinic Health System - Red Cedar (120, 123, 125)Mayo Clinic Health System - Red Wing (18, 21, 22, 24, 28, 29,
30, 31, 38, 42, 44, 45, 49, 51, 69, 70, 75, 76, 77, 79, 81, 88, 91, 92, 103, 104, 107, 108)
Mayo Clinic Health System - St. James (121, 126)Mayo Clinic Health System Hospital - New Prague (121, 126)Mayo Clinic Health System Hospital - Red Wing (120, 123,
125)Mayo Clinic Hospital (14)Mayo Health System Clinics MN (7, 18, 21, 22, 24, 26, 28, 29,
30, 31, 33, 34, 35, 37, 40, 42, 43, 45, 50, 52, 63, 65, 66, 67, 69, 70, 72, 75, 76, 77, 79, 81, 91, 92, 98, 99, 103, 104, 105, 107, 108, 112, 113, 114, 115)
Mayo Health System Clinics WI (19, 28, 29, 30, 31, 41, 42, 44, 45, 49, 51, 63, 65, 66, 67, 79, 88, 91, 92, 103, 104)
Medical Advanced Pain Specialists (9)Meeker Memorial Hospital (120, 123, 125)Melrose Area Hospital (119, 124)Memorial Medical Center, Inc (121, 123, 126)Mental Health Counseling Services, LLC (40)Mercy Health Services - Iowa Corp (120, 125)Mercy Hospital (11, 12, 14, 119, 122, 124, 126)Mercy Medical Center - Des Moines (119, 122)Metropolitan Heart & Vascular Institute (94, 95)Metropolitan Urologic Specialists, PA (44, 81)Midwest Ear, Nose & Throat Specialists (96, 97, 112, 113)Midwest Institute of Urology, PA (44)Midwest Spine Institute, LLC (45)Midwest Surgery Center (119, 124)Mille Lacs Health System (83, 121, 126)

HealthPartners Clinical Indicators Report — 2013/2014 Results130
PARTICIPATING PROVIDERSOrthopaedic & Fracture Clinic, PA (45, 100, 101, 116, 117)Osceola Medical Center (19, 21, 22, 24, 38, 49, 63, 65, 66,
67, 69, 70, 75, 76, 77, 79, 83, 89, 107, 108, 121, 123, 126)Owatonna Hospital (120, 123, 125)Paparella Ear Head & Neck Institute, PA (96, 97, 112, 113)Park Avenue Center (10)Park Nicollet Health Services (5, 7, 9, 9, 16, 16, 18, 21, 22,
24, 26, 28, 29, 30, 31, 33, 34, 35, 38, 40, 42, 44, 45, 47, 49, 51, 54, 55, 57, 59, 61, 63, 65, 66, 67, 69, 70, 72, 75, 76, 77, 79, 81, 83, 85, 89, 91, 92, 94, 95, 96, 97, 98, 99, 100, 101, 103, 104, 105, 107, 108, 110, 111, 112, 113, 114, 115, 116, 117)
Park Nicollet Health Services Hospitals (79)Park Nicollet Methodist Hospital - Ambulatory Surgery Center
(119, 124)Park Nicollet Methodist Hospital (11, 12, 119, 122, 124)Parkview Medical Clinic (83)Paul Larson OB/GYN Clinic, PA (26, 44, 72, 81, 89, 114, 115)Paul T. Richardson, MD LLC (40)Pavilion Surgery Center, LLC (119, 124)Paynesville Area Hospital (121, 126)People Incorporated (40)Perham Memorial Hospital and Home (121, 125)Planned Parenthood of MN, ND, SD (44, 81)Prairie du Chien Memorial Hospital (121, 126)Prairie Lakes Health Care System (42)Prairie Ridge Hospital and Health Services (121, 126)Prairie St. John’s (14)PrairieCare Medical Group (40)Premier ObGyn of Minnesota (26, 44, 72, 81, 89, 98, 99, 114,
115)Preventive Cardiology Consultants, PA (42)Primary Care and Rehabilitation Clinics (83)Psych Business Services, Ltd (40)Psych Recovery, Inc (7, 9, 16, 41)Ramsey County Mental Health Center (40)Redwood Area Hospital (120, 125)Regina Medical Center (119, 122, 124)Regions Hospital (11, 12, 14, 47, 57, 59, 61, 79, 119, 122,
124)Relate Counseling Center (41)Renville County Hospital (121, 126)Rice County District One (119, 122, 125)Rice Memorial Hospital (120, 122, 125)Richfi eld Medical Group (18, 21, 24, 37, 50, 69, 70)Ridgeview Clinics (7, 19, 21, 22, 24, 26, 28, 29, 30, 31, 37,
43, 49, 51, 63, 65, 66, 67, 69, 70, 72, 75, 76, 77, 79, 81, 89, 91, 92, 96, 97, 98, 99, 103, 104, 107, 108, 112, 113, 114, 115)
Ridgeview Medical Center (119, 122, 124)River Falls Area Hospital (120, 123, 126)River Falls Medical Clinic (19, 21, 22, 24, 37, 49, 63, 65, 66,
67, 69, 70, 75, 76, 77, 89)River Ridge Treatment Center (10)River Valley Behavioral Health & Wellness Center, LLC (41)Riverplace Counseling Center (10)River’s Edge Hospital (121, 126)Riverside Endoscopy Center (119, 124)Riverview Healthcare Association (121, 126)Rochester Methodist Hospital (121, 123, 125)Sacred Heart Hospital (121, 123, 126)
Sanford - Bismarck (37)Sanford Bemidji Medical Center (120, 123, 125)Sanford Health - Fargo (7, 19, 21, 22, 24, 28, 29, 30, 31, 33,
34, 35, 38, 40, 42, 43, 45, 50, 52, 63, 65, 66, 67, 69, 70, 75, 76, 77, 79, 81, 89, 91, 92, 103, 104, 105, 107, 108)
Sanford Health - Sioux Falls (21, 22, 24, 38, 42, 43, 49, 69, 70, 75, 76, 77, 79, 107, 108)
Sanford Medical Center Fargo (120, 123, 126)Sanford Thief River Falls (120, 125)Sanford USD Medical Center (121, 123, 125)Schwieters Medical PLLC (41)Setzer Pharmacy (47, 57, 59, 61)Shopko (47, 57, 59, 61)Sibley Medical Center (121, 126)Sleepy Eye Municipal Hospital (121, 126)Southdale Otolaryngology, PA (112, 113)Southdale Pediatric Associates, Ltd (5, 22, 33, 34, 35, 38, 75,
76, 77, 89, 105)Southside Community Health Services (83)Specialized Treatment Services, Inc (10)Spencer Municipal Hospital (121, 125)Spooner Health System (121, 126)St Paul-Ramsey County Department of Public Health (44)St. Cloud Ear, Nose & Throat - Head & Neck Clinic (96, 97,
112, 113)St. Cloud Hospital (11, 12, 14, 41, 119, 122, 124)St. Cloud Orthopedic Associates, Ltd (45, 100, 101, 116, 117)St. Cloud Surgical Center (119, 124)St. Croix Orthopaedics, PA (45, 100, 101, 116, 117)St. Croix Regional Medical Center (19, 21, 22, 24, 28, 29, 30,
31, 38, 41, 44, 45, 50, 52, 63, 65, 66, 67, 69, 70, 75, 76, 77, 79, 81, 89, 91, 92, 103, 104, 107, 108, 112, 113, 114, 115, 120, 122, 125)
St. Francis Regional Medical Center (119, 122, 125)St. Gabriel’s Hospital (119, 122, 124)St. Joseph’s Area Health Services (121, 123, 126)St. Joseph’s Hospital (120, 122, 126)St. Luke’s Clinics (7, 18, 21, 22, 24, 26, 28, 29, 30, 31, 33, 34,
35, 38, 41, 42, 44, 50, 52, 63, 65, 66, 67, 69, 70, 72, 75, 76, 77, 79, 81, 89, 91, 92, 98, 99, 103, 104, 105, 107, 108, 114, 115)
St. Luke’s Hospital (120, 123, 125)St. Mary’s Hospital (120, 123, 125)St. Mary’s Medical Center Acute Care (11, 12)St. Paul Corner Drug (47, 61)St. Paul Family Medical Center (21, 22, 24, 38, 69, 70, 75, 76,
77, 83)Stevens Community Medical Center (121, 126)Stillwater Medical Group (7, 9, 18, 21, 22, 24, 26, 28, 29, 30,
31, 33, 34, 35, 38, 42, 44, 50, 51, 63, 65, 66, 67, 69, 70, 72, 75, 76, 77, 79, 81, 83, 85, 89, 91, 92, 96, 97, 98, 99, 103, 104, 105, 107, 108, 112, 113, 114, 115)
Stone Creek Psychiatry, LLC (41)Summit Orthopedics, Ltd (45, 100, 101, 116, 117)SuperValu/Cub (47, 57, 59, 61)Surgical Consultants (50)Target (47, 57, 59, 61)The Calli Institute, LLC (40)The Emily Program (40)The Heart Institute of North Dakota (42)The Medicine Shoppe (47, 61)

HealthPartners Clinical Indicators Report — 2013/2014 Results131
PARTICIPATING PROVIDERSTri - County Hospital (120, 125)TRIA Orthopaedic Center, LLC (100, 101, 119, 124)Tri-County Hospital, Inc (50)Twin Cities Orthopedics, PA (45, 100, 101, 116, 117)Twin Cities Spine Center (100, 101)United Family Medicine (19, 50, 51, 63, 65, 66, 67, 79, 83, 85)United Heart and Vascular Clinic (94, 95)United Hospital (14, 119, 123, 124, 11, 12)United Hospital District - Blue Earth (121, 126)Unity Family Healthcare (19, 43, 45, 50, 52, 79, 83, 89, 107,
108)Unity Hospital (11, 12, 119, 123, 124)University Medical Center - Mesaba (120, 122, 126)University of Iowa Hospitals & Clinics (120, 125)University of Minnesota Medical Center, Fairview (120, 123,
124)University of MN Physicians (7, 9, 18, 21, 22, 24, 26, 28, 29,
30, 31, 38, 40, 44, 45, 50, 52, 63, 65, 66, 67, 69, 70, 72, 75, 76, 77, 79, 81, 83, 85, 89, 91, 92, 96, 97, 100, 101, 103, 104, 107, 108, 112, 113, 114, 115, 116, 117)
University of MN Physicians Heart at Fairview (42, 54, 55, 110, 111)
University of Wisconsin Hospital & Clinics (120, 125)Valley Family Practice (21, 24, 38, 69, 70)Volunteers of America Mental Health Clinics (41)Walgreens (47, 57, 59, 61)Wal-Mart/Sam’s Club (47, 57, 59, 61)Washburn Center For Children (40)We Care Counseling Center (10)West End Consultation Group (41)West Side Community Health Center (7, 19, 44, 49, 52, 63,
65, 66, 67, 83, 85)Western Wisconsin Medical Associates, SC Clinics (7, 19, 21,
22, 24, 28, 29, 30, 31, 33, 34, 35, 37, 43, 69, 70, 75, 76, 77, 79, 81, 91, 92, 103, 104, 105, 107, 108, 114, 115)
Westfi elds Hospital (see also New Richmond Clinic) (107, 108, 119, 122, 124)
WestHealth Surgery (119, 124)William L. Clapp, MD (41)Winona Health Services (18, 43, 49, 51, 63, 65, 66, 67, 79,
89, 107, 108, 121, 123, 126)Wise Regional Health System (121, 126)Women’s Health Consultants (81, 98, 99)Woodbury Ambulatory Surgery Center (119, 124)Zvi Frankfurt, MD (41)

8170 33rd Avenue South P.O. Box 1309 Minneapolis, MN 55440-1309healthpartners.com
Our mission is to improve health and well-being in partnership with our members, patients and community.
NCQA’s ‘Excellent’ Accreditation status is reserved for the best health plans in the nation. It is only awarded to those plans that meet or exceed NCQA’s rigorous requirements for consumer protection and quality improvement and deliver excellent clinical care.
The NCQA HEDIS Compliance Audit verifies compliance with HEDIS specifications and assures a managed care organization has adequate and sound capabilities for processing medical, member and provider information as a foundation for accurate and automated performance measurement.
HED
IS CO MPLIAN CE AUDIT
A U D I TE D
2014
4391 (10/14) © 2014 HealthPartners