2014 comprehensive water resources report
TRANSCRIPT
2014 COMPREHENSIVE WATER
RESOURCES REPORT
Final Report
Prepared for: Ventura Water 501 Poli Street Ventura, CA 93002
Prepared by: RBF Consulting, a Company of Michael Baker International 5051 Verdugo Way, Suite 300 Camarillo, CA 93012 Contact: Contact: Kevin Gustorf, P.E. (949) 472-3429
May 1, 2014

EXECUTIVE SUMMARY
2014 COMPREHENSIVE WATER RESOURCES REPORT
ES-1 FINAL REPORT: MAY 1, 2014
EXECUTIVE SUMMARY
PREVIOUS COUNCIL ACTION
On March 4, 2013, Council received the Draft 2013 Comprehensive Water Resources Report and
directed the City Manager, Ventura Water and Community Development to work together to develop a
short term balance of water supply and demand; a predictable use of data to serve pending and projected
development over the next 5 years; provide a recommendation for long term water supply and demand
policy; and return to Council in May with the final report.
On June 3, 2013 the City Council approved the 2013 Comprehensive Water Resources Report. In
addition to approving the report the City Council directed staff to provide an annual update on the City’s
projected water supply and demand; and to use the local water land use demand factors for the
evaluation of all development and the standardized “Water Demand Impact Summary” matrix to quantify
the water supply demand of each individual project and the cumulative water supply demand of all
approved projects.
2014 CWRR UPDATES
Understanding and monitoring our water supply and demand is essential to planning for and managing a
stable and reliable water system to support our community and economic growth. The City’s supply and
demand plays an important role and dramatically influences the planning for, development of and
investment of significant dollars in capital improvements, maintaining our current water supply and
investing in new water supplies. Council approved the 2013 Comprehensive Water Resources Report
(2013 CWRR) in June 2013 and directed staff to provide an annual update on the City’s projected water
supply and demand.
Below is Table ES-1, a summary of the most current and best information available on our water supply
and demand.

EXECUTIVE SUMMARY
2014 COMPREHENSIVE WATER RESOURCES REPORT
ES-2 FINAL REPORT: MAY 1, 2014
Table ES-1 Summary of Water Supply and Demand
Projected 2015 Drought (AFY) 2015 (AFY) 2020 (AFY) 2025 (AFY)
Supply 14,824 – 16,824 19,535 – 20,935 19,684 – 23,584 20,384 – 24,284
Demand* 17,660 17,660 18,428 18,428
Available Supply (2,836) – (836) 1,875 – 3,275 1,256 – 5,156 1,956 – 5,856
*Demand equals baseline 5 year average (17,343 AF) plus the estimated demand from 350 units built
annually from the approved projects list for future years.
As shown in the table above, the projected 2015 drought water supply numbers are less than the
projected water demand numbers. This indicates that if the current drought condition continues, the City
will need to go into mandatory conservation measures and/or pay penalties for overuse of the City’s water
supply sources.
Changes from the 2013 CWRR to the 2014 CWRR are summarized below.
Baseline Demand
The baseline water demand of 17,601 acre feet (AF) in the 2013 CWRR was established utilizing the
previous 5-year City annual average. Utilizing the same criteria, the baseline water demand for the 2014
CWRR is 17,343 AF, a decrease of approximately 260 AF. This decrease can mainly be attributed to a
low calendar year 2013 water demand that decreases the 5-year average, the prolonged economic
downturn, and increased water rates.
Supply
The 2013 CWRR water supply numbers were revised in the 2014 CWRR to reflect changes to the City’s
existing supply sources that have come up over the past year including the current drought condition and
the projection of the drought through 2015. The water supply source revisions are due to the following
water supply issues:
• Casitas: A reduction in the amount of available water from Lake Casitas due to the current
drought. Lake Casitas is currently below 60% capacity and is anticipated to reach 50% by this

EXECUTIVE SUMMARY
2014 COMPREHENSIVE WATER RESOURCES REPORT
ES-3 FINAL REPORT: MAY 1, 2014
fall. Once Lake Casitas reaches 50% capacity, Casitas is anticipated to require a cutback in the
City’s supply. We have included an anticipated required reduction of 10% to our Casitas supply
for the projection of the current drought through 2015.
• Ventura River/Foster Park: Due to the continued drought conditions, the City’s ability to draw
water from the Ventura River has been significantly impacted. We have included a lower range to
reflect the minimum supply anticipated from the Ventura River for the projection of the current
drought through 2015.
• Oxnard Plain Groundwater Basin (Fox Canyon Aquifer): After several special meetings in the
past two months and several iterations of an emergency ordinance, the Fox Canyon Groundwater
Management Agency (FCGMA) Board approved Emergency Ordinance E at a Special Meeting
on April 11, 2014. The emergency ordinance limits extractions from groundwater extraction
facilities within the FCGMA boundary, suspends use of credits and prohibits the construction of
any groundwater extraction facilities and/or the issuance of any groundwater extraction facilities
permit. By January 1, 2016, the City will be restricted to 305 AF less (3,799 AF) than the City’s
current allocation of 4,104 AF and during the duration of the ordinance the City will pay
surcharges for exceeding because the City may not rely on its conservation credits that were set
aside during wet years.
• Santa Paula Groundwater Basin (Santa Paula Basin): The low range has been increased from
zero to the current reliable water supply of 1,600 acre feet based on recent agreements and
studies underway. In addition, the City recently acquired 5.8 acre feet of groundwater rights in
the Santa Paula Basin from the past development of Tract 4632.
RECOMMENDATIONS
The results of this Report indicate that the spread between the current water demand and the
current water supply is very tight, and if the drought continues the supply could be less than the
demand. This presents significant challenges for the City moving forward in the ability to allocate
water supply to development projects that will generate additional water demands. The
recommendations for the City moving forward include:
1. Track the total water consumption on an annual basis.
2. Re-calculate the 3-year, 5-year and 10-year water consumption averages on an annual basis.
EXECUTIVE SUMMARY
2014 COMPREHENSIVE WATER RESOURCES REPORT
ES-4 FINAL REPORT: MAY 1, 2014
3. Update the water supply portfolio on an annual basis.
4. Update the existing land use data on an annual basis. This can be done through a system
that tracks the development projects as the transition from “Under Construction” to “Existing,”
and “Approved” to “Under Construction.”
5. All future development projects should be evaluated based on current supply and demand
conditions.
6. Consider adding a new project type in the land use tracking spreadsheet for approved
projects under CIP or other City approval processes.
7. Use the City-specific water usage factors to calculate the water demand of all development
projects as the projects proceed through the City process prior to approval.
8. Continue to develop water supply through demand side management, securing water rights,
establishing an in-lieu fee ordinance and continue to integrate the new water supply sources
into the City’s water supply portfolio.

TABLE OF CONTENTS
2014 COMPREHENSIVE WATER RESOURCES REPORT
i FINAL REPORT: MAY 1, 2014
Table of Contents
1. INTRODUCTION .......................................................................................... 1-1 A. Introduction ................................................................................................................... 1-1
B. Purpose of the Report [NO CHANGES] ....................................................................... 1-1
C. Study Area [NO CHANGES] ........................................................................................ 1-2
D. Document Comparison [NO CHANGES] ..................................................................... 1-2
E. Demand Factor Comparison [NO CHANGES] ............................................................. 1-2
F. Current Planning Data .................................................................................................. 1-2
G. 2012 LAFCo Municipal Service Review [NO CHANGES] .......................................... 1-2
H. Reference Documents ................................................................................................ 1-2
2. LAND USE ................................................................................................... 2-1
A. Existing Land Use ........................................................................................................ 2-1
B. Future Land Use........................................................................................................... 2-3
1. Under Construction and Approved ............................................................................... 2-3
2. Future Potential ............................................................................................................ 2-3
3. WATER DEMANDS ..................................................................................... 3-1
A. Existing Demand Condition .......................................................................................... 3-1
B. Consumption and Usage Factors [NO CHANGES] ..................................................... 3-3
C. Usage Factor Comparison [NO CHANGES] ................................................................ 3-4
D. Historical Water Consumption (Baseline Demand Condition) ..................................... 3-5
E. Future Demand Projections (Approved Projects Only) ................................................ 3-8
4. WATER SUPPLY ......................................................................................... 4-1
A. Introduction [NO CHANGES] ....................................................................................... 4-1
B. Current Water Supply Sources [NO CHANGES] ......................................................... 4-1
C. Future Water Supply .................................................................................................... 4-1
1. Casitas Municipal Water District .................................................................................. 4-1
2. Ventura River Surface Water Intake and Upper Ventura River Groundwater Basin ... 4-2
3. Mound Groundwater Basin .......................................................................................... 4-2
4. Oxnard Plain Groundwater Basin ................................................................................. 4-2
5. Santa Paula Groundwater Basin .................................................................................. 4-3

TABLE OF CONTENTS
2014 COMPREHENSIVE WATER RESOURCES REPORT
ii FINAL REPORT: MAY 1, 2014
6. Recycled Water [NO CHANGES] ................................................................................. 4-3
D. Potential Additional Future Supply Sources ................................................................. 4-5
1. State Water Project [NO CHANGES] ........................................................................... 4-5
2. Saticoy County Yard Well [NO CHANGES] ................................................................. 4-5
3. Recycled Water ............................................................................................................ 4-5
a.Ventura Water Reclamation Facility ............................................................................. 4-5
b.Ojai Valley Sanitary District .......................................................................................... 4-6
4. Ocean Desalination [NO CHANGES]........................................................................... 4-6
5. Water Conservation Measures/Water Efficiency Plan ................................................. 4-6
6. Establish Water Rights Ordinance ............................................................................... 4-7
5. CONCLUSIONS & RECOMMENDATIONS ................................................. 5-1
A. Conclusions .................................................................................................................. 5-1
B. Recommendations ....................................................................................................... 5-4
TABLE OF CONTENTS
2014 COMPREHENSIVE WATER RESOURCES REPORT
iii FINAL REPORT: MAY 1, 2014
LIST OF TABLES 1-1 Summary of Previous Documents [NO CHANGES]
1-2 Summary of Water Demand Factors in Previous Documents [NO CHANGES]
1-3 Comparison of Residential Water Demand Factors in Previous Documents [NO CHANGES]
2-1 Existing Land Uses per 2005 General Plan [NO CHANGES]
2-2 Summary of “Built” Projects 2005-2012 [NO CHANGES]
2-3 Summary of Existing Land Use – December 2013
2-4 Summary of Approved and Under Construction Projects – December 2013
2-5 Summary of Predicted, Actual and Remaining Development
3-1 Summary of Existing Water Consumption for CY 2013
3-2 Calculation of Raw Consumption Factors for CY 2012 [NO CHANGES]
3-3 Summary of Planning-Level Water Consumption Factors [NO CHANGES]
3-4 Water Consumption Factor Comparison [NO CHANGES]
3-5 Historical Annual Water Consumption
3-6 Projected Total Water Demands Including Under Construction and Approved Projects – Various Baselines
3-7 Total Estimated Demands for Under Construction and Approved Projects
3-8 Projected Water Demand Growth per Absorption Rate
4-1 Summary of Current Water Supply [NO CHANGES]
4-2 Summary of Future Water Supply from Existing Sources
5-1 Demand vs. Supply Projection
LIST OF FIGURES 3-1 Historical Annual Water Consumption
5-1 Demand vs. Supply Projection
LIST OF EXHIBITS 1-1 City Overview [NO CHANGES]
2-1 General Plan Land Use [NO CHANGES]
2-2 Under Construction and Approved Projects
4-1 Supply Sources [NO CHANGES]

TABLE OF CONTENTS
2014 COMPREHENSIVE WATER RESOURCES REPORT
iv FINAL REPORT: MAY 1, 2014
APPENDIX [NO CHANGES] Demand Factors from Other Agencies
LAFCo 13-01S Sphere of Influence Report
2005 General Plan Tables & Figures
2005 General Plan FEIR Tables
2010 UWMP Tables 2011 Water Master Plan Tables
LAFCo MSR Report
2005 General Plan FEIR Water Demand Factors (email correspondence) 2005-2012 Built Projects – Background Data

INTRODUCTION
2014 COMPREHENSIVE WATER RESOURCES REPORT
1-1 FINAL REPORT: MAY 1, 2014
1. INTRODUCTION
A. INTRODUCTION
In 2013, Ventura Water initiated the development of an annual water management tool entitled
the Comprehensive Water Resources Report (CWRR). The CWRR is intended to be a tool in the
development review process as it pertains to water supply and demand. The CWRR is intended
to provide an annual look at the City’s water demand trends, current water demands, demand
projections, and the current and future supply picture. The 2013 CWRR was approved by City
Council in June 2013.
The 2013 CWRR was the first annual version of this report; therefore, the 2013 CWRR included
more historical information related to the genesis of this report and previous studies prepared.
This document, the 2014 CWRR, is intended to be a supplement to the previous year’s
document. Any information provided in the 2013 CWRR that has not changed will not be
included in the 2014 CWRR. The intent of the 2014 CWRR is to provide updated water demand
data based on the previous calendar year’s data (2013) being available and an update on the
City’s future water supply portfolio based on the best available information regarding the City’s
existing and potential future supply sources. The water demand figures will be modified on an
annual basis in order to capture the current water use patterns within the City.
It should be noted that the water demand factors calculated in the 2013 CWRR will not be
updated on annual basis. If it is recommended, the water demand factors will be re-visited every
ten (10) years, unless there is a significant change in the year-over-year annual demand
(quantified as a 30% change in two-year period).
The 2014 CWRR will maintain the same outline as the 2013 CWRR. For any sections, tables or
exhibits where data has changed, a revised section, table or exhibit will be provided herein. If
there are no changes to the section, table or exhibit, it will be noted with “No changes from the
2013 CWRR.”
B. PURPOSE OF REPORT
No changes from the 2013 CWRR.
INTRODUCTION
2014 COMPREHENSIVE WATER RESOURCES REPORT
1-2 FINAL REPORT: MAY 1, 2014
C. STUDY AREA
No changes from the 2013 CWRR.
EXHIBIT 1-1: No changes from the 2013 CWRR.
D. DOCUMENT COMPARISON
No changes from the 2013 CWRR
E. DEMAND FACTOR COMPARISON (from previous documents)
No changes from the 2013 CWRR
TABLE 1-1: No changes from the 2013 CWRR.
TABLE 1-2: No changes from the 2013 CWRR.
TABLE 1-3: No changes from the 2013 CWRR.
F. CURRENT PLANNING DATA
The City Planning Department provided actual development data (“Built” projects) for the year
2013, and data on all projects that are under construction or have received all planning approvals
(“Approved” projects) for development, as of December 31, 2013. This report will consider the
estimated water demand impacts of those projects that are under construction or have received
all planning approvals. Projects listed in the Pending Project database that had not received all
approvals from the City as of December 31, 2013 were not considered in the future water
demand projections for this Report.
G. 2012 LAFCo MUNICIPAL SERVICE REVIEW
No changes from the 2013 CWRR
H. REFERENCE DOCUMENTS
The following documents were referenced in the 2013 CWRR:

INTRODUCTION
2014 COMPREHENSIVE WATER RESOURCES REPORT
1-3 FINAL REPORT: MAY 1, 2014
• 2004 Biennial Water Supply Report
• 2005 Ventura General Plan (August 2005), City of San Buenaventura
• 2005 Ventura General Plan Final EIR, Volumes I and II (August 2005), City of San
Buenaventura
• 2007 General Plan FEIR Supplement
• 2010 Urban Water Management Plan (June 2011), Kennedy/Jenks Consultants
• Water Master Plan (March 2011), RBF Consulting
• Municipal Service Reviews for Nine Ventura County Cities (November 14, 2012), Ventura
Local Agency Formation Commission (LAFCo)
Specific excerpts and data sources from the following documents were used in preparation of the
2013 CWRR and included in the Appendix of the 2013 CWRR, as follows:
• Demand Factors from Other Agencies
• LAFCo 13-01S Sphere of Influence Report
• 2005 General Plan Tables & Figures
• 2005 General Plan FEIR Tables
• 2010 UWMP Tables
• 2011 Water Master Plan Tables
• 2012 LAFCo MSR Report
• 2005 General Plan FEIR Water Demand Factors (email correspondence)
• 2005-2012 Built Projects – Background Data
The following list of references is in addition to the references listed above and was used in the
preparation of 2013 CWRR and/or used in the preparation of the 2014 CWRR:
• Amended and Restated Judgment Entered August 24, 2010: Original Judgment Entered
March 7, 1996 - Santa Paula Groundwater Basin
• Technical Memorandum, City of San Buenaventura Recycled Water Market Assessment
by Kennedy/Jenks Consultants for the City of Ventura, dated April 18, 2007
• Feasibility Study on the Reuse of Ojai Valley Sanitary District Effluent- Final Facilities
Planning Report by Nautilus Environmental, et al for the City of Ventura, dated Sept. 21,
2007
• “Desalination With a Grain of Salt – A California Perspective”, Pacific Institute, 2006

INTRODUCTION
2014 COMPREHENSIVE WATER RESOURCES REPORT
1-4 FINAL REPORT: MAY 1, 2014
• “Key Issues of Desalination in California: Cost and Financing”, Pacific Institute – Heather
Cooley and Newsha Ajami, November 2012
• Treatment Wetlands Feasibility Study Final Report by Carollo Engineers and Stillwater
Sciences for City of Ventura, dated March 2010
• Groundwater Treatment Study Final Report by AECOM for the City of Ventura, dated
March 2011
• Estuary Subwatershed Study Assessment of the Physical and Biological Condition of the
Santa Clara River Estuary, Ventura County, California – Amended Final Report by
Stillwater Sciences for the City of Ventura, dated September 2011
• City of Ventura Water Efficiency Ethics Plan – Ventura Water, Sept. 2011
• Estuary Special Studies Phase 2: Facilities Planning Study for Expanding Recycled
Water Delivery Final Report by Carollo for the City of Ventura, dated March 2013
• Fox Canyon Groundwater Management Agency (FCGMA) Emergency Ordinance – E,
Adopted by the FCGMA Board on April 11, 2014
LAND USE
2014 COMPREHENSIVE WATER RESOURCES REPORT
2-1 FINAL REPORT: MAY 1, 2014
2. LAND USE
A. EXISTING LAND USE
For the purposes of this Report, the “existing” land use picture is considered the year-end of
2013. In order to determine the existing land use make-up within the City’s water service area as
of year-end 2013, all known development projects constructed and utilizing water within Calendar
Year 2013 were added to the land use data published in the 2013 CWRR for the year-end 2012.
An updated Table 2-3 provides a summarized total of the existing (year-end 2013) land use within
the City service area.
Table 2-1: No changes from the 2013 CWRR
Exhibit 2-1: No changes from the 2013 CWRR
Table 2-2: No changes from the 2013 CWRR

H:\pdata\140175\Admin\Reports\Submittals\First DRAFT_April 23, 2014\Report_Tables_Sec2_2-1.2-3.2-5.xlsx 5/1/2014
Table 2-3Summary of Existing Land Use - December 2013
Residential Single-Family
(units)Residential Multi-
Family (units)Non-Residential
(sf)
Existing (as of 2005 General Plan) [1] 22,034 17,142 15,923,154
Constructed (Built Projects 2005 - 2012) [2] 543 1,369 1,394,442Constructed (Built Projects 2013) [3] 28 0 4,356
Total Existing Land Use (through 2013) 22,605 18,511 17,321,952[1] Per Table 2-1[2] Per Table 2-2[3] Per data provided by Ventura Water, Built Projects part of CY 2013 water demand (Aldea Hermosa, 28 SFDU and Ckick-Fil-A, 4,356 SF).

LAND USE
2014 COMPREHENSIVE WATER RESOURCES REPORT
2-3 FINAL REPORT: MAY 1, 2014
B. FUTURE LAND USE
The City maintains a database of projects that are in a phase of the planning process. The
database includes all projects from those that are in the conceptual phase to those that are in
construction. For the purposes of this Report, the priority was to determine those projects that
the City has made commitments to, and to determine the water resources required to meet the
anticipated water demand of the projects.
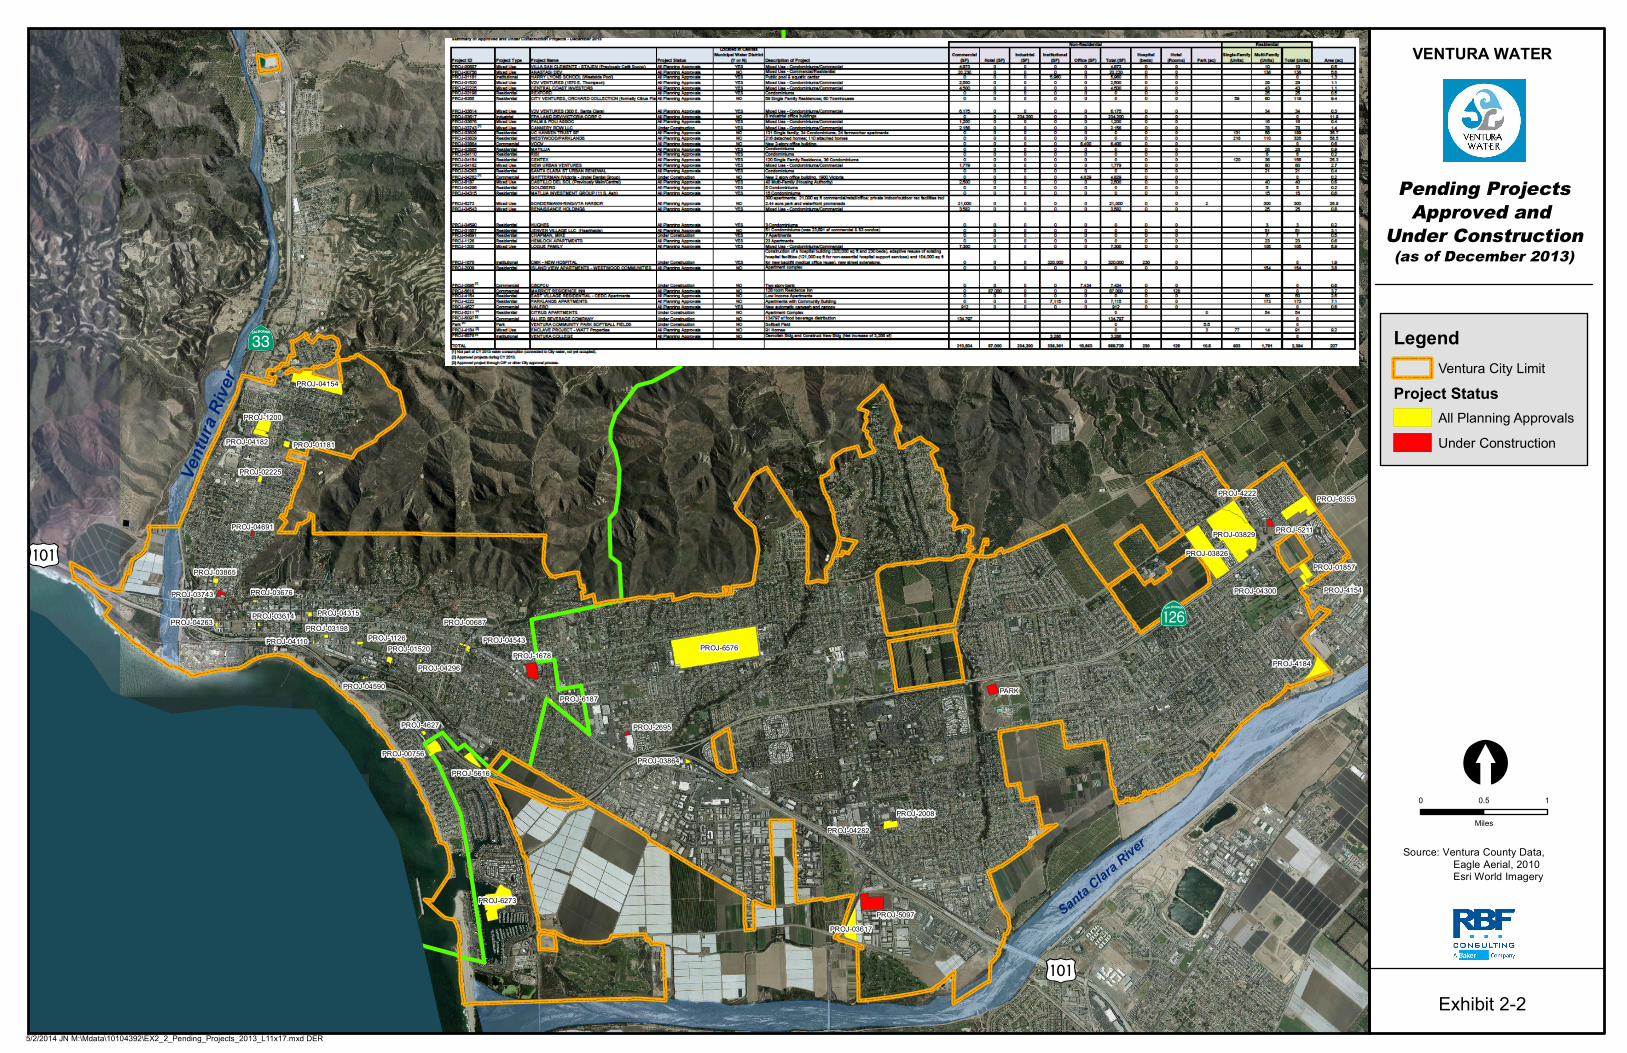
1. Under Construction and Approved Projects
The City Planning Department provided a listing of all the development projects within the
City that are “In Planning Process,” “In Plan Check,” “Under Construction,” or have “All
Planning Approvals.” The list was narrowed down to those projects that are either “Under
Construction,” or have “All Planning Approvals.” Some modifications and adjustments
were made based on review and data provided by Ventura Water and City Planning staff.
The Under Construction and Approved Projects as of December 31, 2013 are shown on
an updated Table 2-4. Table 2-4 provides specific data about each project, including the
project number, type, name, status, description and land use details. The table also
identifies if the project is located within the boundary of the Casitas Municipal Water
District. Exhibit 2-2 identifies the location of each Project that is “Under Construction” or
has “All Planning Approvals.”
2. Future Potential (per 2005 General Plan)
Table 3-2 of the 2005 General Plan identifies the predicted development intensity and
pattern that was anticipated to occur within the General Plan boundary through the
planning horizon of year 2025. As mentioned previously, the City provided information as
to the development areas that have been constructed, are currently under construction,
or are approved for development since the 2005 General Plan through the end of year
2012. Table 2-5 provides a summary of the 2005 General Plan predicted development, a
summary of the projects constructed from 2005-2013, a summary of the projects that are
under construction or approved, and calculates the remaining developable land through
the 2025 planning horizon. It should be noted that the residential unit count is not divided
up by the density.

H:\pdata\140175\Admin\Reports\Submittals\First DRAFT_April 23, 2014\Report_Tables_Sec2_2-4 (Approved and Under Constr.).xlsx 5/2/2014
Table 2-4
Project ID Project Type Project Name Project Status
Located in Casitas Municipal Water District
(Y or N) Description of ProjectCommercial
(SF) Hotel (SF)Industrial
(SF)Institutional
(SF) Office (SF) Total (SF)Hospital (beds)
Hotel (Rooms) Park (ac)
Single-Family (Units)
Multi-Family (Units) Total (Units) Area (ac)
PROJ-00687 Mixed Use VILLA SAN CLEMENTE - STAJEN (Previously Café Scoop) All Planning Approvals YES Mixed Use - Condominiums/Commercial 4,873 0 0 0 0 4,873 0 0 10 10 0.5PROJ-00756 Mixed Use ANASTASI DEV. All Planning Approvals NO Mixed Use - Commercial/Residential 20,230 0 0 0 0 20,230 0 0 138 138 5.6PROJ-01181 Institutional HARRY LYONS SCHOOL (Westside Pool) All Planning Approvals YES Public pool & aquatic center 0 0 0 5,960 0 5,960 0 0 0 1.3PROJ-01520 Mixed Use V2V VENTURES (1570 E. Thompson) All Planning Approvals YES Mixed Use - Condominiums/Commercial 2,500 0 0 0 0 2,500 0 0 29 29 1.1PROJ-02225 Mixed Use CENTRAL COAST INVESTORS All Planning Approvals YES Mixed Use - Condominiums/Commercial 4,500 0 0 0 0 4,500 0 0 43 43 1.1PROJ-03198 Residential REXFORD All Planning Approvals YES Condominiums 0 0 0 0 0 0 0 0 25 25 0.5PROJ-6355 Residential CITY VENTURES, ORCHARD COLLECTION (formally Citrus Plac All Planning Approvals NO 59 Single Family Residences; 60 Townhouses 0 0 0 0 0 0 0 0 59 60 119 9.4
PROJ-03614 Mixed Use V2V VENTURES (300 E. Santa Clara) All Planning Approvals YES Mixed Use - Condominiums/Commercial 6,175 0 0 0 0 6,175 0 0 34 34 0.3PROJ-03617 Industrial FPA LAND DEV/VICTORIA CORP C All Planning Approvals NO 8 industrial office buildings 0 0 234,200 0 0 234,200 0 0 0 11.9PROJ-03676 Mixed Use PALM & POLI ASSOC All Planning Approvals YES Mixed Use - Condominiums/Commercial 1,200 0 0 0 0 1,200 0 0 16 16 0.4PROJ-03743 [1] Mixed Use CANNERY ROW LLC Under Construction YES Mixed Use - Condominiums/Commercial 2,156 0 0 0 0 2,156 0 0 78 78 1.4PROJ-03826 Residential UC HANSEN TRUST SP All Planning Approvals NO 131 Single family; 34 Condominiums; 24 farmworker apartments 0 0 0 0 0 0 0 0 131 58 189 35.7PROJ-03829 Residential WESTWOOD/PARKLANDS All Planning Approvals NO 216 detached homes; 110 attached homes 0 0 0 0 0 0 0 0 216 110 326 58.5PROJ-03864 Commercial VOOV All Planning Approvals NO New 2-story office building. 0 0 0 0 6,400 6,400 0 0 0 0.6PROJ-03865 Residential MATILIJA All Planning Approvals YES Condominiums 0 0 0 0 0 0 0 0 28 28 0.9PROJ-04110 Residential RISI All Planning Approvals YES Condominiums 0 0 0 0 0 0 0 0 6 6 0.2PROJ-04154 Residential CENTEX All Planning Approvals YES 120 Single Family Residence, 36 Condominiums 0 0 0 0 0 0 0 0 120 36 156 25.3PROJ-04182 Mixed Use NEW URBAN VENTURES All Planning Approvals YES Mixed Use - Condominiums/Commercial 1,779 0 0 0 0 1,779 0 0 80 80 2.7PROJ-04263 Residential SANTA CLARA ST URBAN RENEWAL All Planning Approvals YES Condominiums 0 0 0 0 0 0 0 0 21 21 0.4PROJ-04282 [1] Commercial GHITTERMAN (Victoria - Jindel Dental Group) Under Construction NO New 2 story office building. 1900 Victoria 0 0 0 0 4,829 4,829 0 0 0 0.2PROJ-6187 Mixed Use CASTILLO DEL SOL (Previously Main/Central) All Planning Approvals YES 40 Multi-Family (Housing Authority) 2,500 0 0 0 0 2,500 0 0 40 40 0.6PROJ-04296 Residential GOLDBERG All Planning Approvals YES 5 Condominiums 0 0 0 0 0 0 0 0 5 5 0.2PROJ-04315 Residential MATLIJA INVESTMENT GROUP (11 S. Ash) All Planning Approvals YES 15 Condonimiums 0 0 0 0 0 0 0 0 15 15 0.6
PROJ-6273 Mixed Use SONDERMANN-RING/VTA HARBOR All Planning Approvals NO300 apartments; 21,000 sq ft commercial/retail/office; private indoor/outdoor rec facilities incl 2.44 acre park and waterfront promenade 21,000 0 0 0 0 21,000 0 0 2 300 300 26.9
PROJ-04543 Mixed Use RENAISSANCE HOLDINGS All Planning Approvals YES Mixed Use - Condominiums/Commercial 3,582 0 0 0 0 3,582 0 0 25 25 0.8
PROJ-04590 Residential HUGHES All Planning Approvals YES 3 Condominiums 0 0 0 0 0 0 0 0 3 3 0.2PROJ-01857 Residential JENVEN VILLAGE LLC (Hearthside) All Planning Approvals NO 51 Condominiums (was 23,691 sf commercial & 83 condos) 0 0 0 0 0 0 0 0 51 51 3.1PROJ-04691 Residential CHAPMAN, MIKE Under Construction YES 7 Apartments 0 0 0 0 0 0 0 0 7 7 0.5PROJ-1126 Residential HEMLOCK APARTMENTS All Planning Approvals YES 23 Apartments 0 0 0 0 0 0 0 0 23 23 0.6PROJ-1200 Mixed Use LOGUE FAMILY All Planning Approvals YES Mixed Use - Condominiums/Commercial 7,300 0 0 0 0 7,300 0 0 105 105 5.9
PROJ-1678 Institutional CMH - NEW HOSPITAL Under Construction YES
Construction of a hospital building (320,000 sq ft and 230 beds), adaptive resuse of existing hospital facilities (121,000 sq ft for non-essential hospital support services) and 104,000 sq ft for new backfill medical office reuse), new street extensions. 0 0 0 320,000 0 320,000 230 0 0 1.9
PROJ-2008 Residential ISLAND VIEW APARTMENTS - WESTWOOD COMMUNITIES All Planning Approvals NO Apartment complex 0 0 0 0 0 0 0 0 154 154 3.8
PROJ-2695 [1] Commercial CBCFCU Under Construction NO Two story bank 0 0 0 0 7,434 7,434 0 0 0 0.6PROJ-5616 Commercial MARRIOT RESIDENCE INN All Planning Approvals NO 128 room Residence Inn 0 87,000 0 0 0 87,000 0 128 0 3.7PROJ-4154 Residential EAST VILLAGE RESIDENTIAL - CEDC Apartments All Planning Approvals NO Low Income Apartments 0 0 0 0 0 0 0 0 50 50 2.5PROJ-4222 Residential PARKLANDS APARTMENTS All Planning Approvals NO Apartments with Community Building 0 0 0 7,115 0 7,115 0 0 173 173 7.1PROJ-4627 Commercial VALERO All Planning Approvals YES New automatic carwash and canopy 912 0 0 0 0 912 0 0 0 0.6PROJ-5211 [2] Residential CITRUS APARTMENTS Under Construction NO Apartment Complex 0 0 54 54PROJ-5097 [2] Commercial ALLIED BEVERAGE COMPANY Under Construction NO 134797 sf food beverage distribution 134,797 134,797 0Park [3] Park VENTURA COMMUNITY PARK SOFTBALL FIELDS Under Construction NO Softball Field 0 5.5 0PROJ-4184 [2] Mixed Use ENCLAVE PROJECT - WATT Properties All Planning Approvals NO 91 Homes 0 3 77 14 91 9.2PROJ-6576 [3] Institutional VENTURA COLLEGE All Planning Approvals NO Demolish Bldg and Construct New Bldg (Net increase of 3,286 sf) 3,286 3,286 0
TOTAL 213,504 87,000 234,200 336,361 18,663 889,728 230 128 10.8 603 1,791 2,394 227[1] Not part of CY 2013 water consumption (connected to City water, not yet occupied).[2] Approved projects during CY 2013.[3] Approved project through CIP or other City approval process as of end of CY 2013.
Summary of Approved and Under Construction Projects - December 2013ResidentialNon-Residential

H:\pdata\140175\Admin\Reports\Submittals\First DRAFT_April 23, 2014\Report_Tables_Sec2_2-1.2-3.2-5.xlsx 5/1/2014
Table 2-5Summary of Predicted, Actual and Remaining Development
Non-Residential
Retail (sf) Office (sf) Industrial (sf) Hotel (sf) Total (sf)
2005 General Plan Prediction [1] 8,318 1,241,377 1,213,214 2,235,133 530,000 5,219,724
Actual Development (Built 2005-2012) [2] 1,912 320,102 320,102 754,239 0 1,394,442
Constructed (Built 2013) [4] 28 4,356 0 0 0 4,356
Remaining Developable Land (as of end 2013) 6,378 916,920 893,113 1,480,894 530,000 3,820,926
Approved & Under Construction Projects [3] 2,394 213,504 18,663 570,561 87,000 889,728
Remaining Developable Land (through 2025) 3,984 703,416 874,450 910,333 443,000 2,931,198
[3] Per Table 2-4. Square footage for the "Institutional" Category was added to the "Industrial" category.[4] Per Table 2-3.
[1] Source: Table 3-2 of 2005 General Plan.
Residential Development
(units)
[2] Per Table 2-2. The "Retail/Office" square footage listed in Table 2-2 was split evenly for the purposes of this table.
Service Layer Credits: Source: Esri,DigitalGlobe, GeoEye, i-cubed, USDA, USGS,AEX, Getmapping, Aerogrid, IGN, IGP,swisstopo, and the GIS User Community
AåE
KÍ
KÍ
?üE
Santa Clara RiverPacificOcean
Ventu
ra Riv
er
PROJ-03829
PROJ-03826
PROJ-04154
PROJ-6273
PROJ-6355
PROJ-03617
PROJ-4222
PROJ-04300
PROJ-5211
PROJ-1678
PROJ-1200
PROJ-00756
PROJ-4184
PROJ-01857
PROJ-2008
PROJ-5616
PROJ-04182
PROJ-4154PROJ-03743
PROJ-01181
PROJ-01520
PROJ-02225
PROJ-03865
PROJ-04543
PROJ-2695
PROJ-04315
PARK
PROJ-4627
PROJ-1126
PROJ-03864
PROJ-6576
PROJ-03198
PROJ-04691
PROJ-04263
PROJ-5097
PROJ-6187
PROJ-03614
PROJ-03676
PROJ-04590
PROJ-04296
PROJ-04110
PROJ-00687
PROJ-04282
Exhibit 2-2
Source: Ventura County Data, Eagle Aerial, 2010 Esri World Imagery
[
Pending ProjectsApproved and Under Construction(as of December 2013)
5/2/2014 JN M:\Mdata\10104392\EX2_2_Pending_Projects_2013_L11x17.mxd DER
0 10.5
Miles
VENTURA WATER
LegendVentura City Limit
Project StatusAll Planning ApprovalsUnder Construction

WATER DEMANDS
2014 COMPREHENSIVE WATER RESOURCES REPORT
3-1 FINAL REPORT: MAY 1, 2014
3. WATER DEMANDS
A. EXISTING DEMAND CONDITION
Ventura Water staff provided a summary of the meter consumption data for the entire service
area for the calendar years (CY) 2004 - 2013 (Historical Water Consumption). Table 3-1
summarizes the total water consumption for each consumption category within the City’s water
service area for the most recent complete year of data, CY 2013. As shown in Table 3-1, the
total water consumption for CY 2013 was 17,723 AFY (including the 6.5% water loss factor),
down slightly from CY 2012. This decrease can mainly be attributed to a low CY 2013 water
demand that decreases the five-year average, the prolonged economic downturn and increased
water rates. The annual water consumption figures for the past ten years are provided in
subsection 3.D.

H:\pdata\140175\Admin\Reports\Submittals\First DRAFT_April 23, 2014\Report_Tables_Sec3.xlsx 5/1/2014
Table 3-1Summary of Existing Water Consumption for CY 2013
City Consumption Category
Water Consumption
(HCF) [1]
Water Consumption
(gpm)
Water Consumption
(gpd)
Water Consumption
(AFY)
Water Consumption +
6.5% Loss (AFY)
Single Family 3,157,097 4,492.98 6,469,886 7,248 7,719
Multi Family 1,618,364 2,303.15 3,316,538 3,715 3,957
Commercial/Retail/Industrial/Hotel 1,459,099 2,076.50 2,990,154 3,350 3,567
Public/Institutional (Municipal/Church/School) 271,867 386.90 557,141 624 665
Hospitals 84,904 120.83 173,995 195 208
Parks/Landscape/Irrigation 430,949 613.30 883,150 989 1,054
Other [2] 226,613 322.50 464,401 520 554
Total 7,248,893 10,316.16 14,855,266 16,641 17,723[1] Source: HCF Consumption Data Tables (CY 2013) provided by Ventura Water.
[2] "Other" category includes all other accounted-for water such as construction water, water/sewer system maintenance, measured leakage. In addition, this includes 'grandfathered' users with water entitlements requiring special service conditions and oil industry use.
WATER DEMANDS
2014 COMPREHENSIVE WATER RESOURCES REPORT
3-3 FINAL REPORT: MAY 1, 2014
B. CONSUMPTION AND USAGE FACTORS
No changes from the 2013 CWRR.
Table 3-2: No changes from the 2013 CWRR.
Table 3-3: No changes from the 2013 CWRR.

WATER DEMANDS
2014 COMPREHENSIVE WATER RESOURCES REPORT
3-4 FINAL REPORT: MAY 1, 2014
C. USAGE FACTOR COMPARISON
No changes from the 2013 CWRR.
Table 3-4: No changes from the 2013 CWRR.

WATER DEMANDS
2014 COMPREHENSIVE WATER RESOURCES REPORT
3-5 FINAL REPORT: MAY 1, 2014
D. HISTORICAL WATER CONSUMPTION (BASELINE DEMAND CONDITION)
To calculate the total near-term water demand, the projected demands must be added to a
baseline demand condition. The baseline demand should consider the historical water usage of
the entire service area over an extended duration, in order to account for the year-to-year
anomalies that can occur. City-wide water demands will vary from year to year based on several
factors, including climate, water rates, the local economy, and environmental restrictions among
other factors. To determine a recommended baseline, the historical water data was gathered for
the past 10-year period. Ventura Water staff provided historical water consumption data for CY
2004 through 2013. Table 3-5 provides a summary of the City-wide water consumption for each
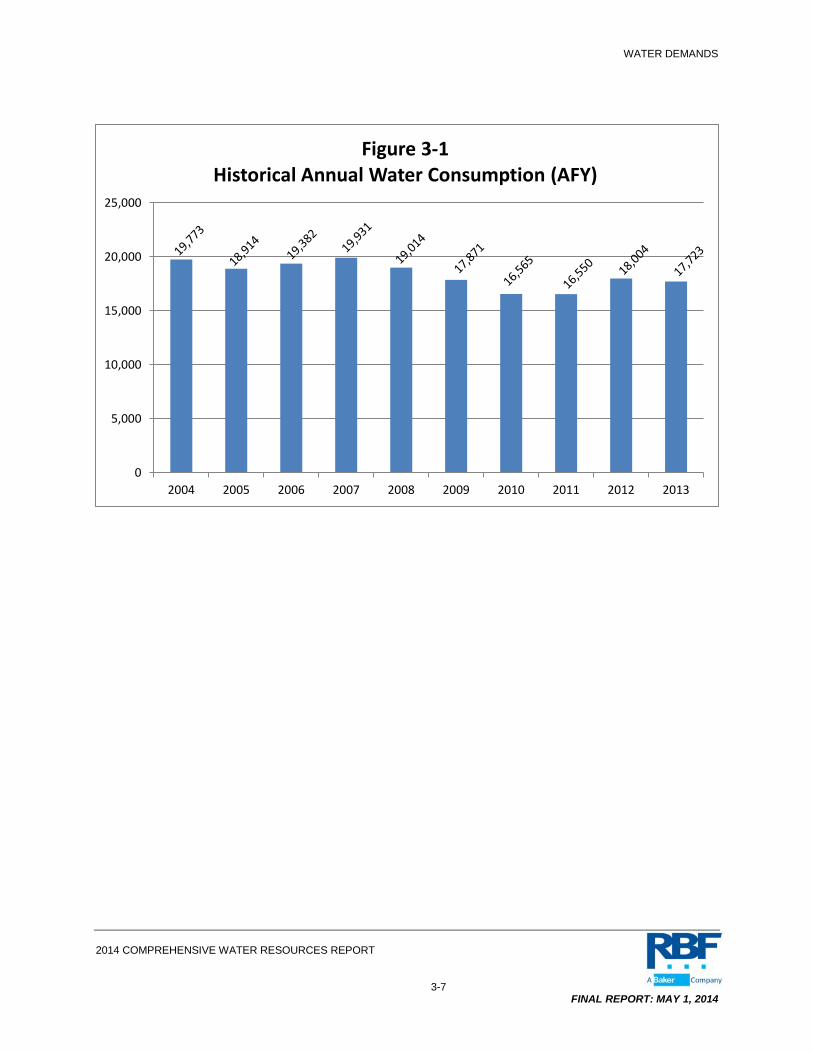
year from 2004 to 2013. The consumption numbers are also depicted graphically on Figure 3-1.
As noted in the table, the average annual water consumption for Years 2004-2008 (19,403 AFY)
was significantly higher than the average annual consumption for Years 2009-2013 (17,343 AFY).
The drop in consumption is likely due to several factors, including improvements to the City’s
distribution system to control water loss, more aggressive water conservation measures, less
construction activity, and a weaker economy. Some of the water use reduction trends may revert
back to previous habits, however some will remain. With the State’s passing of SB x7-7, all
agencies are required to maintain a reduced urban water use target. This bill will result in water
municipalities maintaining aggressive water conservation programs.
The historical data was used to develop the baseline demand condition, which is identified in
Table 3-5. The City experienced a steady decline in total water consumption from its’ peak year
of 2007 (19,931 AFY) to the low year of 2011 (16,550 AFY). Over the most recent 5-year period,
the average annual water consumption was 17,343 AFY, with the lowest year approximately
4.6% lower than the average and the highest year approximately 14.9% above the average.
Over the 10-year period, the average annual water consumption was 18,373 AFY, with the lowest
year approximately 9.9% lower than the average and the highest year approximately 8.5% above
the average.
For the purposes of establishing a baseline average annual water demand for the existing
condition, it is recommended to use the 10-year average from the preceding ten years of data to
capture the various factors influencing water consumption over the recent period. Due to the
prolonged economic downturn, the significant restrictions placed on the imported water supply to
southern California, and the recent drought conditions, it was determined that a longer period was
necessary to determine the baseline demand condition that is more reflective of a typical demand
WATER DEMANDS
2014 COMPREHENSIVE WATER RESOURCES REPORT
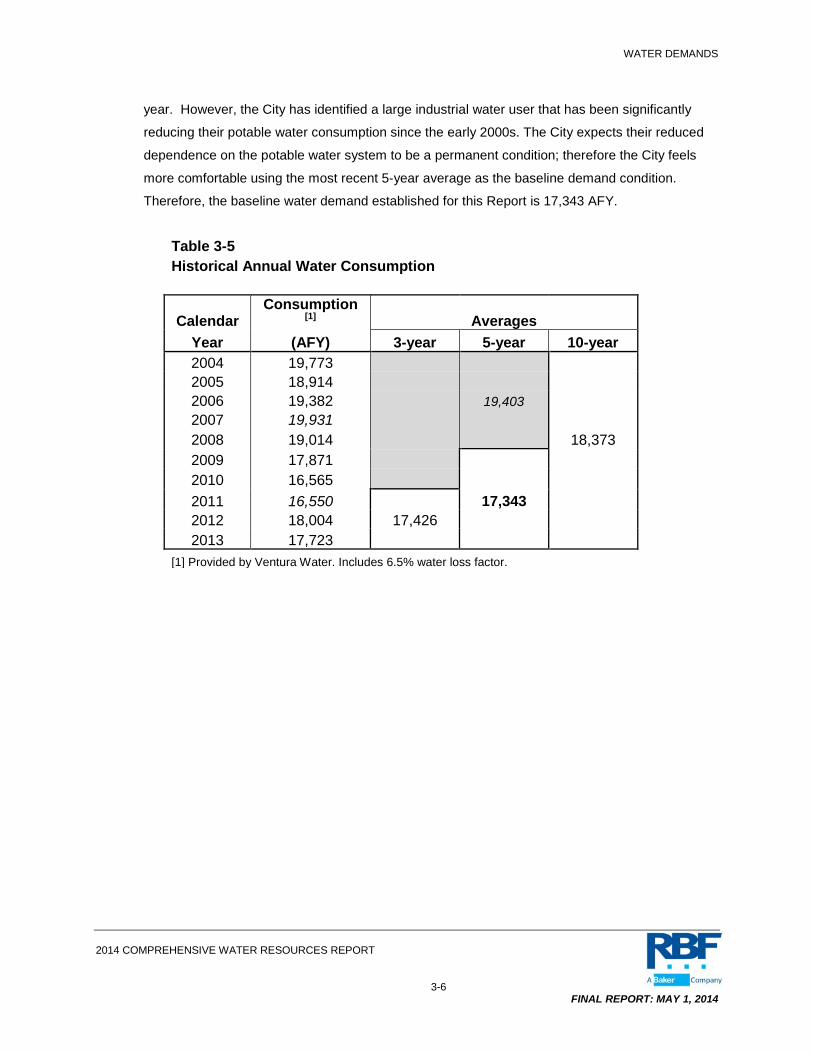
3-6 FINAL REPORT: MAY 1, 2014
year. However, the City has identified a large industrial water user that has been significantly
reducing their potable water consumption since the early 2000s. The City expects their reduced
dependence on the potable water system to be a permanent condition; therefore the City feels
more comfortable using the most recent 5-year average as the baseline demand condition.
Therefore, the baseline water demand established for this Report is 17,343 AFY.
Table 3-5
Historical Annual Water Consumption
Calendar
Consumption
[1] Averages Year (AFY) 3-year 5-year 10-year 2004 19,773 2005 18,914 2006 19,382 19,403 2007 19,931 2008 19,014 18,373 2009 17,871 2010 16,565 2011 16,550 17,343 2012 18,004 17,426 2013 17,723
[1] Provided by Ventura Water. Includes 6.5% water loss factor.
WATER DEMANDS
2014 COMPREHENSIVE WATER RESOURCES REPORT
3-7 FINAL REPORT: MAY 1, 2014
0
5,000
10,000
15,000
20,000
25,000
2004 2005 2006 2007 2008 2009 2010 2011 2012 2013
Figure 3-1 Historical Annual Water Consumption (AFY)
WATER DEMANDS
2014 COMPREHENSIVE WATER RESOURCES REPORT
3-8 FINAL REPORT: MAY 1, 2014
E. FUTURE DEMAND PROJECTIONS (Approved Projects Only)
This Report will focus only on the near-term demand growth projections. The near-term growth
consists of the proposed development projects that have been approved by the City but are not
yet connected to the City’s water system. This includes projects that are currently under
construction, or were under construction in December 2013, and projects that have all City
approvals, but have yet to begin construction (Table 2-4).
The future average annual water demand for the near-term growth projects were calculated
utilizing the City-specific usage factors calculated above (Table 3-3). The factors were applied to
each project in Table 2-4, per the detailed land use breakdown. Table 3-6 summarizes the
calculations for the future demand potential. The increased water demand using the City-specific
factors is predicted to be 1,085 acre-feet/year (AFY). Table 3-6 also identifies the portion of the
near-term demands, 379 AFY, that are predicted to be within the service area of the Casitas
Municipal Water District. The projected demands are considered a fully-committed allocation of
the water supply.
Under the baseline demand condition, and utilizing the City-specific water usage factors
developed herein for the approved development projects, the total near-term water demands are
predicted to be 18,428 AFY, as shown on Table 3-7.
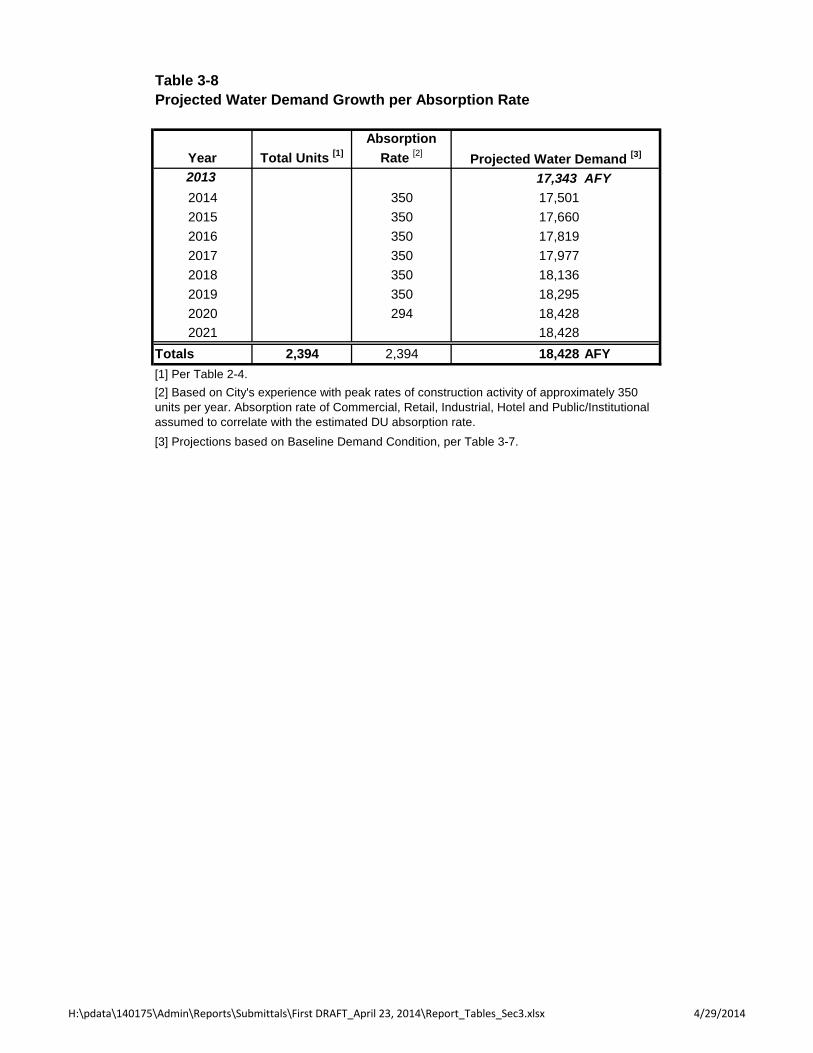
In order to estimate the growth of the future water demands, and absorption rate of 350 dwelling
units per year (units/year) was utilized (and an equivalent absorption rate for the non-residential
development). Based on historical growth data provided by the City, an estimated annual growth
of 350 units/year is considered conservative. Assuming the 350 units/year growth rate, the City
can expect the projected water demand for the under construction and approved projects to be
fully vested by Year 2020, per Table 3-8.

H:\pdata\140175\Admin\Reports\Submittals\First DRAFT_April 23, 2014\Report_Tables_Sec3.xlsx 5/1/2014
Table 3-6Total Estimated Demands for Under Construction and Approved Projects
Residential (0-8 du/ac) 603 du 370 gpd/du 223,110 gpd 250 AFY 120 du 44,400 gpd 50 AFYResidential (9-20 du/ac)Residential (21+ du/ac)Commercial/Retail/Industrial/HotelPublic/InstitutionalPark/Landscape/Irrigation 10.8 ac 2,000 gpd/ac 21,660 gpd 24 AFY 0 ac - -Hospital/Assisted Living 230 bed 545 gpd/bed 125,350 gpd 140 AFY 230 bed 125,350 gpd 140 AFY
Total 968,848 gpd 1,085 AFY 338,511 gpd 379 AFY[1] Per Table 2-4[2] Per Table 3-3[3] Excludes 320,000 SF for the Hospital. Hospital demand calculated "per bed" since an appropriate factor was developed. Includes Hotel SF.[4] Within Casitas Boundary, per Table 2-4 (included in the total).
11,511 gpd 13 AFY
Estimated Average Water Demand (within Casitas Boundary)
157,250 gpd 176 AFY
Quantity [4]
629 du
43 ksf [3]150,978 gpd 169 AFY
1,791 502 AFYdu 250 gpd/du 447,750 gpd
570 ksf [3] 265 gpd/ksf
Estimated Average Water Demand Water Demand Factor Classification Usage Factor [2]Quantity [1]

H:\pdata\140175\Admin\Reports\Submittals\First DRAFT_April 23, 2014\Report_Tables_Sec3.xlsx 4/29/2014
Table 3-7Projected Total Water Demands Including Under Construction and Approved Projects - Various Baselines
Baseline Demand Condition1,085 AFY
1-Year: 2013 17,723 AFY 18,808 AFY3-Year Average: 2011-2013 17,426 18,5115-Year Average: 2009-2013 17,343 18,42810-Year Average: 2004-2013 18,373 19,458Past 5-Year Period: Annual High Year 18,004 19,089Past 10-Year Period: Annual High Year 19,931 21,016
[1] Based on Calculated Consumption (Usage) Factors
Baseline Water Demand Projected Water Demand [1]
H:\pdata\140175\Admin\Reports\Submittals\First DRAFT_April 23, 2014\Report_Tables_Sec3.xlsx 4/29/2014
Table 3-8Projected Water Demand Growth per Absorption Rate
Year Total Units [1]Absorption
Rate [2]
2013 17,343 AFY2014 350 17,5012015 350 17,6602016 350 17,8192017 350 17,9772018 350 18,1362019 350 18,2952020 294 18,4282021 18,428
Totals 2,394 2,394 18,428 AFY[1] Per Table 2-4.
[3] Projections based on Baseline Demand Condition, per Table 3-7.
Projected Water Demand [3]
[2] Based on City's experience with peak rates of construction activity of approximately 350 units per year. Absorption rate of Commercial, Retail, Industrial, Hotel and Public/Institutional assumed to correlate with the estimated DU absorption rate.

WATER SUPPLY
2014 COMPREHENSIVE WATER RESOURCES REPORT
4-1 FINAL REPORT: MAY 1, 2014
4. WATER SUPPLY
A. INTRODUCTION
No changes from 2013 CWRR.
Exhibit 4-1: No changes from the 2013 CWRR.
B. CURRENT WATER SUPPLY SOURCES
No changes from the 2013 CWRR.
Table 4-1: No changes from the 2013 CWRR.
C. FUTURE WATER SUPPLY
1. Casitas Municipal Water District (Casitas)
While additional supply (up to 8,000 AFY) may be available to the City in future years, the present
annual supply used within the Casitas district boundary of the City service system is
approximately 5,000 AFY.
As discussed in Section 3, and shown on Table 3-6, it is estimated that the added water supply
required to meet the demand of the under construction and approved projects that are located
within the Casitas boundary is 379 AFY. Therefore, the anticipated future water supply from
Casitas will increase by an equivalent amount, to approximately 5,379 AFY, by Year 2020. Using
the absorption rate discussed in Section 3, the estimated supply from Casitas is estimated to
increase by 111 AFY in year 2015.
Casitas recently stated that there may be some time in the near future that Lake Casitas could be
at risk due to continued drought conditions and depletion of the Lake Casitas water supply to
minimum pool. Lake Casitas is currently below 60% capacity and is anticipated to reach 50% by
this fall. Once Lake Casitas reaches 50% capacity, it is anticipated that Casitas will require a
cutback to the City’s supply. Casitas is presently reviewing their Drought Program and will likely
have some changes and improvement to the Program by this summer. For purposes of this

WATER SUPPLY
2014 COMPREHENSIVE WATER RESOURCES REPORT
4-2 FINAL REPORT: MAY 1, 2014
report an estimated reduction of 10% to the City’s Casitas supply has been included for the
projection of the current drought through 2015 (2015 Supply Drought Impact).
2. Ventura River Surface Water Intake and Upper Ventura River Groundwater Basin/Subsurface Intake and Wells (Foster Park)
Due to the continued drought conditions, the City’s ability to draw water from the Ventura River
has been significantly impacted. Therefore, a range is shown in Table 4-2 to reflect the minimum
supply anticipated from the Ventura River for the projection of the current drought through 2015
(2015 Supply Drought Impact).
3. Mound Groundwater Basin (Mound Basin)
No changes from the 2013 CWRR.
4. Oxnard Plain Groundwater Basin (Fox Canyon Aquifer)
After several special meetings in the first few months of 2014 and several iterations of an
emergency ordinance, the Fox Canyon Groundwater Management Agency (FCGMA) Board
approved Emergency Ordinance E at a Special Meeting on April 11, 2014. The emergency
ordinance limits extractions from groundwater extraction facilities within the FCGMA boundary,
suspends use of credits and prohibits the construction of any groundwater extraction facilities
and/or the issuance of any groundwater extraction facilities permit. By January 1, 2016, the City
will be restricted to 305 AF less than the City’s current allocation of 4,104 AF and during the
duration of the ordinance the City will pay surcharges for exceeding because the City may not rely
on its conservation credits that were set aside during wet years.
Key points presented by FCGMA for Emergency Ordinance E were as follows:
• The FCGMA Act goal of safe yield by 2010 not being met,
• The 2007 Groundwater Management Plan Basin Management Objectives not being met,
• Water level declines in all basins,
• The unsustainability of the current Agency allocation scheme,
• Increase in time of planted acres of water intensive crops, and

WATER SUPPLY
2014 COMPREHENSIVE WATER RESOURCES REPORT
4-3 FINAL REPORT: MAY 1, 2014
• The continued unabated threats to the resource (seawater intrusion, water quality
degradation, land subsidence).
For all Municipal and Industrial (M&I) Operators the Temporary Extraction Allocation (TEA) is
based on an operators average annual reported extractions, for CY 2003 through 2012. Phased
reductions were set beginning July 1, 2014 with a 20% total reduction of the TEA on January 1,
2016. The City’s TEA is 4,749 AFY and with the phased reductions will be 3,799 AFY on January
1, 2016. This equates to a reduction of approximately 31% from the previous historical baseline
allocation of 5,472 AFY.
The duration of the ordinance remains in effect from the date of adoption and reviewed every
eighteen months, unless superseded or rescinded by action of the FCGMA Board or a finding by
the FCGMA Board that the drought or emergency condition no longer exists.
5. Santa Paula Groundwater Basin (Santa Paula Basin)
The low range of this water supply has been increased from zero to the current reliable water
supply of 1,600 acre-feet based on recent agreements and studies underway. In addition, the
City recently acquired 5.8 acre-feet of water rights in the Santa Paula Basin from the past
development of Tract 4632.
6. Recycled Water
No changes from the 2013 CWRR.
The City’s projected water supply portfolio is summarized in Table 4-2.

WATER SUPPLY
2014 COMPREHENSIVE WATER RESOURCES REPORT
4-4 FINAL REPORT: MAY 1, 2014
Table 4-2 Summary of Projected Future Water Supply
From Existing Sources
Water Supply Source [1]
2015 Supply Drought
Impact (AFY) 2015 Supply
(AFY) 2020 Supply
(AFY) 2025 Supply
(AFY)
Casitas Municipal Water District [2][3] 4,600 5,111 5,379 5,379
Ventura River / Foster Park [3] 0-2,000 4,200 4,200-6,700 4,200-6,700
Mound Groundwater Basin 4,000 4,000 4,000 4,000
Oxnard Plain Groundwater Basin [4] 3,918 3,918 3,799 3,799
Santa Paula Groundwater Basin
Original City Allocation [5] 1,600 1,600-3,000 1,600-3,000 1,600-3,000
City Acquired Water Rights [6] 5.8 5.8 5.8 5.8
Recycled Water 700 700 700 1,400
Total 14,824 - 16,824
19,535 - 20,935
19,684 – 23,584
20,384 – 24,284
[1] None of these numbers preclude the City’s water rights.
[2] Supply will be adjusted as demand increases within the Casitas service area.
[3] A lower supply range reflects the current drought conditions continuing through 2015; minimum supply
from Ventura River/Foster Park; and potential cutbacks from Casitas (estimated to be 10%)
[4] Fox Canyon Groundwater Management Agency (FCGMA) Emergency Ordinance E allocations were
adopted by FCGMA Board on April 11, 2014.
[5] The Santa Paula Basin Judgment allows the City to utilize on average 3,000 AF annually. There is
potential for future reductions, therefore the supply range is shown from 1,600 to 3,000 AFY.
[6] Water rights acquired for the past development of Tract 4632.
WATER SUPPLY
2014 COMPREHENSIVE WATER RESOURCES REPORT
4-5 FINAL REPORT: MAY 1, 2014
D. POTENTIAL ADDITIONAL FUTURE SUPPLY SOURCES
1. State Water Project
No changes from the 2013 CWRR.
2. Saticoy County Yard Well
No changes from the 2013 CWRR.
3. Recycled Water
a. Ventura Water Reclamation Facility (VWRF)
As stated in the 2013 CWRR, the City’s Discharge Permit issued by the Regional Water
Quality Control Board (RWQCB) allowed continuation of the City’s discharge to the Santa
Clara River Estuary (SCRE) but required the City to complete three extensive studies.
These studies included the Estuary Subwatershed Study (completed March 2010), Phase
1 Recycled Water Market Study (completed March 2010), and Treatment Wetlands
Feasibility Study (completed March 2010). These were collectively referred to as the
Phase 1 Studies.
After the February 21, 2013 Stakeholder Workshop, the Estuary Special Studies Phase
2: Facilities Planning Study for Expanding Recycled Water Delivery Final Report dated
March 2013, along with other Phase 2 related studies was completed. At the conclusion
of the Phase 2 Studies, several stakeholders still had concerns about identified data gaps
and the study findings. In response to these concerns, the RWQCB adopted the City’s
current NPDES Permit (R4-2013-0174) (Permit) for the VWRF with requirements to
conduct additional estuary studies. These studies are intended to provide sufficient
information to allow the RWQCB to determine whether or not the continued discharge of
effluent enhances the SCRE. In addition, the Permit includes other studies related to the
continued discharge of effluent to the SCRE. The species studies in the Permit include:
1) Phase 3 Studies - The City to perform additional estuary studies to provide
sufficient information to allow the Regional Water Board to determine whether or

WATER SUPPLY
2014 COMPREHENSIVE WATER RESOURCES REPORT
4-6 FINAL REPORT: MAY 1, 2014
not the continued discharge of effluent enhances the Estuary. The study will
clarify the water budget analysis for the SCRE, to determine whether any effluent
discharge is needed to sustain the SCRE native species, and if so how much.
2) Nutrient and Toxicity Special Study - The City to perform a special study to
identify the cause of nutrient, dissolved oxygen and toxicity impairments in the
SCRE. If it is determined that the effluent from the Facility is causing the
impairments, the Facility must propose a plan for reducing nutrient loading,
including ammonia, nitrogen and phosphorus loading and toxicity impairments.
3) Groundwater Special Study – The City to perform a special study to document
the interaction between the SCRE, discharge and groundwater and determine if
the beneficial use of MUN applies to the water impacted by the discharge.
The City is currently finalizing a Phase 3 Workplan to be used to meet the objectives of
these special studies.
b. Ojai Valley Sanitary District (OVSD)
City Council approved the City entering into a Professional Services Agreement with
Carollo Engineers, Inc. to provide engineering services to prepare an Ojai Valley Sanitary
District Reuse Feasibility Analysis and Title 22 Engineering Report. This project will allow
the City and OVSD to continue to discuss and work together to further investigate the
potential reuse of OVSD effluent. The project has been “kicked-off” and the first of two
stakeholder workshops is being planned.
4. Ocean Desalination No changes from the 2013 CWRR.
5. Water Conservation Measures/Water Efficiency Plan
In October 2013 Ventura Water presented an update on Year Two of the Water Efficiency 5
Year Plan to City Council. The Year Two focus includes customer and student outreach,
WATER SUPPLY
2014 COMPREHENSIVE WATER RESOURCES REPORT
4-7 FINAL REPORT: MAY 1, 2014
City Park landscapes, demonstration gardens, residential and business assistant grants and
energy and water efficiency improvements.
In February 2014, in response to the current drought, Council approved staff’s
recommendation to request customers to voluntarily reduce their water usage by 10%. As a
follow-up to the February council meeting and the continuing drought conditions staff will be
presenting a Water Shortage Contingency Plan to Council in June 2014. The purpose of the
plan will be to provide guidance during the various stages of a water shortage, and will
include voluntary and mandatory stages to: (1) keep water use within pumping capacity and
delivery capability, based on recommendations of Ventura Water, (2) define procedures to be
used when the above criteria cannot be met, and (3) familiarize citizens, businesses and
industry with procedures which may be implemented when voluntary or mandatory water
restrictions are required.
6. Establish Water Rights Ordinance
As stated in the 2013 CWRR, Ventura Water took the concept of a water rights ordinance to
Council in September 2012. Council directed staff to prepare a draft water rights ordinance
and return to Council. Public Workshops on the concept of a water rights ordinance were
held in July and October of 2013 and several presentations were made at public meetings. In
March 2014 staff gave a presentation to Council at a special workshop on the proposed
Water Dedication and In-Lieu Fee Ordinance and Resolution. The Ordinance to Establish
Water Dedication and In-Lieu Fee Requirements for New or Intensified Development and its
associated resolution establishes a mechanism whereby developers can dedicate adequate
water supplies to support a proposed new or intensified development or pay an in-lieu fee so
that the City can develop the necessary water supplies. In addition, if a developer is able to
demonstrate extraordinary efficiency they could receive credit for the water savings, and
thereby reduce the in-lieu fee they could be required to pay. It is anticipated that Ventura
Water will return to Council in June 2014 to recommend that Council approve the proposed
Water Dedication and In-Lieu Fee Ordinance and Resolution.
CONCLUSIONS & RECOMMENDATIONS
2014 COMPREHENSIVE WATER RESOURCES REPORT
5-1 FINAL REPORT: MAY 1, 2014
5. CONCLUSIONS & RECOMMENDATIONS
A. CONCLUSIONS
The City’s total water demand for the most recent calendar year (2013) of data was 17,723 AFY.
Over the past five years (2009-2013), the City experienced an average annual water demand of
17,343 AFY, and over the past ten years (2004-2013), the annual average water demand was
18,373 AFY. Although there have been extenuating circumstances that have occurred over the
previous five year period, including an extended economic downturn, significant restrictions to the
imported water supply to southern California, legal challenges to the Ventura River water supply
and several years of drought conditions, it is recommended to include a larger data set to predict
a “typical” average annual water demand. However, the City has identified a large industrial user
that has significantly, and permanently, reduced their dependence on potable water in recent
years. Therefore, the City is more comfortable that the 5-year average is more reflective of the
current demand condition. Therefore the current baseline water demand is established to be
17,343 AFY.
The City has a total of 42 projects that are under construction or approved for development.
These projects include an additional 889,728 SF of non-residential development and 2,394
residential dwelling units. By developing water usage factors based on recent consumption data,
the City can more accurately predict the additional future water demand for the approved
development projects. Using the City-specific water usage factors, the under construction and
approved development projects will generate an additional annual average water demand of
1,085 AFY. Therefore, the estimated water demands that the City is committed to supply total
18,428 AFY. Assuming an average absorption rate of 350 dwelling units per (and the equivalent
growth in non-residential development), it is anticipated that the currently under construction and
approved projects will be completed by year 2020.
The City’s available water supply is constantly changing, depending upon environmental and
legal constraints. The City’s current available water supply is 19,600 AFY, however in 2015 it is
possible the available water supply could drop to an annual average of 16,246 AFY.
The near-term water supply picture to meet the needs of the development projects that are under
construction and approved will remain relatively the same as the existing condition, however the
CONCLUSIONS & RECOMMENDATIONS
2014 COMPREHENSIVE WATER RESOURCES REPORT
5-2 FINAL REPORT: MAY 1, 2014
City can expect to increase the water supply from Casitas by 379 AFY to meet the additional
water demand in the Casitas boundary.
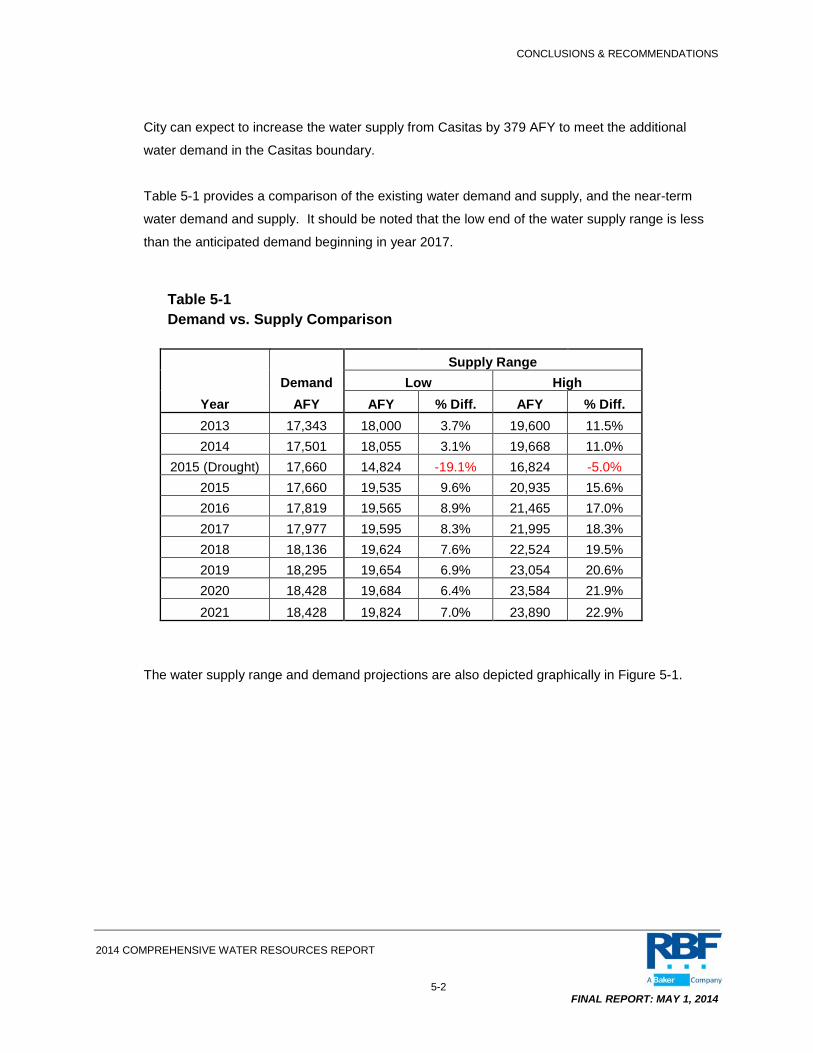
Table 5-1 provides a comparison of the existing water demand and supply, and the near-term
water demand and supply. It should be noted that the low end of the water supply range is less
than the anticipated demand beginning in year 2017.
Table 5-1 Demand vs. Supply Comparison
Supply Range Demand Low High
Year AFY AFY % Diff. AFY % Diff. 2013 17,343 18,000 3.7% 19,600 11.5% 2014 17,501 18,055 3.1% 19,668 11.0%
2015 (Drought) 17,660 14,824 -19.1% 16,824 -5.0% 2015 17,660 19,535 9.6% 20,935 15.6% 2016 17,819 19,565 8.9% 21,465 17.0% 2017 17,977 19,595 8.3% 21,995 18.3% 2018 18,136 19,624 7.6% 22,524 19.5% 2019 18,295 19,654 6.9% 23,054 20.6% 2020 18,428 19,684 6.4% 23,584 21.9% 2021 18,428 19,824 7.0% 23,890 22.9%
The water supply range and demand projections are also depicted graphically in Figure 5-1.

CONCLUSIONS & RECOMMENDATIONS
2014 COMPREHENSIVE WATER RESOURCES REPORT
5-3 FINAL REPORT: MAY 1, 2014
0
5,000
10,000
15,000
20,000
25,000
Wat
er D
eman
d (A
FY)
Year
Figure 5-1 Demand vs. Supply Projection
Supply (High)
Supply (Low)
Current Supply

CONCLUSIONS & RECOMMENDATIONS
2014 COMPREHENSIVE WATER RESOURCES REPORT
5-4 FINAL REPORT: MAY 1, 2014
B. RECOMMENDATIONS
The results of this Report indicate that the spread between the current water demand and the
current water supply is very tight, and if the drought continues the supply could be less than the
demand. This presents significant challenges for the City moving forward in the ability to allocate
water supply to development projects that will generate additional water demands. The
recommendations for the City moving forward include:
1. Track the total water consumption on an annual basis.
2. Re-calculate the 3-year, 5-year and 10-year water consumption averages on an annual basis.
3. Update the water supply portfolio on an annual basis.
4. Update the existing land use data on an annual basis. This can be done through a system
that tracks the development projects as the transition from “Under Construction” to “Existing,”
and “Approved” to “Under Construction.”
5. All future development projects should be evaluated based on current supply and demand
conditions.
6. Consider adding a new project type in the land use tracking spreadsheet for approved
projects under CIP or other City approval processes.
7. Use the City-specific water usage factors to calculate the water demand of all development
projects as the projects proceed through the City process prior to approval.
8. Continue to develop water supply through demand side management, securing water rights,
establishing an in-lieu fee ordinance and continue to integrate the new water supply sources
into the City’s water supply portfolio.