2014 edition - brewers of europe · page 5 beer statistics 2014 edition dear reader, it gives me...
TRANSCRIPT
Beer statistics2014 edition
The Brewers of Europe

Beer statistics2014 edition
The Brewers of Europe
Editor: Marlies Van de Walle
1st edition, October 2014
ISBN 978-2-9601382-3-8EAN 9782960138238

Beer Statistics | 2014 editionPage 3
Foreword by President of The Brewers of Europe ..........................p. 5
Beer production 2013 ....................................................................p. 6Beer production 2008 - 2013 ........................................................p. 7Beer consumption 2013 ................................................................p. 8Beer consumption 2008 - 2013 .....................................................p. 9Beer consumption per capita 2013 ...............................................p.10 Beer consumption per capita 2008 - 2013 ...................................p.11On-trade / off-trade 2013 ............................................................p. 12On-trade / off-trade 2008 - 2013 .................................................p. 13Total imports 2013 .......................................................................p. 14Imports 2008 - 2010 ...................................................................p. 15Imports 2011 - 2013 ...................................................................p. 16Total exports 2013 .......................................................................p. 17Exports 2008 - 2010 ...................................................................p. 18Exports 2011 - 2013 ...................................................................p. 19Number of active breweries 2013 ................................................p. 20Number of active breweries 2008 - 2013 .....................................p. 21Microbreweries 2013 ...................................................................p. 22Microbreweries 2008 - 2013 ........................................................p. 23Number of active brewing companies 2013 .................................p. 24Number of active brewing companies 2008 - 2013......................p. 25Direct employment 2013 .............................................................p. 26Direct employment 2008 - 2013 ..................................................p. 27Excise duty revenues related to beer ...........................................p. 28
Glossary .............................................................................. p. 29 - 30
Methodology ...............................................................................p. 31Acknowledgements .....................................................................p. 31Disclaimer ....................................................................................p. 32
1 TABLE OF CONTENTS

Beer Statistics | 2014 editionPage 5
Dear Reader,
It gives me great pleasure to present to you The Brewers of Europe’s 2014 Statistics booklet, which looks at the key figures from 2013, and trends since 2008, across the 28 EU Member States, Norway, Switzerland and Turkey.
What the figures show are that the signs of recovery that were already starting to appear in 2012 have spread, but we are not there yet and still need to be vigilant.
As an example of that need for vigilance, it seems that all the excise duty rate increases on beer over the period 2012-2013 have harmed the rate of recovery. There was once again in 2013 a decline in Europe both in beer production and beer consumption. Whilst around two thirds of EU countries saw a continuation of the trend of consumption shifting from the on-trade (hospitality sector) to the off-trade (retail sector). One interesting result of all this: despite all the tax increases, beer excise duty revenues for the Governments actually dropped in 2013.
Nevertheless, direct employment and exports remained somewhat stable in 2013, showing the efforts of the brewers to keep their businesses running. Indeed, it is the growth in exports that is helping to sustain the businesses of many breweries in the face of the ongoing decline in domestic consumption.
In addition to this, the numbers of breweries, and especially microbreweries, continued to grow in 2013. The EU now counts over 5000 breweries, showing the interest that many Europeans have for the diversity and variety of Europe’s many different beer cultures. Europe’s beer culture is also an important draw for millions of the tourists that arrive in Europe each year.
Until we start to see an actual turnaround in both production and consumption of beer, sustained over a period of years across all regions of the EU, we still cannot talk about a full recovery for Europe’s beer sector, but the signs are positive.
Europe’s Brewers thus call on policymakers to support the brewing sector and therefore help brewers to support the delivery of the Europe 2020 Growth Strategy. With 2 million jobs created by brewing across the whole value chain, a flourishing brewing sector can sustain not just the beer companies but all the interdependent sectors, from agriculture to retail and hospitality, and ultimately benefit Europe’s wider economy and society.
Demetrio Carceller President of The Brewers of Europe
Demetrio CarcellerPresident of The
Brewers of Europe
2 FOREWORDBy President of The Brewers of Europe
Beer Statistics | 2014 edition Page 6
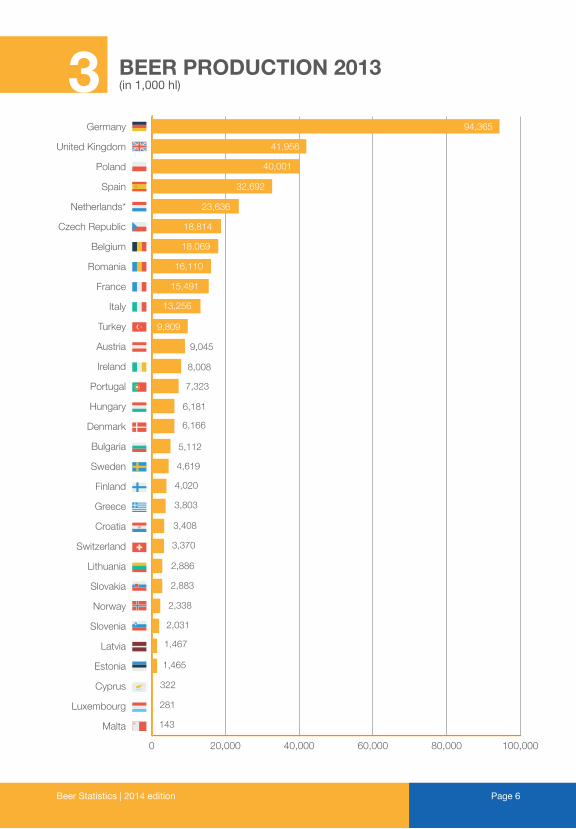
3 BEER PRODUCTION 2013(in 1,000 hl)
0 20,000 40,000 60,000 80,000 100,000
Malta
Luxembourg
Cyprus
Estonia
Latvia
Slovenia
Norway
Slovakia
Lithuania
Switzerland
Croatia
Greece
Finland
Sweden
Bulgaria
Denmark
Hungary
Portugal
Ireland
Austria
Turkey
Italy
France
Romania
Belgium
Czech Republic
Netherlands*
Spain
Poland
United Kingdom
Germany 94,365
41,956
40,001
32,692
23,636
18,814
18,069
16,110
15,491
13,256
9,809
9,045
8,008
7,323
6,181
6,166
5,112
4,619
4,020
3,803
3,408
3,370
2,886
2,883
2,338
2,031
1,467
1,465
322
281
143
Beer Statistics | 2014 editionPage 7
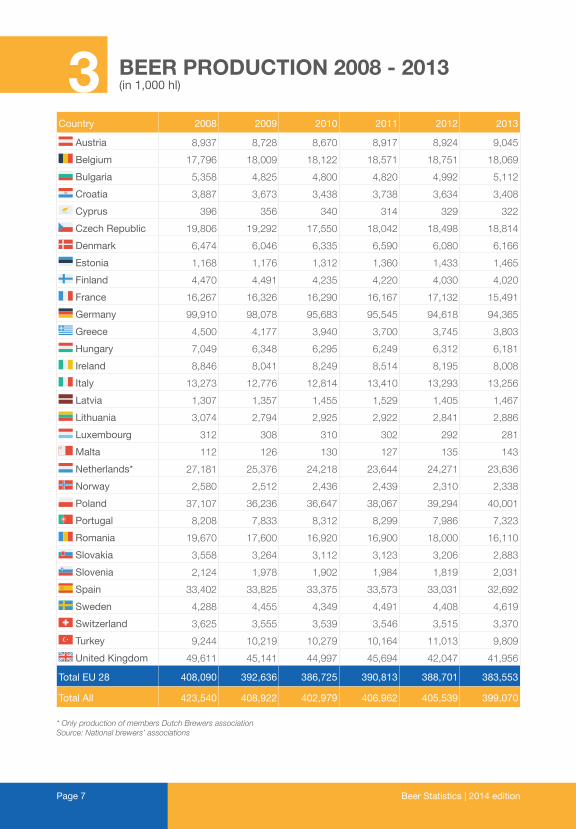
Country 2008 2009 2010 2011 2012 2013
Austria 8,937 8,728 8,670 8,917 8,924 9,045
Belgium 17,796 18,009 18,122 18,571 18,751 18,069
Bulgaria 5,358 4,825 4,800 4,820 4,992 5,112
Croatia 3,887 3,673 3,438 3,738 3,634 3,408
Cyprus 396 356 340 314 329 322
Czech Republic 19,806 19,292 17,550 18,042 18,498 18,814
Denmark 6,474 6,046 6,335 6,590 6,080 6,166
Estonia 1,168 1,176 1,312 1,360 1,433 1,465
Finland 4,470 4,491 4,235 4,220 4,030 4,020
France 16,267 16,326 16,290 16,167 17,132 15,491
Germany 99,910 98,078 95,683 95,545 94,618 94,365
Greece 4,500 4,177 3,940 3,700 3,745 3,803
Hungary 7,049 6,348 6,295 6,249 6,312 6,181
Ireland 8,846 8,041 8,249 8,514 8,195 8,008
Italy 13,273 12,776 12,814 13,410 13,293 13,256
Latvia 1,307 1,357 1,455 1,529 1,405 1,467
Lithuania 3,074 2,794 2,925 2,922 2,841 2,886
Luxembourg 312 308 310 302 292 281
Malta 112 126 130 127 135 143
Netherlands* 27,181 25,376 24,218 23,644 24,271 23,636
Norway 2,580 2,512 2,436 2,439 2,310 2,338
Poland 37,107 36,236 36,647 38,067 39,294 40,001
Portugal 8,208 7,833 8,312 8,299 7,986 7,323
Romania 19,670 17,600 16,920 16,900 18,000 16,110
Slovakia 3,558 3,264 3,112 3,123 3,206 2,883
Slovenia 2,124 1,978 1,902 1,984 1,819 2,031
Spain 33,402 33,825 33,375 33,573 33,031 32,692
Sweden 4,288 4,455 4,349 4,491 4,408 4,619
Switzerland 3,625 3,555 3,539 3,546 3,515 3,370
Turkey 9,244 10,219 10,279 10,164 11,013 9,809
United Kingdom 49,611 45,141 44,997 45,694 42,047 41,956
Total EU 28 408,090 392,636 386,725 390,813 388,701 383,553
Total All 423,540 408,922 402,979 406,962 405,539 399,070
* Only production of members Dutch Brewers associationSource: National brewers’ associations
3 BEER PRODUCTION 2008 - 2013(in 1,000 hl)
Beer Statistics | 2014 edition Page 8
4
0 20,000 40,000 60,000 80,000 100,000
Malta
Luxembourg
Cyprus
Estonia
Latvia
Slovenia
Norway
Lithuania
Croatia
Denmark
Greece
Ireland
Finland
Switzerland
Sweden
Portugal
Bulgaria
Hungary
Belgium
Austria
Turkey
Netherlands
Czech Republic
Romania
Italy
France
Spain
Poland
United Kingdom
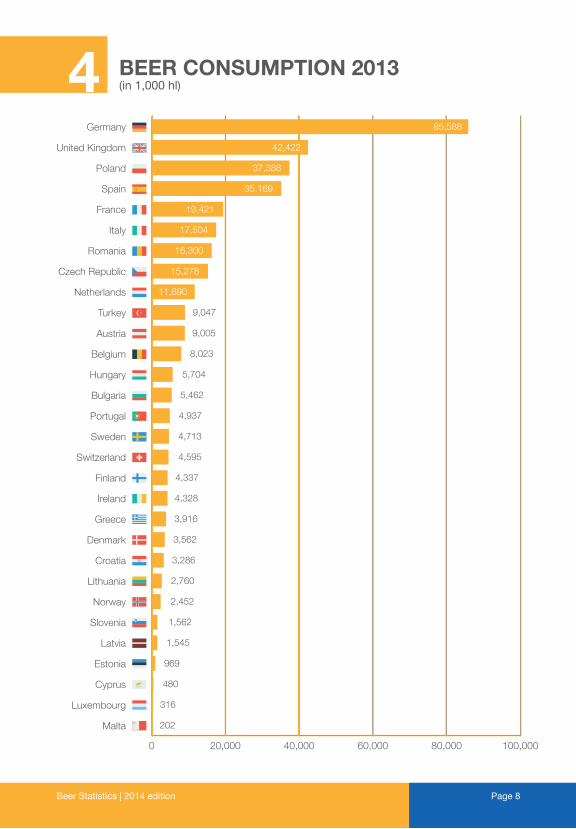
Germany 85,588
42,422
37,388
35,169
19,421
17,504
16,300
15,278
11,690
9,047
9,005
8,023
5,704
5,462
4,937
4,713
4,595
4,337
4,328
3,916
3,562
3,286
2,760
2,452
1,562
1,545
969
480
316
202
BEER CONSUMPTION 2013(in 1,000 hl)
Beer Statistics | 2014 editionPage 9
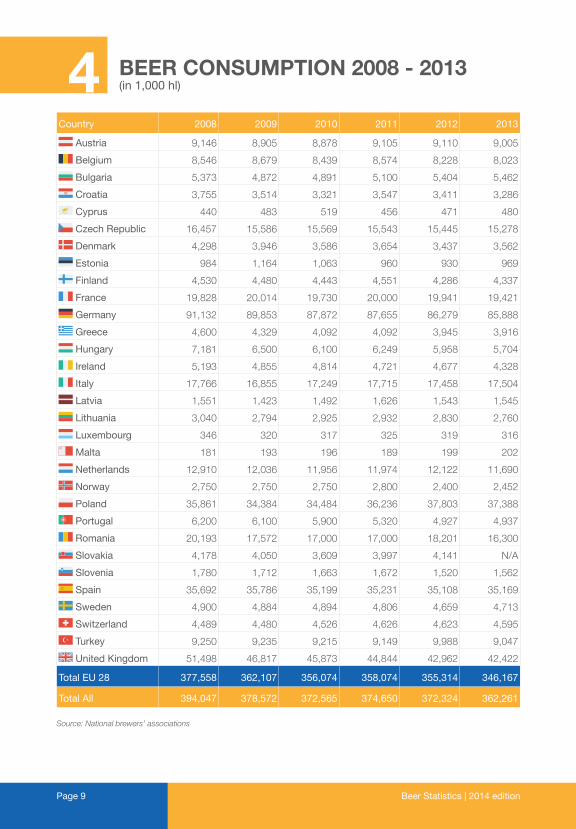
Country 2008 2009 2010 2011 2012 2013
Austria 9,146 8,905 8,878 9,105 9,110 9,005
Belgium 8,546 8,679 8,439 8,574 8,228 8,023
Bulgaria 5,373 4,872 4,891 5,100 5,404 5,462
Croatia 3,755 3,514 3,321 3,547 3,411 3,286
Cyprus 440 483 519 456 471 480
Czech Republic 16,457 15,586 15,569 15,543 15,445 15,278
Denmark 4,298 3,946 3,586 3,654 3,437 3,562
Estonia 984 1,164 1,063 960 930 969
Finland 4,530 4,480 4,443 4,551 4,286 4,337
France 19,828 20,014 19,730 20,000 19,941 19,421
Germany 91,132 89,853 87,872 87,655 86,279 85,888
Greece 4,600 4,329 4,092 4,092 3,945 3,916
Hungary 7,181 6,500 6,100 6,249 5,958 5,704
Ireland 5,193 4,855 4,814 4,721 4,677 4,328
Italy 17,766 16,855 17,249 17,715 17,458 17,504
Latvia 1,551 1,423 1,492 1,626 1,543 1,545
Lithuania 3,040 2,794 2,925 2,932 2,830 2,760
Luxembourg 346 320 317 325 319 316
Malta 181 193 196 189 199 202
Netherlands 12,910 12,036 11,956 11,974 12,122 11,690
Norway 2,750 2,750 2,750 2,800 2,400 2,452
Poland 35,861 34,384 34,484 36,236 37,803 37,388
Portugal 6,200 6,100 5,900 5,320 4,927 4,937
Romania 20,193 17,572 17,000 17,000 18,201 16,300
Slovakia 4,178 4,050 3,609 3,997 4,141 N/A
Slovenia 1,780 1,712 1,663 1,672 1,520 1,562
Spain 35,692 35,786 35,199 35,231 35,108 35,169
Sweden 4,900 4,884 4,894 4,806 4,659 4,713
Switzerland 4,489 4,480 4,526 4,626 4,623 4,595
Turkey 9,250 9,235 9,215 9,149 9,988 9,047
United Kingdom 51,498 46,817 45,873 44,844 42,962 42,422
Total EU 28 377,558 362,107 356,074 358,074 355,314 346,167
Total All 394,047 378,572 372,565 374,650 372,324 362,261
Source: National brewers’ associations
4 BEER CONSUMPTION 2008 - 2013(in 1,000 hl)
Beer Statistics | 2014 edition Page 10
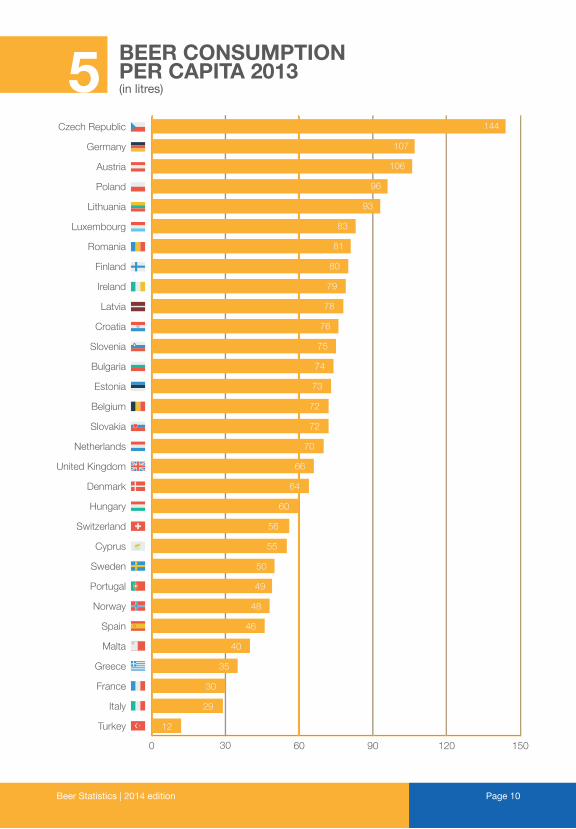
5 BEER CONSUMPTIONPER CAPITA 2013(in litres)
0 30 60 90 120 150
Turkey
Italy
France
Greece
Malta
Spain
Norway
Portugal
Sweden
Cyprus
Switzerland
Hungary
Denmark
United Kingdom
Netherlands
Slovakia
Belgium
Estonia
Bulgaria
Slovenia
Croatia
Latvia
Ireland
Finland
Romania
Luxembourg
Lithuania
Poland
Austria
Germany
Czech Republic 144
107
106
96
93
83
81
80
79
78
76
75
74
73
72
72
70
66
64
60
56
55
50
49
48
46
40
35
30
29
12
Beer Statistics | 2014 editionPage 11
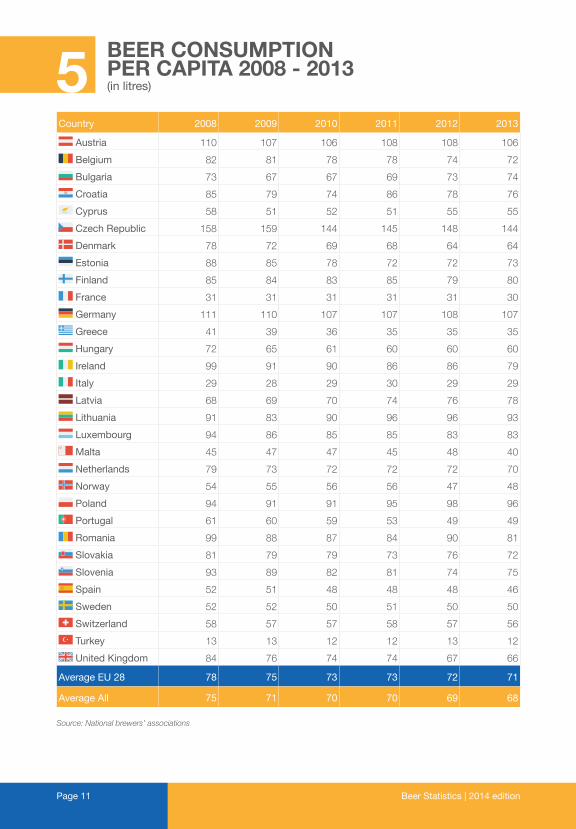
Country 2008 2009 2010 2011 2012 2013
Austria 110 107 106 108 108 106
Belgium 82 81 78 78 74 72
Bulgaria 73 67 67 69 73 74
Croatia 85 79 74 86 78 76
Cyprus 58 51 52 51 55 55
Czech Republic 158 159 144 145 148 144
Denmark 78 72 69 68 64 64
Estonia 88 85 78 72 72 73
Finland 85 84 83 85 79 80
France 31 31 31 31 31 30
Germany 111 110 107 107 108 107
Greece 41 39 36 35 35 35
Hungary 72 65 61 60 60 60
Ireland 99 91 90 86 86 79
Italy 29 28 29 30 29 29
Latvia 68 69 70 74 76 78
Lithuania 91 83 90 96 96 93
Luxembourg 94 86 85 85 83 83
Malta 45 47 47 45 48 40
Netherlands 79 73 72 72 72 70
Norway 54 55 56 56 47 48
Poland 94 91 91 95 98 96
Portugal 61 60 59 53 49 49
Romania 99 88 87 84 90 81
Slovakia 81 79 79 73 76 72
Slovenia 93 89 82 81 74 75
Spain 52 51 48 48 48 46
Sweden 52 52 50 51 50 50
Switzerland 58 57 57 58 57 56
Turkey 13 13 12 12 13 12
United Kingdom 84 76 74 74 67 66
Average EU 28 78 75 73 73 72 71
Average All 75 71 70 70 69 68
Source: National brewers’ associations
5BEER CONSUMPTIONPER CAPITA 2008 - 2013(in litres)
Beer Statistics | 2014 edition Page 12
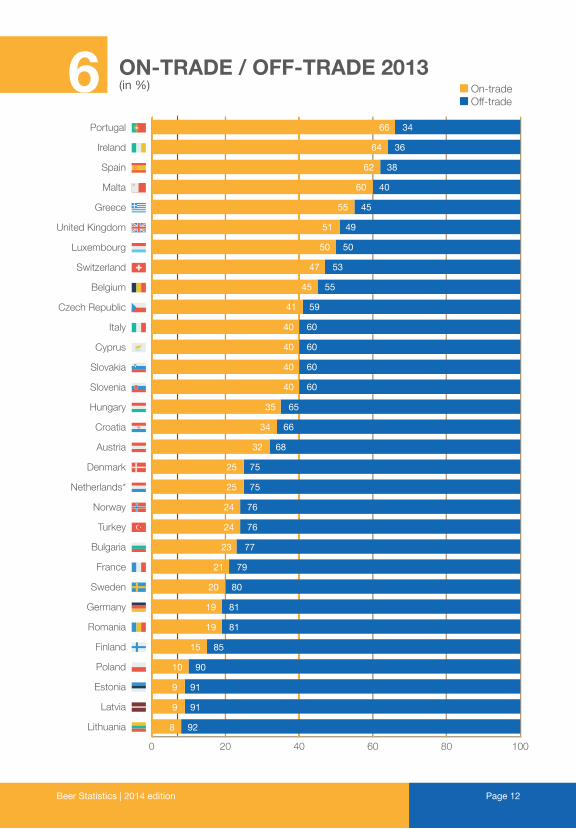
6 ON-TRADE / OFF-TRADE 2013(in %)
0 20 40 60 80 100
Lithuania
Latvia
Estonia
Poland
Finland
Romania
Germany
Sweden
France
Bulgaria
Turkey
Norway
Netherlands*
Denmark
Austria
Croatia
Hungary
Slovenia
Slovakia
Cyprus
Italy
Czech Republic
Belgium
Switzerland
Luxembourg
United Kingdom
Greece
Malta
Spain
Ireland
Portugal 66 34
64 36
62 38
60 40
55 45
51 49
50 50
47 53
45 55
41 59
40 60
40 60
40 60
40 60
35 65
34 66
32 68
25 75
25 75
24 76
24 76
23 77
21 79
20 80
19 81
19 81
15 85
10 90
9 91
9 91
8 92
On-trade Off-trade
Beer Statistics | 2014 editionPage 13
2008 2009 2010 2011 2012 2013
Country On-trade
Off-trade
On-trade
Off-trade
On-trade
Off-trade
On-trade
Off-trade
On-trade
Off-trade
On-trade
Off-trade
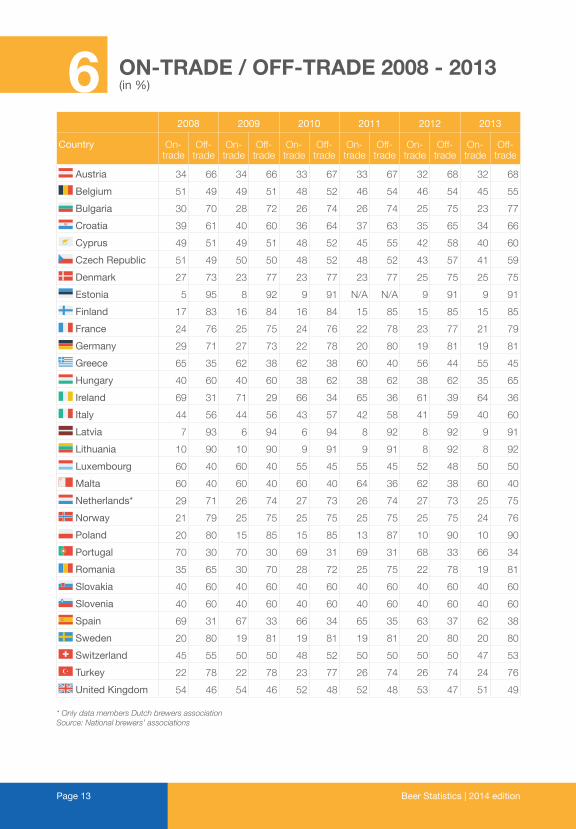
Austria 34 66 34 66 33 67 33 67 32 68 32 68
Belgium 51 49 49 51 48 52 46 54 46 54 45 55
Bulgaria 30 70 28 72 26 74 26 74 25 75 23 77
Croatia 39 61 40 60 36 64 37 63 35 65 34 66
Cyprus 49 51 49 51 48 52 45 55 42 58 40 60
Czech Republic 51 49 50 50 48 52 48 52 43 57 41 59
Denmark 27 73 23 77 23 77 23 77 25 75 25 75
Estonia 5 95 8 92 9 91 N/A N/A 9 91 9 91
Finland 17 83 16 84 16 84 15 85 15 85 15 85
France 24 76 25 75 24 76 22 78 23 77 21 79
Germany 29 71 27 73 22 78 20 80 19 81 19 81
Greece 65 35 62 38 62 38 60 40 56 44 55 45
Hungary 40 60 40 60 38 62 38 62 38 62 35 65
Ireland 69 31 71 29 66 34 65 36 61 39 64 36
Italy 44 56 44 56 43 57 42 58 41 59 40 60
Latvia 7 93 6 94 6 94 8 92 8 92 9 91
Lithuania 10 90 10 90 9 91 9 91 8 92 8 92
Luxembourg 60 40 60 40 55 45 55 45 52 48 50 50
Malta 60 40 60 40 60 40 64 36 62 38 60 40
Netherlands* 29 71 26 74 27 73 26 74 27 73 25 75
Norway 21 79 25 75 25 75 25 75 25 75 24 76
Poland 20 80 15 85 15 85 13 87 10 90 10 90
Portugal 70 30 70 30 69 31 69 31 68 33 66 34
Romania 35 65 30 70 28 72 25 75 22 78 19 81
Slovakia 40 60 40 60 40 60 40 60 40 60 40 60
Slovenia 40 60 40 60 40 60 40 60 40 60 40 60
Spain 69 31 67 33 66 34 65 35 63 37 62 38
Sweden 20 80 19 81 19 81 19 81 20 80 20 80
Switzerland 45 55 50 50 48 52 50 50 50 50 47 53
Turkey 22 78 22 78 23 77 26 74 26 74 24 76
United Kingdom 54 46 54 46 52 48 52 48 53 47 51 49
* Only data members Dutch brewers associationSource: National brewers’ associations
6 ON-TRADE / OFF-TRADE 2008 - 2013(in %)
Beer Statistics | 2014 edition Page 14
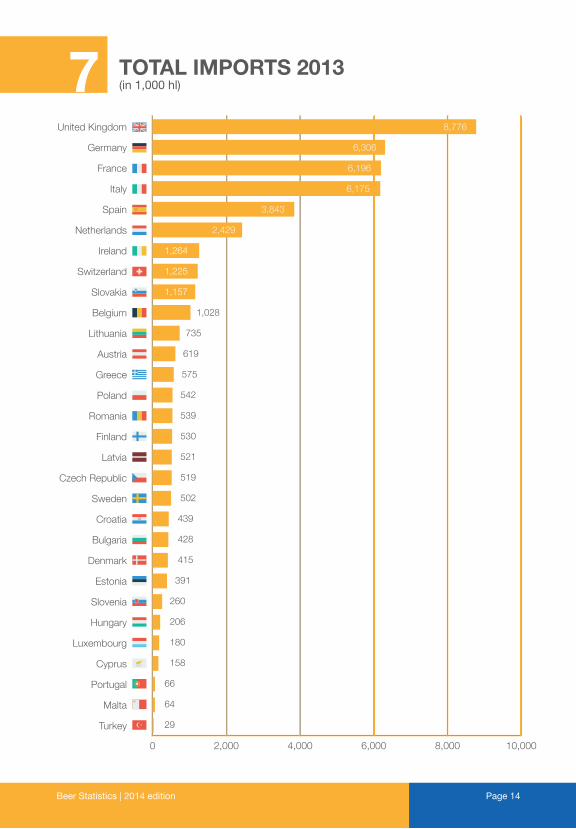
7 TOTAL IMPORTS 2013 (in 1,000 hl)
0 2,000 4,000 6,000 8,000 10,000
Turkey
Malta
Portugal
Cyprus
Luxembourg
Hungary
Slovenia
Estonia
Denmark
Bulgaria
Croatia
Sweden
Czech Republic
Latvia
Finland
Romania
Poland
Greece
Austria
Lithuania
Belgium
Slovakia
Switzerland
Ireland
Netherlands
Spain
Italy
France
Germany
United Kingdom 8,776
6,306
6,196
6,175
3,843
2,429
1,264
1,225
1,157
1,028
735
619
575
542
539
530
521
519
502
439
428
415
391
260
206
180
158
66
64
29
Beer Statistics | 2014 editionPage 15
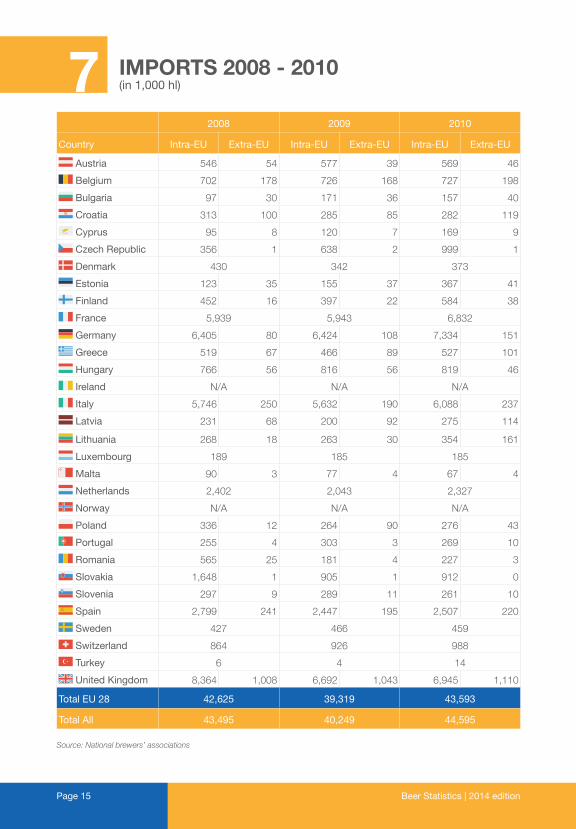
7 IMPORTS 2008 - 2010 (in 1,000 hl)
2008 2009 2010
Country Intra-EU Extra-EU Intra-EU Extra-EU Intra-EU Extra-EU
Austria 546 54 577 39 569 46
Belgium 702 178 726 168 727 198
Bulgaria 97 30 171 36 157 40
Croatia 313 100 285 85 282 119
Cyprus 95 8 120 7 169 9
Czech Republic 356 1 638 2 999 1
Denmark 430 342 373
Estonia 123 35 155 37 367 41
Finland 452 16 397 22 584 38
France 5,939 5,943 6,832
Germany 6,405 80 6,424 108 7,334 151
Greece 519 67 466 89 527 101
Hungary 766 56 816 56 819 46
Ireland N/A N/A N/A
Italy 5,746 250 5,632 190 6,088 237
Latvia 231 68 200 92 275 114
Lithuania 268 18 263 30 354 161
Luxembourg 189 185 185
Malta 90 3 77 4 67 4
Netherlands 2,402 2,043 2,327
Norway N/A N/A N/A
Poland 336 12 264 90 276 43
Portugal 255 4 303 3 269 10
Romania 565 25 181 4 227 3
Slovakia 1,648 1 905 1 912 0
Slovenia 297 9 289 11 261 10
Spain 2,799 241 2,447 195 2,507 220
Sweden 427 466 459
Switzerland 864 926 988
Turkey 6 4 14
United Kingdom 8,364 1,008 6,692 1,043 6,945 1,110
Total EU 28 42,625 39,319 43,593
Total All 43,495 40,249 44,595
Source: National brewers’ associations
Beer Statistics | 2014 edition Page 16
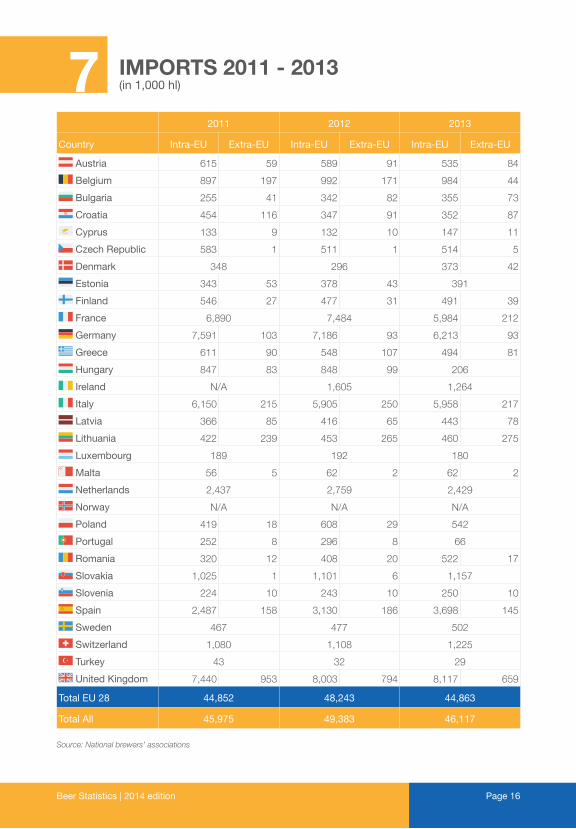
7 IMPORTS 2011 - 2013 (in 1,000 hl)
2011 2012 2013
Country Intra-EU Extra-EU Intra-EU Extra-EU Intra-EU Extra-EU
Austria 615 59 589 91 535 84
Belgium 897 197 992 171 984 44
Bulgaria 255 41 342 82 355 73
Croatia 454 116 347 91 352 87
Cyprus 133 9 132 10 147 11
Czech Republic 583 1 511 1 514 5
Denmark 348 296 373 42
Estonia 343 53 378 43 391
Finland 546 27 477 31 491 39
France 6,890 7,484 5,984 212
Germany 7,591 103 7,186 93 6,213 93
Greece 611 90 548 107 494 81
Hungary 847 83 848 99 206
Ireland N/A 1,605 1,264
Italy 6,150 215 5,905 250 5,958 217
Latvia 366 85 416 65 443 78
Lithuania 422 239 453 265 460 275
Luxembourg 189 192 180
Malta 56 5 62 2 62 2
Netherlands 2,437 2,759 2,429
Norway N/A N/A N/A
Poland 419 18 608 29 542
Portugal 252 8 296 8 66
Romania 320 12 408 20 522 17
Slovakia 1,025 1 1,101 6 1,157
Slovenia 224 10 243 10 250 10
Spain 2,487 158 3,130 186 3,698 145
Sweden 467 477 502
Switzerland 1,080 1,108 1,225
Turkey 43 32 29
United Kingdom 7,440 953 8,003 794 8,117 659
Total EU 28 44,852 48,243 44,863
Total All 45,975 49,383 46,117
Source: National brewers’ associations
Beer Statistics | 2014 editionPage 17
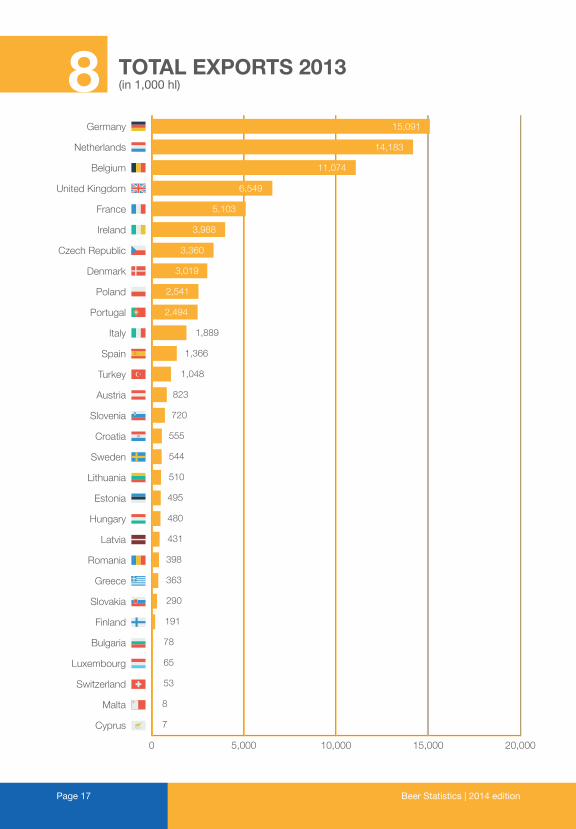
8 TOTAL EXPORTS 2013(in 1,000 hl)
0 5,000 10,000 15,000 20,000
Cyprus
Malta
Switzerland
Luxembourg
Bulgaria
Finland
Slovakia
Greece
Romania
Latvia
Hungary
Estonia
Lithuania
Sweden
Croatia
Slovenia
Austria
Turkey
Spain
Italy
Portugal
Poland
Denmark
Czech Republic
Ireland
France
United Kingdom
Belgium
Netherlands
Germany 15,091
14,183
11,074
6,549
5,103
3,988
3,360
3,019
2,541
2,494
1,889
1,366
1,048
823
720
555
544
510
495
480
431
398
363
290
191
78
65
53
8
7
Beer Statistics | 2014 edition Page 18
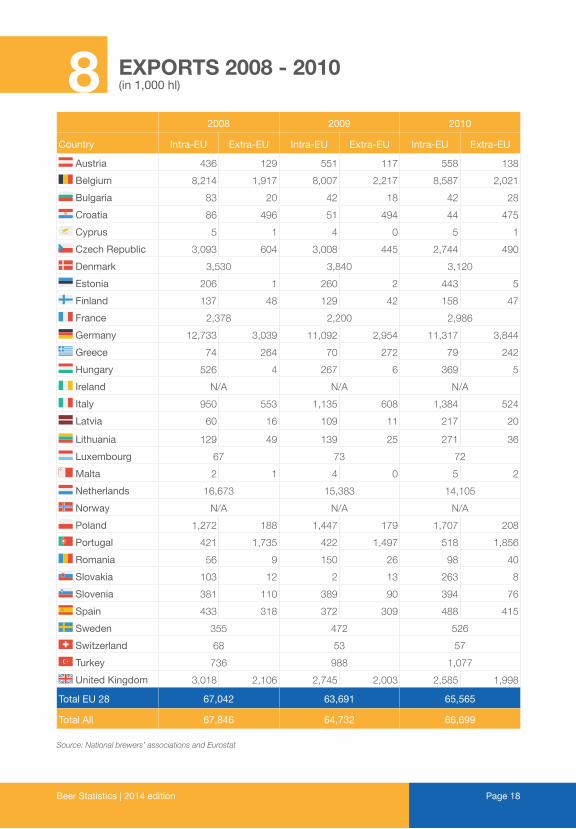
8 EXPORTS 2008 - 2010(in 1,000 hl)
2008 2009 2010
Country Intra-EU Extra-EU Intra-EU Extra-EU Intra-EU Extra-EU
Austria 436 129 551 117 558 138
Belgium 8,214 1,917 8,007 2,217 8,587 2,021
Bulgaria 83 20 42 18 42 28
Croatia 86 496 51 494 44 475
Cyprus 5 1 4 0 5 1
Czech Republic 3,093 604 3,008 445 2,744 490
Denmark 3,530 3,840 3,120
Estonia 206 1 260 2 443 5
Finland 137 48 129 42 158 47
France 2,378 2,200 2,986
Germany 12,733 3,039 11,092 2,954 11,317 3,844
Greece 74 264 70 272 79 242
Hungary 526 4 267 6 369 5
Ireland N/A N/A N/A
Italy 950 553 1,135 608 1,384 524
Latvia 60 16 109 11 217 20
Lithuania 129 49 139 25 271 36
Luxembourg 67 73 72
Malta 2 1 4 0 5 2
Netherlands 16,673 15,383 14,105
Norway N/A N/A N/A
Poland 1,272 188 1,447 179 1,707 208
Portugal 421 1,735 422 1,497 518 1,856
Romania 56 9 150 26 98 40
Slovakia 103 12 2 13 263 8
Slovenia 381 110 389 90 394 76
Spain 433 318 372 309 488 415
Sweden 355 472 526
Switzerland 68 53 57
Turkey 736 988 1,077
United Kingdom 3,018 2,106 2,745 2,003 2,585 1,998
Total EU 28 67,042 63,691 65,565
Total All 67,846 64,732 66,699
Source: National brewers’ associations and Eurostat
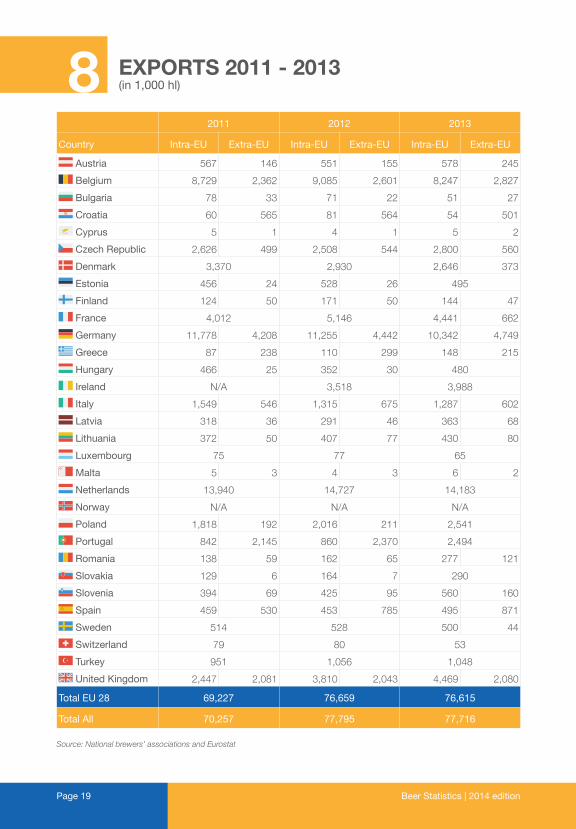
Beer Statistics | 2014 editionPage 19
2011 2012 2013
Country Intra-EU Extra-EU Intra-EU Extra-EU Intra-EU Extra-EU
Austria 567 146 551 155 578 245
Belgium 8,729 2,362 9,085 2,601 8,247 2,827
Bulgaria 78 33 71 22 51 27
Croatia 60 565 81 564 54 501
Cyprus 5 1 4 1 5 2
Czech Republic 2,626 499 2,508 544 2,800 560
Denmark 3,370 2,930 2,646 373
Estonia 456 24 528 26 495
Finland 124 50 171 50 144 47
France 4,012 5,146 4,441 662
Germany 11,778 4,208 11,255 4,442 10,342 4,749
Greece 87 238 110 299 148 215
Hungary 466 25 352 30 480
Ireland N/A 3,518 3,988
Italy 1,549 546 1,315 675 1,287 602
Latvia 318 36 291 46 363 68
Lithuania 372 50 407 77 430 80
Luxembourg 75 77 65
Malta 5 3 4 3 6 2
Netherlands 13,940 14,727 14,183
Norway N/A N/A N/A
Poland 1,818 192 2,016 211 2,541
Portugal 842 2,145 860 2,370 2,494
Romania 138 59 162 65 277 121
Slovakia 129 6 164 7 290
Slovenia 394 69 425 95 560 160
Spain 459 530 453 785 495 871
Sweden 514 528 500 44
Switzerland 79 80 53
Turkey 951 1,056 1,048
United Kingdom 2,447 2,081 3,810 2,043 4,469 2,080
Total EU 28 69,227 76,659 76,615
Total All 70,257 77,795 77,716
Source: National brewers’ associations and Eurostat
8 EXPORTS 2011 - 2013(in 1,000 hl)
Beer Statistics | 2014 edition Page 20
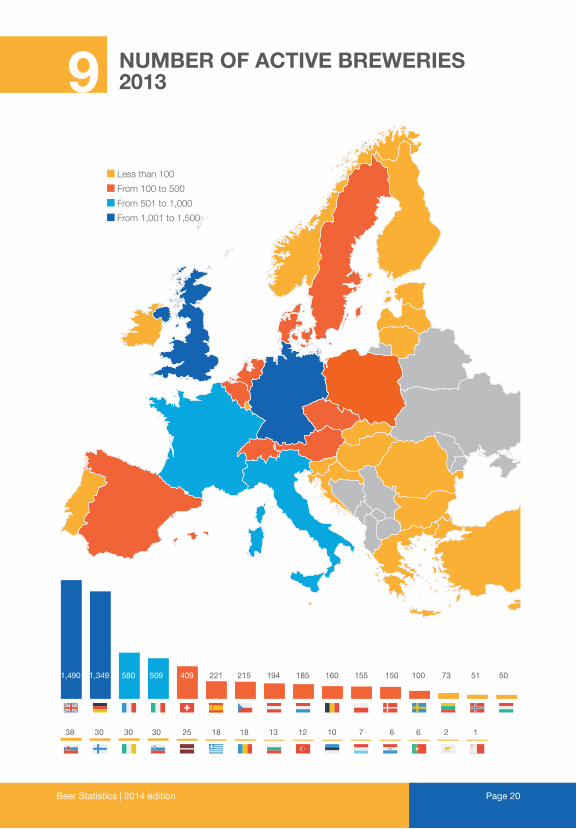
9 NUMBER OF ACTIVE BREWERIES2013
1,490 1,349 580 509 409 221 215 194 185 160 155 150 100 73 51 50
38 30 30 30 25 18 18 13 12 10 7 6 6 2 1
Less than 100
From 100 to 500
From 501 to 1,000
From 1,001 to 1,500
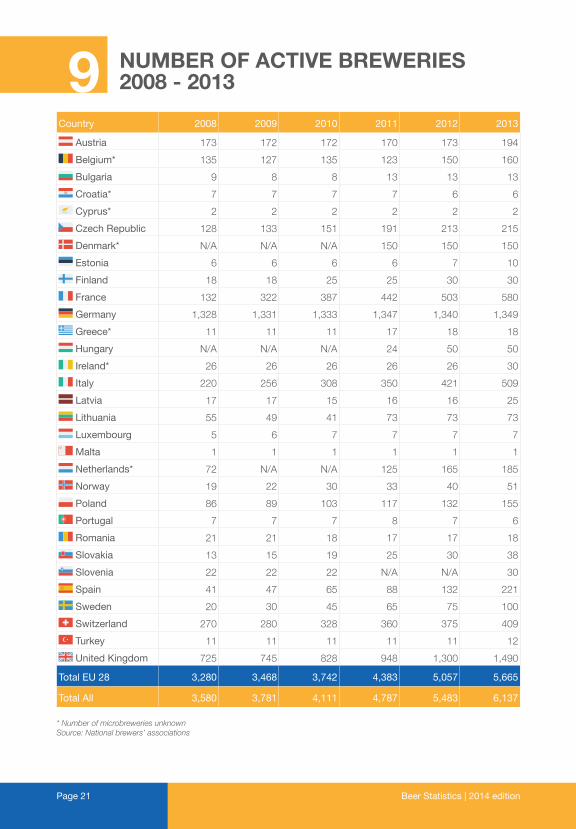
Beer Statistics | 2014 editionPage 21
Country 2008 2009 2010 2011 2012 2013
Austria 173 172 172 170 173 194
Belgium* 135 127 135 123 150 160
Bulgaria 9 8 8 13 13 13
Croatia* 7 7 7 7 6 6
Cyprus* 2 2 2 2 2 2
Czech Republic 128 133 151 191 213 215
Denmark* N/A N/A N/A 150 150 150
Estonia 6 6 6 6 7 10
Finland 18 18 25 25 30 30
France 132 322 387 442 503 580
Germany 1,328 1,331 1,333 1,347 1,340 1,349
Greece* 11 11 11 17 18 18
Hungary N/A N/A N/A 24 50 50
Ireland* 26 26 26 26 26 30
Italy 220 256 308 350 421 509
Latvia 17 17 15 16 16 25
Lithuania 55 49 41 73 73 73
Luxembourg 5 6 7 7 7 7
Malta 1 1 1 1 1 1
Netherlands* 72 N/A N/A 125 165 185
Norway 19 22 30 33 40 51
Poland 86 89 103 117 132 155
Portugal 7 7 7 8 7 6
Romania 21 21 18 17 17 18
Slovakia 13 15 19 25 30 38
Slovenia 22 22 22 N/A N/A 30
Spain 41 47 65 88 132 221
Sweden 20 30 45 65 75 100
Switzerland 270 280 328 360 375 409
Turkey 11 11 11 11 11 12
United Kingdom 725 745 828 948 1,300 1,490
Total EU 28 3,280 3,468 3,742 4,383 5,057 5,665
Total All 3,580 3,781 4,111 4,787 5,483 6,137
* Number of microbreweries unknownSource: National brewers’ associations
9 NUMBER OF ACTIVE BREWERIES2008 - 2013
Beer Statistics | 2014 edition Page 22
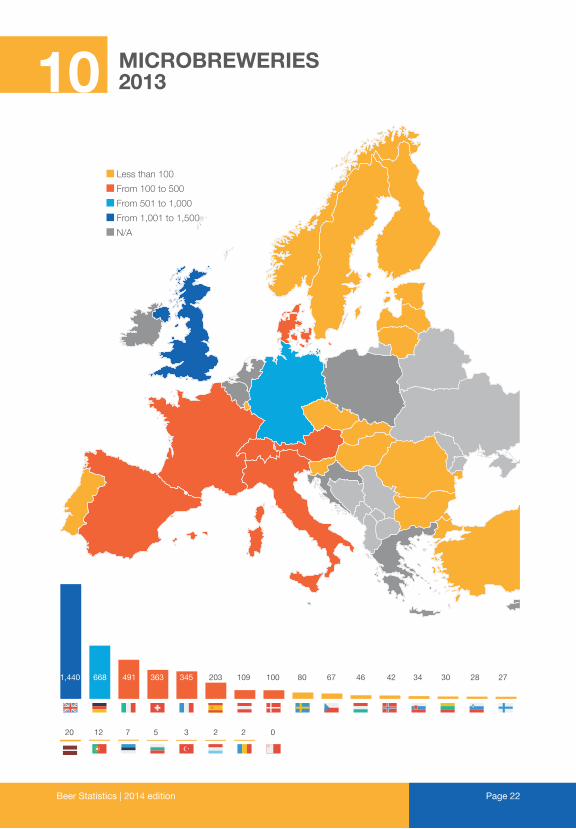
10 MICROBREWERIES2013
20 12 7 5 3 2 2 0
Less than 100
From 100 to 500
From 501 to 1,000
From 1,001 to 1,500
N/A
1,440 668 491 363 345 203 109 100 80 67 46 42 34 30 28 27
Beer Statistics | 2014 editionPage 23
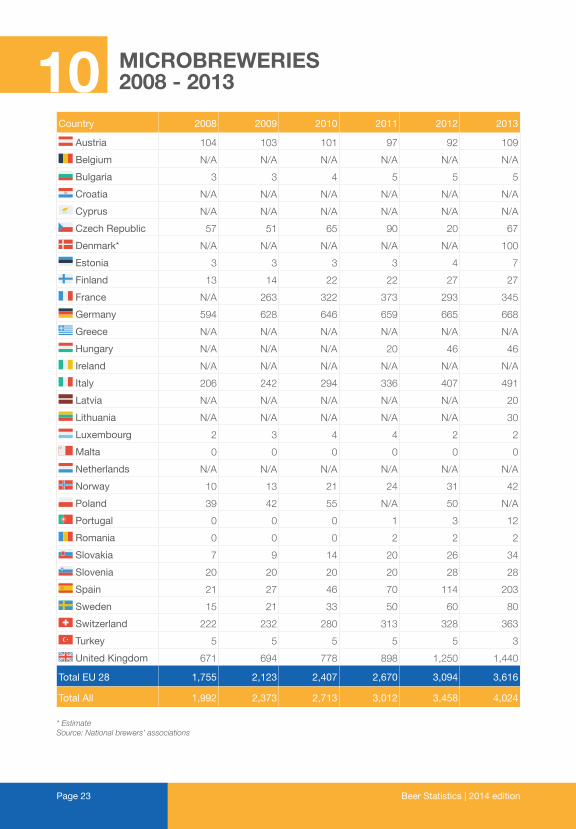
Country 2008 2009 2010 2011 2012 2013
Austria 104 103 101 97 92 109
Belgium N/A N/A N/A N/A N/A N/A
Bulgaria 3 3 4 5 5 5
Croatia N/A N/A N/A N/A N/A N/A
Cyprus N/A N/A N/A N/A N/A N/A
Czech Republic 57 51 65 90 20 67
Denmark* N/A N/A N/A N/A N/A 100
Estonia 3 3 3 3 4 7
Finland 13 14 22 22 27 27
France N/A 263 322 373 293 345
Germany 594 628 646 659 665 668
Greece N/A N/A N/A N/A N/A N/A
Hungary N/A N/A N/A 20 46 46
Ireland N/A N/A N/A N/A N/A N/A
Italy 206 242 294 336 407 491
Latvia N/A N/A N/A N/A N/A 20
Lithuania N/A N/A N/A N/A N/A 30
Luxembourg 2 3 4 4 2 2
Malta 0 0 0 0 0 0
Netherlands N/A N/A N/A N/A N/A N/A
Norway 10 13 21 24 31 42
Poland 39 42 55 N/A 50 N/A
Portugal 0 0 0 1 3 12
Romania 0 0 0 2 2 2
Slovakia 7 9 14 20 26 34
Slovenia 20 20 20 20 28 28
Spain 21 27 46 70 114 203
Sweden 15 21 33 50 60 80
Switzerland 222 232 280 313 328 363
Turkey 5 5 5 5 5 3
United Kingdom 671 694 778 898 1,250 1,440
Total EU 28 1,755 2,123 2,407 2,670 3,094 3,616
Total All 1,992 2,373 2,713 3,012 3,458 4,024
* EstimateSource: National brewers’ associations
10 MICROBREWERIES2008 - 2013
Beer Statistics | 2014 edition Page 24
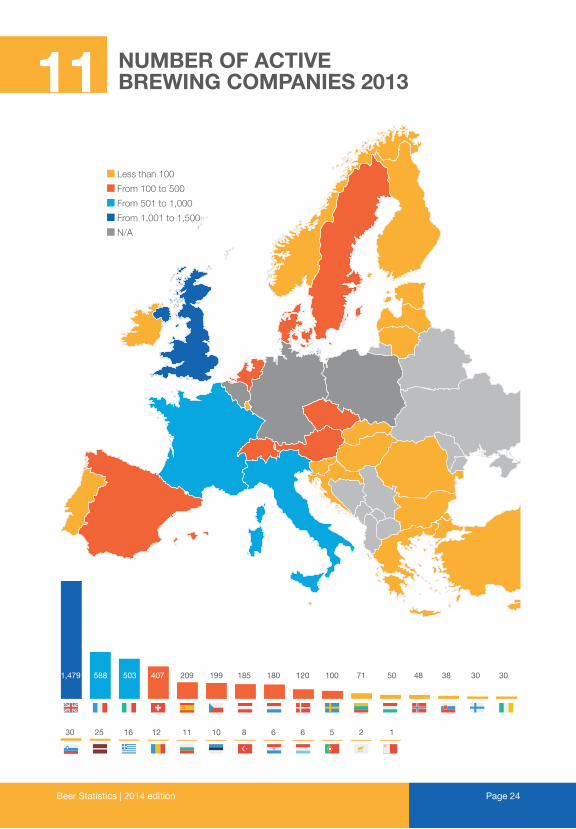
11 NUMBER OF ACTIVEBREWING COMPANIES 2013
30 25 16 12 11 10 8 6 6 5 2 1
Less than 100
From 100 to 500
From 501 to 1,000
From 1,001 to 1,500
N/A
1,479 588 503 407 209 199 185 180 120 100 71 50 48 38 30 30
Beer Statistics | 2014 editionPage 25
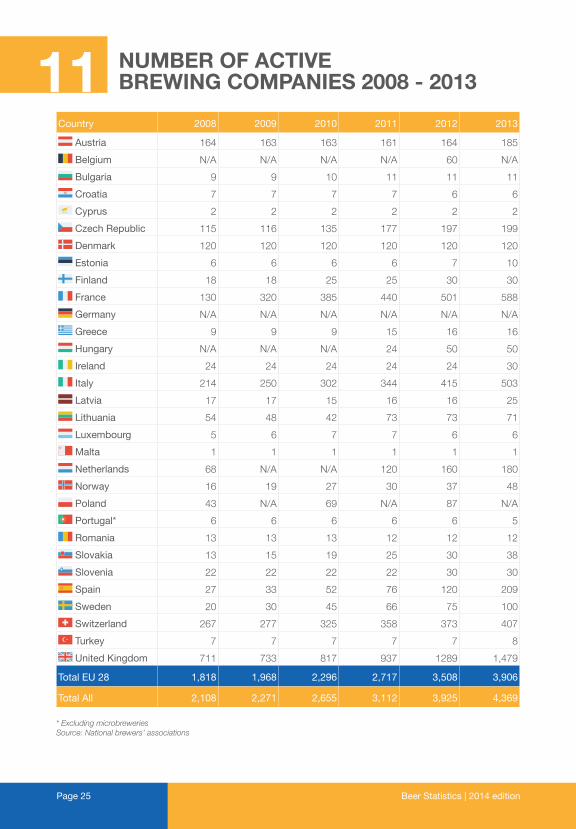
Country 2008 2009 2010 2011 2012 2013
Austria 164 163 163 161 164 185
Belgium N/A N/A N/A N/A 60 N/A
Bulgaria 9 9 10 11 11 11
Croatia 7 7 7 7 6 6
Cyprus 2 2 2 2 2 2
Czech Republic 115 116 135 177 197 199
Denmark 120 120 120 120 120 120
Estonia 6 6 6 6 7 10
Finland 18 18 25 25 30 30
France 130 320 385 440 501 588
Germany N/A N/A N/A N/A N/A N/A
Greece 9 9 9 15 16 16
Hungary N/A N/A N/A 24 50 50
Ireland 24 24 24 24 24 30
Italy 214 250 302 344 415 503
Latvia 17 17 15 16 16 25
Lithuania 54 48 42 73 73 71
Luxembourg 5 6 7 7 6 6
Malta 1 1 1 1 1 1
Netherlands 68 N/A N/A 120 160 180
Norway 16 19 27 30 37 48
Poland 43 N/A 69 N/A 87 N/A
Portugal* 6 6 6 6 6 5
Romania 13 13 13 12 12 12
Slovakia 13 15 19 25 30 38
Slovenia 22 22 22 22 30 30
Spain 27 33 52 76 120 209
Sweden 20 30 45 66 75 100
Switzerland 267 277 325 358 373 407
Turkey 7 7 7 7 7 8
United Kingdom 711 733 817 937 1289 1,479
Total EU 28 1,818 1,968 2,296 2,717 3,508 3,906
Total All 2,108 2,271 2,655 3,112 3,925 4,369
* Excluding microbreweriesSource: National brewers’ associations
11 NUMBER OF ACTIVEBREWING COMPANIES 2008 - 2013
Beer Statistics | 2014 edition Page 26
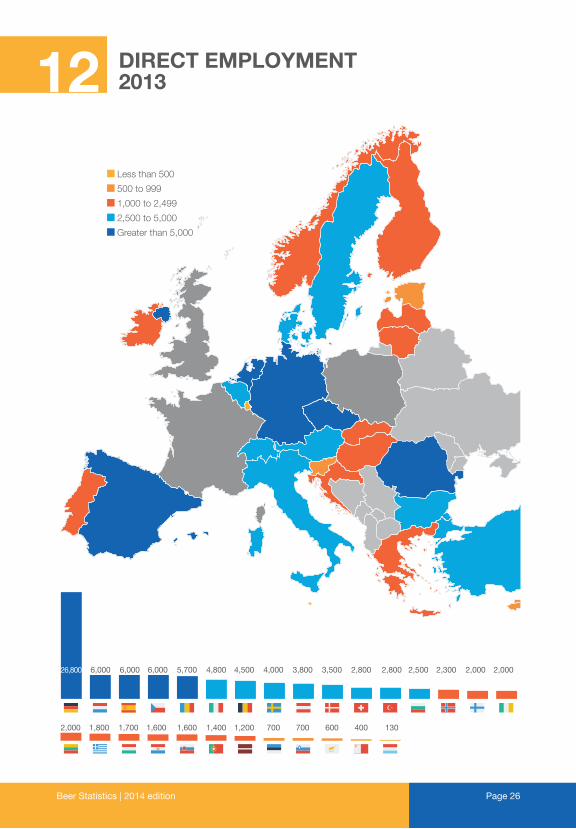
12 DIRECT EMPLOYMENT2013
Less than 500
500 to 999
1,000 to 2,499
2,500 to 5,000
Greater than 5,000
26,800 6,000 6,000 6,000 5,700 4,800 4,500 4,000 3,800 3,500 2,800 2,800 2,500 2,300 2,000 2,000
2,000 1,800 1,700 1,600 1,600 1,400 1,200 700 700 600 400 130
Beer Statistics | 2014 editionPage 27
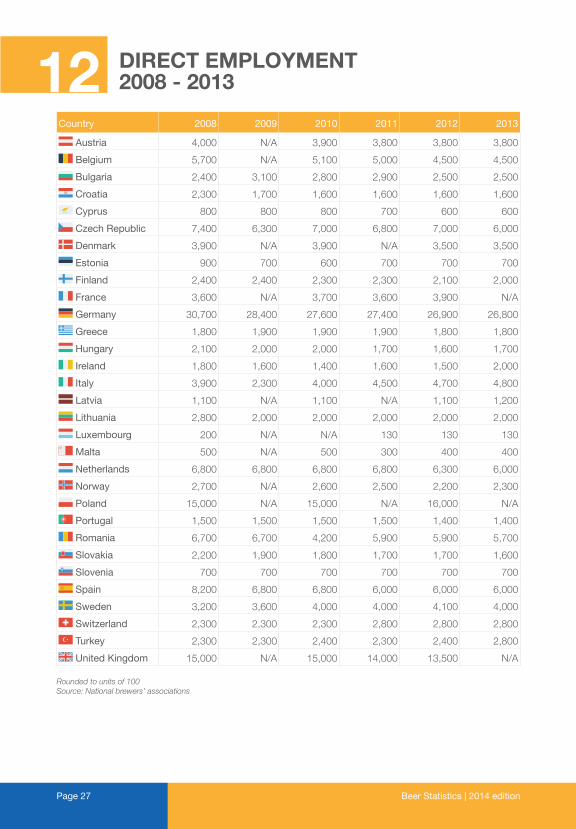
Country 2008 2009 2010 2011 2012 2013
Austria 4,000 N/A 3,900 3,800 3,800 3,800
Belgium 5,700 N/A 5,100 5,000 4,500 4,500
Bulgaria 2,400 3,100 2,800 2,900 2,500 2,500
Croatia 2,300 1,700 1,600 1,600 1,600 1,600
Cyprus 800 800 800 700 600 600
Czech Republic 7,400 6,300 7,000 6,800 7,000 6,000
Denmark 3,900 N/A 3,900 N/A 3,500 3,500
Estonia 900 700 600 700 700 700
Finland 2,400 2,400 2,300 2,300 2,100 2,000
France 3,600 N/A 3,700 3,600 3,900 N/A
Germany 30,700 28,400 27,600 27,400 26,900 26,800
Greece 1,800 1,900 1,900 1,900 1,800 1,800
Hungary 2,100 2,000 2,000 1,700 1,600 1,700
Ireland 1,800 1,600 1,400 1,600 1,500 2,000
Italy 3,900 2,300 4,000 4,500 4,700 4,800
Latvia 1,100 N/A 1,100 N/A 1,100 1,200
Lithuania 2,800 2,000 2,000 2,000 2,000 2,000
Luxembourg 200 N/A N/A 130 130 130
Malta 500 N/A 500 300 400 400
Netherlands 6,800 6,800 6,800 6,800 6,300 6,000
Norway 2,700 N/A 2,600 2,500 2,200 2,300
Poland 15,000 N/A 15,000 N/A 16,000 N/A
Portugal 1,500 1,500 1,500 1,500 1,400 1,400
Romania 6,700 6,700 4,200 5,900 5,900 5,700
Slovakia 2,200 1,900 1,800 1,700 1,700 1,600
Slovenia 700 700 700 700 700 700
Spain 8,200 6,800 6,800 6,000 6,000 6,000
Sweden 3,200 3,600 4,000 4,000 4,100 4,000
Switzerland 2,300 2,300 2,300 2,800 2,800 2,800
Turkey 2,300 2,300 2,400 2,300 2,400 2,800
United Kingdom 15,000 N/A 15,000 14,000 13,500 N/A
Rounded to units of 100Source: National brewers’ associations
12 DIRECT EMPLOYMENT2008 - 2013
Beer Statistics | 2014 edition Page 28
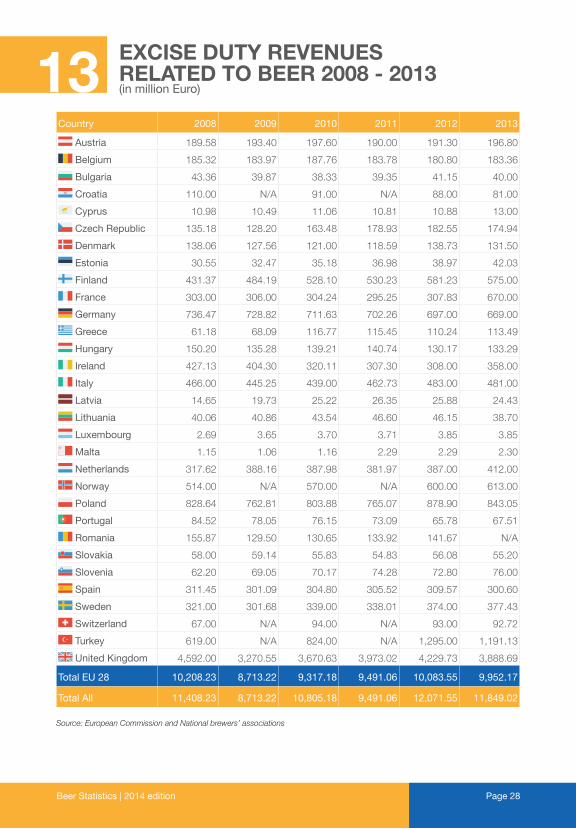
Country 2008 2009 2010 2011 2012 2013
Austria 189.58 193.40 197.60 190.00 191.30 196.80
Belgium 185.32 183.97 187.76 183.78 180.80 183.36
Bulgaria 43.36 39.87 38.33 39.35 41.15 40.00
Croatia 110.00 N/A 91.00 N/A 88.00 81.00
Cyprus 10.98 10.49 11.06 10.81 10.88 13.00
Czech Republic 135.18 128.20 163.48 178.93 182.55 174.94
Denmark 138.06 127.56 121.00 118.59 138.73 131.50
Estonia 30.55 32.47 35.18 36.98 38.97 42.03
Finland 431.37 484.19 528.10 530.23 581.23 575.00
France 303.00 306.00 304.24 295.25 307.83 670.00
Germany 736.47 728.82 711.63 702.26 697.00 669.00
Greece 61.18 68.09 116.77 115.45 110.24 113.49
Hungary 150.20 135.28 139.21 140.74 130.17 133.29
Ireland 427.13 404.30 320.11 307.30 308.00 358.00
Italy 466.00 445.25 439.00 462.73 483.00 481.00
Latvia 14.65 19.73 25.22 26.35 25.88 24.43
Lithuania 40.06 40.86 43.54 46.60 46.15 38.70
Luxembourg 2.69 3.65 3.70 3.71 3.85 3.85
Malta 1.15 1.06 1.16 2.29 2.29 2.30
Netherlands 317.62 388.16 387.98 381.97 387.00 412.00
Norway 514.00 N/A 570.00 N/A 600.00 613.00
Poland 828.64 762.81 803.88 765.07 878.90 843.05
Portugal 84.52 78.05 76.15 73.09 65.78 67.51
Romania 155.87 129.50 130.65 133.92 141.67 N/A
Slovakia 58.00 59.14 55.83 54.83 56.08 55.20
Slovenia 62.20 69.05 70.17 74.28 72.80 76.00
Spain 311.45 301.09 304.80 305.52 309.57 300.60
Sweden 321.00 301.68 339.00 338.01 374.00 377.43
Switzerland 67.00 N/A 94.00 N/A 93.00 92.72
Turkey 619.00 N/A 824.00 N/A 1,295.00 1,191.13
United Kingdom 4,592.00 3,270.55 3,670.63 3,973.02 4,229.73 3,888.69
Total EU 28 10,208.23 8,713.22 9,317.18 9,491.06 10,083.55 9,952.17
Total All 11,408.23 8,713.22 10,805.18 9,491.06 12,071.55 11,849.02
Source: European Commission and National brewers’ associations
13 EXCISE DUTY REVENUES RELATED TO BEER 2008 - 2013(in million Euro)
Beer Statistics | 2014 editionPage 29
Beer production:Beer produced within a given country.
Beer consumption:Beer consumed within a given country.
Beer consumption per capita:Consumption per head in a given country.
Brewery:A plant or an establishment for beer production.
Brewing company:A company which produces and / or sells beer, operating one or more breweries. These companies may also be involved in activities other than brewing beer, such as the production of soft drinks and bottled mineral water.
Direct employment:Employment generated directly by the brewing sector.
Excise duty revenue related to beer:Government revenues generated from excise duties on the sale of beer.
Export - Extra-EU:Extra-EU exports of goods are goods which leave the territory of the European Union for a third country after being placed under the customs procedure for exports (for definitive export) or outward processing (goods for working, further processing) or repair or following inward processing.
Export - Intra-EU:Intra-EU exports of goods are goods which leave a Member State of the EU for another Member State for definitive export, outward processing or repair or following inward processing.
Hectolitre (hl):A hectolitre is a metric unit of volume or capacity where one hectolitre equals 100 litres.
14 GLOSSARY
Beer Statistics | 2014 edition Page 30
Import - Extra-EU:Extra-EU imports of goods are goods which enter the territory of the European Union from a third country and are placed under the customs procedure for free circulation within the EU (as a general rule goods intended for consumption), inward processing or processing under customs control (goods for working, processing or repair) immediately or after bonded warehousing.
Import - Intra-EU:Intra-EU imports of goods are goods which enter a Member State of the EU from another Member State for definitive import (as a general rule goods intended for consumption), inward processing or processing under customs control (goods for working, processing or repair) immediately or after bonded warehousing.
Microbrewery:A brewery with yearly production up to 1,000 hectolitres.
Off-trade sector:Beer sales through wholesale and retail (shops, supermarkets and other outlets).
On-trade sector:Beer sales through (licensed) pubs, clubs, bars, restaurants, etc., also called the hospitality sector.
Beer Statistics | 2014 editionPage 31
The data for the 2014 edition were mainly collated via the national brewers’ associations through surveys carried out by The Brewers of Europe from 2009 until 2014.
With the received data the corresponding tables and charts have been prepared and verified with the interlocutors from different countries. Therefore, unless indicated otherwise in this or previous editions, all data comes from national brewers associations.
When data was not available through national associations other sources were used to complete as much as possible the tables. The sources used for this edition include:
• National brewers’ associations data• Eurostat
Figures contained in some tables may have been rounded and also corrected from previous editions of this publication.
The Brewers of Europe Secretariat would like to thank all those from national brewers associations who contributed to this brochure.
We thank 2B.COM sprl for the document’s design and support.
15
16
METHODOLOGY
ACKNOWLEDGEMENTS
Beer Statistics | 2014 edition Page 32
The information and data contained in this document are those provided by national associations unless stated otherwise. Where possible The Brewers of Europe Secretariat ensured the accuracy of the figures with those submitted by the national associations and those coming from other sources.
The Brewers of Europe does not take any responsibility for omissions, mistakes or errors appearing in this brochure which do not come from its own activities.
The Brewers of Europe Secretariat
Beer statistics 2014 edition
Editor: Marlies Van de Walle1st edition, October 2014
ISBN 978-2-9601382-3-8EAN 9782960138238
17 DISCLAIMER


Rue Caroly 23 - 25 B - 1050 Brussels Belgium
Phone: +32 2 5511810 Fax: +32 2 6609402
[email protected] www.brewersofeurope.org
The Brewers of Europe