2014 financial report...2014, is a $50 million capital project funded entirely by gifts. financial...
TRANSCRIPT

2014 FINANCIAL REPORT

Front Cover: The Tinkham Veale University Center is the newest addition to the campus of Case Western Reserve University. Opened in August 2014, the 82,000-square-foot facility is distinguishable on two levels — physically for iconic architecture and philosophically for campus unification.
Physically, three wings hug the ground creating what architect Perkins + Will dubbed a landscraper (not a skyscraper). The panoramic glass façade and sloping green roof makes “The Tink” feel like a bridge, not a barrier, between the east and west sides of campus.
Philosophically, the Tink pulses with people and ideas from around the university. Designed to foster a culture of inclusion, it draws student, faculty, staff and the community to what they need in its variety of office spaces and common areas.
The Tink is the new heart of campus. It’s the first time CWRU has had a large-scale, purpose-built hub; one that captures the spirit of its branding anthem – “think beyond the possible.”
Discussion of Financial Results (unaudited)
Selected Financial Data (unaudited)
Report of Independent Auditors
Consolidated Statements of Financial Position
Consolidated Statement of Activities
Consolidated Statements of Cash Flows
Notes to Financial Statements
1
7
8
10
11
12
13
TABLE OF CONTENTS

C A S E W E S T E R N R E S E R V E U N I V E R S I T Y F Y 1 4 F I N A N C I A L R E P O R T | 1
Case Western Reserve University continued to grow a solid financial resource base during Fiscal Year 2014 (“FY14”). In an increasingly competitive environment, the University’s fundraising campaign drove record levels of attainment, undergraduate enrollment efforts resulted in the most academically accomplished entering class, and the University’s net operating activities remain positive. In addition, investment returns produced strong non-operating financial benefits and financial market activity resulted in more favorable interest rate swaps.
The FY14 financial plan continued to focus on maintaining momentum in core operating results, funding strategic capital projects by philanthropy, and achieving desired undergraduate enrollment. The results were a $65 million or 7.0% operating margin (GAAP basis), another all-time record in attainment of $152 million in new pledges, and undergraduate enrollment that contributed to a net tuition revenue increase of $9 million.
Capital expenditures continue to adhere to a disciplined planning process that leverages philanthropic support for strategic projects. The Tinkham Veale University Center, opened in August 2014, is a $50 million capital project funded entirely by gifts. Financial market activity resulted in non-operating gains of $217 million as investment returns grew by 16.1%. Undergraduate enrollment growth has consumed all available student housing. The University will issue its first new housing-related debt in a decade and the new debt will be supported by incremental revenue from the increased undergraduate enrollment.
Following are additional comments related to the University’s operations and financial results, with Selected Financial Data shown on page 7.
FY14 FINANCIAL HIGHLIGHTS
Solid Core Operating ResultsThe University’s management of resources produced a net operating income on a GAAP basis of $65 million, a 7.0% operating margin. A proactive management plan was reflected in a balanced budget in 2014, including a budgeted operating surplus of $6.1 million.
The Statement of Operations (management view) surplus of $7.2 million reflects a one-time reduction of healthcare liabilities of $2.9 million. The operating surplus, exclusive of the one-time adjustment, is $4.2 million. Both net operating activity (GAAP basis) and operating surpluses (management view) have been positive for seven years.
Record-breaking Attainment LevelIn 2014, the University again benefitted from the generosity of its donors. Case Western Reserve University set another all-time record for attainment of $152 million in FY14. The total represents a 4% increase over the previous record amount of $146 million achieved in FY13. Attainment has increased in each of the last six years. In FY14, the University received gifts from nearly 18,000 donors, totaling $125 million as reported on a cash basis. Realized gifts and pledges of over $85 million are reported in the financial statements on an accrual basis.
Targeted Undergraduate EnrollmentThe University began the 2013-2014 academic year by welcoming 1,252 students, which is at targeted size and the most highly qualified entering undergraduate class. Undergraduate tuition revenue, combined with other increases in professional and graduate programs, grew student tuition and fees to $369 million, or by $22 million from the prior year. Student aid increased $13 million or 9% over FY13, and overall net tuition increased $9 million over FY13. The total undergraduate discount rate increased from 49.3% to 50.2% in FY14.
Higher undergraduate enrollment caused auxiliaries revenue to increase by $5 million. The University has now utilized all of its available student housing due to higher undergraduate enrollment. A new undergraduate residence hall is underway and will be supported by incremental revenue. The new student housing is expected to be available for the 2015-2016 academic year.
DISCUSSION OF FINANCIAL RESULTS

2 | D I S C U S S I O N O F F I N A N C I A L R E S U L T S - u n a u d i t e d
STATEMENT OF OPERATIONSThe University manages its daily operations using a Statement of Operations (management view) that is prepared on a modified-cash basis and presented by natural account class; it is unaudited. The Statement of Operations measures and reports the organization’s management center-based activities. It excludes non-operating transactions, depreciation expense, differs in its treatment of capital, and excludes most restricted funds transactions (e.g. restricted gift revenue).
The University produced a total surplus of $7.2 million in FY14, compared to a budgeted surplus of $6.1 million and a $8.4 million surplus in FY13. FY14 marked the seventh consecutive year of positive operating results.
The FY14 operating results reflect increasing net tuition revenue from increasing numbers of undergraduates, strong auxiliary revenues correlated to increased undergraduate enrollment, and a one-time reduction of healthcare liabilities.
MANAGEMENT CENTER OPERATING REVENUESOperating revenues are classified in four categories: Tuition, Endowment, Research-related, and Other Revenue. The University reported $1,013 million in total revenue, a $7 million or 1% increase from FY13.
Tuition and fees revenue was $363 million, a $21 million or 6% increase from FY13. Gross undergraduate tuition was $176 million, a $15 million or 10% increase over FY13. The increase is a direct reflection of the 3.25% rate increase and an addition of 256 undergraduate full-time equivalents over FY13. Professional and graduate program gross tuition, along with Summer programs and fees, was $187 million, a $6 million or 3% increase over FY13.
Endowment revenue used by operations was $87 million, a $4 million or 5% increase over FY13.
Research-related revenues (Research & Training, Overhead Recovery, and Restricted Gifts) were $428 million, a $19 million or 4% decrease from FY13. The decrease reflects the conclusion of the American Recovery and Reinvestment Act (ARRA) federal stimulus funds.
Other Revenue was $134 million, a $1 million or 1% increase over FY13, with a $4 million or 6% increase in auxiliary services revenue, related to rate increases and a 6% growth in the undergraduate student population. This was partially offset by a decrease in other income of $3 million over FY13.
MANAGEMENT CENTER OPERATING EXPENSESOperating expenses were $1,011 million, a $11 million or 1% increase from FY13. Functional expenses are categorized as Salaries and Benefits, Other Direct, and Indirect Expenses.
Salaries and Benefits were $314 million, a $4 million or 1% increase from FY13. Other Direct Expense was $467 million, which held constant as compared to FY13. Indirect Expenses were $230 million, a $7 million or 3% increase from FY13, which were driven by the undergraduate student population growth as reflected in the financial aid and student-related auxiliary segments.
306,937 313,007 341,870 363,110
80,584 82,226 82,865 86,974
462,994 459,347 447,166 428,328
108,501 118,645 133,438 134,175
-
200,000
400,000
600,000
800,000
1,000,000
2011 2012 2013 2014
OPERATING REVENUEin thousands of dollars
Other Revenue Research-related Endowment Tuition & Fees
2009 2010 2011 2012 2013 2014
Budget (7,226) (4,278) 332 2,000 5,200 6,127
Actual 1,336 2,226 4,499 6,375 8,412 7,179
(10,000)
(8,000)
(6,000)
(4,000)
(2,000)
-
2,000
4,000
6,000
8,000
10,000
UNIVERSITY SURPLUS/(DEFICIT)in thousands of dollars
296,322 307,853 309,856 313,632
454,103 446,685 467,560 467,211
208,029 213,510 222,814 230,233
-
200,000
400,000
600,000
800,000
1,000,000
2011 2012 2013 2014
OPERATING EXPENSESin thousands of dollars
Indirect Expenses Other Direct Expense Salaries & Benefits

C A S E W E S T E R N R E S E R V E U N I V E R S I T Y F Y 1 4 F I N A N C I A L R E P O R T | 3
CONSOLIDATED STATEMENT OF ACTIVITIESThe Statement of Activities (GAAP basis) includes consolidated results from the University’s operating and non-operating activities which produced a positive change in net assets. In FY14, operating activity contributed $65 million to net assets.
OPERATING REVENUES Total operating revenues were $926 million, an $18 million or 2% increase from FY13. The components of the University’s revenues are shown below; additional detail of operating revenue follows.
Tuition IncomeGross tuition income of $369 million increased $22 million or 6% over FY13, and includes fees and undergraduate, graduate, summer, and professional tuition. Gross tuition income is offset in part by financial aid awarded; the financial aid offset for FY14 was $150 million, resulting in net tuition of $218 million, or 23% of operating revenues.
The net tuition and fees income of $218 million represents a $9 million or 4% increase over FY13, with increased revenues generated by an increase in tuition rates and from higher undergraduate enrollment.
Investment Returns Investment Returns included $63 million in returns distributed from the long-term investment pool, $20 million in returns on operating investments, and $15 million in distributions from funds held by others (FHBO) for endowment spending. Investment returns, which represent 11% of operating revenues, totaled $99 million, an increase of $10 million or 12% from FY13.
Grants and contractsGrants and contracts revenue includes awards to Case Western Reserve University and also its affiliates, most notably the Cleveland Clinic Lerner College of Medicine (“CCLCM”). Grants and contracts received for research and training purposes totaled $332 million, including $83 million in CCLCM awards. This amount reflects a decrease of $12 million or 3% from FY13. The total represents 36% of overall University operating revenues. The decline corresponds with a drop in research operating expenses and the conclusion of the American Recovery and Reinvestment Act (ARRA) federal stimulus funds.
Overhead cost recoveryThe Facilities and Administrative cost recovery applicable to federally sponsored projects and all other sponsored activity was $72 million in FY14, a $4 million or 5% decrease from FY13. Overhead recovery constituted 8% of operating revenue.
Gifts & PledgesGifts & Pledges income was $85 million, an increase of $8 million or 10% from FY13. Gifts & Pledges, which represent 9% of operating revenues, are recorded in the appropriate asset category when received.
AuxiliariesAuxiliaries revenue of $62 million increased $4 million or 6% over FY13. Auxiliaries revenue is categorized as either “Student,” which is largely Housing, Food, and Health Services, totaling $50 million, or “Other,” including Rental Properties and Parking, totaling $12 million for FY14. Auxiliaries revenue represents 7% of operating revenues.
Other revenueOther revenue of $57 million increased $3 million or 5% from FY13. Other revenue represents 6% of operating revenues and includes the State of Ohio appropriation, Organized Activities, and Other Sources.
Investment Returns
11%
Grants and Contracts
36%
Overhead Recovery
8%
Gifts & Pledges9%
Other6%
Auxiliaries7%
Tuition (net of
financial aid)23%
Statement of Activities data
OPERATING REVENUES $926 million

4 | D I S C U S S I O N O F F I N A N C I A L R E S U L T S - u n a u d i t e d
OPERATING EXPENSESTotal expenses of $861 million decreased $5 million or 1% over FY13. The components of the University’s expenses are shown below; additional detail of operating expenses follows.
Instructional costs of $290 million, which comprise 34% of operating expenses, increased by $3 million or 1% over FY13. Included in direct instructional costs are faculty and staff salaries and benefits, including a merit increase pool for faculty and staff of 2% over FY13.
Sponsored Research Activity of $361 million, represents 42% of operating expenses, decreased $14 million or 4% from FY13. Sponsored research activity includes Sponsored research and training, Other sponsored projects, and CCLCM research and training expenses.
Support Services costs of $141 million, or 16% of operating expenses, including Library, Student Services, and University Services, increased $3 million or 2% over FY13.
Auxiliaries expenses of $70 million, which constitute 8% of operating expenses, increased $4 million or 5% over FY13. Most of the increase came from student-focused auxiliaries because of increased volume in student housing and food services.
NON-OPERATING ACTIVITIESNon-operating activities added $150 million to net assets, largely because of positive investment returns.
Long-term Investment ActivitiesLong-term investment activities realized $59 million in investment returns and $165 million in unrealized appreciation on $1.9 billion in investment assets. Investment income increased $30 million over FY13, and investment appreciation increased $85 million over FY13.
Other Non-Operating ActivitiesOther non-operating activities includes Changes in liabilities due under life-income agreements, Pension plan changes other than periodic benefit costs, and Loss on disposal of plant assets. These other non-operating activities resulted in a $11 million loss in net assets, or a decrease of $31 million over FY13.
CHANGE IN NET ASSETSThe combined net operating activity of $65 million and net non-operating activity of $150 million resulted in an increase in net assets of $215 million or 11% from FY13.
THE UNIVERSITY’S ENDOWMENT Case Western Reserve University diligently stewards its endowment assets with an investment program that seeks to grow portfolio value in favorable markets and protect portfolio value in volatile markets. Its pooled endowment investment policy focuses more on consistency of investment outcome than on maximizing investment return at any cost. To that end, the University sets an allocation of assets and risk diversified across global public equity and fixed income markets, private capital markets, natural resources, hedge funds, real estate and other real assets that are sensitive to inflation. The overriding goal is to build a portfolio that does consistently well on both an absolute and a relative basis in a variety of economic and inflationary environments.
Compared to ten years ago at the end of FY2004, the pool’s investment asset allocation had changed. The pool’s allocation of assets showed decrease holdings in fixed income and real assets, increase holdings in marketable alternatives, and the addition of natural resources in the pool’s investment asset allocation.
Liquidity policy and spending distribution policy are overlaid onto asset allocation policy to support daily operational needs and the annual financial planning cycle. But like the University itself, the endowment’s investment horizon is in essence perpetual and the ultimate goal of stewardship is to assure that the endowment is able to provide equitable intergenerational support for both today’s and tomorrow’s students.
Fixed Income6%
Global Public Equities
40%
Private Capital
11%
Marketable Alternatives
21%
Real Assets
7%
Venture Capital
6%Natural
Resources9%
2014
Fixed Income
16%
Global Public Equities
44%PrivateCapital
6%
Marketable Alternatives
17%
Real Assets15%
Venture Capital
2%
2004
CHANGE IN NET ASSETS(in thousands) 2014 2013
Beginning net assets $ 1,935,908 $ 1,824,649
Increase in net assets 214,776 111,259
Ending net assets $ 2,150,684 $ 1,935,908
Instructional34%
Sponsored Research Activity
42% Support Services
16%
Auxiliaries8%
Statement of Activities data
OPERATING EXPENSES $861 million

C A S E W E S T E R N R E S E R V E U N I V E R S I T Y F Y 1 4 F I N A N C I A L R E P O R T | 5
CONSOLIDATED STATEMENTS OF FINANCIAL POSITION
The University’s Statements of Financial Position reflect total assets of $2.982 billion, primarily a sizable cash and investment balance of $2.035 billion, the cash portion of which increased liquidity over FY13.
ASSETSTotal cash and investments of $2.035 billion, including cash and cash equivalents, operating investments, long-term investments, and funds held by others, combined total 68% of University assets. Property, plant, equipment and books represent an additional $736 million or 25% of assets. Total assets increased $220 million or 8% over FY13.
Investments held for long-
term purposes46%
Funds held in trust by
others12%
Cash and cash equivalents
6% Operating investments, at
market4%
Property, plant, equipment, and books
25%
Receivables7%
TOTAL ASSETS$2.982 billion
Statement of Financial Position data
Cash and Cash EquivalentsThe University actively manages its cash and cash equivalents to maintain targeted levels of working capital in highly liquid assets to meet daily operating requirements. Working capital and board designated funds in excess of the liquidity target is retained in operating investments to produce a higher investment return. The University’s cash position on June 30 was $181 million, an increase of $30 million or 20% over FY13. Cash equivalents include all highly liquid investments with original purchase maturity of 90 or fewer days, and appropriated endowment income which may be spent on demand.
Operating Investments, at marketThe University’s operations were supported by $129 million of operational investments in addition to cash and cash equivalents. These investments generally have a maturity of greater than 90 days but may be liquidated on demand. Operating investments increased $16 million or 14% over FY13.
ReceivablesReceivables include net accounts and loans receivable as well as net pledges receivable. In total, the University had$205 million in receivables, which represent 7% of assets. Receivables increased $10 million or 5% from FY13.
Investments held for long-term purposesLong-term investments of $1.385 billion increased $118 million or 9% from FY13. Because a majority of the University’s long-term investments are endowments or similar funds, the Board of Trustees’ annually-approved endowment spending allocation and support for certain development-related activities had an impact of approximately $69 million on long-term investments in FY14.
Funds Held By OthersFunds held in trust by others of $340 million increased $35 million or 11% from FY13.
Property, Plant, Equipment, and BooksProperty, plant, equipment, and library books, net of depreciation, constitute 25% of the University’s assets, totaling $736 million for FY14. Net plant assets increased $11 million or 2% from FY13.
LIABILITIESTotal liabilities of $831 million increased $5 million or 1% over FY13.
Retirement PlansThe University provides defined benefit and defined contribution pension plans for its faculty and staff. The pension plan discount rate for the defined benefit plan decreased from 5.25% to 4.75% in FY14. This decrease caused the University’s accrued pension liability position to increase by $15 million from FY13, to a total accrued pension liability of $56 million in FY14.

6 | D I S C U S S I O N O F F I N A N C I A L R E S U L T S - u n a u d i t e d
DebtTotal liability on notes and bonds payable decreased $13 million or 2% over FY13, largely due to a principal repayment of commercial paper.
NET ASSETSIn FY14, the University’s total net assets increased $215 million or 11% over FY13 to $2.151 billion.
Unrestricted Net AssetsUnrestricted net assets increased $18 million or 11% from FY13 to $183 million. Net operating activity added $34 million and net non-operating activity caused a $16 million decrease in net assets.
Temporarily Restricted Net AssetsTemporarily restricted net assets increased $144 million or 17% from FY13 to $989 million. The University received $46 million of new temporarily restricted gifts and pledges and recognized $165 million in investment appreciation. Temporarily restricted net assets were offset by $67 million in assets released from restrictions.
Permanently Restricted Net AssetsPermanently restricted net assets increased $53 million or 6% from FY13 to $979 million. The increase was due to the receipt of $13 million in new gifts and pledges, and $43 million in investment appreciation, which were partially offset by a change in liabilities due under life-income agreements of $4 million.
PROSPECTIVE DISCUSSIONThe University expects to maintain its positive operating position as reflected in its FY15 operating budget surplus of $4 million. The new undergraduate student housing is well underway and will open in time for the arrival of students for the fall semester 2015. New debt issued for the new undergraduate student housing will be supported by incremental revenues. Finally, senior leadership is committed to continuous operating performance improvements, thereby strengthening the University’s financial position.
John F. Sideras, CPASenior Vice President and Chief Financial Officer

C A S E W E S T E R N R E S E R V E U N I V E R S I T Y F Y 1 4 F I N A N C I A L R E P O R T | 7
SELECTED FINANCIAL DATA unaudited
Fiscal Years Ended June 30
in thousands of dollars 2014 2013 2012 2011
STATEMENTS OF OPERATIONS HIGHLIGHTS - Management View
Total Revenue 1,012,587$ 1,005,339$ 973,225$ 959,016$
Total Expense 1,011,076 1,000,230 968,048 958,454
Operating Margin 1,511 5,109 5,177 562
Retained Surplus Use 5,668 3,303 1,198 3,937
Surplus 7,179$ 8,412$ 6,375$ 4,499$
STATEMENTS OF ACTIVITIES HIGHLIGHTS - GAAP Basis
Tuition and Fees (net of student aid) 218,482$ 209,258$ 199,709$ 188,078$
Investment, FHBO, and operational returns 98,559 88,141 84,165 105,188
Grants and Contracts 332,228 344,170 358,849 369,007
Facilities and Administrative cost recovery 72,495 76,196 79,607 79,742
Gifts and Pledges 85,237 77,498 62,165 77,878
Other Revenue 57,272 54,662 55,205 50,446
Auxiliary Services 62,019 58,250 51,002 49,449
Total Operating Revenue 926,292 908,175 890,702 919,788
Instructional Expenses 290,341 287,539 269,966 261,461
Sponsored Research Activity 360,848 374,422 389,979 394,955
Support Services 140,628 138,000 135,463 134,580
Auxiliary Services 69,621 66,003 58,971 62,414
Total Operating Expense 861,438 865,964 854,379 853,410
Net Operating Activity 64,854$ 42,211$ 36,323$ 66,378$
Long-term Investment Activities 224,314 109,288 (60,933) 233,577
Other non-operating activity (74,392) (40,240) (124,282) (51,572)
Net Non-Operating activity 149,922$ 69,048$ (185,215)$ 182,005$
Change in Net Assets 214,776$ 111,259$ (148,892)$ 248,383$
FINANCIAL POSITION HIGHLIGHTS
Cash and cash equivalents 180,828$ 151,100$ 133,905$ 105,900$
Operating investments, at market 128,699 112,618 87,304 77,914
Receivables 204,542 194,157 171,807 183,870
Investments (held for long-term purposes) 1,384,953 1,266,661 1,229,017 1,321,428
Funds held in trust by others 340,275 305,682 285,756 297,768
Property, plant, equipment, and books, net of depreciation 735,649 724,547 730,637 745,260
Prepaid expenses and other assets 6,769 7,448 6,979 8,424
Total Assets 2,981,715$ 2,762,213$ 2,645,405$ 2,740,564$
Total Liabilities 831,031$ 826,305$ 820,756$ 767,023$
Total Net Assets 2,150,684$ 1,935,908$ 1,824,649$ 1,973,541$
OTHER FINANCIAL INFORMATION
Net Investments (including FHBO), at fair value 1,853,927$ 1,684,961$ 1,602,077$ 1,697,110$
Investments payout in support of operations 78,166$ 74,499$ 74,159$ 72,536$
Total gifts and pledges (attainment) 151,639$ 145,908$ 138,362$ 126,211$
Total gifts - cash basis 124,857$ 94,529$ 91,763$ 86,189$
STUDENTS
Enrollment*
Undergraduate 4,572 4,302 3,935 4,132
Graduate 5,049 4,957 4,879 4,806
* Enrollment for fall semester of fiscal year in FTEs
8 | R E P O R T O F I N D E P E N D E N T A U D I T O R S
REPORT OF INDEPENDENT AUDITORS
Independent Auditor’s Report
To the Board of Trustees
Case Western Reserve University:
We have audited the accompanying consolidated financial statements of Case Western Reserve University
(“University”), which comprise the consolidated statement of financial position as of June 30, 2014 and the
related consolidated statements of activities and of cash flows for the year then ended.
Management’s Responsibility for the Financial Statements
Management is responsible for the preparation and fair presentation of the consolidated financial statements in
accordance with accounting principles generally accepted in the United States of America; this includes the
design, implementation and maintenance of internal control relevant to the preparation and fair presentation of
consolidated financial statements that are free from material misstatement, whether due to fraud or error.
Auditor’s Responsibility
Our responsibility is to express an opinion on the consolidated financial statements based on our audit. We
conducted our audit in accordance with auditing standards generally accepted in the United States of America.
Those standards require that we plan and perform the audit to obtain reasonable assurance about whether the
consolidated financial statements are free from material misstatement.
An audit involves performing procedures to obtain audit evidence about the amounts and disclosures in the
consolidated financial statements. The procedures selected depend on our judgment, including the assessment
of the risks of material misstatement of the consolidated financial statements, whether due to fraud or error. In
making those risk assessments, we consider internal control relevant to the University’s preparation and fair
presentation of the consolidated financial statements in order to design audit procedures that are appropriate
in the circumstances, but not for the purpose of expressing an opinion on the effectiveness of the University’s
internal control. Accordingly, we express no such opinion. An audit also includes evaluating the
appropriateness of accounting policies used and the reasonableness of significant accounting estimates made
by management, as well as evaluating the overall presentation of the consolidated financial statements. We
believe that the audit evidence we have obtained is sufficient and appropriate to provide a basis for our audit
opinion.
PricewaterhouseCoopers LLP, 200 Public Square, 18th Floor, Cleveland, OH 44114-2301 T: (216) 875 3000, F: (216) 566 7846, www.pwc.com/us

C A S E W E S T E R N R E S E R V E U N I V E R S I T Y F Y 1 4 F I N A N C I A L R E P O R T | 9
Opinion
In our opinion, the consolidated financial statements referred to above present fairly, in all material respects,
the financial position of Case Western Reserve University at June 30, 2014, and the changes in their net assets
and their cash flows for the year then ended in accordance with accounting principles generally accepted in the
United States of America.
Other Matters
We have previously audited Case Western Reserve University’s 2013 financial statements, and we expressed an
unmodified audit opinion on those audited financial statements in our report dated October 5, 2013. In our
opinion, the summarized comparative information presented herein as of and for the year ended June 30, 2013
is consistent, in all material respects, with the audited financial statements from which it has been derived.
October 11, 2014

1 0 | F I N A N C I A L S T A T E M E N T S
CONSOLIDATED STATEMENTS OF FINANCIAL POSITION
In thousands of dollars 2014 2013
ASSETS
Cash and cash equivalents $ 180,828 $ 151,100
Operating investments, at market 128,699 112,618
Accounts and loans receivable, net 107,979 100,734
Pledges receivable, net 96,563 93,423
Prepaid expenses and other assets 6,769 7,448
Investments, held for long-term purposes 1,384,953 1,266,661
Funds held in trust by others 340,275 305,682
Property, plant, equipment and books, net 735,649 724,547
TOTAL ASSETS $ 2,981,715 $ 2,762,213
LIABILITIES AND NET ASSETS
LIABILITIES
Accounts payable and accrued expenses $ 59,582 $ 57,116
Deferred income and other liabilities 54,572 53,605
Annuities payable 41,105 41,550
Refundable advances 4,898 7,541
Accrued pension liability 55,841 40,778
Notes and bonds payable 588,948 601,980
Refundable federal student loans 26,085 23,735
TOTAL LIABILITIES $ 831,031 $ 826,305
NET ASSETS
Unrestricted $ 182,867 $ 164,526
Temporarily restricted 988,939 845,028
Permanently restricted 978,878 926,354
TOTAL NET ASSETS $ 2,150,684 $ 1,935,908
TOTAL LIABILITIES AND NET ASSETS $ 2,981,715 $ 2,762,213
The accompanying notes are an integral part of the consolidated financial statements.
For the year ended
June 30

C A S E W E S T E R N R E S E R V E U N I V E R S I T Y F Y 1 4 F I N A N C I A L R E P O R T | 11
CONSOLIDATED STATEMENT OF ACTIVITIES with summarized financial information for the year ended June 30, 2013
In thousands of dollars Unrestricted
Temporarily
Restricted
Permanently
Restricted 2014 2013
OPERATING REVENUES
Student tuition and fees 368,739$ 368,739$ 346,792$
Less: Student aid (150,257) (150,257) (137,534)
218,482 218,482 209,258
Investment returns distributed for operations 63,309 63,309 60,568
FHBO returns distributed 14,857 14,857 13,931
Investment returns on operating investments 20,393 20,393 13,642
Grants and contracts 249,232 249,232 252,854
CCLCM grants and contracts 82,996 82,996 91,316
Gifts and pledges 25,904 46,073$ 13,260$ 85,237 77,498
State of Ohio appropriation 2,773 2,773 2,758
Facilities and administrative cost recovery 72,495 72,495 76,196
Organized activities 12,907 12,907 13,542
Other sources 41,012 580 41,592 38,362
Auxiliary services - students 50,122 50,122 45,330
Auxiliary services - other 11,897 11,897 12,920
Net assets released from restrictions 29,204 (28,717) (487) - -
TOTAL OPERATING REVENUES 895,583$ 17,356$ 13,353$ 926,292$ 908,175$
OPERATING EXPENSES
Instructional 290,341 290,341 287,539
Sponsored research and training 248,959 248,959 257,272
Other sponsored projects 28,893 28,893 25,834
CCLCM research and training 82,996 82,996 91,316
Libraries 22,549 22,549 22,466
Student services 24,063 24,063 23,304
University services 94,016 94,016 92,230
Auxiliary services - students 55,021 55,021 50,342
Auxiliary services - other 14,600 14,600 15,661
TOTAL OPERATING EXPENSES 861,438$ -$ -$ 861,438$ 865,964$
NET OPERATING ACTIVITY 34,145$ 17,356$ 13,353$ 64,854$ 42,211$
NON-OPERATING ACTIVITIES
Long-term investment activities
Investment (loss) income (1,211)$ 54,442$ 6,030$ 59,261$ 28,965$
Net appreciation 17,020 110,791 37,242 165,053 80,323
Total long-term investment activities 15,809 165,233 43,272 224,314 109,288
Long-term investment income and gains distributed
for operations (63,309) (63,309) (60,568)
Change in liabilities due under life-income agreements (3,633) (3,633) (3,492)
Loss on disposal of plant assets (438) (438) (3,144)
Pension plan changes other than periodic benefit costs (7,012) (7,012) 26,964
Net assets released from restrictions 39,146 (38,678) (468) - -
NET NON-OPERATING ACTIVITY (15,804)$ 126,555$ 39,171$ 149,922$ 69,048$
CHANGE IN NET ASSETS 18,341$ 143,911$ 52,524$ 214,776$ 111,259$
Beginning Net Assets 164,526 845,028 926,354 1,935,908 1,824,649
ENDING NET ASSETS 182,867$ 988,939$ 978,878$ 2,150,684$ 1,935,908$
The accompanying notes are an integral part of the consolidated financial statements.
June 30
For the year ended

1 2 | F I N A N C I A L S T A T E M E N T S
CONSOLIDATED STATEMENTS OF CASH FLOW
In thousands of dollars 2014 2013
$ 214,776 $ 111,259
61,383 62,169
Amortization of bond issuance costs 585 125
Amortization of bond premiums (3,095) (1,504)
Increase in capital appreciation notes 124 602
(212,331) (105,098)
3,633 3,492
(2,284) (59)
438 3,144
Contributions restricted for long-term investment (9,885) (14,685)
(Increase) decrease in accounts and loans receivable, net (5,940) 1,974
(3,140) (24,297)
Decrease (increase) in prepaid expenses and other assets 94 (593)
(34,593) (18,475)
658 (10,356)
967 (7,515)
(2,643) 2,093
15,063 (22,514)
NET CASH PROVIDED BY (USED FOR) OPERATING ACTIVITIES $ 23,810 $ (20,238)
Student loans
$ 6,606 $ 6,859
(7,911) (6,886)
2,865,863 2,009,310
(2,787,905) (1,968,622)
265 316
(69,095) (58,383)
NET CASH PROVIDED BY (USED FOR) INVESTING ACTIVITIES $ 7,823 $ (17,406)
$ 2,350 $ 646
3,143 11,733
6,742 2,952
Proceeds from short-term debt 60,000 45,000
Repayment of short-term debt (45,000) (20,000)
Proceeds from commercial paper - 27,000
Repayment of commercial paper (11,000) -
114,985 7,256
(129,046) (16,352)
373 291
(4,452) (3,687)
NET CASH (USED FOR) PROVIDED BY FINANCING ACTIVITIES $ (1,905) $ 54,839
NET INCREASE IN CASH AND CASH EQUIVALENTS $ 29,728 $ 17,195
151,100 133,905
CASH AND CASH EQUIVALENTS, END OF YEAR $ 180,828 $ 151,100
SUPPLEMENTAL DATA:
Interest paid in cash $ 13,282 $ 14,657
Construction in progress payments included in accounts payable 4,998 3,190
The accompanying notes are an integral part of the consolidated financial statements.
Proceeds from the sale of investments received as gifts
Repayment of notes and bonds payable
Cash and cash equivalents, beginning of year
For the year ended
June 30
Proceeds from notes and bonds payable
Increase to annuities payable resulting from new gifts
Decrease to annuities payable resulting from payments
Proceeds from the sale of plant assets
Purchases of property, plant, equipment and books
CASH FLOWS FROM FINANCING ACTIVITIES
Increase in federal advances for student loans
Contributions restricted for long-term investment
CASH FLOWS FROM INVESTING ACTIVITIES
Collected
Issued
Proceeds from the sale of investments
Purchase of investments
Increase in pledges receivable, net
Increase in funds held in trust by others
Increase (decrease) in accounts payable and accrued expenses
Increase (decrease) in deferred income and other liabilities
(Decrease) increase in refundable advances
Increase (decrease) in accrued pension liability
Loss on disposal of plant assets
CASH FLOWS FROM OPERATING ACTIVITIES
Change in net assets
Adjustments to reconcile change in net assets to net cash provided by (used for) operating activities:
Depreciation
Realized and unrealized net gains on investments
Increase to annuities payable resulting from actuarial adjustments
Gifts of property and equipment

C A S E W E S T E R N R E S E R V E U N I V E R S I T Y F Y 1 4 F I N A N C I A L R E P O R T | 13
1. SUMMARY OF SIGNIFICANT ACCOUNTING POLICIES
Basis of Presentation
Case Western Reserve University (“the University”) is an Ohio
not-for-profit corporation that operates a private research
university in Cleveland, Ohio. The consolidated financial
statements of the University as of June 30, 2014, and for the
year then ended, as well as summarized information for the
year ended June 30, 2013, have been prepared in accordance
with accounting principles generally accepted in the United
States of America. Accordingly, the accompanying
consolidated financial statements have been prepared on the
accrual basis of accounting and include the accounts of the
University and all wholly-owned subsidiaries.
The University wholly owns two subsidiaries. Triangle
Residential LP is a limited partnership formed in 2005 that
owns and operates two apartment buildings and a parking
garage located in the Ford-Euclid-Mayfield Road area. The
University is the sole limited partner. The general partner is
Triangle Residential LLC, also a wholly-owned subsidiary of the
University, formed in 2005. All material transactions between
the University and its subsidiaries have been eliminated.
Net Asset Categories
Standards for external financial reporting by not-for-profit
organizations require that resources be classified for reporting
purposes into three net asset categories according to donor-
imposed restrictions:
UNRESTRICTED net assets are available for any purpose
consistent with the University’s mission. Unrestricted net
assets and related activity include the following:
All revenues traditionally classified as unrestricted
resources of the University, including tuition and fees,
unrestricted gifts, investment returns on unrestricted
funds designated to function as endowment, recovery
of facility and administrative costs from grants and
contracts, and auxiliary services revenues
Revenues related to sponsored research and other
sponsored program agreements which are considered
exchange transactions
Unrestricted funds functioning similar to endowment
and related investment returns
Gifts with donor-imposed restrictions, if the restriction
is anticipated to be met within the current fiscal year
of the University
Investments in plant assets
All expenses of the University
TEMPORARILY RESTRICTED net assets include investment
returns from endowments and gifts for which donor-imposed
restrictions have not been met. This restriction on temporarily
restricted endowment returns (income and realized and
unrealized gains and losses) is released when appropriations
are distributed for use and the funds have been spent. The
category also includes pledges receivable and life-income gifts
for which the ultimate purpose of the proceeds is not
permanently restricted.
PERMANENTLY RESTRICTED net assets include gifts, trusts and
pledges on which donors have imposed the restriction that the
corpus is maintained in perpetuity and only the investment
returns be made available for program operations. In the case
of trusts, gains and losses are added to the gift amount. Gifts
restricted by donors to provide loans to students are also
included in permanently restricted net assets.
Expirations of temporary restrictions on net assets are
reported as reclassifications between the applicable classes of
net assets. Donor required matching from University funds
and donor release or clarification of restrictions is also
included in this category.
The Financial Accounting Standards Board (“FASB”) issued
Accounting Standards Codification (“ASC”) 958, “Not for Profit
Entities,” in August 2008. The standard provides guidance on
the net asset classification of donor-restricted endowment
funds for a not-for-profit organization that is subject to an
enacted version of the Uniform Prudent Management of
Institutional Funds Act (“UPMIFA”), and expanded disclosures
about an organization's endowment (both donor-restricted
and board-designated funds). The University’s Board of
Trustees (“the Board”) has interpreted UPMIFA as requiring the
preservation of the original gift as of the gift date of the donor
restricted endowment funds absent explicit donor stipulation
to the contrary. As a result of this interpretation, the University

1 4 | N O T E S T O T H E F I N A N C I A L S T A T E M E N T S – i n t h o u sa n d s o f d o l l a r s
classifies as permanently restricted net assets, (a) the original
value of initial gifts donated to the permanent endowment, (b)
the original value of subsequent gifts to the permanent
endowment, and (c) accumulations to the permanent
endowment made in accordance with the direction of the
applicable donor gift instrument at the time the accumulation
is added to the fund. The remaining portion of the donor-
restricted endowment fund that is not classified as
permanently restricted net assets is classified as temporarily
restricted net assets until those amounts are appropriated and
expended by the University in a manner consistent with the
standard of prudence prescribed by UPMIFA.
Contributions
Contributions, including unconditional pledges to give and
irrevocable trusts held by others with the University as the
beneficiary, are recognized as revenues in the period received
or promised. They are classified as unrestricted, temporarily
restricted, or permanently restricted net assets depending
upon the donor’s intent.
Contributions restricted for the acquisition of land, buildings
and equipment are reported as temporarily restricted
revenues. These contributions are reclassified to unrestricted
net assets when the assets are placed in service. Promises to
give that are subject to donor-imposed stipulations that the
corpus be maintained in perpetuity are recognized as increases
in permanently restricted net assets.
Conditional promises to give are not recognized until the
conditions on which they depend are substantially met. Gifts
whose restrictions are met in the same fiscal year in which they
are received are reported with unrestricted contribution
revenues. Contributions of assets other than cash are
reported at their estimated fair value at the date of gift.
Contributions scheduled to be received after one year are
discounted using a market rate (Note 3).
Grants and Contracts (Government and Private)
Revenues from government and private grants and contracts
are recognized as earned in accordance with the terms of the
grant or contract. Any government payment received before it
has been expended is recorded as a refundable advance.
Projects funded by government grants that incur expenses
prior to payment receipt are recorded as revenue with a
corresponding receivable.
Investment Returns on Operating Investments
The University has invested excess operating funds and certain
Board-designated funds with the University’s investment
pool. The operating funds are invested alongside other funds
and receive a pro-rata portion of income, expenses, gains, and
losses of the pool.
Cash and Cash Equivalents
The University considers all highly liquid investments with an
original maturity of 90 days or fewer when purchased as cash
and cash equivalents, except those amounts managed by
investment managers as part of the investment pool that do
not belong to operations, or unspent bond proceeds, which are
classified as investments. The University maintains operating
cash and reserves for replacement balances in financial
institutions which, from time to time, may exceed federally
insured limits. The University periodically assesses the
financial condition of these institutions and believes that the
risk of loss is minimal.
Operating Investments, at Market
Operating investments include all other current investments
with original maturities greater than 90 days that are used to
support operations. These investments may include
obligations of triple A rated banks, various United States
Government agencies, other investments, and internal
operating funds invested in the University’s investment pool.
Although the pool primarily invests in mid to long term
investments, the pool maintains a sufficient investment mix
that allows operating assets to be liquidated upon demand.
Investments
Investments are made within guidelines authorized by the
Board. Investments are initially recorded at cost at date of
acquisition or fair value at date of donation in the case of gifts.
Ownership of marketable securities is recognized as of the
trade date. Endowment returns are calculated net of internal
and external investment management expenses.

C A S E W E S T E R N R E S E R V E U N I V E R S I T Y F Y 1 4 F I N A N C I A L R E P O R T | 15
Investments are stated at fair value as defined by ASC 820,
“Fair Value Measurements and Disclosures.” Fair value is
defined under ASC 820 as the exchange price that would be
received for an asset or paid to transfer a liability, i.e., an exit
price, in the principal or most advantageous market for the
asset or liability in an orderly transaction between market
participants on the measurement date.
The fair value of all debt and equity securities with readily
determinable fair values are based on quotations obtained
from national securities exchanges. The alternative
investments, which are not readily marketable, are carried at
estimated fair values as provided by the investment managers.
The University reviews and evaluates the values provided by
the investment managers and agrees with the valuation
methods and assumptions used in determining the fair value
of the alternative investments. Those estimated fair values
may differ significantly from the values that would have been
used had a ready market for these securities existed.
Realized gains and losses on investments are included in
investment income. Average cost is generally used to
determine gains or losses on securities sold. Unrealized
changes in the fair value of investments are shown as net
unrealized appreciation or depreciation.
The following describes the hierarchy of inputs used to
measure fair value and the primary valuation methodologies
used by the University for financial instruments measured at
fair value on a recurring basis (Note 6). The three levels of
inputs are as follows:
Level 1 — Quoted unadjusted prices in active markets for
identical assets or liabilities. An active market is one in
which transactions occur with sufficient frequency and
volume to produce pricing information on an ongoing basis.
Market price data are generally obtained from exchange or
dealer markets.
Level 2 — Pricing inputs other than Level 1 that are
observable, either directly or indirectly, such as quoted
prices for similar assets or liabilities; quoted prices in
markets that are not active; or other inputs that are
observable or can be corroborated by observable market
data for substantially the same term of the assets or
liabilities. Inputs are obtained from various sources
including market participants, dealers and brokers.
Level 3 — Unobservable inputs that are supported by little
or no market activity and that are significant to the fair
value of the assets or liabilities.
Collections
The University’s collections of historically significant artifacts,
scientific specimens, and art objects are held for education,
research, scientific inquiry, and public exhibition. They are
neither disposed of for financial gain nor encumbered in any
manner. Accordingly, their value is not reflected in the
University’s consolidated financial statements.
Funds Held in Trust by Others
Funds held in trust by others are assets held and administered
by outside trustees from which the University derives income
or residual interest. Funds held in trust by others are reported
at their fair value as of June 30, 2014 and 2013, which
approximates the present value of the future income flows
from these funds.
Income received from funds held in trust by others is classified
as temporarily restricted net assets until those amounts are
appropriated and expended by the University. Income
appropriated within the same year earned/received is
classified as unrestricted. Unrealized changes in the fair value
of investments are shown as net unrealized appreciation or
depreciation in permanently restricted net assets.
Fixed Assets
When capital assets are sold or disposed, the carrying value of
such assets and any accumulated depreciation are removed
from the asset accounts. Any resulting gain or loss on disposal
is recognized in the non-operating portion of the statement of
activities.
Expenditures for construction in progress are capitalized as
incurred and depreciated when placed into service. All
identifiable direct costs including other costs incurred to ready
the asset for its intended use are included in the cost of the
project. The University capitalizes interest on borrowings to
1 6 | N O T E S T O T H E F I N A N C I A L S T A T E M E N T S – i n t h o u sa n d s o f d o l l a r s
finance facilities, net of any investment income earned through
the temporary investment of project borrowings, during
construction until the project has been substantially
completed.
Asset Retirement Obligations
The University accounts for asset retirement obligations in
accordance with ASC 410, “Asset Retirement Environmental
Obligations.” The University accrues for asset retirement
obligations in the period in which they are incurred if sufficient
information is available to reasonably estimate the fair value of
the obligation. Over time, the liability is accreted to its
settlement value. Upon settlement of the liability, the
University will recognize a gain or loss for any difference
between the settlement amount and liability recorded.
Allocation of Certain Expenses
The consolidated statement of activities presents expenses by
function. Some expenses — such as depreciation, amortization,
and expenses related to the operation of the physical plant —
are allocated by square footage. Interest expense is allocated
to the functions that derive the greatest benefit from the
facilities financed.
Retirement Plans
The University accounts for its defined benefit postretirement
plan in accordance with ASC 715 “Compensation - Retirement
Plans.” The University recognizes the overfunded or
underfunded status of a defined benefit postretirement plan
as an asset or liability in its consolidated statement of financial
position in the year in which the change occurs, with an
offsetting impact to unrestricted net assets.
Use of Estimates
Financial statements using accounting principles generally
accepted in the United States of America rely on estimates. At
June 30, management makes certain estimates and
assumptions, which affect assets and liabilities, disclosures of
contingent assets and liabilities, and reported revenues and
expenses during the period. Actual results may differ from
these estimates.
Comparative Information
The consolidated statement of activities includes prior year
summarized comparative information in total, but not by net
asset category. Such information does not include enough
detail to constitute a presentation in conformity with
accounting principles generally accepted in the United States of
America. Accordingly, such information should be read in
conjunction with the University’s consolidated financial
statements for the year ending June 30, 2013, from which it
was derived.
Income Taxes
The University is exempt from federal income tax to the extent
provided under section 501(c) (3) of the Internal Revenue Code.
The University is classified as an organization that is not a
private foundation under section 509(a) of the Internal
Revenue Code, and as such, gifts to the University qualify for
deduction as charitable contributions. The University is exempt
from federal income tax; however, it is required to pay federal
income tax on unrelated business income. The University did
not have any material income tax liabilities for the years ended
June 30, 2014 and 2013. ASC 740, “Income Taxes,” prescribes a
recognition threshold and measurement requirements for
financial statement recognition and measurement of a tax
position taken or expected to be taken in a tax return. In
addition, ASC 740 provides guidance on recognition,
classification and disclosure requirements for uncertain tax
provisions. The University has no financial reporting
requirements associated with ASC 740 for the years ended
June 30, 2014 and 2013.
New Pronouncements
In fiscal 2014 the University adopted the provisions of AU 2012-
05 – Statement of Cash Flows for Not-for-Profit entities
regarding donated securities and retroactively applied the
provisions to prior years. The effect of the changes were not
material.
Reclassifications
Certain amounts in the 2013 consolidated financial statements
have been reclassified to conform to the 2014 presentation.

C A S E W E S T E R N R E S E R V E U N I V E R S I T Y F Y 1 4 F I N A N C I A L R E P O R T | 17
2. ACCOUNTS AND LOANS RECEIVABLE
Accounts and loans receivable of the University at June 30,
2014 and 2013 were as follows:
Management regularly assesses the adequacy of the allowance
for doubtful accounts by performing ongoing evaluations of
the various components of the accounts receivable and
student loan portfolios, including such factors as the differing
economic risks associated with each category, the financial
condition of specific borrowers, the economic environment in
which the borrowers operate, the level of delinquent loans,
3. PLEDGES RECEIVABLE
Unconditional promises to give are included in the
consolidated financial statements as pledges receivable and
revenue of the appropriate net asset category. Multi-year
pledges are recorded after discounting based on the market
rate to the present value of expected future cash flows. The
discount rate utilized for fiscal 2014 is 5%.
Unconditional promises to give at June 30, 2014 and 2013, are
expected to be realized in the following periods:
Management follows a similar approach as described in Note 2
for accounts and loans receivable in evaluating the adequacy
of the allowance for doubtful accounts for pledges receivable.
and the past history of the various borrowers and the
University.
Factors also considered by management when performing its
assessment, in addition to general economic conditions and
the other factors described above, included, but were not
limited to, a detailed review of the aging of the various
receivables and loans, and a review of the default rate by loan
category in comparison to prior years. The level of the
allowance is adjusted based on the results of management’s
analysis.
Management considers the allowance for doubtful accounts
to be prudent and reasonable. Furthermore, the University’s
allowance is general in nature and is available to
absorb losses from any loan category. Management believes
that the allowance for doubtful accounts at June 30, 2014 is
adequate to absorb credit losses inherent in the portfolio as of
that date.
Management considers the allowance for doubtful accounts to
be prudent and reasonable. Management believes that the
allowance for doubtbul accounts at June 30, 2014 is adequate
to absorb any uncollectible pledges as of that date.
Pledges receivable at June 30, 2014 and 2013 had the following
restrictions:
Uncollectible pledges totaling $3,169 (2014) and $1,122 (2013)
were written off against the allowance for uncollectible
pledges. The University had conditional pledge commitments
totaling $34,940 at June 30, 2014.
2014 2013
ACCOUNTS RECEIVABLE, NET
Grants, contracts and others 52,825$ 46,273$
Students 2,814 2,961
STUDENT LOANS, NET 52,340 51,500
ACCOUNTS AND LOANS RECEIVABLE, NET 107,979$ 100,734$
Allowances for doubtful accounts:
Accounts receivable 3,915$ 3,690$
Loans receivable 2,107$ 2,067$
2014 2013
In one year or less 16,781$ 14,190$
Between one year and five years 76,820 76,374
More than five years 19,026 17,485
112,627 108,049
Less: Discount (8,278) (8,278)
Less: Allowance (7,786) (6,348)
TOTAL PLEDGES RECEIVABLE, NET 96,563$ 93,423$
2014 2013
Department programs and activities 39,313$ 42,522$
Endowments for scholarships and
department programs and activities 25,248 21,584
Building construction 32,002 29,317
TOTAL PLEDGES RECEIVABLE, NET 96,563$ 93,423$

1 8 | N O T E S T O T H E F I N A N C I A L S T A T E M E N T S – i n t h o u sa n d s o f d o l l a r s
4. LONG TERM INVESTMENTS
The University holds long term investments for permanently
restricted endowment funds, donor-restricted funds, annuity
assets, Board-designated funds and excess operating assets
that are able to be invested in longer term investments. The
University invests through traditional investments as well as
operating an investment pool that works similar to a mutual
fund (Note 5). The University’s long term investments at June
30, 2014 and 2013 were as follows:
Investment returns shown on the statement of activites are netted against investment management fees of $14,781 (2014) and
$14,419 (2013). The investments were held for the following purposes:
2014 2013
Cash and cash equivalents $ 14,935 $ 88,581
Domestic stocks 76,055 54,307
International securities 40,150 37,069
Global securities 117,511 47,706
Bonds
Government and municipal 6,885 17,079
Corporate 23,549 17,399
Mutual funds 261,786 142,592
Derivatives 5,109 8,318
Limited partnerships and other
Venture capital 100,350 86,323
Private equity 287,838 262,553
Real estate 102,119 94,825
Hedge funds 432,033 481,585
Other 45,252 40,862
Equity real estate 80 80
TOTAL INVESTMENTS $ 1,513,652 $ 1,379,279
2014 2013
Operating investments, at market $ 128,699 $ 112,618
Investments, held for long term
purposes 1,384,953 1,266,661
TOTAL INVESTMENTS $ 1,513,652 $ 1,379,279
2014 2013
Endowment $ 1,089,658 $ 989,475
Donor restricted funds 305,687 272,331
University investments 55,142 58,039
Annuities 53,459 51,177
Funds held for the benefit of others 9,706 8,257
TOTAL INVESTMENTS $ 1,513,652 $ 1,379,279

C A S E W E S T E R N R E S E R V E U N I V E R S I T Y F Y 1 4 F I N A N C I A L R E P O R T | 19
5. ENDOWMENT AND SIMILAR FUNDS
Endowment Funds
The purpose of endowment funds is to generate in
perpetuity revenue to support specific activities or for
general institutional use. Endowments represent only
those net assets that are under the control of the
University. Gift annuities, interests in funds held in trust by
others and pledges designated for the endowment but not
yet received are not considered components of the
endowment.
The state of Ohio has enacted legislation that incorporates
the provisions outlined in the Uniform Prudent
Management of Institutional Funds Act (“UPMIFA”). UPMIFA
stipulates that unless directed otherwise in the gift
instrument, donor-restricted assets in an endowment fund
are restricted assets until appropriated for expenditure by
the institution. Accordingly, the following items are
recorded as permanently restricted net assets:
The original value of initial gifts donated to the
permanent endowment
The original value of subsequent gifts to the
permanent endowment
For those endowment funds with donor-specified
reinvestment provisions, accumulations to the
permanent endowment made in accordance with
the gift instrument at the time the accumulation is
added to the fund.
The remaining portion of donor-restricted endowment
funds that are not classified in permanently restricted net
assets is classified as temporarily restricted net assets until
those amounts are appropriated and spent in accordance
with the endowment purpose by the University.
Similar Funds
The University has made the decision to co-invest and treat
in a similar fashion as endowment funds, certain funds that
have been purpose-restricted by donors. These funds
were not given to the University with the understanding
that the gift amount would be maintained in perpetuity;
however, the Board has elected to treat these funds in the
same fashion as an endowment fund. Accordingly, the
Board, at its option, may elect to change that treatment
and spend these funds in accordance with donor wishes
without the constraints of the University endowment
spending formula. These funds follow the same rules as
above; however, no portion is permanently restricted.
The breakdown of these classifcations are: U
Investment Pool
The Board’s interpretation of its fiduciary responsibilities for
endowment and similar funds is to preserve intergenerational
equity to the extent possible. This principle holds that future
beneficiaries should receive at least the same level of economic
support that the current generation enjoys. To that end,
investment goals are formulated to earn returns over the long-
term that equal or exceed the Board-approved distribution
rates plus the impacts of inflation. The University’s endowment
and similar funds are invested in a broadly diversified portfolio
designed to produce long-term rates of return that sustain or
increase the real spending contribution from endowed and
similar assets and to mitigate downturns in a single sector.
Unless otherwise directed in the gift instrument, both
endowment and similar funds are pooled for efficient
investment purposes.
Temporarily Permanently
Unrestricted Restricted Restricted 2014 2013
Donor restricted endowment funds (9,156)$ 538,245$ 560,569$ 1,089,658$ 989,475$
Donor purpose restricted funds 290,857 290,857 266,604
TOTAL ENDOWMENT AND SIMILAR FUNDS (9,156)$ 829,102$ 560,569$ 1,380,515$ 1,256,079$
Total

2 0 | N O T E S T O T H E F I N A N C I A L S T A T E M E N T S – i n t h o u sa n d s o f d o l l a r s
The pool is accounted for on a dollarized method of accounting
similar to a money market fund and accounted for on an
account basis. The total investment return for the pooled
investments, net of external manager fees, approximated
15.96% (2014) and 7.52% (2013).
Spending Policy
The Board has approved an endowment spending policy for
pooled investments based on a hybrid formula. The objective
of this two-pronged approach is to provide support for
operations, preserve intergenerational equity, and insulate
programming supported by endowment and similar funds
from short-term fluctuations in the investment markets. The
two components are:
A constant growth component which seeks to provide
growth in annual spending equal to the rate of
academic inflation as measured by the Higher
Education Price Index
A market value component based on 5% of the
average of the three previous calendar year-end
market values
Specific appropriation for expenditure of funds under the
policy occurs each spring when the Board approves the
operating budget for the following year. The fiscal 2014 and
2013 pooled endowment and similar funds spending allocation
approximated 5.04% and 5.27% respectively of beginning
market value. The total amount allocated was $62,216 and
$64,443, respectively.
While the policy provides guidance for the level of spending
permitted (allocation), the actual spending will vary from the
spending allocation based on the timing of actual
expenditures. Funds are transferred from the investment pool
to the University’s operating account after they have been
spent in accordance with the endowment and similar funds
requirements. The actual movement of cash and investments
between the investment pool and operating accounts occurs
on a periodic basis as determined by the University and its
processes to maintain the proper balance between liquidity
and the remaining invested.
For years where actual investment return exceeds actual
approved spending, the difference remains in temporarily
restricted net assets; years in which the actual endowment and
similar funds return is less than distributions under the policy,
the shortfall is covered by realized returns from prior years.
Both fiscal years 2014 and 2013 pooled endowment and
similar funds distribution were funded from a combination of
current year investment income and prior year accumulated
realized gains.
In addition to the general distribution described above, the
Board has authorized a temporary supplemental distribution
of previously reinvested income and realized appreciation to
support certain development-related activities. This
distribution, which is slated to phase out by 2015, totaled
$6,500 in 2014 and $7,200 in 2013.
Changes in endowment and similar funds net assets for fiscal
year 2014 are as follows:
Temporarily Permanently
Unrestricted Restricted Restricted 2014 2013
Endowment and similar funds
net assets, beginning of year $ (18,154) $ 727,868 $ 546,365 $ 1,256,079 $ 1,223,893
Investment income 53,982 53,982 16,246
Realized and unrealized gains 117,589 117,589 63,936
TOTAL INVESTMENT RETURN 171,571 171,571 80,182
Contributions 1,970 14,243 16,213 18,123
Current year withdrawals (39) (39) (5,924)
Current year expenditures (63,309) (63,309) (60,195)
Reclassification of deficits
in donor-designated funds 8,998 (8,998) - -
ENDOWMENT AND SIMILAR FUNDS
NET ASSETS, END OF YEAR
Total
$ (9,156) $ 829,102 $ 560,569 $ 1,256,079 $ 1,380,515

C A S E W E S T E R N R E S E R V E U N I V E R S I T Y F Y 1 4 F I N A N C I A L R E P O R T | 21
Occasionally, the fair market value of assets associated with
individual donor-restricted endowment funds falls below the
value of the original gift amounts. When deficits exist in these
funds, they are classified as a reduction of unrestricted net
assets. Deficits of this nature reported in unrestricted net
assets were $9,156 (2014) and $18,154 (2013). These deficits
resulted from unfavorable market fluctuations that occurred
after the investment of recently established endowments, and
authorized appropriation that was deemed prudent.
Of the amount classified as temporarily restricted endowment
net assets, $538,245 (2014) and $461,264 (2013) represented
the portion of perpetual endowment funds subject to time and
purpose restrictions under Ohio’s enacted version of UPMIFA.
6. FAIR VALUE MEASUREMENTS
Financial instruments carried at fair market value as of June 30, 2014 and 2013 by the ASC 820 valuation hierarchy are as follows:
June 30, 2014Quoted Prices
in Active
Markets
Significant
Other
Observable
Inputs
Significant
Unobservable
Inputs
(Level 1) (Level 2) (Level 3) Total
INVESTMENTS
Cash & cash equivalents 10,578$ 4,357$ 14,935$
Domestic stocks 19,575 980 55,500$ 76,055
International securities 4,856 35,294 40,150
Global securities 35,725 81,786 117,511
Bonds
Government and municipal 6,885 6,885
Corporate 6,130 17,419 23,549
Mutual funds 257,727 4,059 261,786
Derivatives 5,109 5,109
Limited partnerships and other
Venture capital 100,350 100,350
Private equity 287,838 287,838
Real estate 102,119 102,119
Hedge funds 97,350 334,683 432,033
Other 74 45,178 45,252
Equity real estate 80 80
TOTAL INVESTMENTS 287,880$ 165,525$ 1,060,247$ 1,513,652$
FUNDS HELD IN TRUST BY OTHERS -$ -$ 340,275$ 340,275$
PENSION PLAN ASSETS
Cash & cash equivalents 276$ 276$
Mutual funds 55,085 8,602$ 63,687
Limited partnerships and Other
Hedge funds 77,684 77,684
Equity real estate 6,983$ 6,983
TOTAL PENSION PLAN ASSETS (Note 9) 55,361$ 86,286$ 6,983$ 148,630$
ASSETS AT FAIR VALUE 343,241$ 251,811$ 1,407,505$ 2,002,557$
Interest rate swaps payable -$ 22,817$ -$ 22,817$
LIABILITIES AT FAIR VALUE -$ 22,817$ -$ 22,817$

2 2 | N O T E S T O T H E F I N A N C I A L S T A T E M E N T S – i n t h o u sa n d s o f d o l l a r s
Level 3 Investment Information
Investments included in Level 3 consist primarily of the
University's ownership in alternative investments (principally
limited partnership interests in hedge funds, private equity,
real estate, real assets and other similar funds), beneficial
interests in funds held in trust by others, and portions of
The value of certain alternative investments
represents the ownership interest in the net asset
value of the respective partnership.
The fair values of the securities held by limited
partnerships that do not have readily determinable
fair values are determined by the general partner
June 30, 2013Quoted Prices
in Active
Markets
Significant
Other
Observable
Inputs
Significant
Unobservable
Inputs
(Level 1) (Level 2) (Level 3) Total
INVESTMENTS
Cash & cash equivalents 60,193$ 28,388$ 88,581$
Domestic stocks 1,388 18,736 34,183$ 54,307
International securities 10 13,334 23,725 37,069
Global securities 47,706 47,706
Bonds
Government and municipal 17,079 17,079
Corporate 17,399 17,399
Mutual funds 140,012 2,580 142,592
Derivatives 8,318 8,318
Limited partnerships and other
Venture capital 86,323 86,323
Private equity 262,553 262,553
Real estate 94,701 94,701
Hedge funds 78,328 403,257 481,585
Other 111 74 40,677 40,862
Equity real estate 124 80 204
TOTAL INVESTMENTS 201,838$ 184,236$ 993,205$ 1,379,279$
FUNDS HELD IN TRUST BY OTHERS -$ -$ 305,682$ 305,682$
PENSION PLAN ASSETS
Cash & cash equivalents 6,859$ 6,859$
Mutual funds 49,529 49,529
Limited partnerships and Other
Hedge funds 66,362$ 5,832$ 72,194
Other 490 490
Equity real estate 6,292 6,292
TOTAL PENSION PLAN ASSETS (Note 9) 56,388$ 66,362$ 12,614$ 135,364$
ASSETS AT FAIR VALUE 258,226$ 250,598$ 1,311,501$ 1,820,325$
Interest rate swaps payable -$ 25,058$ -$ 25,058$
LIABILITIES AT FAIR VALUE -$ 25,058$ -$ 25,058$
investments in the pension assets. Level 3 investments
are more difficult to value due to the following:
C A S E W E S T E R N R E S E R V E U N I V E R S I T Y F Y 1 4 F I N A N C I A L R E P O R T | 23
based on appraisals or other estimates that require
varying degrees of judgment.
If no public market consideration, the fair value is
determined by the general partner taking into
consideration, among other things, the cost of the
securities, prices of recent significant placements of
securities of the same issuer, subsequent
developments concerning the companies to which the
securities relate, or other estimates requiring varying
degrees of judgment. The University regularly reviews,
evaluates and performs significant due diligence
around these investments to ensure that the values
provided by the investment managers are appropriate
measures of fair value. The University agrees with the
valuations and assumptions used in determining the
fair value of these investments.
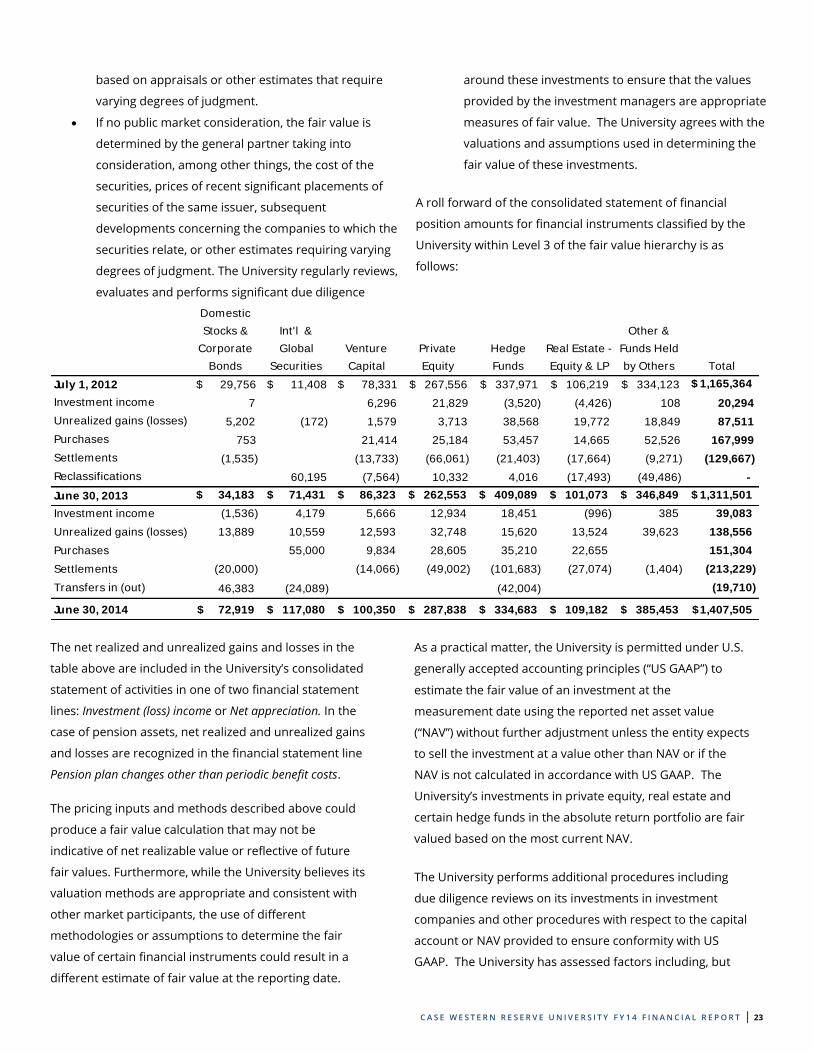
A roll forward of the consolidated statement of financial
position amounts for financial instruments classified by the
University within Level 3 of the fair value hierarchy is as
follows:
Domestic
Stocks &
Corporate
Bonds
Int'l &
Global
Securities
Venture
Capital
Private
Equity
Hedge
Funds
Real Estate -
Equity & LP
Other &
Funds Held
by Others Total
July 1, 2012 $ 29,756 $ 11,408 $ 78,331 $ 267,556 $ 337,971 $ 106,219 $ 334,123 1,165,364$
Investment income 7 6,296 21,829 (3,520) (4,426) 108 20,294
Unrealized gains (losses) 5,202 (172) 1,579 3,713 38,568 19,772 18,849 87,511
Purchases 753 21,414 25,184 53,457 14,665 52,526 167,999
Settlements (1,535) (13,733) (66,061) (21,403) (17,664) (9,271) (129,667)
Reclassifications 60,195 (7,564) 10,332 4,016 (17,493) (49,486) -
June 30, 2013 34,183$ 71,431$ 86,323$ 262,553$ 409,089$ 101,073$ 346,849$ 1,311,501$
Investment income (1,536) 4,179 5,666 12,934 18,451 (996) 385 39,083
Unrealized gains (losses) 13,889 10,559 12,593 32,748 15,620 13,524 39,623 138,556
Purchases 55,000 9,834 28,605 35,210 22,655 151,304
Settlements (20,000) (14,066) (49,002) (101,683) (27,074) (1,404) (213,229)
Transfers in (out) 46,383 (24,089) (42,004) (19,710)
June 30, 2014 109,182$ 385,453$ 1,407,505$ 72,919$ 117,080$ 100,350$ 287,838$ 334,683$
The net realized and unrealized gains and losses in the
table above are included in the University’s consolidated
statement of activities in one of two financial statement
lines: Investment (loss) income or Net appreciation. In the
case of pension assets, net realized and unrealized gains
and losses are recognized in the financial statement line
Pension plan changes other than periodic benefit costs.
The pricing inputs and methods described above could
produce a fair value calculation that may not be
indicative of net realizable value or reflective of future
fair values. Furthermore, while the University believes its
valuation methods are appropriate and consistent with
other market participants, the use of different
methodologies or assumptions to determine the fair
value of certain financial instruments could result in a
different estimate of fair value at the reporting date.
As a practical matter, the University is permitted under U.S.
generally accepted accounting principles (“US GAAP”) to
estimate the fair value of an investment at the
measurement date using the reported net asset value
(“NAV”) without further adjustment unless the entity expects
to sell the investment at a value other than NAV or if the
NAV is not calculated in accordance with US GAAP. The
University’s investments in private equity, real estate and
certain hedge funds in the absolute return portfolio are fair
valued based on the most current NAV.
The University performs additional procedures including
due diligence reviews on its investments in investment
companies and other procedures with respect to the capital
account or NAV provided to ensure conformity with US
GAAP. The University has assessed factors including, but

2 4 | N O T E S T O T H E F I N A N C I A L S T A T E M E N T S – i n t h o u sa n d s o f d o l l a r s
not limited to, managers’ compliance with the Fair Value
Measurement standard, price transparency at NAV at the
measurement date, and existence of certain redemption
restrictions at the measurement date.
The guidance also requires additional disclosures to enable
users of the financial statements to understand the nature and
risk of the University’s investments. Furthermore, investments
which can be redeemed at NAV by the University on the
measurement date or within 90 days are classified as Level 2.
Investments which cannot be redeemed on the measurement
date or in the near term are classified as Level 3.
The table below illustrates the fair value of the University’s level
3 investments and the commitments that have been made for
future purchases:
Category
Redemption
Notice Period Fair Value
Unfunded
Commitments
Domestic stocks (a) 30 - 90 days 55,500$
International securities (b) 30 - 90 days 35,294
Global securities (c) 30 - 90 days 81,786
Corporate bonds (d) 30 - 90 days 17,419
Limited partnerships and other
Venture capital (e) 100,350 34,983$
Private equity (f) 287,838 79,164
Real estate (g) 102,119 34,060
Hedge funds (h) 30 - 90 days 334,683 994
Other (i) 45,178
Equity real estate (j) 80
TOTAL 1,060,247$ 149,201$
Redemption Frequency
monthly, quarterly, annually
monthly, quarterly, annually
monthly, quarterly
monthly, quarterly
monthly, quarterly
(a) Domestic stocks include equity securities domiciled in the
United States. Fund liquidity is daily, monthly, quarterly,
semi-annual, annual, and up to a maximum period of three
years. Approximately 52% of domestic equity exposure is
accessible within one year or less, with all funds accessible
within three years.
(b) International securities include equity securities domiciled
in countries outside of the United States including developed
and emerging markets. Approximately 93% of the net asset
value is accessible within one year or less, with all funds
accessible within three years.
(c) Global securities includes equity securities domiciled in
both Domestic stocks and International securities.
Investments in this asset class have a mandate for global
securities worldwide. Approximately 91% of the net asset
value is accessible within one year or less, with all funds
accessible within three years.
(d) Corporate bonds include funds that invest in interests in
Senior Loans of US or non-US business entities. 1/3 of the
fund may be liquidated every 30 days.
(e) Venture capital includes several private equity funds that
invest primarily in technology, health care or clean
technology industries. While the portfolio is U.S. centric,
there are small allocations to companies in foreign
markets. The funds typically provide money and resources
to entrepreneurs to finance a start-up company or product,
with the hope that the company experiences exceptional
growth and therefore would produce a successful
investment. The funds invest at different stages of a
company’s growth, some very early and others at a later
stage where the company may already produce
revenues. The valuations for these investments have been
estimated using the managers’ fair market values, which
have been vetted to make sure they meet the ASC 820
guidelines. These investments can never be redeemed with
the funds. As these investments age in duration,
distributions will be received from these funds as the
underlying portfolio companies are sold in the market. It is
estimated that the underlying investments within the funds
would be fully liquidated over the next 7-12 years.
(f) Private equity includes several private equity funds that
invest across all industries. While the portfolio is U.S.
centric, there has been an increasingly larger allocation to

C A S E W E S T E R N R E S E R V E U N I V E R S I T Y F Y 1 4 F I N A N C I A L R E P O R T | 25
(h) Hedge funds include hedge fund investments across a
multitude of strategies including long/short equity, long/short
commodity, global macro, multi-strategy, event-driven, credit,
fund of hedge funds, and emerging markets. The vast majority
of these investments are U.S. based, but some may invest
internationally. Investment managers may make investment
decisions based on top down macroeconomic analysis or
bottom up company or theme specific analysis; managers may
shift portfolios from net long to net short positioning but on
balance tend to carry a net long exposure within their
portfolios. The estimated fair values of the investments are
received on a monthly basis from the fund administrators.
Final valuations are typically received around mid-month for
most funds but in some instances funds will report final
valuations on a quarterly basis in accordance with the
reporting period specified in the fund legal documents.
Fund liquidity varies across the hedge fund category from
monthly, quarterly, annually, and up to a maximum period
of three years. Approximately 81% of the net asset value in
this class is accessible within one year or less, with all funds
accessible within three years.
(i) Other includes various investments that do not fall within
the other categories listed. Examples would include
investments in timber and other liquid multi-asset strategy
investments.
(j) Equity real estate includes liquid real estate securities and
indices domiciled in both the United States and countries
outside of the United States including developed and emerging
markets.
Derivative Information
The use of financial derivative instruments is governed by the
University’s Investment Policy Statement, which is approved
and overseen by the Investment Committee of the Board. The
University assumes many risks as a result of its investment
decisions and investment holdings. Many risks are discussed in
the Investment Policy Statement:
Manager risk – the risk that a manager underperforms similar
managers, benchmarks, or appropriate indices.
Benchmark risk – the risk of harm caused by constructing,
selecting, or managing to an inappropriate benchmark.
Peer risk – the risk that one’s peers generate better investment
performance, thereby boosting the relative size of their
endowments and enhancing their competitive advantage.
Market risk – the risk that the value of an investment will
decrease due to market moves.
Interest rate risk – the risk that an investment’s value will change
due to a change in the absolute level of interest rates,
companies in foreign markets. The funds typically invest
capital into more mature companies for a minority or
majority of ownership and through operational and
financial expertise, generate a return of capital greater
than the original amount invested. The valuations for
these investments have been estimated using the
managers’ fair market values, which have been vetted to
make sure they meet the ASC 820 guidelines. These
investments can never be redeemed with the funds. As
these investments age in duration, distributions will be
received from these funds as the underlying portfolio
companies are sold in the market. It is estimated that the
underlying investments within the funds would be fully
liquidated over the next 7-12 years.
(g) Real estate includes private real estate funds that invest
primarily in the United States. Some of these private
partnerships also make investments internationally,
primarily in Europe, India and Brazil. The private funds
make investments in various real estate types, such as
office, industrial, retail and multi-family properties. The
valuations for these investments have been estimated using
the managers’ fair market values, which have been vetted to
make sure they meet the ASC 820 guidelines. These
investments can never be redeemed with the funds. As
these investments age in duration, distributions will be
received from these funds as the underlying properties are
sold at the market. It is estimated that the underlying
investments within the funds would be fully liquidated over
the next 5-7 years.
2 6 | N O T E S T O T H E F I N A N C I A L S T A T E M E N T S – i n t h o u sa n d s o f d o l l a r s
the spread between two rates, the shape of the yield curve, or
any other interest rate relationship.
Concentration – the risk of being too concentrated in one
particular security, manager, strategy, sector or asset class,
thus being vulnerable to poor performance stemming from
lack of diversification.
Absolute return risk – the ability to generate positive absolute
returns, not just in favorable markets, but also in uncertain
and negative phases measured over a business cycle.
Currency risk – the risk that currency fluctuations or trends
reduce the value of investments in non-U.S. markets.
Commodity risk – refers to the uncertainties of future market
values and the size of future income caused by fluctuation in
the prices of commodities (energy, agricultural, precious and
industrial metals) due to demand/supply imbalances.
Leverage – the risk that significant volatility or losses will be
generated by the use of debt designed to magnify returns.
Total Return Swaps (“TRS”): A TRS is a non-standardized
agreement whereby one party makes periodic cash payments
based on a set rate (e.g., London Interbank Offered Rate
(“LIBOR”)) while another party makes periodic cash payments
based on the total return of an underlying index. The total
return payer agrees to pay the total return of the underlying
index to the total return receiver. The total return receiver
agrees to receive future total return, and pay periodic
payments to the total return payer. Trading Medium: Over-The-
Counter (“OTC”). Total Return Swaps offer synthetic exposure
to beta returns while avoiding the transaction and
administrative costs of owning the actual underlying equity
shares. Subject to counterparty credit risk; if collateral is
posted between parties, counterparty credit risk can be
Futures: An Equity Index Future is a standardized
obligation to buy or sell a market index, at a certain date in
the future (settlement date), at a specified price (futures
price). Equity Index Futures are typically cash-settled.
Trading Medium: Exchange A single clearing house (e.g.,
Options Clearing Corporation, for the Chicago Board
Options Exchange) is the counterparty to both parties
involved in the contract. Futures trade a premium or
discount to the cash index level based on the following
theoretical formula: Futures Fair Value = Cash Index Value +
Expected Interest Income prior to contract expiry - Expected
Dividend Income prior to contract expiry – Expected
Lending Income prior to contract expiration. The value of a
futures contract converges to that of the underlying index
at expiration. The investor posts an initial margin and a
maintenance margin which represents a small portion of
the overall notional value (usually 12%-18% of the notional
value). Collateral between the counterparties is exchanged
daily based on the mark to market performance of the
futures contract. Used to gain beta exposure to an index on
the long side and to hedge out beta exposure on the short
side. Used primarily as a manager replacement strategy.
Counterparty risk – the risk that one party to a transaction
does not make complete or timely payment of margin,
swap cash flow, bond proceeds, or other similar payments.
Credit risk – the possibility that a bond issuer will default by
failing to pay interest or repay principal in a timely
manner.
Tail risk – a form of portfolio risk that arises when the
possibility that an investment will move more than three
standard deviations from the mean is greater than what is
shown by a normal distribution.
Liquidity risk – the inability to sell or trade securities at fair
market value within a short period of time; also, the risk
that sufficient cash is not maintained, or cannot be
accessed, to meet short-term obligations.
Inflation risk – the risk that rising prices significantly erode
the effective purchasing power of the portfolio, as
measured by the University’s cost inflation.
Shortfall risk – the risk that investment returns will be lower
than expected, causing a failure to accomplish investment
or financial objectives.
The University seeks to mitigate these risks by using
derivative transactions. At the macro level of the
investment portfolio, derivative transactions also create
cost-effective beta exposure that may replace a fund or
investment manager, add alpha, support liquidity
management, and reduce the impact of extreme negative
market conditions. The derivative instruments used include
futures, total return swaps, and over-the-counter options.

C A S E W E S T E R N R E S E R V E U N I V E R S I T Y F Y 1 4 F I N A N C I A L R E P O R T | 27
mitigated. Transacted via agreement between counterparties.
There is no initial or maintenance margin posting. Collateral
between the counterparties is exchanged daily based on the
mark to market performance of the swap. Used to gain beta
exposure to an index on the long side and to hedge out beta
exposure on the short side. The swap resets on a periodic basis
(monthly or quarterly), at which point the LIBOR rate is reset
and the gains/losses cash settled. A new notional value
reflecting the settled gains/losses is established at this point.
The next measurement begins with the new notional value.
There may be a breakup fee if the swap is terminated earlier
than its expiration date. Used primarily as a manager
replacement strategy.
Options: Options or Option Structures are non-standardized
agreements whereby one party makes or receives one
payment at the time of initial transaction to/from a
counterparty and may make or receive a second payment
to/from the counterparty at the expiration date of the
agreement based on an individual option or a combination of
individual options. Trading Medium: OTC. Transacted via
ISDA/CSA agreement between counterparties. Subject to
counterparty credit risk; if collateral is posted between parties,
counterparty credit risk can be mitigated. Options/Option
Structures allow investors to customize the risk/return profile
of existing portfolios. For example: Investors who are
underweight equities and have a moderately positive outlook
can obtain enhanced equity exposure by capping returns with
or without a leveraged payoff. More bearish investors can opt
for downside protection to reduce risk. Collateral between the
counterparties is exchanged daily based on the mark to market
performance of the Option or Option Structure. At maturity the
Option or Option Structure is cash settled. Prior to maturity,
Options/Option Structures may trade above or below their
intrinsic value due to various factors such as time, volatility,
interest rates, skew, delta, gamma etc. The value eventually
converges to intrinsic value at maturity. Used for beta
replacement strategies, alpha strategies or hedging strategies.
Forward contracts: A forward contract is an agreement to
buy or sell an asset at a certain future time for a certain
price. A forward contract is traded in the over-the-counter
market – usually between two financial institutions or a
financial institution and a client. One party assumes a long
position and agrees to buy the underlying asset on a certain
date for a certain price. The other party assumes a short
position and agrees to sell the underlying asset on a certain
date for a certain price. The price in a forward contract is
known as the delivery price. Forward contracts are commonly
used to hedge foreign currency risk. Payoff for a long position
on a forward contract is St – K where K is the delivery price and
St is the spot price at maturity of the contract. Similarly the
payoff on a short position in a forward contract is K –
St. Settlement of forward contracts can be made with delivery
of the underlying or cash settlement. Since the contract is OTC,
margin and collateral are determined by individual agreements
and sometimes fall under the agreement.

2 8 | N O T E S T O T H E F I N A N C I A L S T A T E M E N T S – i n t h o u sa n d s o f d o l l a r s
Location Derivative Type
Notional
Amount
Level 1 Fair
Value
Level 2 Fair
Value
Level 3 Fair
Value
Investments
Total return swaps 253,031$ 5,290$
Options (over-the-counter) 6,796 (117)
Yield curve hedges 146,358 (64)
TOTAL DERIVATIVES, 2014 -$ 5,109$ -$
Location Derivative Type
Notional
Amount
Level 1 Fair
Value
Level 2 Fair
Value
Level 3 Fair
Value
Investments
Total return swaps 247,052$ 5,471$
Options (over-the-counter) 2,562 2,562
Yield curve hedges 150,419 285
TOTAL DERIVATIVES, 2013 -$ 8,318$ -$
2014
2013
Location Derivative Type 2014 2013
Net effect on investment income
Options (over the counter) (3,649)$ (1,982)$
Total return swaps 22,544 (1,158)
Forward contracts (20)
Interest rate hedges (160)
18,895 (3,320)
Unrealized gains (losses)
Options (over the counter) 7,952 (1,507)
Total return swaps 10,086 (2,411)
Yield curve hedges (61) 1,435
17,977 (2,483)
NET EFFECT OF DERIVATIVES 36,872$ (5,803)$
The following table provides detailed information on the
derivatives included in the investment portfolio as of
The following table provides detailed information on the
effect the derivatives had on the overall performance
of the investment portfolio which is reflected in the
consolidated statement of activities:
June 30 and where they are located in the consolidated
statements of financial position:

C A S E W E S T E R N R E S E R V E U N I V E R S I T Y F Y 1 4 F I N A N C I A L R E P O R T | 29
7. PROPERTY, PLANT, EQUIPMENT, AND BOOKS
Property, plant, equipment and books are stated at cost, less
accumulated depreciation. Depreciation is computed on the
straight-line method over the estimated useful life of 40 years
for buildings, 5 to 12 years for equipment, and 10 years for
books. Components of property, plant, equipment and books
are as follows:
2014 2013
Land and land improvements 52,180$ 42,678$
Building and building improvements 1,165,187 1,152,290
Equipment and software 264,005 254,136
Library books 38,917 37,911
Construction-in-progress 73,543 47,554
1,593,832 1,534,569
Less: accumulated depreciation (858,183) (810,022)
TOTAL PROPERTY, PLANT, EQUIPMENT AND BOOKS, NET 735,649$ 724,547$
The above assets include $452,038 leased from the Ohio
Higher Education Facility Commission (“OHEFC”). The
University may purchase each of the leased assets for a
nominal amount at the end of the lease period. Therefore,
these assets have been capitalized and are included in the
above listing. The corresponding liability is included in Notes
and bonds payable on the consolidated statements of
financial position.
Capitalized interest added to construction in progress was $38
(2014) and $9 (2013) The expected cost to complete
construction in progress is approximately $44,664.
Depreciation expense included in the consolidated statement
of activities is $61,383 (2014) and $62,169 (2013).
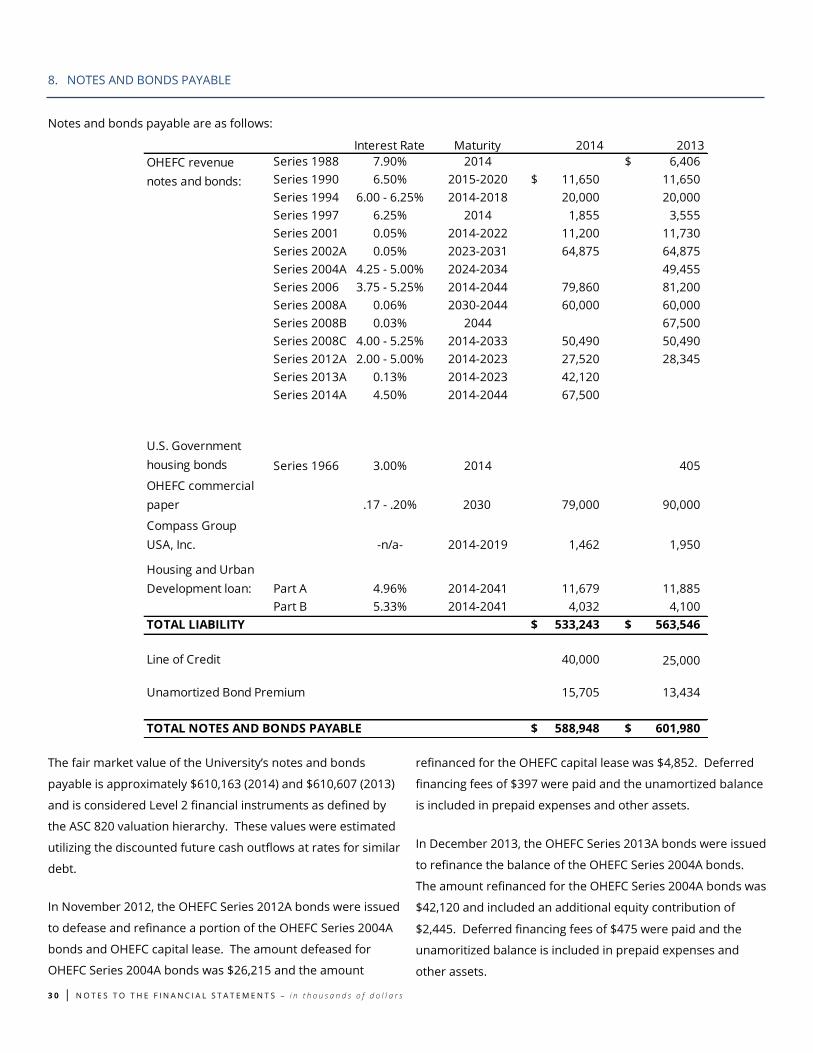
3 0 | N O T E S T O T H E F I N A N C I A L S T A T E M E N T S – i n t h o u s a n d s o f d o l l a r s
8. NOTES AND BONDS PAYABLE
Notes and bonds payable are as follows:
The fair market value of the University’s notes and bonds
payable is approximately $610,163 (2014) and $610,607 (2013)
and is considered Level 2 financial instruments as defined by
the ASC 820 valuation hierarchy. These values were estimated
utilizing the discounted future cash outflows at rates for similar
debt.
In November 2012, the OHEFC Series 2012A bonds were issued
to defease and refinance a portion of the OHEFC Series 2004A
bonds and OHEFC capital lease. The amount defeased for
OHEFC Series 2004A bonds was $26,215 and the amount
refinanced for the OHEFC capital lease was $4,852. Deferred
financing fees of $397 were paid and the unamortized balance
is included in prepaid expenses and other assets.
In December 2013, the OHEFC Series 2013A bonds were issued
to refinance the balance of the OHEFC Series 2004A bonds.
The amount refinanced for the OHEFC Series 2004A bonds was
$42,120 and included an additional equity contribution of
$2,445. Deferred financing fees of $475 were paid and the
unamoritized balance is included in prepaid expenses and
other assets.
Interest Rate Maturity 2014 2013
Series 1988 7.90% 2014 6,406$
Series 1990 6.50% 2015-2020 11,650$ 11,650
Series 1994 6.00 - 6.25% 2014-2018 20,000 20,000
Series 1997 6.25% 2014 1,855 3,555
Series 2001 0.05% 2014-2022 11,200 11,730
Series 2002A 0.05% 2023-2031 64,875 64,875
Series 2004A 4.25 - 5.00% 2024-2034 49,455
Series 2006 3.75 - 5.25% 2014-2044 79,860 81,200
Series 2008A 0.06% 2030-2044 60,000 60,000
Series 2008B 0.03% 2044 67,500
Series 2008C 4.00 - 5.25% 2014-2033 50,490 50,490
Series 2012A 2.00 - 5.00% 2014-2023 27,520 28,345
Series 2013A 0.13% 2014-2023 42,120
Series 2014A 4.50% 2014-2044 67,500
Series 1966 3.00% 2014 405
-n/a- 2014-2019 1,462 1,950
Housing and Urban
Development loan: Part A 4.96% 2014-2041 11,679 11,885
Part B 5.33% 2014-2041 4,032 4,100
TOTAL LIABILITY 533,243$ 563,546$
Line of Credit 40,000 25,000
Unamortized Bond Premium 15,705 13,434
TOTAL NOTES AND BONDS PAYABLE 588,948$ 601,980$
Compass Group
USA, Inc.
OHEFC revenue
notes and bonds:
U.S. Government
housing bonds
OHEFC commercial
paper .17 - .20% 2030 79,000 90,000

C A S E W E S T E R N R E S E R V E U N I V E R S I T Y F Y 1 4 F I N A N C I A L R E P O R T | 31
In March 2014, the OHEFC Series 2014A bonds were issued to
refinance the OHEFC Series 2008B bonds. The amount for the
refinanced for the OHEFC Series 2008B bonds was $67,500.
The financing fees of $182 were not included in the refinancing
and were expensed.
The OHEFC authorized a $63,000 tax-exempt commercial
paper program in February 2000 to provide construction funds
for several approved capital projects and to refinance earlier
projects. In November 2008, the OHEFC authorized a $27,000
expansion of that program, to a total size of $90,000, to
provide funding for future projects.
In February 2013, $27,000 was drawn to provide bridge
financing for the construction of the Tinkham Veale University
Center. Deferred financing fees of $226 were paid and the
unamortized balance is included in prepaid expenses and
other assets. Unspent funds related to the financing in the
amount of $11,250 were reported as operating investments in
the consolidated statement of financial position at June 30,
2013. There were no unspent funds at June 30, 2014. In May
2014, $11,000 of principal was paid down and was available for
financing of future projects. The amount outstanding under
the commercial paper program was $79,000 (2014) and
$90,000 (2013), with maturities not exceeding 270 days from
the issuance date. All commercial paper issued under the
terms of the program must mature no later than February 1,
2030. The annualized interest cost and credit facility expense
for this program was 0.67% (2014) and 0.65% (2013).
The University has revolving lines of credit with two financial
institutions in the amount of $60,000 to finance working
capital. Both lines are subject to review and renewal annually.
The amount outstanding was $40,000 (2014) and $25,000
(2013).
9. RETIREMENT PLANS
The University has both defined benefit and defined
contribution pension plans for its employees. In accordance
with provisions of the Employee Retirement Income Security
Act of 1974, the University has established a trust to hold plan
Principal payment requirements for bonds, notes, and capital
lease obligations for the next five years and thereafter are as
follows:
The University has letter of credit agreements, standby bond
purchase agreements and liquidity agreements with various
financial institutions to purchase the University’s variable rate
demand obligations (“VRDO’s”) and commercial paper if they
cannot be remarketed. Outstanding VRDO’s in the above table
represent amounts payable in the event that bonds are
tendered but not successfully remarketed.
Interest expense, including those amounts for interest rate
swap agreements (Note 12), was $20,125 (2014) and $20,949
(2013).
Certain borrowing agreements require that the University
comply with certain covenants. The University is in compliance
with these provisions as of June 30, 2014.
Year
Scheduled
Principal
Payments
Outstanding
VRDO's
Total
Maximum
Principal
Payments
2015 14,533$ 96,075$ 110,608$
2016 15,458 80,000 95,458
2017 13,754 20,000 33,754
2018 29,465 30,000 59,465
2019 14,645 - 14,645
Thereafter 445,388 (226,075) 219,313
TOTAL 533,243$ -$ 533,243$
2014 2013
Benefit obligation at June 30 204,471$ 176,142$
Fair value of plan assets at June 30 148,630 135,364
FUNDED STATUS AT JUNE 30 (55,841)$ (40,778)$
Accumulated benefit obligation 203,742$ 175,260$ assets for its defined benefit plan. The funded status of the
University’s defined benefit plan is as follows:

3 2 | N O T E S T O T H E F I N A N C I A L S T A T E M E N T S – i n t h o u sa n d s o f d o l l a r s
Benefit plan costs for the defined benefit plan are as follows:
Estimated benefits expected to be paid under the defined
benefit plan for the next five fiscal years are as follows:
Amounts expected to be paid between 2020 and 2024 total
$43,265. The University’s estimated employer contribution for
the defined benefit plan in fiscal 2015 will depend on the
results of the July 1, 2014 actuarial valuation and is estimated
to be $23,495.
Weighted-average assumptions used to determine the benefit
obligation and benefit plan costs are as follows:
The expected long-term rate of return for the defined benefit
plan was estimated using market benchmarks for equities and
bonds applied to the plan's target asset allocation. The
expected return on equities was computed utilizing a valuation
framework that projected future returns based on current
equity valuations rather than historical returns. Management
estimated the rate by which the plan assets would outperform
the market in the future based on historical experience
adjusted for changes in asset allocation and expectations for
overall lower future returns on equities compared to past
periods.
The investment objective for the defined benefit plan is to
maximize total return with tolerance for slightly above average
risk, in order to meet the obligations that the University has to
its plan beneficiaries. To accomplish this objective, the
University has established a broadly-diversified asset allocation
strategy that includes absolute return strategies (combination
of fixed income and equity securities) (50%), equity
investments (30%), bonds and cash (16%), and real estate
(4%). The weightings of the investments relative to each other
in the total portfolio fluctuate as market conditions vary; they
are adjusted regularly to remain within acceptable ranges.
The weighted-average asset allocation for the defined benefit
plan is as follows:
The amounts recognized in the University’s consolidated
statements of financial position and in unrestricted net assets
related to the defined benefit plan are as follows:
The estimated amortization of prior year service costs
expected in fiscal 2015 totals $4,073. Components of the net
periodic benefit cost and other changes in plan assets that are
recognized in the consolidated statement of activities are as
follows:
2014 2013
Net periodic benefit cost 8,051$ 11,105$
Employer contributions 6,655
Benefits paid 4,665 3,932
2015 4,721$
2016 5,219
2017 5,466
2018 6,032
2019 6,576
2014 2013
BENEFIT OBLIGATION
Discount rate 4.75% 5.25%
Rate of compensation increase 2.25% 4.25%
Measurement date 6/30/14 6/30/13
Census date 7/1/13 7/1/12
NET PERIODIC BENEFIT COST
Discount rate 5.25% 4.50%
Expected return on plan assets 8.50% 8.50%
Rate of compensation increase 4.25% 4.25%
2014 2013
Equity securities 33.00% 36.00%
Fixed income securities 10.00% 11.00%
Real estate 5.00% 5.00%
Other 52.00% 48.00%
TOTAL ASSET ALLOCATION 100.00% 100.00%
2014 2013
STATEMENT OF FINANCIAL POSITION
NET LIABILITY (55,841)$ (40,778)$
UNRESTRICTED NET ASSETS
Actuarial losses 63,763 56,751
AMOUNT RECOGNIZED AS
REDUCTION OF UNRESTRICTED
NET ASSETS
$ 63,763 $ 56,751

C A S E W E S T E R N R E S E R V E U N I V E R S I T Y F Y 1 4 F I N A N C I A L R E P O R T | 33
10. COMMITMENTS AND CONTINGENCIES
In its normal operations, the University is subject to various
claims and lawsuits. In management’s opinion, the resolution
of these contingencies will not have a significant adverse effect
on the University’s financial position, operations, or cash flows.
In May 2002, the University entered into an agreement with the
Cleveland Clinic Foundation (“CCF”) to form a new medical
education and research program, the Cleveland Clinic Lerner
College of Medicine (“CCLCM”). Beginning in 2004, research
grants from the National Institutes of Health to support work
by CCF-based investigators were awarded to and administered
through the University by CCLCM, which operates as an
academic unit of the School of Medicine. Expenditures for
research conducted under this joint agreement totaled $82,996
(2014) and $91,316 (2013).
In April 2006, the Boards of University Hospitals Health System
and the University approved a new affiliation agreement
between the School of Medicine and University Hospitals of
Cleveland (“UHC”). This agreement significantly strengthened
the historical relationship between the entities through the
creation of the Case Medical Center, a virtual entity that
11. RELATED PARTY TRANSACTION
In 1998, the University entered into a thirty-year agreement
with the Medical Center Company (a cooperative utility
company formed by and serving institutions in the University
Circle area) to purchase chilled water and other utilities for
several University buildings. The amounts purchased were
$20,118 (2014) and $20,508 (2013). No obligation associated
with this agreement is recorded in the accompanying
consolidated financial statements.
encompasses certain teaching, research and clinical activities
of the School of Medicine and UHC.
During 2013, the University entered into a joint purchase
agreement with the Cleveland Museum of Art to purchase real
property from the Cleveland Institute of Art. The University’s
commitment is $4,600 with $505 placed as an earnest deposit
and is shown on the consolidated statement of financial
position in prepaid expenses and other assets. The remaining
$4,095 is due at closing, which is anticipated to be in fiscal
2016.
The University is self-insured for workers compensation and
employee and student medical coverage. Property is
commercially insured with an aggregate deductible of $700.
The University also carries general liability insurance with a
deductible of $100 per occurrence. The University believes its
reserves for self-insured risks and the deductible portion of
insured risks are sufficient.
2014 2013
Change in actuarial losses (gains) 7,012$ (26,804)$
Amortization of prior service cost (160)
7,012 (26,964)
Net periodic benefit cost 8,051 11,105
15,063$ (15,859)$
TOTAL LOSS (GAIN)
RECOGNIZED, UNRESTRICTED
NET ASSETS
TOTAL LOSS (GAIN) RECOGNIZED,
STATEMENT OF ACTIVITIES
Benefit plan costs for the defined contribution plan are
$20,225 (2014) and $19,834 (2013).
In July 2012, the University received an energy efficiency
grant from the Medical Center Company in the amount of
$998. The grant required a capital contribution of $267
from the University and payback of a portion of projected
energy cost savings. Payback terms are 36 months
beginning January 2014. The obligation recorded in other
liabilities is $772 (2014) and $137 (2013).

3 4 | N O T E S T O T H E F I N A N C I A L S T A T E M E N T S – i n t h o u sa n d s o f d o l l a r s
12. DERIVATIVES AND OTHER FINANCIAL INSTRUMENTS
The University uses floating-to-fixed interest rate swap
agreements of various durations to manage both its funding
cost and the interest rate risk associated with variable rate
debt. Under these swap agreements, the University pays a
fixed rate and receives from its counterparty a variable rate
payment, each calculated by reference to specified notional
principal amounts during the agreement period. Operations
are charged the variable rate interest on the corresponding
bonds; the difference between the fixed and variable interest
amounts under the swap agreements is recorded in non-
operating revenues and expenses as investment and other
income.
The University follows accounting guidance that defines fair
value, establishes a framework for measuring fair value and
expands disclosure requirements about fair value
measurements, including derivatives. The University's interest
rate swaps are valued by an independent swap consultant that
uses the mid-market levels, as of the close of business, to value
the agreements. The valuations provided are derived from
proprietary models based upon well-recognized financial
principles and reasonable estimates about relevant future
market conditions and the University's credit worthiness. The
University's interest rate swap arrangements have inputs that
can generally be corroborated by market data and are
classified as Level 2 in the fair value hierarchy.
At June 30, 2014, the University has five interest rate swap
agreements. Net payments or receipts under the swap
agreements are recorded as adjustments to investment and
other income and the incremental expense is disclosed below.
Under one agreement in effect at June 30, 2014, the
counterparty pays the University a variable interest rate equal
to the Securities Industry and Financial Markets Association
(SIFMA) index, and under four other agreements, the
counterparty pays a variable interest rate equal to a
percentage of the one month LIBOR.
The following table provides detailed information on the
interest rate swaps at June 30, 2014, with comparative fair
values for June 30, 2013. The number of swaps is reported
based on notional amount. Information related to the interest
rate swap agreements to which the University is a party,
including the associated OHEFC borrowing, where applicable,
and the liability recognized in the consolidated statements of
financial position in deferred income and other liabilities are
as follows:
Notional 2014 2013
Amount Interest Rate Commencement Termination Date Basis
18,875$ 4.34% Aug. 12, 2004 Oct.1, 2022 LIBOR (1,778)$ (1,980)$
15,000 4.43% Jun. 5, 2002 Jun. 5, 2022 LIBOR (3,174) (3,306)
15,000 3.60% Sept. 25, 2002 Sept. 25, 2022 LIBOR (2,300) (2,310)
35,000 3.81% Aug. 4, 2004 Aug. 1, 2034 LIBOR (8,074) (7,952)
100,000 3.37% Jan. 3, 2012 Jan. 1, 2017 SIFMA (7,491) (9,510)
TOTAL INTEREST RATE SWAP AGREEMENT LIABILITY (22,817)$ (25,058)$
Level 2 Fair Market Value
Changes in the fair value of derivative instruments are
recorded in non-operating revenues and expenses as
investment and other income. The provisions of the swap
agreements require that on a weekly basis the University place
into an escrow fund collateral sufficient to limit the counter-
party’s financial exposure to the University to no more than
$20,000.
The University had placed $3,703 (2014) and $5,435 (2013)
into such a fund, which is shown in Cash and cash equivalents
on the consolidated statements of financial position.
Interest expense recorded for the swap agreements in the
non-operating activities for the year ended June 30 was $6,224
(2014) and $6,182 (2013).

C A S E W E S T E R N R E S E R V E U N I V E R S I T Y F Y 1 4 F I N A N C I A L R E P O R T | 35
13. RESTRICTED NET ASSETS
The University’s restricted net assets as of June 30 were as follows:
14. SUBSEQUENT EVENTS
The University has performed an evaluation of subsequent
events through October 11, 2014, the date on which the
consolidated financial statements were issued. No material
items were noted which require disclosure.
Temporarily Permanently
Restricted Restricted 2014 2013
Endowment
True Endowment 538,245$ 560,569$ 1,098,814$ 1,007,629$
Funds functioning as endowment (FFE) 290,857 290,857 266,604
Total True endowment and FFE 829,102 560,569 1,389,671 1,274,233
Funds held in trust by others 340,275 340,275 305,682
TOTAL UNIVERSITY ENDOWMENT 829,102$ 900,844$ 1,729,946$ 1,579,915$
Other net assets
Pledges receivable 69,661 21,270 90,931 90,454
Funds held in trust by others, unused income 4,853 4,853 5,057
Student loan funds 35,333 35,333 34,460
Split interest agreements 16,911 16,911 16,229
Purpose restricted gifts 85,323 4,520 89,843 45,267
TOTAL NET ASSETS 988,939$ 978,878$ 1,967,817$ 1,771,382$


www.case.edu/finance/FY14FinancialStatements