2014 full year results 25 february 2015 -...
TRANSCRIPT

2014 Full Year Results
25 February 2015
SLIDE 2
DISCLAIMER
This presentation has been prepared by YOOX S.p.A. for information purposes only and for use in presentations of the Group’s results and strategies. For further details on the YOOX Group, reference should be made to publicly available information. Statements contained in this presentation, particularly regarding any possible or assumed future performance of the Group, are or may be forward-looking statements based on YOOX S.p.A.’s current expectations and projections about future events, and in this respect may involve some risks and uncertainties. Actual future results for any quarter or annual period may therefore differ materially from those expressed in or implied by these statements due to a number of different factors, many of which are beyond the ability of YOOX S.p.A. to control or estimate precisely, including, but not limited to, the Group’s ability to manage the effects of the uncertain current global economic conditions on our business and to predict future economic conditions, the Group’s ability to achieve and manage growth, the degree to which YOOX S.p.A. enters into, maintains and develops commercial and partnership agreements, the Group’s ability to successfully identify, develop and retain key employees, manage and maintain key customer relationships and maintain key supply sources, unfavourable development affecting consumer spending, the rate of growth of the Internet and online commerce, competition, fluctuations in exchange rates, any failure of information technology, inventory and other asset risk, credit risk on our accounts, regulatory developments and changes in tax laws. YOOX S.p.A. does not undertake any obligation to publicly release any revisions to any forward-looking statements to reflect events or circumstances after the date of this presentation. Any reference to past performance of the YOOX Group shall not be taken as an indication of future performance. This document does not constitute an offer or invitation to purchase or subscribe to any shares and no part of it shall form the basis of or be relied upon in connection with any contract or commitment whatsoever. By attending the presentation you agree to be bound by the foregoing terms.

SLIDE 3
AGENDA
RESULTS HIGHLIGHTS AND BUSINESS DEVELOPMENTS FY 2014 FINANCIAL ANALYSIS LOOKING AT 2015
Q&A

SLIDE 4
2014 RESULTS HIGHLIGHTS
Note: Figures as absolute values and in percentages are calculated using precise financial data. Some of the differences found in this presentation are due to rounding of the values expressed in millions of Euro. In this presentation, fourth-quarter figures are calculated as the difference between the full-year results and the results for the first nine months of the same year 1.Retail value of sales of all the mono-brand online stores, net of returns and customer discounts. Set-up, design and maintenance fees for the mono-brand online stores, accounted for within “Not country related”, are excluded
Group’s net revenues at €524m, up 18% at constant FX compared with
€456m in 2013
− Positive growth from all key geographic markets, despite sharp
devaluation of Rouble and Yen against the Euro; Italy and China the
fastest growing countries; US performance benefitting from strong
acceleration in 4Q 2014
− Solid performance across both business lines, growing at the same pace:
Multi-brand net revenues and Mono-brand Gross Merchandise Value1
both up 20% at constant FX
Strong operating leverage from all cost lines offset by adverse Forex impacting
gross margin
− EBITDA at €48.8m, up 13% with a margin of 9.3% (vs. 9.5% in 2013).
EBITDA Excluding Incentive Plan Costs at €50.1m, with a margin of 9.5%
(vs. 10.3% in 2013)
− Net income at €13.8m, up 9% with a margin of 2.6% (vs. 2.8% in 2013)
Positive net financial position at €31.0m, up from €20.5m on December 2013

SLIDE 5
FURTHER STRENGHETING OUR CUSTOMER PROPOSITION WITHIN THE MULTI-BRAND SPACE…
FURTHER ENRICHING THECORNER.COM & SHOESCRIBE.COM OFFERING
Enhancement of portfolio continued: important high-end fashion brands added (e.g. Burberry, Dolce & Gabbana, Moschino, Brian Atwood)
STRONG RETENTION AND ACQUISITION TRENDS AT YOOX. COM
Another year of sound underlying performance, with ongoing increase in customer retention and acquisition
Outstanding performance in Italy, where yoox.com registered an all-time high retention rate coupled with decreasing acquisition costs, also benefiting from rising awareness supported by the new TV campaign
Strong growth in China driven by the new complementary logistics set-up introduced in February 2014 and allowing for a much richer brand offering
Increasing conversion rates underpinned by the new yoox.com release and native app
Enrichment of product and brand assortment with the addition of:
– The new area dedicated to fashion and lifestyle sportswear launched in Europe in September and featuring some of the most well-known international brands
– Sunglasses

SLIDE 6
…WHILE ENRICHING OUR MONO-BRAND PORTFOLIO …
NEW BUSINESS DEVELOPMENTS
4 new mono-brand partnerships – Lanvin: 5-year global agreement for the management of the online store in Europe,
the US and the APAC region, scheduled to go live tomorrow – Alexander Wang: new agreement for the management of the online store in the US
which launched in July 2014. Global partnership also extended until December 2017 – redvalentino.com: launched in Europe, the US and Japan in November 2014 – kartell.com: launched in Europe in May 2014
Several extensions of existing partnerships: Missoni Home line added to missoni.com in 1Q 2014; Alexander McQueen, Balenciaga, Brioni, Brunello Cucinelli, Sergio Rossi, Stella McCartney and Valentino extended to China and Moncler and Dodo to Japan
5 RENEWALS
Maison Martin Margiela and Just Cavalli (Staff International - OTB Group) - contracts renewed in early 2015 until December 2020
Alberta Ferretti (Aeffe) - contract renewed in February 2015 for a further 5 years until March 2020
Dsquared2 and Jil Sander - contracts renewed in 2014 for a further 5 years until April and September 2019 respectively
YOOX’S CREATIVE WEB AGENCY
Fendi - awarded the creative concept design for the new release of fendi.com New graphic releases ideated and launched for Kartell, Marni and Valentino

SLIDE 7
…AND MAINTAINING OUR COMMITMENT TO THE ULTIMATE LEVEL OF SERVICE
EFFICIENT GLOBAL OPERATIONS TO ACCOMODATE OUR FUTURE GROWTH
New complementary logistics set-up in China available since Feb. 2014, allowing for order fulfillment from both Shanghai and Bologna warehouses
Network of over 5,000 pick-up and drop-off points introduced for yoox.com in Spain and France, allowing for extended collect and return times
Introduction of first-ever dedicated pick-up kiosks at select bank branches (partnership with BNL Group BNP Paribas) for yoox.com in Italy: excellent delivery service combined with innovative and luxury customer proposition
New record of on-time deliveries (99.5%), beating the previous high of last year
CONTINUING TO INVEST IN OUR TECHNOLOGY PLATFORM
The “NEW YOOX.COM” successfully launched in 3Q 2014 with a new look and user interface to improve usability, simplify and accelerate the path-to-purchase experience
Further enrichment of the Group’s mobile offer – New yoox.com iOS & Android smartphone native app launched worldwide in 4Q
2014, contributing to 50% share of traffic from mobile at Christmas – New mobile sites and upgrade of existing m-sites for many of the Group’s online stores
On-going cross-channel roll-out: Click & Collect, Click & Reserve, Return in Store, Click from Store, Book a Tailoring Appointment and Check In-Store Availability Online already available. Select features currently active for some Mono-brand partners - including Alexander McQueen, Balenciaga, Brioni and Stella McCartney - in certain boutiques in Europe and the US
Group’s currencies brought to 9 with the introduction of the Hong Kong Dollar, the South Korean Won and the Australian Dollar

SLIDE 8
AGENDA
RESULTS HIGHLIGHTS AND BUSINESS DEVELOPMENTS FY 2014 FINANCIAL ANALYSIS LOOKING AT 2015
Q&A

SLIDE 9
KEY PERFORMANCE INDICATORS1
Monthly Unique Visitors (m)2 # Orders (‘000) - Group
Active Customers3 (‘000) - Group4
1.Key performance indicators do not include the Joint Venture with Kering 2.Source: SiteCatalyst for yoox.com; Google Analytics for thecorner.com, shoescribe.com and the mono-brand online stores “Powered by YOOX Group” 3.Active Customer is defined as a customer who has placed at least one order in the 12 preceding months 4.Include Active Customers of the mono-brand online stores “Powered by YOOX Group”
1,081
1,252
Average Order Value (€) - Group
6.5 7.6
6.8 7.6
13.2 15.2
Multi-brand Mono-brand excluding JV with Kering
4Q 2014 4Q 2013 2014 2013
2013 2014
4Q 2014 4Q 2013 2014 2013
2,785
3,387
818 987
7.5 8.6
7.9 10.0
18.6
15.4
2014 2013
215
202
222 211
4Q 2014 4Q 2013
AOV reflects: – The exclusion of the JV with Kering from this KPI – Adverse FX – Greater promotions – Geographical mix
211

SLIDE 10
1.Not Country Related
NET REVENUE REVIEW BY GEOGRAPHY
Net Revenue Performance
Net Revenue Breakdown
5.6%
2013 2014 % Growth % Growth Constant FX
5.7%
17.3%
46.9%
23.4%
1.2%
21.9%
17.1% 6.4%
4.7%
48.4%
1.5%
22.0%
16.4% 7.0%
5.5%
47.4%
1.7%
22.6%
15.6% 7.6%
4.8%
48.0%
1.5%
Italy Rest of Europe North America RoW Japan NCR1
2013 2014 4Q 2013 4Q 2014
Growth in Rest of Europe impacted by heavy devaluation of Ruble/Euro FX
(€m)
Italy 70.9 86.1 21.5% 23.4 27.3 16.9%
Rest of Europe 218.7 248.7 13.7% 17.7% 66.0 74.1 12.3% 18.4%
North America 102.8 115.2 12.1% 12.1% 29.8 37.0 24.1% 16.7%
Japan 34.4 36.8 7.0% 15.7% 8.7 8.8 1.2% 5.3%
Other Countries 21.8 28.8 32.1% 32.2% 6.4 9.0 41.4% 34.1%
Not country related 7.0 8.8 25.4% 2.1 1.9 (10.9%)
Group Net Revenues 455.6 524.3 15.1% 17.7% 136.3 158.1 16.0% 17.2%
4Q 2013 4Q 2014 % Growth % Growth Constant FX
SLIDE 11
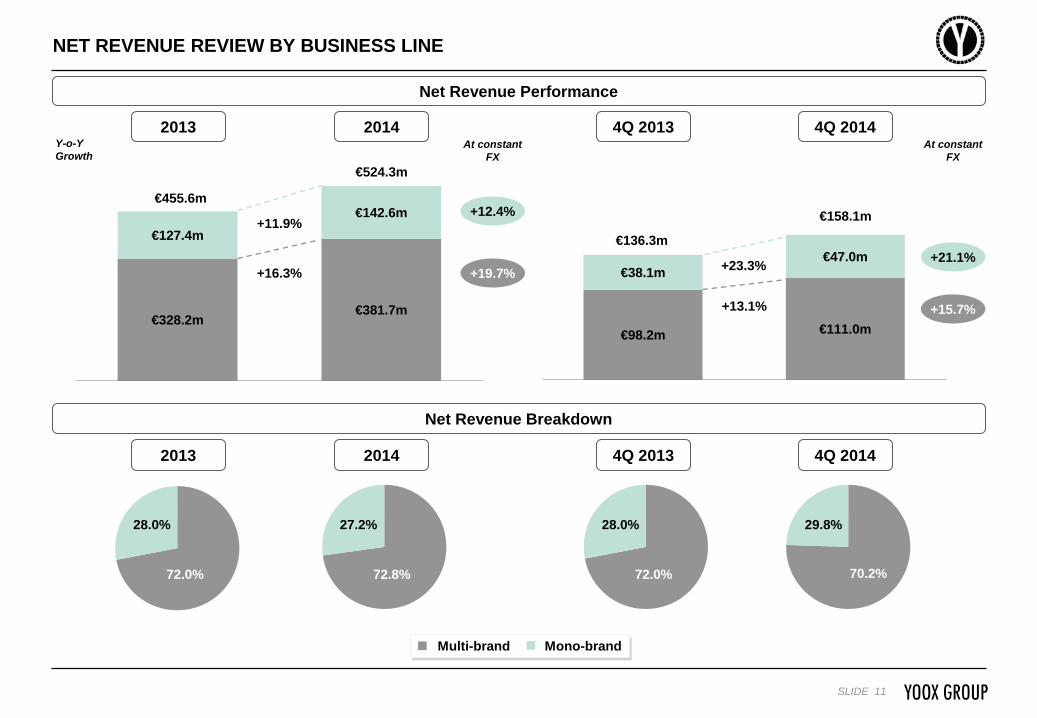
NET REVENUE REVIEW BY BUSINESS LINE
Net Revenue Performance
Net Revenue Breakdown
72.0%
28.0%
2013
72.8%
27.2%
2014
72.0%
28.0%
4Q 2013
70.2%
29.8%
4Q 2014
Multi-brand Mono-brand
4Q 2013 4Q 2014 Y-o-Y Growth
€98.2m €111.0m
€38.1m €47.0m
€328.2m €381.7m
€127.4m €142.6m
+11.9%
+16.3%
2013 2014
+23.3%
+13.1%
At constant FX
+12.4%
+19.7%
€455.6m
€524.3m
€136.3m
€158.1m
+21.1%
+15.7%
At constant FX

SLIDE 12
FOCUS ON FY 2014 MONO-BRAND PERFORMANCE
+12.4%
+5.8%
+7.3% +25.4%
Mono-brandNet Revenue growth
at constant FX
Impact ofsmaller perimeter
Impact of differentbooking of sales of the
JV online stores
Mono-brand Organic Growth(Gross Merchandise Value Growth)
at constant FX
+18.2%
1.Mono-brand net revenue growth rate calculated by excluding the contribution of diesel.com in the US from FY 2013 and at constant exchange rates 2.Additional growth at constant exchange rates that would have been achieved by excluding the contribution of diesel.com in the US from FY 2013 3. It also includes the Mono-brand Not Country Related growth in FY 2014 over FY 2013 4.Retail value of sales of all the mono-brand online stores, net of returns and customer discounts and contribution of diesel.com in the US in FY 2013
Mono-brand Organic Growth
Mono-brand Net Revenue growth at comparable perimeter
and constant FX
3
4
1
2

SLIDE 13
YOOX GROUP PROFIT & LOSS YOOX GROUP PROFIT & LOSS
Note: Depreciation & Amortisation included in Fulfillment, Sales & Marketing, General & Administrative have been reclassified and grouped under Depreciation & Amortisation EBITDA Excluding Incentive Plan Costs calculated by adding back to EBITDA the costs associated with incentive plans in each period Net Income Excluding Incentive Plan Costs calculated by adding back to Net Income the costs associated with incentive plans in each period, net of their related tax effect
4Q 2013 4Q 2014 2013 2014 (€m)
Net Revenues 455.6 524.3 136.3 158.1growth 21.2% 15.1% 24.1% 16.0%
COGS (284.8) (336.8) (81.5) (99.9)Gross Profit 170.8 187.5 54.8 58.1
% of Net Revenues 37.5% 35.8% 40.2% 36.8%Fulfillment (37.9) (42.3) (8.8) (9.0)
% of Net Revenues 8.3% 8.1% 6.5% 5.7%Sales & Marketing (50.5) (56.6) (14.2) (17.4)
% of Net Revenues 11.1% 10.8% 10.4% 11.0%EBITDA Pre Corporate Costs 82.4 88.7 31.9 31.7
% of Net Revenues 18.1% 16.9% 23.4% 20.1%General & Administrative (36.5) (37.4) (9.9) (9.5)
% of Net Revenues 8.0% 7.1% 7.3% 6.0%Other Income / (Expenses) (2.9) (2.5) (0.3) (0.5)
EBITDA 43.1 48.8 21.6 21.7% of Net Revenues 9.5% 9.3% 15.8% 13.7%EBITDA Excluding Incentive Plan Costs 46.8 50.1 21.5 22.0
% of Net Revenues 10.3% 9.5% 15.8% 13.9%Depreciation & Amortisation (19.2) (25.6) (5.7) (7.7)
% of Net Revenues 4.2% 4.9% 4.2% 4.9%Operating Profit 23.9 23.3 15.9 14.0
% of Net Revenues 5.2% 4.4% 11.7% 8.9%Income / (Loss) From Investment In Associates (0.6) (0.7) 0.1 (0.1)Net Financial Income / (Expenses) (3.1) 0.1 (1.4) 1.0
Profit Before Tax 20.2 22.6 14.6 14.9% of Net Revenues 4.4% 4.3% 10.7% 9.4%
Taxes (7.5) (8.8) (5.5) (5.6)Net Income 12.6 13.8 9.1 9.2
% of Net Revenues 2.8% 2.6% 6.7% 5.8%

SLIDE 14
% of Group Net Revenues
% of Mono-brand Net Revenues
EBITDA REVIEW BY BUSINESS LINE
EBITDA Evolution
Multi-brand EBITDA Pre Corporate Costs Corporate Costs Mono-brand EBITDA
Pre Corporate Costs
€21.6m €21.7m
€43.1m €48.8m
4Q 2013 4Q 2014
% of Net Revenues 9.5% 9.3% 15.8% 13.7%
2013 2014
Note: Multi-brand and Mono-brand EBITDA Pre Corporate Costs include all costs directly associated with the business line, including COGS, Fulfillment, Sales & Marketing (all net of D&A); Corporate Costs include General & Administrative costs (net of D&A) and Other Income / (Expenses)
2013 2014 4Q 2013
4Q 2014 2013 2014 4Q
2013 4Q
2014 2013 2014 4Q 2013
4Q 2014
€(39.3)m €(39.8)m
€(10.3)m €(10.0)m
2013 2014 GAP 4Q 2013 4Q 2014
€27.1m €29.5m
€9.2m €10.0m
2013 2014 GAP 4Q 2013 4Q 2014
€55.3m €59.2m
€22.7m €21.8m
2013 2014 GAP 4Q 2013 4Q 2014
% of Multi-brand Net Revenues
19.6% 16.9% 15.5% 23.1% 21.2% 21.2% 20.7% 24.1% 6.4% 8.6% 7.6% 7.6%

SLIDE 15
€46.8m
€(3.7)m
€43.1m
€(19.2)m €23.9m
€(0.6)m €(3.1)m €(7.5)m
€12.6m
EBITDA Excl.Incentive Plan
Costs
Incentive PlanCosts
EBITDA D&A EBIT Income / (Loss)From Associates
Net FinancialIncome / (Expenses)
Taxes Net Income
€50.1m
€(1.2)m
€48.8m
€(25.6)m €23.3m
€(0.7)m
€0.1m
€(8.8)m
€13.8m
EBITDA Excl.Incentive Plan
Costs
Incentive PlanCosts
EBITDA D&A EBIT Income / (Loss)From Associates
Net FinancialIncome / (Expenses)
Taxes Net Income
FROM EBITDA TO NET INCOME
2013
2014
% of Net Revenues 9.5% 9.3% 4.4% 2.6%
% of Net Revenues 10.3% 9.5% 5.2% 2.8%
SLIDE 16
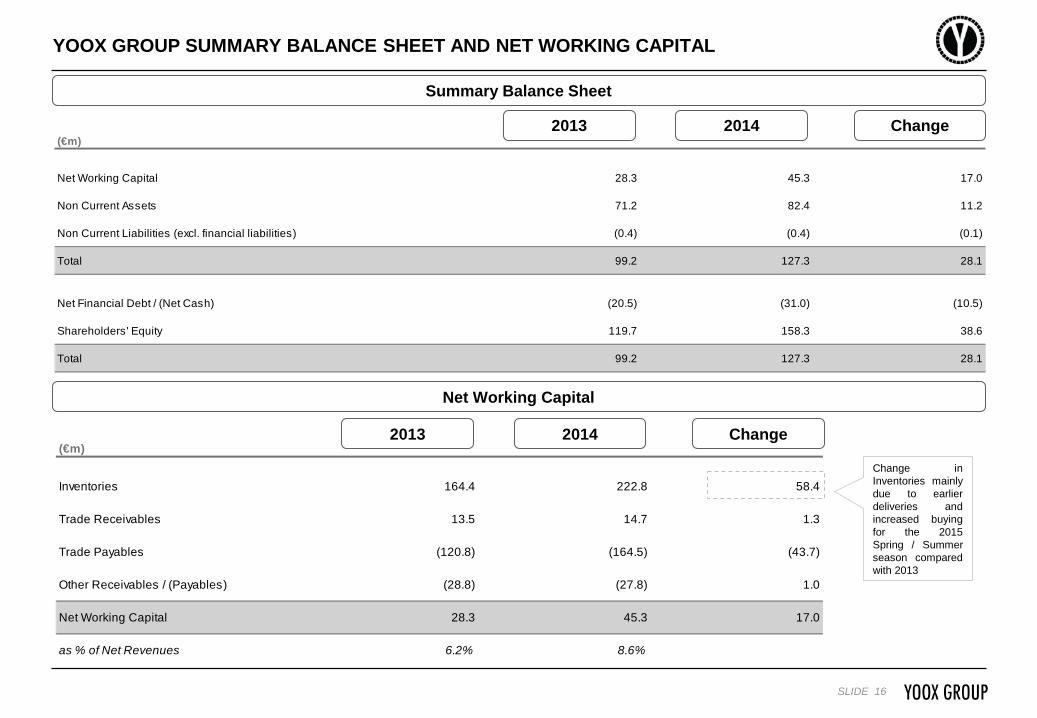
YOOX GROUP SUMMARY BALANCE SHEET AND NET WORKING CAPITAL
2013 2014 Change
Summary Balance Sheet
Net Working Capital
2013 2014 Change (€m)
Net Working Capital 28.3 45.3 17.0
Non Current Assets 71.2 82.4 11.2
Non Current Liabilities (excl. financial liabilities) (0.4) (0.4) (0.1)
Total 99.2 127.3 28.1
Net Financial Debt / (Net Cash) (20.5) (31.0) (10.5)
Shareholders' Equity 119.7 158.3 38.6
Total 99.2 127.3 28.1
Change in Inventories mainly due to earlier deliveries and increased buying for the 2015 Spring / Summer season compared with 2013
(€m)
Inventories 164.4 222.8 58.4
Trade Receivables 13.5 14.7 1.3
Trade Payables (120.8) (164.5) (43.7)
Other Receivables / (Payables) (28.8) (27.8) 1.0
Net Working Capital 28.3 45.3 17.0
as % of Net Revenues 6.2% 8.6%

SLIDE 17
YOOX GROUP CASH FLOW STATEMENT
Cash Flow Statement
% of Net Revenues
€32.6m €34.9m
7.2% 6.7% 4.5% 6.0%
1.As per IFRS, repayments of €4.0m in both FY 2013 and FY 2014 were accounted for in Cash Flow from Investment Activities, being fully allocated to finance the new automated logistics platform
€6.1m €9.4m
4Q 2014 4Q 2013
1 1
Tech Operations Other
Capital Expenditure
4Q 2013 4Q 2014 2013 2014
(€m)
Cash and Cash Equivalents at Beginning of Period 35.8 58.3 24.9 30.3
Cash Flow from Operations 36.3 24.1 20.6 23.4
Cash Flow from Investment Activities (37.3) (38.9) (7.5) (10.4)
Sub Total (1.0) (14.8) 13.0 13.0
Cash Flow from Financing Activities 23.5 74.6 20.3 74.7
Cash Flow 22.5 59.7 33.3 87.7
Cash and Cash Equivalents at End of Period 58.3 118.0 58.3 118.0
2014 2013

SLIDE 18
YOOX GROUP NET FINANCIAL POSITION EVOLUTION
Net Financial Position
2014 2013
Overview of Debt Facilities at 31 December 2014
Used Available Committed
Long average maturity of outstanding debt (>90% of loans due between 1H2017 and 2020) at an average cost of
debt of 180 bps over the 3/6 month Euribor
(€m)
Cash and Cash Equivalents (58.3) (118.0)
Other Current Financial Assets (9.3) (10.0)
Current Financial Assets (67.5) (128.0)
Current Financial Liabilities 13.2 30.9
Long Term Financial Liabilities 33.8 66.1
Net Financial Debt / (Net Cash) (20.5) (31.0)
(€m)
Overdrafts 7.8 0 7.8
Bank Loans 107.6 47.6 60.0
European Investment Bank 45.0 45.0 -
Financial Leases & Other 2.6 2.6 -
Total 163.0 95.2 67.8

SLIDE 19
AGENDA
RESULTS HIGHLIGHTS AND BUSINESS DEVELOPMENTS FY 2014 FINANCIAL ANALYSIS LOOKING AT 2015
Q&A

SLIDE 20
2015 OUTLOOK
2015 revenue growth expected to progressively increase quarter after quarter driven by – Increased buying for Spring / Summer and Fall / Winter 2015 seasons for yoox.com, with acceleration expected
to set in from 2Q onwards – Gradually-rising marketing investments over the year and implementation of a new loyalty program for
yoox.com at the end of 2Q to further increase customer engagement, average revenue per user and order frequency
Multi-brand
Performance to be fuelled by solid anticipated organic growth of the existing online stores, supported by large exposure to the US
Number of new mono-brand partnerships signed to return to a normalised rate
Mono-brand
Great focus on: Italy - positive performance expected to be fuelled by a new and enhanced TV ad and a marketing campaign for
YOOX’s 15th Anniversary North America - growth to be supported by a different marketing mix, a comparable business perimeter with 2014
and favourable Forex China - expected to remain the fastest growing country, building upon the current positive momentum of yoox.cn
Geographical Markets
Further development of the Group’s global techno-logistics platform – Mobile confirmed as a top priority – Further enhancement of the Group’s cross-channel offer thanks to ongoing upgrade of the order management
system. Cross-channel features to be rolled out to an increasing number of mono-brand online stores throughout the year
– Completion of the third “brick” of the Group’s “Lego Strategy”: new shoe warehouse in Interporto (Bologna) opened in January 2015
Technology and Logistics Platform

SLIDE 21
AGENDA
RESULTS HIGHLIGHTS AND BUSINESS DEVELOPMENTS FY 2014 FINANCIAL ANALYSIS LOOKING AT 2015
Q&A

SLIDE 22
APPENDIX
OUR GLOBAL STRATEGIC PARTNERSHIPS IN THE MONO-BRAND BUSINESS LINE YOOX GROUP PROFIT & LOSS EXCLUDING INCENTIVE PLAN COSTS FOCUS ON INCENTIVE PLAN COSTS
2014 NET REVENUE AND EBITDA QUARTERLY CONTRIBUTION
EXCHANGE RATES SHAREHOLDER STRUCTURE

SLIDE 23
OUR GLOBAL STRATEGIC PARTNERSHIPS IN THE MONO-BRAND BUSINESS LINE
Online stores “Powered by YOOX Group”
JVCo with Kering
alexanderwang.com
pomellato.com
pringlescotland.com
barbarabui.com
moncler.com
dolcegabbana.com
trussardi.com
missoni.com
armani.com
dodo.it
dsquared2.com
moschino.com
emiliopucci.com
valentino.com
stoneisland.com
marni.com
emporioarmani.com
diesel.com
jilsander.com
bikkembergs.com
brunellocucinelli.com
maisonmartinmargiela.com
albertaferretti.com
napapijri.com
giuseppezanottidesign.com
robertocavalli.com
y-3store.com
zegna.com
kartell.com
ysl.com
brioni.com bottegaveneta.com
sergiorossi.com alexandermcqueen.com
stellamccartney.com
balenciaga.com
redvalentino.com
lanvin.com OPENING SOON

SLIDE 24
YOOX GROUP PROFIT & LOSS EXCLUDING INCENTIVE PLAN COSTS
4Q 2013 2013 2014 4Q 2014 (€m)
Net Revenues 455.6 524.3 136.3 158.1growth 21.2% 15.1% 24.1% 16.0%
COGS (284.8) (336.8) (81.5) (99.9)Gross Profit 170.8 187.5 54.8 58.1
% of Net Revenues 37.5% 35.8% 40.2% 36.8%Fulfillment Excl. Incentive Plan Costs (38.0) (42.2) (9.2) (9.0)
% of Net Revenues 8.3% 8.1% 6.8% 5.7%Sales & Marketing Excl. Incentive Plan Costs (50.1) (56.6) (14.3) (17.4)
% of Net Revenues 11.0% 10.8% 10.5% 11.0%EBITDA Pre Corporate Costs Excl. Incentive Plan Costs 82.7 88.8 31.3 31.7
% of Net Revenues 18.2% 16.9% 23.0% 20.1%General & Administrative Excl. Incentive Plan Costs (33.1) (36.2) (9.4) (9.2)
% of Net Revenues 7.3% 6.9% 6.9% 5.8%Other Income / (Expenses) (2.9) (2.5) (0.3) (0.5)
% of Net Revenues 0.6% 0.5% 0.3% 0.3%EBITDA Excluding Incentive Plan Costs 46.8 50.1 21.5 22.0
% of Net Revenues 10.3% 9.5% 15.8% 13.9%
Net Income Excluding Incentive Plan Costs 15.4 14.7 9.0 9.5% of Net Revenues 3.4% 2.8% 6.6% 6.0%

SLIDE 25
FOCUS ON INCENTIVE PLAN COSTS
% of Total
% of Total
4Q 2013
4Q 2014
% of Total
% of Total 2013 2014
(€m)
Fulfillment (37.913) (42.318) (8.834) (8.963)
of which Incentive Plan Costs 0.047 (1.3%) (0.097) 7.9% 0.412 n.m. - 0.0%
Sales & Marketing (50.485) (56.562) (14.152) (17.449)
of which Incentive Plan Costs (0.342) 9.2% (0.004) 0.3% 0.157 n.m. - 0.0%
General & Administrative (36.479) (37.350) (9.948) (9.496)
of which Incentive Plan Costs (3.401) 92.0% (1.134) 91.8% (0.504) n.m. (0.310) 100.0%
Incentive Plan Costs (3.695) 100.0% (1.236) 100.0% 0.066 100.0% (0.310) 100.0%
EBITDA Reported 43.061 48.830 21.560 21.681
% of Net Revenues 9.5% 9.3% 15.8% 13.7%
Incentive Plan Costs (3.695) (1.236) 0.066 (0.310)
EBITDA Excl. Incentive Plan Costs 46.756 50.065 21.494 21.991
% of Net Revenues 10.3% 9.5% 15.8% 13.9%

SLIDE 26
2014 NET REVENUE AND EBITDA QUARTERLY CONTRIBUTION
€9.0m
€9.7m €9.4m
€22.0m €50.1m
1Q14 2Q14 3Q14 4Q14 FY2014
€126.5m
€111.5m
€128.3m
€158.1m €524.3m
Net Revenues
EBITDA Excluding Incentive Plan Costs
24% 21% 25% 30% % of Total Year
% of Total Year
1Q 2014 3Q 2014 4Q 2014 FY 2014 2Q 2014
18% 19% 19% 44%
7.3% 13.9% 9.5% 8.7% 7.1% % of Net Revenues
3Q 2014 4Q 2014 FY 2014 2Q 2014 1Q 2014

SLIDE 27
EXCHANGE RATES
2013
Period Average
2014 2013
End of Period
2014
EUR USD 1.328 1.329 1.379 1.214
% appreciation / (depreciation) vs. EUR (0.0%) 13.6%
EUR JPY 129.663 140.306 144.720 145.230
% appreciation / (depreciation) vs. EUR (7.6%) (0.4%)
EUR GBP 0.849 0.806 0.834 0.779
% appreciation / (depreciation) vs. EUR 5.4% 7.0%
EUR CNY 8.165 8.186 8.349 7.536
% appreciation / (depreciation) vs. EUR (0.3%) 10.8%
EUR RUB 42.337 50.952 45.325 72.337
% appreciation / (depreciation) vs. EUR (16.9%) (37.3%)
EUR HKD 10.302 10.302 10.693 9.417
% appreciation / (depreciation) vs. EUR (0.0%) 13.6%
EUR KRW 1,453.912 1,398.142 1,450.930 1,324.800
% appreciation / (depreciation) vs. EUR 4.0% 9.5%

SLIDE 28
Federico Marchetti 7,152,653 10.9% 4,760,697 7.7%
Management team and other stock option holders 1,260,948 1.9%
Sub-total 8,413,601 12.8% 4,760,697 7.7%
OppenheimerFunds 5,755,637 8.8% 5,755,637 9.3%
Renzo Rosso 5,456,310 8.3% 5,456,310 8.8%
Capital Research and Management Company 2,621,469 4.0% 2,621,469 4.2%
Balderton Capital 2,195,711 3.3% 2,195,711 3.5%
Federated 1,485,400 2.3% 1,485,400 2.4%
Norges Bank 1,310,398 2.0% 1,310,398 2.1%
Market 38,378,410 58.5% 38,378,410 61.9%
Total 65,616,936 100.0% 61,964,032 100.0%
SHAREHOLDER STRUCTURE
Updated as of 25 February 2015 1.The fully diluted column shows the effect on the Company’s shareholder structure calculated assuming that all the stock options granted under the Company’s stock option plans are exercised 2.Excludes Federico Marchetti 3.Includes 17,339 proprietary shares
Shareholders Current Fully Diluted 1
2
3

SLIDE 29
CONTACTS
Investor Relations
www.yooxgroup.com
BOLOGNA - MILANO - NEW YORK - PARIS - TOKYO - SHANGHAI - HONG KONG