2014 nanticoke river report card - ian - …ian.umces.edu/pdfs/ian_report_card_484.pdf · tracking...
TRANSCRIPT

2014 NANTICOKE RIVER REPORT CARD
Figure 1: Report card grades for the Nanticoke River, its creeks, and Fishing Bay in 2014. The water quality grades are based on data collected by Nanticoke Creekwatchers, volunteer citizen scientists for the Nanticoke Watershed Alliance. Additional Nanticoke River watershed data comes from the Chesapeake Bay Program, including sites monitored by the Delaware Department of Natural Resources and Environmental Control and the Maryland Department of Natural Resources. Blackwater National Wildlife Refuge provided data from their volunteer program for the Fishing Bay watershed.
There is a mix of healthy and unhealthy water quality indicators (40-59%). Quality of water in these locations tends to be fair, leading to fair habitat conditions for fish and shellfish.
Some or few water quality indicators meet desired levels (20- 39%). Quality of water in these locations tends to be poor, often leading to poor habitat conditions for fish and shellfish.
Very few or no water quality indicators meet desired levels. Quality of water in these locations tends to be very poor, most often leading to very poor habitat conditions for fish and shellfish.
C
D
F
• Scores were very similar to those in 2013.
• Water clarity scores continued to be poor for the Upper and Lower Nanticoke.
• Phosphorus scores were moderately good, while nitrogen scores were poor. Chlorophyll a scores were moderate.
River Final Grade Creeks Final Grade• Water clarity scores were good for all regions,
except for the Lower Creeks in Maryland. • Nitrogen scores were poor in all creek
regions, except for the Lower Creeks. Phosphorus scores were moderate in the Lower Creeks while good in the other creek regions. Chlorophyll a scores varied from good to moderate.
.. .
.0 5 10
Miles
±
Marshyhope Creek Headwaters
BroadCreek
Lower Creeks
Fishing Bay
B
Salisbury
Sharptown
Cambridge
Seaford
Upper Nanticoke
Lower Nanticoke
MD
DE
C
B-
+
B-
B
C+
C-
What Do the Grades Mean?
Two final grades were calculated: Rivers and Creeks. The “River” grade is a measure of the health of the mainstem of the Nanticoke River. The “Creeks” grade assesses the health of the creeks that feed into the Nanticoke. Both grades are important indicators of the overall health of the watershed.
All water quality indicators meet desired levels. Quality of water in these locations tends to be very good, most often leading to very good habitat conditions for fish and shellfish.
Most water quality indicators meet desired levels (60-79%). Quality of water in these locations tends to be good, often leading to good habitat conditions for fish and shellfish.B
AA
MDDE
VA
Nanticoke Watershed Location Within the Chesapeake Bay
BB-
Very poor (<60%)
Poor (60-70%)
Good (90-99%)
Moderate (80-90%)
Moderately poor (70-80%)
Excellent (100%)
Understanding Bacteria Scores
Inset of Seaford-area Sites
2014 Nanticoke Creekwatchers ProgramBacteria from Memorial Day to Labor Day
Seaford
Federalsburg
Nanticoke
Vienna
Sharptown
Mardela Springs
Riverton
Phillips Landing
Woodland
Canoe Launch
Boat Ramp
US-13
Middleford
Lewis Wharf
WetipquinBivalve
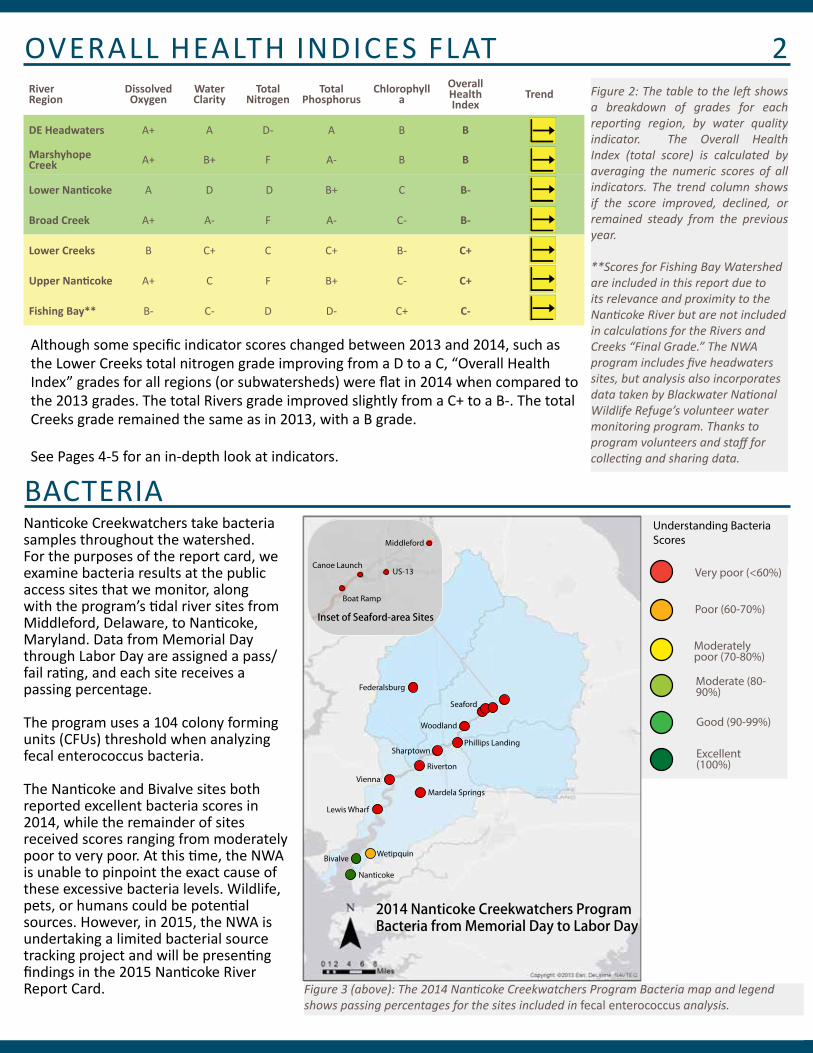
OVERALL HEALTH INDICES FLAT 2River Region
Dissolved Oxygen
Water Clarity
Total Nitrogen
Total Phosphorus
Chlorophylla
Overall HealthIndex
Trend
DE Headwaters A+ A D- A B B
Marshyhope Creek A+ B+ F A- B B
Lower Nanticoke A D D B+ C B-
Broad Creek A+ A- F A- C- B-
Lower Creeks B C+ C C+ B- C+
Upper Nanticoke A+ C F B+ C- C+
Fishing Bay** B- C- D D- C+ C-
Figure 3 (above): The 2014 Nanticoke Creekwatchers Program Bacteria map and legend shows passing percentages for the sites included in fecal enterococcus analysis.
BACTERIANanticoke Creekwatchers take bacteria samples throughout the watershed. For the purposes of the report card, we examine bacteria results at the public access sites that we monitor, along with the program’s tidal river sites from Middleford, Delaware, to Nanticoke, Maryland. Data from Memorial Day through Labor Day are assigned a pass/fail rating, and each site receives a passing percentage.
The program uses a 104 colony forming units (CFUs) threshold when analyzing fecal enterococcus bacteria.
The Nanticoke and Bivalve sites both reported excellent bacteria scores in 2014, while the remainder of sites received scores ranging from moderately poor to very poor. At this time, the NWA is unable to pinpoint the exact cause of these excessive bacteria levels. Wildlife, pets, or humans could be potential sources. However, in 2015, the NWA is undertaking a limited bacterial source tracking project and will be presenting findings in the 2015 Nanticoke River Report Card.
Figure 2: The table to the left shows a breakdown of grades for each reporting region, by water quality indicator. The Overall Health Index (total score) is calculated by averaging the numeric scores of all indicators. The trend column shows if the score improved, declined, or remained steady from the previous year.
**Scores for Fishing Bay Watershed are included in this report due to its relevance and proximity to the Nanticoke River but are not included in calculations for the Rivers and Creeks “Final Grade.” The NWA program includes five headwaters sites, but analysis also incorporates data taken by Blackwater National Wildlife Refuge’s volunteer water monitoring program. Thanks to program volunteers and staff for collecting and sharing data.
Although some specific indicator scores changed between 2013 and 2014, such as the Lower Creeks total nitrogen grade improving from a D to a C, “Overall Health Index” grades for all regions (or subwatersheds) were flat in 2014 when compared to the 2013 grades. The total Rivers grade improved slightly from a C+ to a B-. The total Creeks grade remained the same as in 2013, with a B grade.
See Pages 4-5 for an in-depth look at indicators.
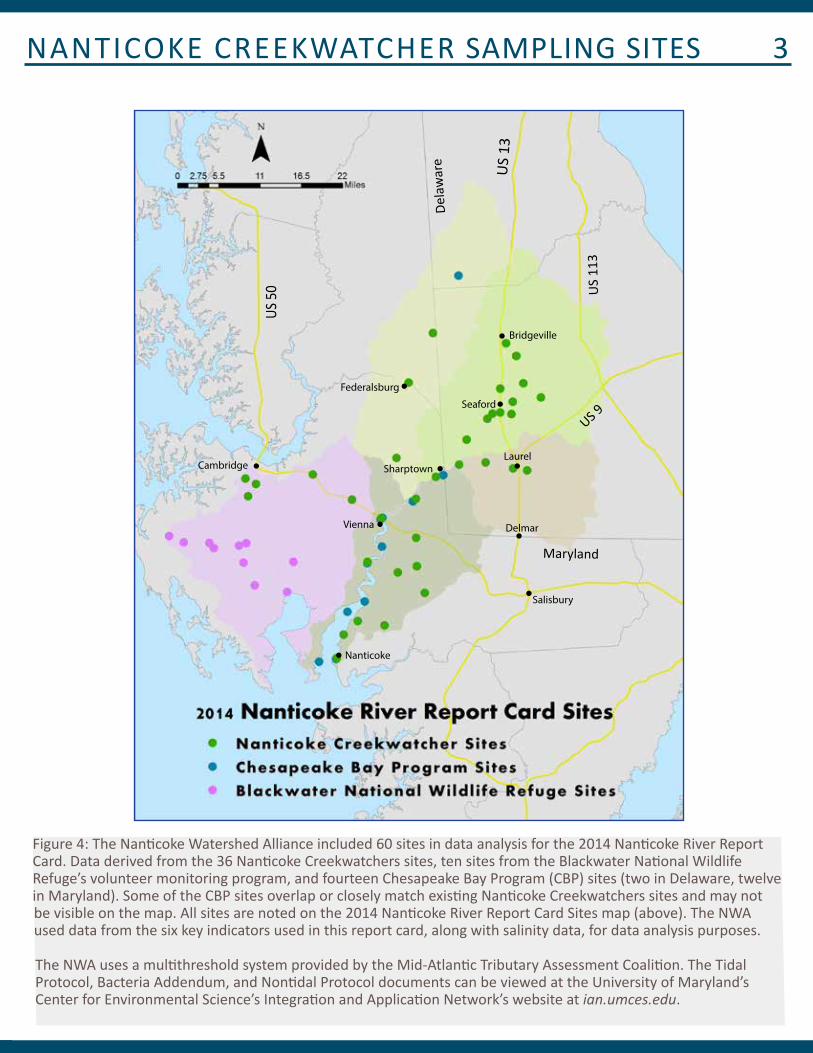
NANTICOKE CREEKWATCHER SAMPLING SITES 3
US 5
0
Dela
war
e
Maryland
US 9
US
113
US
13Vienna
Salisbury
Cambridge
Seaford
Bridgeville
Nanticoke
Federalsburg
LaurelSharptown
Delmar
Figure 4: The Nanticoke Watershed Alliance included 60 sites in data analysis for the 2014 Nanticoke River Report Card. Data derived from the 36 Nanticoke Creekwatchers sites, ten sites from the Blackwater National Wildlife Refuge’s volunteer monitoring program, and fourteen Chesapeake Bay Program (CBP) sites (two in Delaware, twelve in Maryland). Some of the CBP sites overlap or closely match existing Nanticoke Creekwatchers sites and may not be visible on the map. All sites are noted on the 2014 Nanticoke River Report Card Sites map (above). The NWA used data from the six key indicators used in this report card, along with salinity data, for data analysis purposes.
The NWA uses a multithreshold system provided by the Mid-Atlantic Tributary Assessment Coalition. The Tidal Protocol, Bacteria Addendum, and Nontidal Protocol documents can be viewed at the University of Maryland’s Center for Environmental Science’s Integration and Application Network’s website at ian.umces.edu.

NUTRIENTS IN 2014 4
0
5
10
15
20
25
30
35
40
45
50
Scor
e fr
om 0
-50:
Hig
her I
s Bet
ter
Total Nitrogen Average Scores: 2008-2014
2008-2012
2013
2014
LowerNanticoke
UpperNanticoke
RIVER
DEHeadwaters
BroadCreek
MarshyhopeCreek
LowerCreeks
CREEKS
Fishing Bay
F D D - F F C D
0
10
20
30
40
50
60
70
80
90
100
Scor
e fr
om 0
- 100
: Hig
her I
s Bet
ter
Total Phosphorus Average Scores: 2008-2014
2008-2012
2013
2014
LowerNanticoke
UpperNanticoke
DEHeadwaters
BroadCreek
MarshyhopeCreek
LowerCreeks
Fishing Bay
RIVER CREEKS
AA CB- AA AA- AA- + D -
Although necessary for plant growth and fertilization, in excessive amounts, nitrogen and phosphorus cause a number of water quality issues, including algal blooms, low dissolved oxygen, and poor water clarity. Reducing excessive nitrogen and phosphorus amounts by applying fertilizers only as needed, at the proper time of the year, and in the correct amounts, limiting runoff directed to storm drains and waterways by diverting it or temporarily holding it, and reducing the amount of hard surfaces can make a difference.
Nitrogen and phosphorus are key indicators, as these nutrients are major pollution sources in the Nanticoke River watershed (and throughout the Chesapeake Bay watershed).
In spite of regular, heavy rains during the summer of 2014, total nitrogen scores improved on the Five Year average and on 2013 scores in many subwatersheds, most notably in the Lower Creeks. However, nitrogen continues to be the poorest indicator, with grades continuing to fall within the F to D range for the most part. Also, the 2014 season saw increased nitrogen in the Fishing Bay watershed.
Conversely, phosphorus scores were mostly flat, with the Lower Creeks scoring much worse than in 2013. As the report card has shown in previous years, Fishing Bay continues to report
0
10
20
30
40
50
60
70
80
90
100
Scor
e fr
om 0
-100
: Hig
her I
s Bet
ter
Chlorophyll a Average Scores: 2008 and 2014
2008*
2014
LowerNanticoke
UpperNanticoke
DEHeadwaters
BroadCreek
MarshyhopeCreek
LowerCreeks
Fishing Bay
RIVER CREEKS
CC- C- C+B B B-
highly excessive phosphorus levels.
For the first time since 2008, Nanticoke Creekwatchers collected chlorophyll a samples during the season. Chlorophyll
Figures 5-7 show total nitrogen, total phosphorus, and chlorophyll a scores for each subwatershed. Five-year average scores (2008-2012), 2013 scores, and 2014 scores are provided when available. Note that the nitrogen graph only shows 0-50, instead of 0-100, as do the other charts.*Figure 7: The program did not measure chlorophyll a from 2009-2013.
a reflects the amount of algae present in the water, which helps us view a more complete picture of nutrient-related water quality. All scores were poorer in 2014 than they had been in 2008, although fewer sites were included in chlorophyll a testing in 2008 than in 2014. Broad Creek, which tends to have the poorest nitrogen scores, and the Upper Nanticoke reported the highest amounts of algae of all subwatersheds.
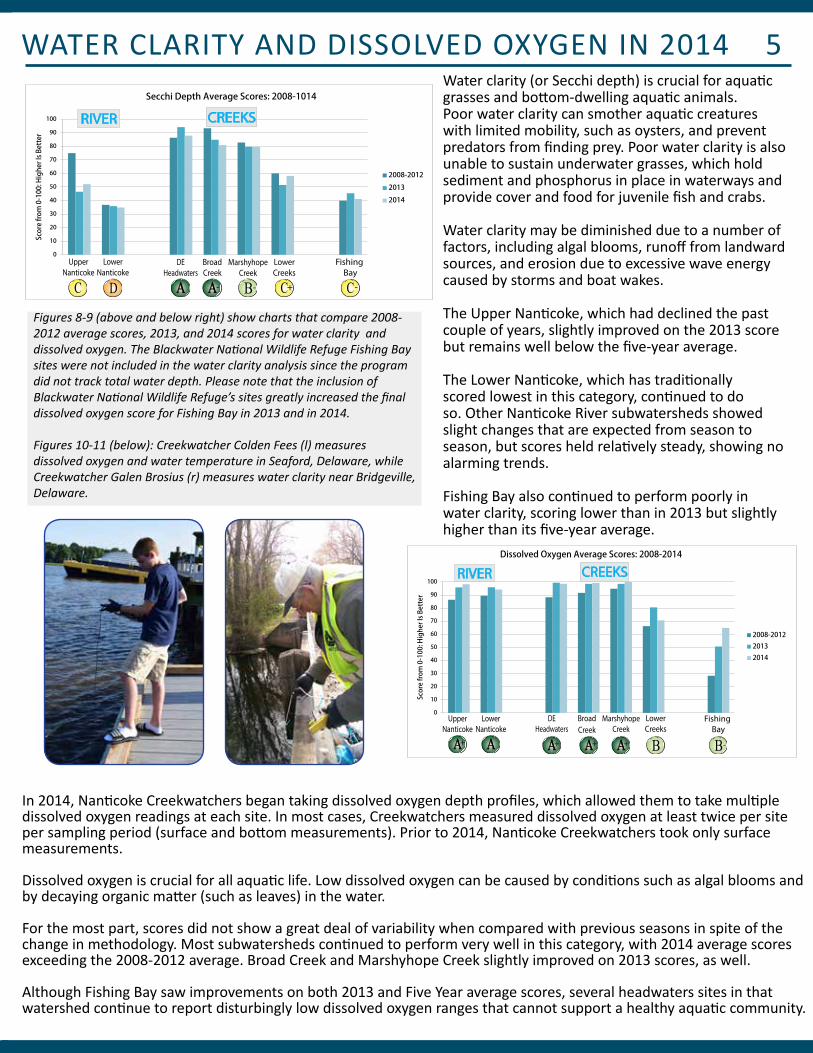
WATER CLARITY AND DISSOLVED OXYGEN IN 2014 5Water clarity (or Secchi depth) is crucial for aquatic grasses and bottom-dwelling aquatic animals. Poor water clarity can smother aquatic creatures with limited mobility, such as oysters, and prevent predators from finding prey. Poor water clarity is also unable to sustain underwater grasses, which hold sediment and phosphorus in place in waterways and provide cover and food for juvenile fish and crabs.
Water clarity may be diminished due to a number of factors, including algal blooms, runoff from landward sources, and erosion due to excessive wave energy caused by storms and boat wakes.
The Upper Nanticoke, which had declined the past couple of years, slightly improved on the 2013 score but remains well below the five-year average.
The Lower Nanticoke, which has traditionally scored lowest in this category, continued to do so. Other Nanticoke River subwatersheds showed slight changes that are expected from season to season, but scores held relatively steady, showing no alarming trends.
Fishing Bay also continued to perform poorly in water clarity, scoring lower than in 2013 but slightly higher than its five-year average.
0
10
20
30
40
50
60
70
80
90
100
Scor
e fr
om 0
-100
: Hig
her I
s Be
tter
Secchi Depth Average Scores: 2008-1014
2008-2012
2013
2014
LowerNanticoke
UpperNanticoke
DEHeadwaters
BroadCreek
MarshyhopeCreek
LowerCreeks
Fishing Bay
RIVER CREEKS
C D AA B-AA- C+ C-
0
10
20
30
40
50
60
70
80
90
100
Scor
e fr
om 0
-100
: Hig
her I
s Be
tter
Dissolved Oxygen Average Scores: 2008-2014
2008-2012
2013
2014
LowerNanticoke
UpperNanticoke
DEHeadwaters
BroadCreek
MarshyhopeCreek
LowerCreeks
Fishing Bay
RIVER CREEKS
AAAA+ AA+AA+AA+ B B-
Figures 8-9 (above and below right) show charts that compare 2008-2012 average scores, 2013, and 2014 scores for water clarity and dissolved oxygen. The Blackwater National Wildlife Refuge Fishing Bay sites were not included in the water clarity analysis since the program did not track total water depth. Please note that the inclusion of Blackwater National Wildlife Refuge’s sites greatly increased the final dissolved oxygen score for Fishing Bay in 2013 and in 2014.
Figures 10-11 (below): Creekwatcher Colden Fees (l) measures dissolved oxygen and water temperature in Seaford, Delaware, while Creekwatcher Galen Brosius (r) measures water clarity near Bridgeville, Delaware.
In 2014, Nanticoke Creekwatchers began taking dissolved oxygen depth profiles, which allowed them to take multiple dissolved oxygen readings at each site. In most cases, Creekwatchers measured dissolved oxygen at least twice per site per sampling period (surface and bottom measurements). Prior to 2014, Nanticoke Creekwatchers took only surface measurements.
Dissolved oxygen is crucial for all aquatic life. Low dissolved oxygen can be caused by conditions such as algal blooms and by decaying organic matter (such as leaves) in the water.
For the most part, scores did not show a great deal of variability when compared with previous seasons in spite of the change in methodology. Most subwatersheds continued to perform very well in this category, with 2014 average scores exceeding the 2008-2012 average. Broad Creek and Marshyhope Creek slightly improved on 2013 scores, as well.
Although Fishing Bay saw improvements on both 2013 and Five Year average scores, several headwaters sites in that watershed continue to report disturbingly low dissolved oxygen ranges that cannot support a healthy aquatic community.
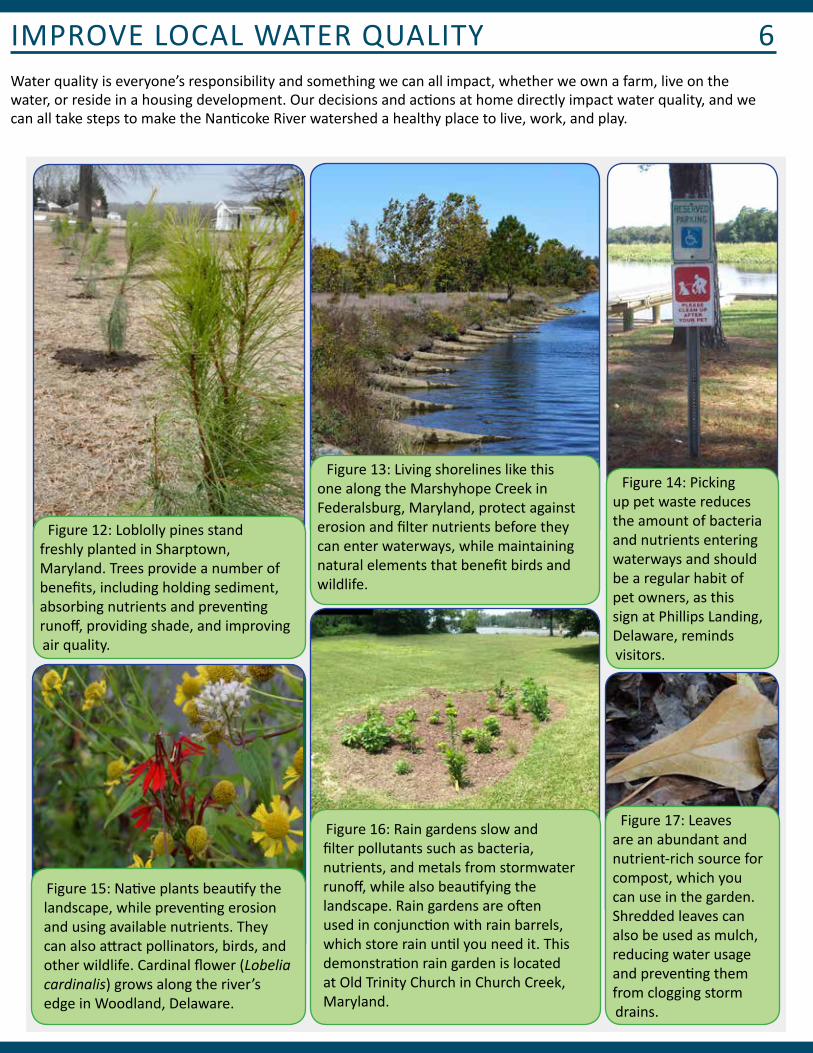
Water quality is everyone’s responsibility and something we can all impact, whether we own a farm, live on the water, or reside in a housing development. Our decisions and actions at home directly impact water quality, and we can all take steps to make the Nanticoke River watershed a healthy place to live, work, and play.
IMPROVE LOCAL WATER QUALITY 6
Figure 12: Loblolly pines stand freshly planted in Sharptown, Maryland. Trees provide a number of benefits, including holding sediment, absorbing nutrients and preventing runoff, providing shade, and improving air quality.
Figure 15: Native plants beautify the landscape, while preventing erosion and using available nutrients. They can also attract pollinators, birds, and other wildlife. Cardinal flower (Lobelia cardinalis) grows along the river’s edge in Woodland, Delaware.
Figure 16: Rain gardens slow and filter pollutants such as bacteria, nutrients, and metals from stormwater runoff, while also beautifying the landscape. Rain gardens are often used in conjunction with rain barrels, which store rain until you need it. This demonstration rain garden is located at Old Trinity Church in Church Creek, Maryland.
Figure 13: Living shorelines like this one along the Marshyhope Creek in Federalsburg, Maryland, protect against erosion and filter nutrients before they can enter waterways, while maintaining natural elements that benefit birds and wildlife.
Figure 14: Picking up pet waste reduces the amount of bacteria and nutrients entering waterways and should be a regular habit of pet owners, as this sign at Phillips Landing, Delaware, reminds visitors.
Figure 17: Leaves are an abundant and nutrient-rich source for compost, which you can use in the garden. Shredded leaves can also be used as mulch, reducing water usage and preventing them from clogging storm drains.
Richard BallGalen BrosiusBryan BurkholderSandi DewColden FeesDebbie FeesJordan GisdorfSusan Good Jeff Hampton Dan Houghtaling Ric Johansen Amy JonesHope JonesRichard Julian Troy Julian Alan Kamauff Bob Kijewski
Bonnie Kijewski John King Pat MaherRon MaherCyrus Marter Alice MohrmanMike NobleRachel Ostroski Mike PretlKatharine Sarrafian Bob SellersRachael ShedakerStan ShedakerSusan SkirtaFred SponsellerHoward VandersliceFrayser Williamson
John Williamson Nan Zamorski Rick Zamorski
Thanks also our Chesapeake Conservation Corps Volunteers, Amanda Anastasia and Joanne (JoJo) Maturana, for their extensive work on behalf of the Creekwatchers program.
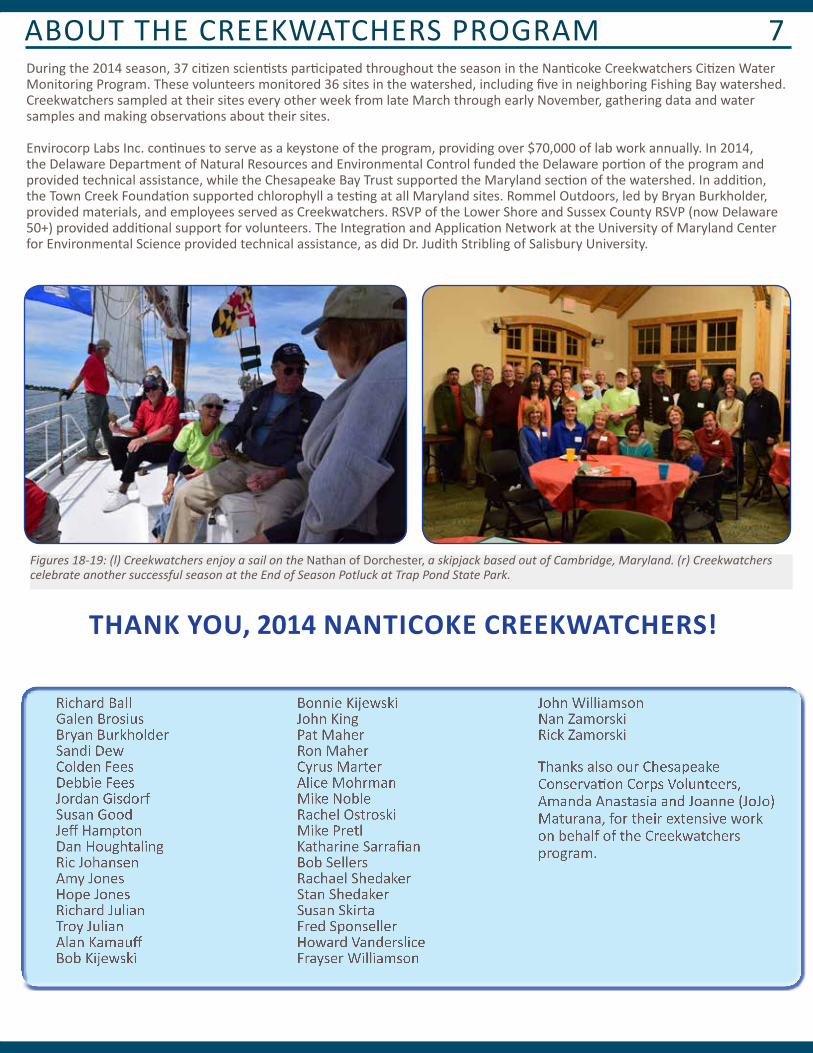
During the 2014 season, 37 citizen scientists participated throughout the season in the Nanticoke Creekwatchers Citizen Water Monitoring Program. These volunteers monitored 36 sites in the watershed, including five in neighboring Fishing Bay watershed. Creekwatchers sampled at their sites every other week from late March through early November, gathering data and water samples and making observations about their sites.
Envirocorp Labs Inc. continues to serve as a keystone of the program, providing over $70,000 of lab work annually. In 2014, the Delaware Department of Natural Resources and Environmental Control funded the Delaware portion of the program and provided technical assistance, while the Chesapeake Bay Trust supported the Maryland section of the watershed. In addition, the Town Creek Foundation supported chlorophyll a testing at all Maryland sites. Rommel Outdoors, led by Bryan Burkholder, provided materials, and employees served as Creekwatchers. RSVP of the Lower Shore and Sussex County RSVP (now Delaware 50+) provided additional support for volunteers. The Integration and Application Network at the University of Maryland Center for Environmental Science provided technical assistance, as did Dr. Judith Stribling of Salisbury University.
ABOUT THE CREEKWATCHERS PROGRAM 7
Figures 18-19: (l) Creekwatchers enjoy a sail on the Nathan of Dorchester, a skipjack based out of Cambridge, Maryland. (r) Creekwatchers celebrate another successful season at the End of Season Potluck at Trap Pond State Park.
THANK YOU, 2014 NANTICOKE CREEKWATCHERS!
The Nanticoke Watershed Alliance would like to thank the following organizations for their contributions and support of the Creekwatchers program during the 2014 season:
Project Supervisor/AuthorBeth Wasden
Published: July 2015Printed on post-consumer recycled paper
The Nanticoke Watershed Alliance is a consortium of non-profit organizations, local businesses, industry, state and federal agencies that work together to ensure a bright future for the iconic Nanticoke River. The NWA is a venue for sharing information and creating open and honest dialogue around river issues and potential solutions. Some of our key efforts include:
• Monitoring the health of the Nanticoke River system. • Providing outreach and workshops to watershed residents.• Educating middle schoolers in schools and on field trips.• Offering workshops to teachers in Delaware and in Maryland.• Organizing river clean-ups, tree plantings, and other events.• Encouraging recreational usage of and improving public
access to the river and its tributaries.
The NWA strives to support the local community through service projects and other outreach events. If you are interested in joining the NWA in making the Nanticoke Watershed a cleaner, healthier, and more beautiful place to live, contact us online at www.nanticokeriver.org.
Support the NWA! • Join our team of dedicated volunteers and help with
water monitoring, restoration and clean-ups, outreach efforts, and more.
• Make a tax-deductible donation to support our work for the river and its communities.
• Become an NWA partner. Businesses and organizations can join the NWA’s “Partners In Conservation” program and become a part of ongoing dialogue associated with the conservation of the Nanticoke River.
• Say hello at our office or at outreach events. Our office is located in Vienna, Maryland, and is open from 9:00 am-4:00 pm, Mondays through Fridays.
For more information, visit www.nanticokeriver.org
ABOUT THE NWA 8
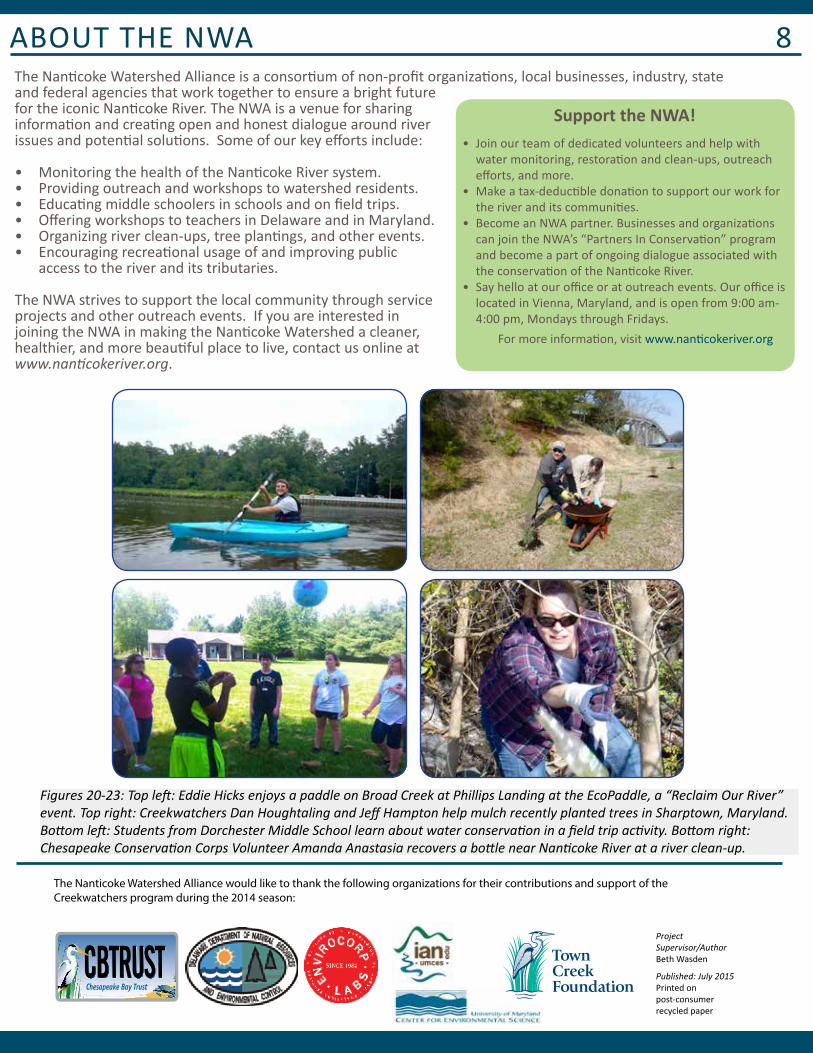
Figures 20-23: Top left: Eddie Hicks enjoys a paddle on Broad Creek at Phillips Landing at the EcoPaddle, a “Reclaim Our River” event. Top right: Creekwatchers Dan Houghtaling and Jeff Hampton help mulch recently planted trees in Sharptown, Maryland. Bottom left: Students from Dorchester Middle School learn about water conservation in a field trip activity. Bottom right: Chesapeake Conservation Corps Volunteer Amanda Anastasia recovers a bottle near Nanticoke River at a river clean-up.