2014 university of kentucky consolidated statements · pdf filevisit from the southern...
TRANSCRIPT


University of Kentucky A Component Unit of the Commonwealth of Kentucky
Financial Statements Years Ended June 30, 2014 and 2013
TABLE OF CONTENTS
Message from the President i
Financial Statements
Supplementary Information
Governing Board
Independent Auditor’s Report 1
Management’s Discussion and Analysis 4
Statements of Net Position 18
Statements of Revenues, Expenses and Changes in Net Position 19
Statements of Cash Flows 20
Notes to Financial Statements 21
Required Supplementary Information 58

MESSAGE FROM THE PRESIDENT
Three years ago, before a gathering of faculty, staff, alumni, friends, family and stakeholders, we declared in “the cadence of a common voice that we are resolute in seeing that the University’s promise will endure.”
Thoughtfully, but with a fierce sense of urgency, we have embarked upon a remarkable revitalization of our campus, a place that puts students first and that gives our faculty and staff the tools they need to continue and expand their path-breaking work.
Our success has been the result of mutual interest in our future, an honest and open dialogue that included the voices of all university and community constituents, and the persistence of a deeply devoted Wildcat family.
Two independent and external evaluations, in particular, underscore the leadership and vision provided by the Board of Trustees; affirm our efforts; and demonstrate our progress.
Reaffirming our course, UK executed a successful reaffirmation visit from the Southern Association of Colleges and Schools Commission on Colleges (SACSCOC) in April 2013.
The second affirmation comes from conclusions reached by Standard and Poor’s Rating Services (S&P) and Moody’s Investors Service in February 2014 – two independent examinations of our financial strength.
S&P revised its outlook of the University’s financial condition from “stable” to “positive” and Moody’s analysis maintains our current strong credit rating – even as much of higher education has been given a “negative” outlook. The S&P also cited as strengths our growth in enrollment, health care and financial management.
The praise we received from SACSCOC and the rating agencies – made possible through the work of the UK family – is evident across campus:
• At 29,385 students, UK broke its enrollment record for the fourth year in a row; and enrolled a more selective and higher yield class in research and professional practice graduate programs.
• The mean ACT Composite for the Fall 2013 first-year class was 25.3 and included 417 students from the Governor’s School for the Arts/Governor’s Scholars Program.
• The first-year class included 105 National Merit, National Achievement and National Hispanic Scholars, placing UK in the top 10 of public universities with these scholars.
• In Fall 2013, minority and international student enrollment accounted for 19 percent of the total headcount with a record 1,658 African American and 607 international undergraduate students.
• In Fall 2014, UK experienced an increase of more than one percentage point in our first-to-second year retention rates and significant, multi-percentage-point increases in our third- and fourth-year rates.
• In 2013-2014, UK awarded 6,095 degrees including 888 research and professional doctorates.
• In FY 2013-14, UK received $259.3 million in external research grants and contracts -- signifying that we are a major player among research institutions in the country.
• UK completed a historic year in philanthropy, securing records in both cash receipts of $105 million, topping $100 million for the first time, and in new commitments received of over $145 million. UK received over 91,000 gifts from 53,724 donors.
To build on our progress as one university, we drafted a budget that invests in our priorities by:
• Holding the institution’s annual tuition and fee increase to five percent – extending our goal of maintaining affordability and access.
• Supporting our students with more than $11 million in additional financial aid and scholarships.
i

• Investing and rewarding our faculty and staff with a two percent merit salary pool – building on the five percent merit pool in the previous year.
The University’s public/private partnership with EdR continues to make progress. In August, we opened the doors to Champions Court I & II, Woodland Glen I & II and Haggin Hall, adding nearly 2,400 modern resident beds and 100 new academic learning spaces.
Currently, Phases II-B and II-C are underway. In total, the completed and approved projects will add 5,700 beds across 12 facilities by Fall 2016. The investment thus far – nearly $348 million – is transforming the way we house, educate and build community for our students.
Thanks to the support of the state lawmakers, donors, private partners and our strategic priorities, we are making progress on important capital projects that further enhance our campus community and institutional mission:
The construction of three facilities authorized by House Bill 7 is underway: a $65 million renovation and expansion of the Gatton College of Business and Economics; a new $112 million Academic Science Building; and the $120 million renovation of Commonwealth Stadium.
Three facilities authorized during the 2014 General Session: a $175 million renovation and expansion of the Student Center; the $150 million continued fit-up of UK HealthCare’s Pavilion A; and $65 million for the revitalization of the College of Law.
We are also self-financing a $22 million investment in various projects for the College of Fine Arts and a $45 million renovation and expansion of the Nutter Training Center.
In total, over the last three years, UK has self-financed more than $1 billion in capital investment to enhance the academic, research, service and health care missions of the institution while maintaining a strong balance sheet and not placing a financial burden on the state.
Our investment in a modern campus environment - one that stimulates collaboration and creativity – is focused on building communities that benefit and support the UK family. With that philosophy as a guiding doctrine, we entered into a new partnership for campus dining services.
At the end of the Spring 2014 semester, the University of Kentucky negotiated a 15-year, nearly $250 million contract with Aramark for dining. The partnership will improve service, provide healthier food options at a lower cost, invest millions in facilities,
enhance our commitment to locally sourced food and support employee development.
We continued to make progress on two important initiatives that speak to our vision and how we will make it a reality. The Financial Model of Accountability and the “see tomorrow.” Strategic Plan involved extensive campus conversation throughout the respective planning processes.
As we look toward our sesquicentennial, we can reflect with pride on what we accomplished together, and we can confront – with vigor – that which we still must accomplish. Building on the progress in our research enterprise, we must – and we will – encourage innovative approaches to complex challenges. Research is at the center of our institution, and it calls upon us to answer still lingering questions while daring to pioneer the questions yet asked.
Together, as a UK family, we will build collaborative communities on campus that – in entrepreneurial ways – continue their dedicated service to the communities we touch. A robust environment for creative scholarship and educating our world’s next generation of pioneers will be the cornerstone of our work.
Because of the lives we touch and teach, we remain anchored in our mission to Kentucky – to educate, innovate and serve. To be sure, our complex, multi-faceted mission looks different today in many ways than it did in 1865. However, our sense of responsibility to our communities on campus and across the region is resolute. The mission has evolved and grown. The vision of service to our Commonwealth and the world beyond remains the same. They remain our compass – the soul of the University of Kentucky.
Eli Capilouto President
ii

Independent Auditor’s Report
Board of Trustees University of Kentucky Lexington, Kentucky
Report on the Financial Statements
We have audited the accompanying basic financial statements of the University of Kentucky (University), a component unit of the Commonwealth of Kentucky, which are comprised of statements of net position as of June 30, 2014 and 2013, and statements of revenues, expenses and changes in net position and of cash flows and the related notes to the basic financial statements for the years ended June 30, 2014 and 2013, as listed in the table of contents.
Management’s Responsibility for the Financial Statements
Management is responsible for the preparation and fair presentation of these financial statements in accordance with accounting principles generally accepted in the United States of America; this includes the design, implementation and maintenance of internal control relevant to the preparation and fair presentation of financial statements that are free from material misstatement, whether due to fraud or error.
Auditor’s Responsibility
Our responsibility is to express an opinion on these financial statements based on our audits. We did not audit the financial statements of Kentucky Medical Services Foundation, Inc. (KMSF), a blended component unit of the University, which statements reflect total assets of $134,891 and $113,368 as of June 30, 2014 and 2013, respectively, and total revenues of $230,289 and $207,099, respectively, for the years then ended (dollars in thousands). Those statements were audited by other auditors whose report thereon has been furnished to us, and our opinion, insofar as it relates to the amounts included for KMSF, is based solely on the report of the other auditors. We conducted our audits in accordance with auditing standards generally accepted in the United States of America and the standards applicable to financial audits contained in Government Auditing Standards, issued by the Comptroller General of the United States. Those standards require that we plan and perform the audit to obtain reasonable assurance about whether the financial statements are free from material misstatement. The financial statements of KMSF, which are included in the University’s reporting entity, were not audited in accordance with Government Auditing Standards.
1
Board of Trustees University of Kentucky Page 2
An audit involves performing procedures to obtain audit evidence about the amounts and disclosures in the financial statements. The procedures selected depend on the auditor’s judgment, including the assessment of the risks of material misstatement of the financial statements, whether due to fraud or error. In making those risk assessments, the auditor considers internal control relevant to the University’s preparation and fair presentation of the financial statements in order to design audit procedures that are appropriate in the circumstances but not for the purpose of expressing an opinion on the effectiveness of the University’s internal control. Accordingly, we express no such opinion. An audit also includes evaluating the appropriateness of accounting policies used and the reasonableness of significant accounting estimates made by management, as well as evaluating the overall presentation of the financial statements.
We believe the audit evidence we have obtained is sufficient and appropriate to provide a basis for our audit opinions.
Opinions
In our opinion, based on our audits and the reports of other auditors, the financial statements referred to above present fairly, in all material respects, the financial position of the University as of June 30, 2014 and 2013, and the changes in its financial position and its cash flows for the years then ended in accordance with accounting principles generally accepted in the United States of America.
Emphasis of Matter
As discussed in Note 1 to the financial statements, during 2014, the University implemented the provisions of Governmental Accounting Standards Board No. 65, Items Previously Reported as Assets and Liabilities, which changed its method of accounting for bond issuance costs through retroactive application to prior years’ financial statements. Our opinion is not modified with respect to this matter.
Other Matters
Required Supplementary Information
Accounting principles generally accepted in the United States of America require that the management’s discussion and analysis and postemployment and long-term disability benefit plan information listed in the table of contents be presented to supplement the basic financial statements. Such information, although not part of the basic financial statements, is required by the Governmental Accounting Standards Board, who considers it to be an essential part of financial reporting for placing the basic financial statements in an appropriate operational, economic or historical context. We have applied certain limited procedures to the required supplementary information in accordance with auditing standards generally accepted in the United States of America, which consisted of inquiries of management about the methods of preparing the information and comparing the information for consistency with management’s responses to our inquiries, the basic financial statements and other knowledge we obtained during our audit of the basic financial statements. We do not express an opinion or provide any assurance on the information because the limited procedures do not provide us with sufficient evidence to express an opinion or provide any assurance.
2

Board of Trustees University of Kentucky Page 3
Other Information
Our audits were conducted for the purpose of forming an opinion on the basic financial statements as a whole. The governing board listing and the message from the president as listed in the table of contents are presented for purposes of additional analysis and are not a required part of the basic financial statements. Such information has not been subjected to the auditing procedures applied in the audits of the basic financial statements, and accordingly, we do not express an opinion or provide any assurance on it.
Other Reporting Required by Government Auditing Standards
In accordance with Government Auditing Standards, we have also issued our report dated October 3, 2014, on our consideration of the University’s internal control over financial reporting and our tests of its compliance with certain provisions of laws, regulations, contracts and grant agreements and other matters. The purpose of that report is to describe the scope of our testing of internal control over financial reporting and compliance and the results of that testing and not to provide an opinion on the internal control over financial reporting or on compliance. That report is an integral part of an audit performed in accordance with Government Auditing Standards in considering the University’s internal control over financial reporting and compliance.
Louisville, Kentucky October 3, 2014
3
Management’s Discussion and Analysis
The following Management’s Discussion and Analysis (MD&A) provides an overview of the financial position and activities of the University of Kentucky (the University or UK) and its affiliated corporations for the years ended June 30, 2014 and 2013. Management has prepared this discussion, and suggests that it be read in conjunction with the financial statements and the notes appearing in this report.
About the University of Kentucky
Mission. The University of Kentucky is a public, land-grant university dedicated to improving people's lives through excellence in education, research and creative work, service and health care. As Kentucky's flagship institution, the University plays a critical leadership role by promoting diversity, inclusion, economic development and human well-being.
Vision. The University of Kentucky will be one of the nation's 20 best public research universities.
Values. The University of Kentucky is guided by its core values:
Integrity Excellence Mutual respect and human dignity Diversity and inclusion Academic freedom Personal and institutional responsibility and accountability Shared governance A sense of community Work-life sensitivity Civic engagement Social responsibility
Background. Under provisions of the federal Morrill Land-Grant Colleges Act (1862), Kentucky State Agricultural and Mechanical College was established in 1865 as part of Kentucky University (now Transylvania University). The College separated from Kentucky University in 1878 and was established on a 52 acre site (the University’s current location) donated by the city of Lexington. In 1908, the College was re-named the State University, Lexington, Kentucky. In 1916 it became the University of Kentucky.
According to the Kentucky Revised Statutes (KRS) 164.125(2):
In carrying out its statewide mission, the University of Kentucky shall conduct statewide research and provide statewide services, including, but not limited to, agricultural research and extension services, industrial and scientific research, industrial technology extension services to Kentucky employers and research related to the doctoral, professional and postdoctoral programs offered within the University. The University may establish and operate centers and utilize state appropriations and other resources to carry out the necessary research and service activities throughout the state. The University may enter into joint research and service activities with other universities in order to accomplish its statewide mission.
In 1997, the Kentucky General Assembly reformed the state’s public system of colleges and universities. According to the Kentucky Postsecondary Education Improvement Act of 1997:
The University of Kentucky is mandated to become a major comprehensive research institution ranked nationally in the top twenty public universities by 2020.
At its December 2005 meeting, the UK Board of Trustees approved the Top 20 Business Plan.
4

The University’s Strategic Plan for 2009-2014 was adopted by the UK Board of Trustees at its June 2009 meeting. The Strategic Plan is designed to measure the University’s progress by establishing specific goals for teaching, research and service at the department, college and university level. The Strategic Plan established five goals:
Prepare Students for Leading Roles in an Innovation-driven Economy and Global Society Promote Research and Creative Work to Increase the Intellectual, Social, and Economic Capital of
Kentucky and the World Beyond Its Borders Develop the Human and Physical Resources of the University to Achieve the Institution’s Top 20 Goals Promote Diversity and Inclusion Improve the Quality of Life of Kentuckians through Engagement, Outreach and Service
Today, the University continues to focus on the core academic mission of the institution and the original tenets of the Morrill Land-Grant Colleges Act (1862). For nearly 150 years, we have been a beacon for Kentucky, shining bright a path to prosperity and economic competitiveness. We remain steadfast in our covenant with the Commonwealth – to produce graduates prepared for a 21st century economy; to conduct research that extends the boundaries of scientific discovery; and to render service and patient care that uplifts our community and region.
Work is currently underway to develop the Strategic Plan for 2014-2020 “see tomorrow”. More than 100 faculty, staff and students have been appointed to committees and working groups to help develop the Strategic Plan which will support the vision to be a nationally recognized public institution with global reach and a commitment to the Commonwealth. Following the Board of Trustees approval, an implementation committee will be appointed to monitor the strategies, tactics and metrics within the plan to ensure smooth implementation.
The University is identified as a “Research University (very high research activity)” by the Carnegie Commission on Higher Education. There are 108 such institutions in the United States (out of approximately 3,600 colleges and universities).
The University is accredited by the Commission on Colleges (CoC) of the Southern Association of Colleges and Schools (SACS). This has been re-affirmed at approximately 10-year intervals since 1915, with the next accreditation review scheduled to begin in 2022. In addition, several degree programs and individual units are accredited by agencies appropriate to specific professions or fields.
Students. In Fall 2013, the University had 29,385 undergraduate, graduate, and professional students. They represent all 120 Kentucky counties, every state in the U.S. and over 100 countries. Enrollment has increased over 2,800 students (11%) since Fall 2004.
5


Outreach. As Kentucky’s flagship, land-grant university, UK engages citizens and communities across the state in a myriad of ways, including extension offices in all 120 Kentucky counties; continuing education opportunities for teachers, lawyers and health care providers; clinics providing legal, pharmaceutical and health care assistance; and a multitude of research efforts aimed at Kentucky’s most difficult problems in economic development, health care, infrastructure and education.
Medical Centers. UK HealthCare, a trademarked brand used by the University of Kentucky for its health care services, is uniquely equipped to provide advanced subspecialty care to the people of Kentucky. The academic medical center and health system provides patient care on par – in terms of both volume and complexity – with the nation’s top 25% of academic medical centers. In October 2013, UK HealthCare was named a “Rising Star” by the University HealthSystem Consortium (UHC) for gains made in quality, safety, efficiency and equity of care. This and other notable achievements are listed at http://ukhealthcare.uky.edu/quality/awards/.
UK HealthCare Hospital System operates two hospital units under one Joint Commission Accreditation and two licenses in addition to ambulatory services. The major service units include Albert B. Chandler Hospital, Good Samaritan Hospital and the Kentucky Clinic. The hospitals have a combined total of 825 licensed beds with an average daily census of 670 patients. On a monthly basis, the system provides over 1,200 inpatient surgeries, 1,280 outpatient surgeries, 29,360 radiology procedures, 7,595 emergency department visits and 98,335 hospital based outpatient clinic visits.
Under a management contract entered into with the Kentucky Cabinet for Health and Family Services (CHFS), UK HealthCare Hospital System also operates and manages Eastern State Hospital, a 300,000 square-foot facility located on the university’s Coldstream Research Campus. The new psychiatric facility, opened in September 2013, provides a modern setting for both acute and long-term inpatient psychiatric treatment for adults living within Fayette County and the 50 surrounding counties.
UK HealthCare’s Markey Cancer Center remains the state’s only cancer center designated by the National Cancer Institute (NCI), which reflects UK’s position as a frontrunner in cancer treatment and research. UK HealthCare is one of an elite group of only 22 medical centers in the United States that have NCI designation, a federally funded Center on Aging, and a highly prized Clinical and Translational Science Award grant (CTSA).
UK HealthCare’s dramatic growth within the last decade is in large part the result of a commitment to support the state’s overall system of care by working hand-in-hand with local community providers to bring specialty care closer to the patient. These relationships take on different dimensions in each locality (management agreements, affiliate networks, outreach, etc.) and support keeping less acute care in the local community and smoothing the process for more complex, serious cases to be treated in UK HealthCare’s Lexington facilities. The goal is better care at all points of the continuum.
Libraries. UK operates a nationally recognized research library system, with the capstone being the world-class William T. Young Library. UK’s book endowment is the largest among public universities. Its library network and technology provide extraordinary service to students in the colleges of Medicine, Law, Engineering, Fine Arts and other programs. Meanwhile, students, faculty and Kentucky residents can use UK Libraries’ advanced technology to access the most up-to-date information from online journals, government publications and private studies.
Financial Highlights The University’s overall financial position remains fiscally sound with assets of $4.49 billion, liabilities of $1.34 billion and deferred inflows of resources of $3.5 million as of June 30, 2014. Net position, which represents the University’s residual interest in assets after liabilities and deferred inflows of resources are deducted, was $3.14 billion (70% of total assets).
Total assets increased $545.9 million (14%), primarily due to increases in cash and cash equivalents, endowment investments and other investments.
Total liabilities increased $266.1 million (25%), primarily due to increases in bonds and capital lease obligations and accounts payable and accrued liabilities and a decrease in unearned revenue.
7
Deferred inflows of resources decreased $1.5 million (30%) due to amortized refunding bond premium and the amendment of the Forward Delivery Agreement.
Total net position increased $281.3 million (10%). Restricted net position increased $120.1 million mainly due to investment gains on endowments. Unrestricted net position increased $118.3 million and net investment in capital assets increased $42.9 million.
Operating revenues were $2.15 billion and operating expenses were $2.44 billion, resulting in a loss from operations of $292.4 million. Nonoperating and other revenues, net of nonoperating expenses, were $573.8 million, including $283.9 million in state appropriations.
Using the Financial Statements The University presents its financial reports in a “business type activity” format, in accordance with Governmental Accounting Standards Board (GASB) Statement No. 34, Basic Financial Statements and Management’s Discussion and Analysis for State and Local Governments, and GASB Statement No. 35, Basic Financial Statements and Management’s Discussion and Analysis for Public Colleges and Universities – an amendment of GASB Statement No. 34. GASB requires that statements be presented on a comprehensive, entity-wide basis. In addition to this MD&A section, the financial report includes:
Statement of Net Position Statement of Revenues, Expenses, and Changes in Net Position Statement of Cash Flows Notes to the Financial Statements
Reporting Entity The University is a component unit of the Commonwealth of Kentucky (Commonwealth). The financial statements of the University include the operations of the University and the following entities:
University of Kentucky Research Foundation, and its for-profit subsidiaries, Kentucky Technology, Inc. and Coldstream Laboratories, Inc.
The Fund for Advancement of Education and Research in the University of Kentucky Medical Center University of Kentucky Gluck Equine Research Foundation, Inc. University of Kentucky Humanities Foundation, Inc. University of Kentucky Mining Engineering Foundation, Inc. University of Kentucky Center on Aging Foundation, Inc. Central Kentucky Management Services, Inc. Kentucky Medical Services Foundation, Inc.
Statement of Net Position The Statement of Net Position is the University’s balance sheet. It reflects the total assets, liabilities, net position (equity), and deferred outflows and inflows of resources of the University as of June 30, 2014, with comparative information as of June 30, 2013. Liabilities due within one year, and assets available to pay those liabilities, are classified as current. Other assets and liabilities are classified as noncurrent. Net position (i.e. the difference between total assets and total liabilities and deferred inflows and outflows of resources) are an important indicator of the University’s current financial condition, while the change in net position is an indicator of whether the overall financial position has improved or worsened during the year. Generally, assets and liabilities and deferred inflows and outflows of resources are reported using current values. A major exception is capital assets, which are stated at historical cost less accumulated depreciation.
8

A summarized comparison of the University’s assets, liabilities, deferred inflows of resources, and net position as of June 30, 2014, 2013 and 2012 follows:
Condensed Statements of Net Position (in thousands)
2014 2013 (Restated) 2012 (Restated) ASSETS Current assets $ 694,839 $ 661,164 $ 591,287 Capital assets, net 1,979,404 1,955,731 1,986,562 Other noncurrent assets 1,816,476 1,327,891 1,189,866
Total assets 4,490,719 3,944,786 3,767,715
LIABILITIES AND DEFERRED INFLOWS OF RESOURCES Current liabilities 358,060 324,085 329,145 Noncurrent liabilities 985,317 753,178 761,014 Deferred inflows of resources 3,490 5,017 4,844
Total liabilities and deferred inflows of resources 1,346,867 1,082,280 1,095,003
NET POSITION Net investment in capital assets 1,347,778 1,304,887 1,307,738 Restricted
Nonexpendable 573,995 567,676 557,712 Expendable 428,045 314,237 241,602
Unrestricted 794,034 675,706 565,660
Total net position $ 3,143,852 $ 2,862,506 $ 2,672,712
Assets. As of June 30, 2014, total assets amounted to $4.49 billion. The largest asset class was capital assets, net, that totaled $1.98 billion or 44% of total assets. Endowment investments were $1.22 billion, or 27% of total assets and cash and cash equivalents totaled $680.9 million, or 15% of total assets. During the year, total assets increased by a net $545.9 million primarily because of an increase in cash and cash equivalents of $229.0 million, endowment investments of $160.8 million, other long-term investments of $86.5 million, notes loans and accounts receivable, net of $22.7 million, current investments of $19.5 million and capital assets, net, of $23.7 million.
Liabilities. As of June 30, 2014, total liabilities amounted to $1.34 billion. Bonds and notes payable, capital leases and other long-term obligations issued for educational buildings, housing, the UK HealthCare Hospital System, athletics football stadium, and equipment totaled $838.2 million, or 62% of total liabilities. During the year, total liabilities increased by $266.1 million primarily as a result of the issuance of new debt comprised of $239.0 million in general receipts bonds and $2.8 million in capital leases offset by principal payments, an increase in accounts payable and accrued liabilities and a decrease in unearned revenue.
Deferred Inflows of Resources. The University’s deferred inflows of resources totaled $3.5 million, which represents the deferred gains on refunding debt. During the year, deferred inflows of resources decreased $1.5 million due to the amortization of deferred gains on refunding debt and the amendment of the Forward Delivery Agreement, which eliminated the hedging instrument that provided a specified rate of return on certain debt service instruments.
Net Position. The University’s equity of $3.14 billion as of June 30, 2014 is reported on the Statement of Net Position in three net position categories: net investment in capital assets, $1.35 billion (43%); restricted nonexpendable, $574.0 million (18%) and restricted expendable, $428.0 million (14%); and unrestricted, $794.0 million (25%).
Restricted net position is subject to externally imposed restrictions governing its use. Although unrestricted net position is not subject to externally imposed stipulations, most of the unrestricted net position has been internally designated for support of academic and research programs and initiatives, capital projects and working capital requirements.
9

Total net position increased $281.3 million during the year ended June 30, 2014. Net investment in capital assets increased $42.9 million due to excess of additions of capital assets and principal payments of capital debt offset by depreciation expense. Restricted net position increased $120.1 million principally as a result of gain on endowment investments due to a positive return on the endowment pool. Unrestricted net position increased $118.3 million, primarily due to an increase in operating revenues of $166.3 million offset by an increase in operating expenses of $141.7 million. Additionally, the positive return on the endowment pool contributed to an increase in quasi endowment net position of $37.6 million.
2013 Versus 2012. During the year ended June 30, 2013:
Total assets increased by a net $177.1 million primarily due to an increase in cash and cash equivalents of $103.7 million, endowment investments of $107.1 million offset by a decrease in capital assets of $30.8 million.
Liabilities decreased $12.9 million primarily due to principal payments on bonds and capital leases and refunding of bonds offset by the addition of new capital lease obligations primarily for the patient care facility offset by increases in accounts payable and accrued liabilities and unearned revenue.
Total net position increased $189.8 million during the year ended June 30, 2013. Net investment in capital assets decreased $2.9 million due to depreciation expense and demolition of residential halls for the Education Realty Trust (EdR) housing project in excess of additions of capital assets and principal payments of capital debt. Restricted net position increased $82.6 million principally as a result of gain on endowment investments due to a positive return on the endowment pool. Unrestricted net position increased $110.0 million primarily due to an increase in operating revenues of $33.0 million along with a decrease in operating expenses of $13.0 million. Additionally, the positive return on the endowment pool caused an increase in quasi endowment net position of $24.3 million.
Statement of Revenues, Expenses and Changes in Net Position The Statement of Revenues, Expenses and Changes in Net Position is the University’s income statement. It details how net position has changed during the year ended June 30, 2014, with comparative information for the year ended June 30, 2013. This statement is prepared on the accrual basis of accounting whereby revenues and assets are recognized when the service is provided and expenses and liabilities are recognized when others provide the service, regardless of when cash is exchanged. Items that increase or decrease net position appear on the Statement of Revenues, Expenses and Changes in Net Position as revenues, expenses, gains or losses.
Financial activities are reported as either operating or nonoperating. GASB Statement No. 35 requires state appropriations, gifts, and investment income to be classified as nonoperating revenues. Accordingly, the University reports a net operating loss prior to the addition of nonoperating revenues. The utilization of long-lived capital assets is reflected in the financial statements as depreciation, which amortizes the cost of an asset over its expected useful life. Tuition revenue is reduced by external scholarships and institutional aid and is reported net of the scholarship allowance.
10

A summarized comparison of the University’s revenues, expenses and changes in net position for years ended June 30, 2014, 2013 and 2012 follows:
Condensed Statements of Revenues, Expenses and Changes in Net Position (in thousands)
2014 2013 (Restated) 2012 (Restated) OPERATING REVENUES Student tuition and fees, net of scholarship allowances 287,517 $ 265,293 $ 243,364 $ Grants and contracts 256,179 283,378 317,722 Hospital services 1,101,662 945,885 906,607 Professional clinical service fees 203,721 196,974 195,412 Auxiliary enterprises, net of scholarship allowances 155,393 153,006 149,216 Recoveries of facilities and administrative costs 47,159 47,862 51,818 Sales and services 54,765 50,473 49,131 Federal and county appropriations 38,259 36,202 33,986 Other operating revenues 4,516 3,772 2,631
Total operating revenues 2,149,171 1,982,845 1,949,887
OPERATING EXPENSES Educational and general, excluding depreciation 1,029,208 999,332 1,068,280 Clinical operations, excluding depreciation 168,934 184,794 164,506 Hospital and clinics, excluding depreciation 961,165 839,744 823,421 Auxiliary enterprises, excluding depreciation 149,630 142,300 133,344 Depreciation 131,262 133,066 122,219 Other operating expenses 1,384 682 1,102
Total operating expenses 2,441,583 2,299,918 2,312,872
NET LOSS FROM OPERATIONS (292,412) (317,073) (362,985)
NONOPERATING REVENUES (EXPENSES) State appropriations 283,869 283,869 297,580 Capital grants and gifts 54,068 30,672 40,022 Gifts and non-exchange grants 96,771 98,418 86,735 Investment income (loss) 155,547 104,748 (232) Interest on capital asset-related debt (30,288) (29,244) (32,151) Additions to permanent endowments 7,578 10,225 11,581 Other, net 6,213 8,179 3,626
Total nonoperating revenues (expenses) 573,758 506,867 407,161
Total increase in net position 281,346 189,794 44,176
Net position, beginning of year, as previously reported - - 2,632,161 Cumulative effect of adoption of accounting principle - - (3,625) Net position, beginning of year, as restated 2,862,506 2,672,712 2,628,536
Net position, end of year 3,143,852 $ 2,862,506 $ 2,672,712 $
11


The net loss from operations for the year was $292.4 million. Nonoperating and other revenues, net of expenses, totaled $573.8 million and included: state appropriations of $283.9 million. Capital grants and gifts totaled $54.1 million – an increase of $23.4 million; investment income of $155.5 million – an increase of $50.8 million; additions to permanent endowments of $7.6 million – a decrease of $2.6 million; and gifts and non-exchange grants of $96.8 million – a decrease of $1.6 million.
2013 Versus 2012. Total operating revenues were $1.98 billion for the year ended June 30, 2013, including: student tuition and fees of $265.3 million (13%); grants, contracts, and recoveries of facilities and administrative costs of $331.2 million (16%); professional clinical service fees of $197.0 million (10%); and hospital services of $945.9 million (47%). Operating revenues for fiscal year 2013 increased $33.0 million or two percent over fiscal year 2012, primarily due to increases in hospital services revenue of $39.3 million resulting from an increase in rates, the overall case mix and patient discharges; student tuition and fees of $21.9 million due to tuition and fees rate increases as well as increased enrollment; and professional clinical service fees of $1.6 million due to increased patient activity offset by declining reimbursements; and auxiliary enterprises net of scholarship allowances of $3.8 million while grants and contracts decreased $34.3 million due to the closure of the Department of Corrections Health Care Network grant and a reduction in funding from the American Recovery and Reinvestment Act of 2009.
Operating expenses totaled $2.30 billion in fiscal year 2013. Of this amount, $999.3 million, excluding depreciation, or 43% was expended for educational and general programs, including instruction, research and public service. Hospital and clinics expenses, excluding depreciation, totaled $839.7 million, (36%) of the total expenses, and clinical operations expenses, excluding depreciation, were $184.8 million (eight percent). Depreciation amounted to $133.1 million (six percent). Operating expenses for fiscal year 2013 decreased $13.0 million (less than one percent) compared to fiscal year 2012 primarily due to a decrease in education and general program expenses of $68.9 million (six percent) offset by increases in hospital and clinics expenses, excluding depreciation of $16.3 million (two percent); clinical operations expenses, excluding depreciation, of $20.3 million (12%); auxiliary enterprises expenses of $9.0 million (seven percent) and depreciation expense of $10.8 million (nine percent).
The net loss from operations for the 2013 fiscal year totaled $317.1 million. Nonoperating and other revenues, net of expenses, totaled $506.9 million, resulting in an increase in net position of $189.8 million for the year. Nonoperating revenue included state appropriations of $283.9 million, which decreased $13.7 million from June 30, 2012 to June 30, 2013.
Statement of Cash Flows The Statement of Cash Flows details how cash has increased or decreased during the fiscal year ended June 30, 2014, with comparative financial information for the fiscal year ended June 30, 2013. The sources and uses of cash are arranged in the following categories:
Operating activities Noncapital financing activities Capital financing activities Investing activities
Cash flows associated with the University’s expendable net position appear in the operating and noncapital financing categories. Capital financing activities include payments for capital assets, proceeds from long-term debt, and debt repayments. Purchases and sales of investments are reflected in investing activities.
The primary purpose of the Statement of Cash Flows is to provide information about the cash receipts and cash payments made by the University during the year that will allow financial statement readers to assess the University’s ability to generate future net cash flows and to meet obligations as they become due, and to assess the possible need for external financing.
13

A comparative summary of the University’s statement of cash flows for years ended June 30, 2014, 2013 and 2012 follows:
Condensed Statement of Cash Flows (in thousands)
2014 2013 2012 CASH PROVIDED (USED) BY:
Operating activities $ (150,202) $ (152,097) $ (271,163) Noncapital financing activities 409,650 402,433 416,254 Capital and related financing activities 81,163 (127,067) (253,701) Investing activities (111,587) (19,582) 77,004
Net increase (decrease) in cash and cash equivalents 229,024 103,687 (31,606)
Cash and cash equivalents, beginning of year 451,867 348,180 379,786
Cash and cash equivalents, end of year $ 680,891 $ 451,867 $ 348,180
The University’s cash and cash equivalents increased $229.0 million in fiscal year 2014. Total cash provided by operating and noncapital financing activities was $259.4 million, an increase of $9.1 million compared to fiscal year 2013. Total cash provided by capital financing activities was $81.2 million, reflecting both capital funding sources (debt proceeds) and uses (purchases of capital assets and debt service). Total cash used by investing activities was $111.6 million.
Major sources of cash received from operating activities were student tuition and fees of $288.9 million; hospital services of $1.10 billion; grants, contracts, and recoveries of facilities and administrative costs of $293.4 million; and professional clinical service fees of $212.4 million. Major uses of cash for operating activities were payments to employees for salaries and benefits of $1.53 billion and to vendors and contractors of $721.1 million.
Noncapital financing activities include state appropriations from the Commonwealth of $283.9 million; gifts of $96.3 million and other noncapital financing receipts of $30.3 million.
Capital and related financing activities include proceeds of capital debt of $251.9 million and capital grants and gifts of $47.0 million. Cash of $140.0 million was expended for construction and acquisition of capital assets and $79.4 million was expended for principal and interest payments on debt.
Investing activities include proceeds from sales and maturities of investments of $717.5 million and interest and dividends on investments of $13.7 million. Cash of $842.8 million was used to purchase investments.
2013 Versus 2012. Cash balances are higher when comparing fiscal year 2013 to fiscal year 2012. The $103.7 million net increase in cash was created from less cash used by operating and capital and related financing activities, offset by less cash provided by noncapital activities and more cash used for investing activities.
14

Capital Asset and Debt Administration
Capital Assets
Capital assets, net of accumulated depreciation, totaled $1.98 billion at June 30, 2014, a increase of $23.7 million. Capital assets as of June 30, 2014, 2013 and 2012, and significant changes in capital assets during the years ended June 30, 2013 and 2014 follow (in millions):
Net Net Additions Additions
Balance (Deletions) Balance (Deletions) Balance June 30, 2012 FY 12-13 June 30, 2013 FY 13-14 June 30, 2014
Land and land improvements 163 $ 17 $ 180$ 5$ 185 $ Buildings, fixed equipment
and infrastructure 2,311 58 2,369 32 2,401 Equipment, vehicles and
capitalized software 688 22 710 25 735 Library materials and art 158 2 160 2 162 Certificate of need license 12 - 12 - 12 Construction in progress 58 (23) 35 57 92 Accumulated depreciation (1,403) (107) (1,510) (98) (1,608)
Total $ 1,987 (31) $ 1,956$ 23$ 1,979 $
At June 30, 2014, the University had capital construction projects in progress totaling approximately $475.5 million in scope. Major projects include the renovation and expansion of Commonwealth Stadium and Nutter Training Center, the renovation and expansion of the Gatton College of Business and Economics, the construction of the Academic Science Building and the fit-up of the 8th floor of the Patient Care Facility. The estimated cost to complete the projects in progress was approximately $381.3 million.
Debt
At June 30, 2014, capital debt amounted to $838.2 million, summarized by trust indenture and type as follows (in millions):
2014 2013 2012
General Receipts bonds and notes $ 698 $ 479 $ 500 Consolidated Educational Buildings Revenue Bonds 33 38 42 Capital lease obligations 86 109 115 Notes payable 21 22 22
Total $ 838 $ 648 $ 679
Debt increased $190.4 million during the year primarily due to the issuance of General Receipts Bonds 2014 Series A, B and C for $239.0 million and additional capital leases of $2.8 million, offset by a net decrease from principal payments of the University’s debt obligations of $51.4 million.
Economic and Other Factors That Will Affect the Future Executive management believes the University is well-positioned to maintain its strong financial condition and to continue providing excellent service to students, patients, the community, and the citizens of the Commonwealth. The University’s strong financial condition, as evidenced by the receipt of credit ratings of Aa2 and AA- from Moody’s Investors Service and Standard & Poor’s Ratings Services, respectively, will provide a high degree of flexibility in obtaining funds for future capital projects on competitive terms. This flexibility, along with ongoing efforts toward revenue diversification and cost containment, will enable the University to obtain the necessary
15

resources to sustain excellence. The following are known facts and circumstances that will affect future financial results: The Commonwealth continues to suffer from fiscal stress in spite of modest increases in revenue. The
Kentucky General Assembly enacted reductions in state general funds for many state agencies of five percent and a 1.5% reduction for public colleges and universities for fiscal year 2014-15. The enacted budget generally reflects no change in state appropriations for state agencies and public colleges and universities for fiscal year 2015-16. The Consensus Forecasting Group noted several areas of risk to the Commonwealth including:
o Highly dependent on improvement in new home construction o Recognition of a range of outcomes regarding future Tobacco Master Settlement Agreement
payments to the Commonwealth o Downside risk from coal severance funding
State support as a percentage of the total budget is expected to continue to decline. Over the past 10 years, state support has decreased from 20% of the operating budget in 2004-05 to nine percent for 2014-15. In spite of significant enrollment growth and inflationary cost increases, state support for 2014-15 will be $8.3 million less than it was in 2004-05 at $287.9 million.
Student demand is expected to remain high in the coming years. Even though tuition rates for fiscal year 2014-15 reflect a five percent increase for Kentucky residents, the University is expected to enroll the largest, most diverse and one of the best prepared incoming freshmen classes in the institution’s history. Applications for the Fall 2014 incoming class increased over five percent to 19,810 as compared to the prior fall of 18,802. Preliminary numbers indicate that the Fall 2014 entering freshmen class will total 5,188 students – an increase of 504 students, or 11%, compared to last fall. The tuition rate increases, the higher percentage of non-resident undergraduate students, and projected enrollment are expected to generate additional operating revenues of $28.6 million compared to the fiscal year 2013-14 original budget.
The University is undergoing a momentous physical transformation. The multi-phase housing project to revitalize UK’s on-campus housing includes five new residence halls which came online in August 2014 adding 2,381 beds to the housing stock. Three additional residence halls are expected online in August 2015 (1,610 beds). The total plan includes increasing the current on-campus housing stock up to 9,000 beds by 2018. This comprehensive public/private partnership with EdR, the first of its kind in the nation, will provide a substantial increase in the quantity and quality of student housing while allowing the University to reserve its debt capacity to rebuild learning and research spaces.
To meet the needs of the University’s growing student body; improve the quality of academic programs, scientific research, and creative scholarship; and expand access and ensure affordability, the University sought and received authorization from the 2013 Kentucky General Assembly to self-finance three building projects:
o A $65.0 million renovation and expansion of the Gatton College of Business and Economics, financed by private gifts
o A new $112.0 million Academic Science Building financed by the University. The University Department of Intercollegiate Athletics (Athletics) will fund $65.0 million of the project cost.
o A $120.0 million renovation and expansion of Commonwealth Stadium financed completely by Athletics
More recently, the University received authorization from the 2014 Kentucky General Assembly for the following three building projects:
o A $175.0 million renovation and expansion of the Student Center financed by the University o A $150.0 million renovation and upgrade of the UK HealthCare facilities financed completely by
UK HealthCare o A $65.0 million renovation and expansion of the College of Law building financed by $35.0 million
of state bonds and $30.0 million of private gifts As of June 30, 2014, grants and contracts of approximately $177.7 million, a decrease of approximately
$11.4 million from the previous year, have been awarded to the University but not expended. The decline in available governmental awards will result in reduced grant revenue in future periods.
Health care reform has initiated significant changes to the United States healthcare system, including potential material changes to the delivery of healthcare services and the reimbursement paid for such services by governments or other third-party payers. The long-term impact is unknown, as the long period between passage and its implementation lends to some level of uncertainty. UK HealthCare Hospital
16

System will develop and execute strategies in an effort to mitigate the negative impacts and leverage opportunities.
The University will continue its long-term endowment investment strategy to maximize total returns, at an appropriate level of risk, while utilizing a spending rate policy to insulate programs funded by the endowment from temporary market volatility.
Fiscal year 2014-15 is a pivotal year of transition as the University moves from a traditional incremental budget approach to the values-based financial model. The new model is designed to focus on aligning resources with academic decision-making authority and accountability. A values-based model creates incentives in two fundamentally important ways:
o Making the financial aspects of operations more transparent and the system more nimble o Empowering Colleges to make informed decisions about investing in priorities
In July 2014, the University created a public/private partnership with Aramark that will transform the dining services provided for students, faculty, staff, and the community. The 15 year partnership provides for $70 million in facilities investments by Aramark, including $40 million in new facilities, subject to board approval, to be completed by 2017-18. Aramark will construct a new K Lair at Haggin Hall and make substantial upgrades to the Student Center Food Court, both to be completed for use in Fall 2014, and a newly constructed Commons for Fall 2015.
Economic challenges will continue to have an impact on the future. However, management believes the University will be able to sustain its sound financial position and continue its progress toward becoming a nationally recognized public institution.
17

UNIVERSITY OF KENTUCKY A COMPONENT UNIT OF THE COMMONWEALTH OF KENTUCKY STATEMENTS OF NET POSITION (in thousands) JUNE 30, 2014 AND 2013
2013 (Restated -
2014 Note 1) ASSETS Current Assets Cash and cash equivalents $ 387,863 $ 391,975 Notes, loans and accounts receivable, net 240,088 226,327 Investments 26,452 6,944 Inventories and other assets 40,436 35,918 Total current assets 694,839 661,164 Noncurrent Assets Restricted cash and cash equivalents 293,028 59,892 Endowment investments 1,215,226 1,054,448 Other long-term investments 248,108 161,574 Notes, loans and accounts receivable, net 59,412 50,478 Other noncurrent assets 702 1,499 Capital assets, net 1,979,404 1,955,731 Total noncurrent assets 3,795,880 3,283,622 Total assets 4,490,719 3,944,786
LIABILITIES AND DEFERRED INFLOWS OF RESOURCES Current Liabilities Accounts payable and accrued liabilities 227,576 189,636 Unearned revenue 60,017 64,552 Long-term liabilities - current portion 70,467 69,897 Total current liabilities 358,060 324,085 Noncurrent Liabilities Accounts payable and accrued liabilities 2,476 - Long-term liabilities 982,841 753,178 Total noncurrent liabilities 985,317 753,178 Total liabilities 1,343,377 1,077,263 Deferred Inflows of Resources 3,490 5,017 Total liabilities and deferred inflows of resources 1,346,867 1,082,280
NET POSITION Net investment in capital assets 1,347,778 1,304,887 Restricted Nonexpendable Scholarships and fellowships 134,731 131,743 Research 268,265 267,594 Instruction 78,597 76,649 Academic support 83,904 83,741 Other 8,498 7,949 Total restricted nonexpendable 573,995 567,676 Expendable Scholarships and fellowships 77,594 57,802 Research 95,614 57,605 Instruction 57,031 44,562 Academic support 56,801 38,889
Loans 10,445 10,531 Capital projects 101,357 77,165 Debt service 774 1,042 Auxiliary 15,198 11,763 Other 13,231 14,878 Total restricted expendable 428,045 314,237 Total restricted 1,002,040 881,913 Unrestricted 794,034 675,706
Total net position $ 3,143,852 $ 2,862,506
See notes to financial statements. 18

UNIVERSITY OF KENTUCKY A COMPONENT UNIT OF THE COMMONWEALTH OF KENTUCKY STATEMENTS OF REVENUES, EXPENSES AND CHANGES IN NET POSITION (in thousands) FOR THE YEARS ENDED JUNE 30, 2014 AND 2013
2013 (Restated -
2014 Note 1) OPERATING REVENUES Student tuition and fees 385,989 $ 364,547 $ Less: Scholarship allowances (98,472) (99,254) Net tuition and fees 287,517 265,293 Federal grants and contracts 160,384 165,214 State and local grants and contracts 67,755 87,143 Nongovernmental grants and contracts 28,040 31,021 Recoveries of facilities and administrative costs 47,159 47,862 Sales and services 54,765 50,473 Federal appropriations 17,921 16,890 County appropriations 20,338 19,312 Professional clinical service fees 203,721 196,974 Hospital services 1,101,662 945,885 Auxiliary enterprises: Housing and dining 58,346 57,793 Less: Scholarship allowances (7,193) (7,367) Net housing and dining 51,153 50,426 Athle ics 73,957 72,033 Other auxiliaries 30,283 30,547 Other operating revenues 4,516 3,772 Total opera ing revenues 2,149,171 1,982,845 OPERATING EXPENSES Educa ional and general: Instruction 271,857 257,516 Research 245,313 247,550 Public service 211,479 229,757 Libraries 21,070 19,487 Academic support 71,482 64,765 Student services 36,790 34,106 Institutional support 49,295 52,702 Operations and maintenance of plant 79,823 63,198 Student financial aid 42,099 30,251 Depreciation 66,224 69,508 Total educational and general 1,095,432 1,068,840 Clinical operations (including depreciation of $2,021 in 2014 and $1,995 in 2013) 170,955 186,789 Hospital and clinics (including depreciation of $51,460 in 2014 and $51,261 in 2013) 1,012,625 891,005 Auxiliary enterprises: Housing and dining (including depreciation of $5,823 in 2014 and $5,020 in 2013) 52,416 47,531 Athle ics (including depreciation of $5,734 in 2014 and $5,282 in 2013) 91,322 84,036 Other auxiliaries 17,449 21,035 Other operating expenses 1,384 682 Total operating expenses 2,441,583 2,299,918 Net loss from operations (292,412) (317,073) NONOPERATING REVENUES (EXPENSES) State appropriations 283,869 283,869 Gifts and non-exchange grants 96,771 98,418 Investment income (loss) 155,547 104,748 Interest on capital asset-related debt (30,288) (29,244) Other nonoperating revenues and expenses, net 7,449 9,856 Net nonoperating revenues (expenses) 513,348 467,647 Net income (loss) before other revenues, expenses, gains or losses 220,936 150,574 Capital grants and gifts 54,068 30,672 Addi ions to permanent endowments 7,578 10,225 Other, net (1,236) (1,676) Total other revenues (expenses) 60,410 39,221 INCREASE IN NET POSITION 281,346 189,795
NET POSITION, beginning of year, as previously reported - 2,676,387 Cumulative effect of adoption of accounting principle - (3,676) NET POSITION, beginning of year, as restated 2,862,506 2,672,711
NET POSITION, end of year 3,143,852 $ 2,862,506 $
See notes to financial statements. 19

UNIVERSITY OF KENTUCKY A COMPONENT UNIT OF THE COMMONWEALTH OF KENTUCKY STATEMENTS OF CASH FLOWS (in thousands) FOR THE YEARS ENDED JUNE 30, 2014 AND 2013
2014 2013 CASH FLOWS FROM OPERATING ACTIVITIES Student tuition and fees $ 288,922 $ 265,136 Grants and contracts 247,522 281,214 Recoveries of facilities and administrative costs 45,917 49,348 Sales and services 53,836 51,035 Federal appropriations 17,117 14,858 County appropriations 21,400 18,935 Payments to vendors and contractors (721,086) (667,570) Student financial aid (42,082) (30,169) Salaries, wages and benefits (1,529,995) (1,462,989) Professional clinic service fees 212,424 199,317 Hospital services 1,096,977 973,830 Auxiliary enterprise receipts 153,659 153,741 Loans issued to students (21,188) (17,137) Collection of loans to students 19,818 16,422 Self insurance receipts 51,230 45,035 Self insurance payments (48,217) (43,921) Other operating receipts (payments), net 3,544 818 Net cash provided (used) by operating activities (150,202) (152,097) CASH FLOWS FROM NONCAPITAL FINANCING ACTIVITIES State appropriations 283,869 283,869 Gifts and grants received for other than capital purposes: Gifts received for endowment purposes 7,554 10,225 Gifts received for other purposes 88,716 80,516 Agency and loan program receipts 225,252 210,958 Agency and loan program payments (226,011) (210,594) Other noncapital financing receipts (payments), net 30,270 27,459 Net cash provided (used) by noncapital financing activities 409,650 402,433 CASH FLOWS FROM CAPITAL AND RELATED FINANCING ACTIVITIES Capital grants and gifts 46,989 36,249 Purchases of capital assets (139,955) (102,520) Proceeds from capital debt 251,920 30,832 Payments to refunding bond agents - (5,633) Principal paid on capital debt and leases (50,900) (56,419) Interest paid on capital debt and leases (28,460) (29,535) Other capital and related financing receipts (payments), net 1,569 (41) Net cash provided (used) by capital and related financing activities 81,163 (127,067) CASH FLOWS FROM INVESTING ACTIVITIES Proceeds from sales and maturities of investments 717,482 741,159 Interest and dividends on investments 13,723 15,476 Purchase of investments (842,792) (776,217) Net cash provided (used) by investing activities (111,587) (19,582) NET INCREASE (DECREASE) IN CASH AND CASH EQUIVALENTS 229,024 103,687
CASH AND CASH EQUIVALENTS, beginning of year 451,867 348,180
CASH AND CASH EQUIVALENTS, end of year $ 680,891 $ 451,867
Reconciliation of net loss from operations to net cash used by operating activities: Net loss from operations $ (292,412) $ (317,073) Adjustments to reconcile net loss from operations to net cash used by operating activities: Depreciation expense 131,262 133,066 Change in assets and liabilities: Notes, loans and accounts receivable, net (11,745) 26,580 Inventories and other assets (4,472) 1,442 Accounts payable and accrued liabilities 26,255 1,967 Unearned revenue (4,510) 1,676 Long-term liabilities 5,420 245
Net cash provided (used) by operating activities $ (150,202) $ (152,097)
See notes to financial statements. 20

UNIVERSITY OF KENTUCKY A COMPONENT UNIT OF THE COMMONWEALTH OF KENTUCKY
NOTES TO FINANCIAL STATEMENTS
1. ORGANIZATION AND SUMMARY OF SIGNIFICANT ACCOUNTING POLICIES
Reporting Entity The University of Kentucky (the University) is a component unit of the Commonwealth of Kentucky (the Commonwealth) and is included in the basic financial statements of the Commonwealth. The financial statements of the University include the operations of the University and its affiliated non-profit corporations (entities for which the University is financially accountable as defined by Statement No. 14 and amended by Statements No. 39 and No. 61 of the Governmental Accounting Standards Board (GASB), and which meet the definition of an affiliated corporation under Kentucky Revised Statutes (KRS) section 164A.550) as follows: the University of Kentucky Research Foundation and its for-profit subsidiaries (Kentucky Technology, Inc. and Coldstream Laboratories, Inc.); The Fund for Advancement of Education and Research in the University of Kentucky Medical Center; University of Kentucky Gluck Equine Research Foundation, Inc.; University of Kentucky Humanities Foundation, Inc.; University of Kentucky Mining Engineering Foundation, Inc.; University of Kentucky Center on Aging Foundation, Inc.; and Central Kentucky Management Services, Inc. The affiliates are presented as blended component units since University management has operational responsibility for each affiliated corporation. The financial statements also include the operations of Kentucky Medical Services Foundation, Inc. (KMSF) a non-profit entity for which the University is financially accountable as defined by GASB, but which is not an affiliated corporation under KRS. KMSF is included within the University reporting entity as a blended component unit as KMSF provides its services entirely to the University. The financial statements also include the operations of the UK HealthCare Hospital System (the System), the Department of Intercollegiate Athletics (Athletics), and the Kentucky Tobacco Research and Development Center (KTRDC), organizational units of the University. The separate financial statements for the above entities can be found at: www.uky.edu/evpfa/controller/finst.
Basis of Presentation The accompanying financial statements have been prepared in accordance with accounting principles generally accepted in the United States of America as prescribed by the GASB. GASB establishes standards for external financial reporting for public colleges and universities and requires that resources be classified for accounting and financial reporting purposes into the following net position categories:
Net investment in capital assets: Capital assets, net of accumulated depreciation and outstanding principal balances of debt attributable to the acquisition, construction or improvement of those assets.
Restricted: Nonexpendable – Net position subject to externally imposed stipulations that they be maintained permanently by the University. Such assets include the principal of the University’s permanent endowment funds.
Expendable – Net position whose use by the University is subject to externally imposed stipulations that can be fulfilled by actions of the University pursuant to those stipulations or that expire by the passage of time.
Unrestricted: Net position whose use by the University is not subject to externally imposed stipulations. Unrestricted net position may be designated for specific purposes by action of management or the Board of Trustees or may otherwise be limited by contractual agreements with outside parties.
The financial statement presentation is intended to provide a comprehensive, entity-wide perspective of the University’s assets, deferred outflows of resources, liabilities, deferred inflows of resources, net position, revenues, expenses, changes in net position and cash flows.
Summary of Significant Accounting Policies Accrual Basis. The financial statements have been prepared on the accrual basis of accounting. Under the accrual basis of accounting, revenues are recognized when earned and expenses are recorded when an obligation has been incurred. The University reports as a Business Type Activity (BTA) as defined by GASB
21

Statement No. 35. BTA’s are those activities that are financed in whole or part by fees charged to external parties for goods and services.
Cash and Cash Equivalents. The University considers all highly liquid investments purchased with an original maturity of three months or less to be cash equivalents.
Noncurrent cash and cash equivalents include plant funds allocated for capital projects, debt service reserves and endowment fund cash pending transfer to the custodian for investment. Cash and cash equivalents held by bond trustees and the University’s endowment fund managers are included in investments.
Notes, Loans and Accounts Receivable. This classification consists of tuition and fee charges to students; charges for auxiliary enterprise services provided to students, faculty and staff; and loans to students. Also included are patient accounts receivable, amounts due from sponsors for reimbursement of expenses made pursuant to contracts and grants, and pledges that are verifiable, measurable and expected to be collected. Accounts receivable are recorded net of estimated uncollectible amounts based upon a review of outstanding receivables, historical collection information, and existing economic conditions.
Inventories. Inventories are stated principally at the lower of average cost or market.
Pooled Endowment Funds. All endowments are managed in a consolidated investment pool, which consists of more than 2,000 named funds. All contributing endowments participate in the income and appreciation of the pool on a per unit basis commensurate with their contribution to the pool. New endowments purchase units in the pool at the current unit value, which is calculated each month based on the fair value of the pool investments divided by the number of pool units outstanding. The market value method of accounting for pooled endowment funds is employed to ensure proper distribution of market price changes, realized gains (losses) on sales, accrued income earned, and distribution of investment earnings for expenditure by participating funds.
In accordance with the Kentucky Uniform Prudent Management of Institutional Funds Act (UPMIFA), as adopted by the Commonwealth in July 2010, the University employs a total return method for establishing investment objectives and spending policies designed to achieve financial equilibrium for endowment funds over the long term. The University makes expenditure decisions in accordance with UPMIFA and donor gift agreements. UPMIFA prescribes guidelines for expenditure of a donor-restricted endowment fund (in the absence of overriding, explicit donor stipulations) and focuses on the entirety of a donor-restricted endowment fund, that is, both the original gift amount(s) and net appreciation. In accordance with the standard of prudence prescribed by UPMIFA and consistent with industry standards, the University has adopted a spending policy whose long-term objective is to maintain the purchasing power of each endowment and provide a predictable and sustainable level of income to support current operations.
The University has established a “hybrid” spending policy, which includes both the market value of the endowment and the current level of inflation in determining spending each year. Annual spending will be calculated by taking a weighted average comprising 60% of the prior year’s spending, adjusted for inflation, and 40% of the amount that results when the target annual spending rate of four percent is applied to the average market value of the endowment over the preceding 36 months. The spending amount determined by the formula will be constrained so that the calculated rate is at least three percent, and not more than six percent, of the current endowment market value. The hybrid spending policy will be phased in over two years with the new policy fully implemented in the year ending June 30, 2015. The year ended June 30, 2014 served as a transition year to the new policy and spending was based on four percent of the average market value for the preceding 60 months. For the year ended June 30, 2013, the University’s endowment standard spending rule provided for annual distributions of 4.25% of the 60 month moving average market value of fund units.
Additionally, for the fiscal year ended June 30, 2014, spending and management fee withdrawals were suspended on all endowments with a market value less than the contributed value by more than 20% at December 31st of the prior year. Endowments with a market value less than the contributed value by more than 10% went through a formal review to determine the appropriate level of spending in accordance with various factors set forth in UPMIFA. For fiscal year 2013, reduced spending rules were also established for
22

certain endowments whose market value was less than the contributed value as of December 31st of the prior year.
For the years ended June 30, 2014 and 2013, the University’s annual endowment management fee was 0.25%; however, endowments whose market value was less than the contributed value as of December 31st
were exempt from the management fee in the subsequent fiscal year.
The components of the University’s spending policy distribution and management fee for the years ended June 30, 2014 and 2013 are as follows (in thousands):
2014 2013
Gross spending policy distribution $ 36,381 $ 36,289 Reinvested spending policy distribution (16,640) (16,216)
Net spending policy distribution $ 19,741 $ 20,073
Management fee $ 2,525 $ 1,949
Investments. Investments in marketable debt and equity securities are carried at fair value, as determined by the major securities markets. Changes in unrealized gain (loss) on the carrying value of investments are reported as a component of investment income in the Statement of Revenues, Expenses and Changes in Net Position. Other investments, including guaranteed investment contracts, repurchase agreements and certificates of deposit are valued at face value and are fully collateralized.
The University’s financial statements include alternative investments, such as limited partnerships, that are not publicly traded. Certain of these alternative investments are carried at their estimated fair values as of March 31, 2014 and 2013, as adjusted by cash receipts, cash disbursements, and securities distributions through June 30, 2014 and 2013, at a total estimated fair value of $154.1 million and $114.3 million, respectively. Other alternative investments are carried at estimated fair values as of December 31, 2013 and 2012, at a total estimated value of $1.3 million and $1.4 million, respectively. In addition, the University also has alternative investments in investment funds that are not themselves publicly traded and thus do not have publicly reported market values, but whose underlying assets consist of publicly traded investments for which fair values are established by the major securities markets. Such alternative investments are carried at fair value of approximately $492.9 million and $298.7 million at June 30, 2014 and 2013. The University believes that the total carrying amount of its alternative investments valued at $695.6 million and $458.7 million at June 30, 2014 and 2013 is a reasonable estimate of fair value. The University’s outstanding commitment to alternative investments is approximately $122.5 million and $116.9 million as of June 30, 2014 and 2013, respectively.
Capital Assets. Capital assets are stated at cost at date of acquisition or, in the case of gifts, at fair market value at date of gift.
The University capitalizes interest costs as a component of construction in progress based on the interest cost of borrowing specifically for the project, net of interest earned on investments acquired with the proceeds of the borrowing.
Equipment with a unit cost of $2,000 or more ($1,000 for computers) and having an estimated useful life of greater than one year is capitalized. Institutional software costing more than $400,000 is capitalized. Renovations to buildings, infrastructure and land improvements that significantly increase the value or extend the useful life of the structure are capitalized. Routine repairs and maintenance are charged to operating expense in the year in which the expense is incurred.
Depreciation of capital assets is computed on a straight-line basis over the estimated useful lives of the respective assets, generally 40 years for buildings, 10 – 25 years for land improvements, building improvements and infrastructure, 10 years for library books and capitalized software, and 5 – 20 years for equipment and vehicles.
23
The University capitalizes, but does not depreciate, works of art, historical treasures and certain library materials that are held for exhibition, education, research and public service.
Unearned Revenue. Unearned revenue consists primarily of amounts received from grant and contract sponsors that have not yet been earned under the terms of the agreement. Unearned revenue also includes amounts received in advance of an event, such as advance athletic ticket sales relating to future fiscal years and unearned summer school revenue. Unearned revenue is recognized in the period to which the grant, event or semester relates.
Compensated Absences. The amount of vacation leave earned but not taken by employees at June 30, 2014 is recorded as a liability by the University. Temporary disability leave payable upon termination under the University’s payout policy is also recorded as a liability. Compensated absence liabilities are computed using the pay rates in effect at the statement of net position date plus an additional amount for compensation-related payments such as Social Security and Medicare taxes computed using rates in effect at that date.
Deferred Inflows of Resources. A deferred inflow of resources is a gain in net position by the University that is applicable to a future reporting period. Deferred inflows of resources are reported in the statement of net position but are not recognized in the financial statements as revenue until in the related period. Deferred inflows of resources, as of June 30, 2014 and 2013, consist of deferred gains on refunding debt, $3.5 million and $4.4 million, respectively, and the fair value of a derivative, $0 and $561,000, respectively, which is defined as a hedging instrument, providing a specified rate of return on certain debt service instruments.
Scholarship Allowances. Student tuition and fees are presented net of scholarship allowances applied to student accounts. Stipends and other payments made directly to students are presented as student financial aid expenses. Scholarship allowances are the difference between the stated charge for goods and services provided by the University and the amount that is paid by students and/or third parties making payments on the students’ behalf. Certain governmental grants, such as Pell grants and other federal and state programs similar to Pell, are recorded as nonoperating revenues; other governmental and nongovernmental grants are recorded as operating revenues in the University’s financial statements. To the extent that revenues from such programs are used to satisfy tuition and fees and other student charges, the University has recorded a scholarship allowance.
Hospital and Clinical Services Revenues. Hospital and clinical services revenues are reported at the estimated net realizable amounts from patients, third-party payers and others for services rendered, including contractual allowances and estimated retroactive adjustments under reimbursement programs with third-party payers, less a provision for doubtful accounts. Retroactive adjustments are accrued on an estimated basis in the period the related services are rendered and adjusted in future periods, as final settlements are determined.
Inpatient acute care services and substantially all outpatient services rendered to Medicare program beneficiaries are paid at prospectively determined rates per discharge. These rates vary according to a patient classification system that is based on clinical, diagnostic and other factors. Inpatient skilled nursing services are paid at prospectively determined per diem rates that are based on the patients’ acuity. Certain inpatient nonacute services and defined medical education costs are paid based on a cost reimbursement methodology. The System is reimbursed for certain services at tentative rates with final settlement determined after submission of annual cost reports by the System and audits thereof by the Medicare fiscal intermediary.
Inpatient and outpatient services rendered to Medicaid program beneficiaries are reimbursed under a cost reimbursement methodology for certain services and at prospectively determined rates for all other services. The System is reimbursed for cost reimbursable services at tentative rates with final settlement determined after submission of annual cost reports by the System and audits thereof by the Medicaid fiscal intermediary.
Revenue from the Medicare and Medicaid programs accounted for approximately 25% and 24%, respectively, of the System’s net patient services revenues before the provision for doubtful accounts for the year ended June 30, 2014 and approximately 24% and 23%, respectively for the year ended June 30, 2013. Laws and regulations governing the Medicare and Medicaid programs are extremely complex and subject to interpretation. As a result, there is at least a reasonable possibility that recorded estimates will change by a material amount in the near term.
24
The System also entered into payment agreements with certain commercial insurance carriers, health maintenance organizations and preferred provider organizations. The basis for payment to the System under these agreements includes prospectively determined rates per discharge, discounts from established charges and prospectively determined daily rates.
The System provides care to patients who meet certain criteria under its charity care policy without charge or at amounts less than its established rates. Since the System does not pursue collection of amounts determined to qualify as charity care, they are not reported as revenue.
Electronic Health Records Incentive Program. The Electronic Health Records Incentive Program, enacted as part of the American Recovery and Reinvestment Act of 2009, provides for incentive payments under both the Medicare and Medicaid programs to eligible physicians and hospitals that demonstrate meaningful use of certified electronic health records technology. Payments under the Medicare program are generally made for up to four years based on a statutory formula. Payments under the Medicaid program are generally made for up to four years based upon a statutory formula, as determined by the state, which is approved by the Centers for Medicare and Medicaid Services. Payment under both programs is contingent on the System and KMSF continuing to meet escalating meaningful use criteria and any other specific requirements that are applicable for the reporting period. The final amount for any payment year is determined based upon an audit by the fiscal intermediary. Events could occur that would cause the final amounts to differ materially from the initial payments under the program.
The System recognizes revenue when management is reasonably assured it will meet all of the meaningful use objectives and any other specific grant requirements applicable for the reporting period.
In fiscal year 2014, the System was in the third year under the Medicare programs and recorded $1.7 million, which is included in net patient service revenue within operating revenues in the Statement of Revenues, Expenses, and Changes in Net Position. In fiscal year 2013, the System was in the second year of the programs but did not attest to completion of the second phase and recorded no revenue.
In fiscal year 2014, the System completed the third year requirements under the Medicaid program and recorded revenue of approximately $564,000, which is included in net patient service revenue within operating revenues in the Statement of Revenues, Expenses, and Changes in Net Position. In fiscal year 2013, the System recorded $2.2 million in revenue.
In addition, during the years ended June 30, 2014 and 2013, KMSF applied for and received $269,000 and $1.9 million, respectively, in Medicaid health information technology (HIT) funds and $1.0 million and $124,000, respectively, in Medicare HIT funds.
Income Taxes. The University is an agency and instrumentality of the Commonwealth, pursuant to Kentucky Revised Statutes sections 164.100 through 164.280. Accordingly, the University is excluded from federal income taxes as an organization described in Section 115 of the Internal Revenue Code of 1986, as amended. Each of the University’s affiliated non-profit organizations has received a determination from the Internal Revenue Service granting exemption from federal income taxation pursuant to the provisions of Internal Revenue Code section 501(c)(3). KMSF is a not-for-profit corporation as described in Section 501(c)(3) of the Internal Revenue Code.
Restricted Asset Spending Policy. The University’s policy is that restrictions on assets cannot be fulfilled by the expenditure of unrestricted funds for similar purposes. The determination on whether restricted or unrestricted funds are expended for a particular purpose is made on a case-by-case basis. Restricted funds remain restricted until spent for the intended purpose.
Operating Activities. The University defines operating activities, as reported on the Statement of Revenues, Expenses and Changes in Net Position, as those that generally result from exchange transactions, such as payments received for providing goods and services and payments made for goods and services received. Nearly all of the University’s expenses are from exchange transactions. Certain significant revenues relied upon for operations, such as state appropriations, gifts and investment income, are recorded as nonoperating revenues in accordance with GASB Statement No. 35.
25
The University has classified operating expenses based upon their functional classifications. Operating expenses by natural classification are presented in Note 24. During fiscal years 2014 and 2013, departmental research in nonsponsored accounts of approximately $67.7 million and $63.4 million, respectively, was recorded as research expense in the Statements of Revenues, Expenses and Changes in Net Position.
Use of Estimates. The preparation of financial statements in conformity with accounting principles generally accepted in the United States of America requires management to use estimates and assumptions that affect amounts reported in the financial statements and accompanying notes. Actual results could differ from those estimates. The accompanying financial statements include estimates for items such as bad debt and contractual allowances, estimated third-party payer settlements, self-insurance reserves, accrued expenses and other liability accounts.
Change in Accounting Principle. During 2014, the University adopted GASB Statement No. 65, Items Previously Reported as Assets and Liabilities. GASB Statement No. 65 establishes accounting and financial reporting standards that reclassify, as deferred outflows of resources or deferred inflows of resources, certain items that were previously reported as assets and liabilities and recognizes, as outflows of resources or inflows of resources, certain items that were previously reported as assets and liabilities. GASB Statement No. 65 also provides other financial reporting guidance related to the impact of the financial statement elements deferred outflows of resources and deferred inflows of resources, such as changes in the determination of the major fund calculations and limiting the use of the term “deferred” in the financial statement presentations.
Adoption of GASB Statement No. 65 requires that bond issuance costs are expensed when incurred and reclassification of deferred gains on refunding debt from long-term liabilities to deferred inflows of resources, resulting in a decrease of approximately $3.7 million in beginning net position as of July 1, 2012 and an increase in the change in net position of approximately $213,000 for the year ended June 30, 2013 for the University.
Reclassifications. Certain reclassifications have been made to the fiscal year 2013 financial statements to conform to the fiscal year 2014 financial statement presentation.
26

2. DEPOSITS AND INVESTMENTS
The fair value of deposits and investments, by type, at June 30, 2014 and 2013 is as follows (in thousands):
2014 2013
Cash and cash equivalents $ 109,551 $ 101,490 Certificates of deposit 26,715 26,703 Common and preferred stocks 63,668 51,862 Corporate fixed income securities 56,742 25,157 Deposits with banks and the Commonwealth of Kentucky 111,619 81,513 Government agency fixed income securities 69,423 52,035 Guaranteed investment contracts 2,726 1,645 Other 152 152 Pooled absolute return funds 140,497 211,085 Pooled equity funds 353,946 407,828 Pooled fixed income funds 615,555 365,042 Pooled global tactical allocation funds 91,544 -Pooled long/short equity funds 145,705 -Pooled private equity funds 120,515 88,064 Pooled real estate funds 81,454 70,961 Pooled real return/diversified inflation strategy funds 115,915 88,572 Repurchase agreements 39,998 84,141 State and municipal fixed income securities 13,258 7,418 U.S. Treasury fixed income securities 11,694 11,165
Total $ 2,170,677 $ 1,674,833
2014 2013 Statement of Net Position classification
Current cash and cash equivalents $ 387,863 $ 391,975 Current investments 26,452 6,944 Restricted cash and cash equivalents 293,028 59,892 Endowment investments 1,215,226 1,054,448 Other long-term investments 248,108 161,574
Total $ 2,170,677 $ 1,674,833
Alternative investments totaling approximately $695.6 million and $458.7 million as of June 30, 2014 and 2013, respectively, are included within pooled absolute return funds, pooled global tactical allocation funds, pooled long/short equity funds, pooled private equity funds, pooled real estate funds, and pooled real return/diversified inflation strategy funds in the summary schedule of investments above (please refer to Note 1, Summary of Significant Accounting Policies, regarding valuation of alternative investments).
Deposit and Investment Policies. The University’s Board of Trustees is responsible for establishing deposit and investment policies. Once established, the Board has delegated day-to-day management to the Treasurer of the University. Deposit and investment policies are developed to ensure compliance with state laws and regulations as well as to establish and maintain sound financial management practices.
The University follows Kentucky Revised Statutes (KRS 42.500) for the investment of public funds, which list allowable investment instruments including: obligations of the United States or a United States government agency; obligations of any corporation of the United States government; collateralized certificates of deposit; highly rated uncollateralized certificates of deposit, bankers acceptances and commercial paper; highly rated securities issued by a state or local government; and mutual funds comprised of any of the above allowable investments.
27
For purposes of investment management, the majority of the University’s deposits and investments can be grouped into five significant categories, as follows:
Overnight investments include deposits, money markets and repurchase agreements with local banks, the Commonwealth and other financial institutions.
Bond revenue fund investments held by the Treasurer of the Commonwealth as required by the University’s bond trust indentures and invested in pooled fixed income funds managed by the Commonwealth.
Short-term investments managed by the University, including individual securities purchased and held by the University, short-term investments in pooled fixed income funds managed by the Commonwealth, and short term investments managed by an external manager.
Debt service reserve fund investments required by the University’s bond trust indentures and held by the bond trustees.
Endowment investments administered by the University and managed using external investment managers.
The Treasurer manages a short-term investment program of the University based on the Operating Fund Investment Policy. The University’s policy for the investment of bond revenue and debt service reserve funds is governed by each respective bond’s trust indenture. The Investment Committee of the University’s Board of Trustees establishes and maintains the University’s Endowment Investment Policy.
Deposit and Investment Risks. The University’s deposits and investments are exposed to various risks, including credit, interest rate and foreign currency risk. Due to the level of risk associated with certain investment securities, it is at least reasonably possible that changes in the values of investment securities will occur in the near term and that such change could affect the investment amounts in the Statements of Net Position.
Credit Risk. Credit risk is the risk that the issuer or other counterparty to an investment will not fulfill its obligation, causing the University to experience a loss of principal.
As a means of limiting its exposure to losses arising from credit risk, the University’s investment policies limit the exposure of its various investment types as follows:
Overnight investment (deposits and repurchase agreements) policies minimize credit risk in several ways. Deposits are governed by state law which requires full collateralization for balances exceeding amounts covered by the Federal Deposit Insurance Corporation (FDIC). The University’s deposits are insured up to $250,000 at each FDIC insured institution. Credit risk on deposits in excess of FDIC coverage and on repurchase agreements with local banks is mitigated by the issuing financial institution’s pledge of specific U.S. Treasury or agency securities, held in the name of the University by the Federal Reserve Bank. Credit risk on repurchase agreements with the Commonwealth is mitigated by the Commonwealth’s requirement that providers of overnight repurchase agreements collateralize these investments at 102% of face value with U.S. Treasury or agency securities, pledged in the name of the Commonwealth. Money market fund portfolios consist of securities eligible for short-term investments.
Bond revenue fund investments held in the Commonwealth’s investment pools can invest in U.S. Treasury and agency securities; commercial paper or asset-backed securities rated in the highest category by a nationally recognized rating agency; certificates of deposit, bankers acceptances, state or local government securities and corporate, Yankee and Eurodollar securities rated in one of the three highest categories by a nationally recognized rating agency; shares of mutual funds (up to 10%); and state and local property tax certificates of delinquency secured by interests in real estate.
Short-term investments managed by the University are limited to U.S. Treasury securities; securities issued by U.S. government agencies or government sponsored entities; money market securities, including: commercial paper rated the highest by a nationally recognized rating agency, collateralized certificates of deposit, and bankers’ acceptances for banks rated A or higher; repurchase and reverse repurchase agreements collateralized at 102%; municipal obligations rated A1 or higher; and money market mutual funds invested in any of the above noted security types. Short-term investments held in the Commonwealth’s investment pools are subject to the same credit quality requirements as denoted above for bond revenue fund investments. Short term investments managed by an external manager include a
28

portfolio of fixed income investments with a minimum of 85% of portfolio holdings rated investment grade and a minimum A- portfolio average quality, with no single credit industry exceeding 15% of the portfolio.
Investment securities held in bond debt service reserve funds may be invested and reinvested solely in bonds or interest bearing notes of the United States government.
Endowment managers are permitted to use derivative instruments to limit credit risk.
At June 30, 2014, and 2013, respectively, the credit quality of the University’s fixed income investments is as follows (in thousands):
2014
S&P/Moody's Credit Ratings
BBB/ Below Rating Not
AAA/Aaa AA/Aa A Baa BB/Ba B B Not rated Applicable Total
Cash and cash equivalents $ 73,674 $ - $ - $ - $ - -$ 35,877 $ -$ 109,551 $
Certificates of deposit - - - - - - 26,715 - 26,715
Corporate fixed income 4,822 2,314 18,637 20,676 5,607 3,988 496 - 202 56,742
Government agency fixed income - 68,690 - 733 - - - - - 69,423
Guaranteed investment contracts - 121 - - - - - 2,605 - 2,726
Pooled fixed income - - - - - - - 615,555 - 615,555
Repurchase agreements - - - - - - - 39,998 - 39,998
State and municipal fixed income 1,840 2,600 8,818 - - - - - - 13,258
U.S. Treasury fixed income - - - - - - - - 11,694 11,694
Total fixed income investments $ 80,336 $ 73,725 $ 27,455 $ 21,409 $ 5,607 $ 3,988 $ 496 $ 720,750 $ 11,896 $ 945,662
2013
S&P/Moody's Credit Ratings
BBB/ BB/ Below Rating Not
AAA/Aaa AA/Aa A Baa Ba B B Not rated Applicable Total
Cash and cash equivalents $ 82,826 $ - $ - $ - $ - $ - $ - $ 18,664 $ - $ 101,490
Certificates of deposit - - - - - - - 26,703 - 26,703
Corporate fixed income - 832 16,253 2,681 - 5,391 - - - 25,157
Government agency fixed income - 52,035 - - - - - - - 52,035
Guaranteed investment contracts - 40 - - - - - 1,605 - 1,645
Pooled fixed income - - - - - - - 365,042 - 365,042
Repurchase agreements - - - - - - - 84,141 - 84,141
State and municipal fixed income - 277 7,141 - - - - - - 7,418
U.S. Treasury fixed income - - - - - - - - 11,165 11,165
Total fixed income investments $ 82,826 $ 53,184 $ 23,394 $ 2,681 $ - $ 5,391 $ - $ 496,155 $ 11,165 $ 674,796
Custodial Credit Risk. Custodial credit risk is the risk that, in the event of the failure of the counterparty, the University will not be able to recover the value of its investment or collateral securities that are in possession of an outside party.
As a means of limiting its exposure to losses arising from custodial credit risk, the University’s investment policies limit the exposure of its various investment types as follows:
Overnight deposits and repurchase agreements are not exposed to custodial credit risk other than repurchase agreements with the Commonwealth, which are held in the Commonwealth’s name. Money market investments are held in the University’s name by the University’s custodian.
Bond revenue fund investments held in the Commonwealth’s investment pools are held in the Commonwealth’s name by the Commonwealth’s custodian.
Short-term investments held by the Commonwealth for the benefit of the University are invested in the Commonwealth’s investment pools and are held in the name of the Commonwealth by the Commonwealth’s custodian. Short-term investments managed by the University and managed by an external manager are held in the University’s name by the University’s custodian.
29

Investment securities held in bond debt service reserve funds are held by the respective bond trustee in a specific trust account for the benefit of the University and bondholders.
Endowment investments are held in the University’s name by the University’s custodian.
At June 30, 2014 and 2013, respectively, the following University deposit and investment balances held in the name of the Commonwealth included in the above significant investment types, were exposed to custodial credit risk as follows (in thousands):
2014
Overnight
Investments
Bond
Revenue
Investments
Short-term
Investments
Other
State
Investments Total
Uninsured and collateralized with securities
held by the pledging financial institution's
trust department or agent but not in the
University's name $ 42,000 $ - $ - -$ $ 42,000
Uninsured, not registered in the name of the
University and held by the counterparty
but not in the University's name
Total
-
42,000 $
435,360
435,360 $
60,000
60,000 $
25,885
25,885 $ $
521,245
563,245
2013
Bond Other
Overnight Revenue Short-term State
Investments Investments Investments Investments Total
Uninsured and collateralized with securities
held by the pledging financial institution's
trust department or agent but not in the
University's name $ 91,000 $ - $ - $ - $ 91,000
Uninsured, not registered in the name of the
University and held by the counterparty
but not in the University's name - 179,904 60,000 25,823 265,727
Total $ 91,000 $ 179,904 $ 60,000 $ 25,823 $ 356,727
Concentrations of Credit Risk. University investments can be exposed to a concentration of credit risk if significant amounts are invested in any one issuer.
As a means of limiting its exposure to concentrations of credit risk, the University’s investment policies limit concentrations in various investment types as follows:
Overnight deposits and repurchase agreements are not limited as to the maximum amount that may be invested in one issuer. However, all such deposits in excess of federal deposit insurance are required to be fully collateralized by U.S. Treasury and/or U.S. agency securities or other similar investments as provided by KRS 41.240.
Bond revenue fund investments and short-term investments held in the Commonwealth’s investment pools are limited as follows: U.S. dollar denominated corporate and Yankee securities issued by foreign and domestic issuers shall not exceed 25% of an individual pool and $25.0 million per issuer, inclusive of commercial paper, bankers’ acceptances and certificates of deposit; and U.S. dollar denominated sovereign debt shall not exceed five percent of any individual portfolio and $25.0 million per issuer.
There is no specific limit on the maximum amount of short-term investments managed by the University that may be invested in one issuer, other than the requirement that the amount of money invested at any one time in commercial paper, bankers’ acceptances and municipal obligations shall not exceed 20%.
30

Short term investments managed by an external manager are limited in that no single credit industry shall exceed 15% of the portfolio at purchase.
There is no specific limit on the maximum amount of investment securities held in bond debt service reserve funds that may be invested in one issuer. However, such investments are limited to bonds or interest bearing notes of the U.S. government.
Endowment fixed income managers are limited to a maximum investment in any one issuer of no more than five percent of total investments excluding sovereign debt of governments belonging in the Organization for Economic Cooperation and Development and U.S. agencies.
At June 30, 2014 and 2013, the University had no investments in any one issuer, other than U.S. Treasury and/or agency securities, that represent five percent or more of total investments.
Interest Rate Risk. Interest rate risk is the risk that changes in interest rates will adversely affect the fair value of an investment.
As a means of limiting its exposure to fair value losses arising from increasing interest rates, the University’s investment policies limit the maturity of its various investment types as follows:
Overnight investments, deposits, money markets and repurchase agreements have limited exposure to interest rate risk due to the short-term nature of the investment. The University requires that all deposits and repurchase agreements be available for use on the next business day.
Bond revenue fund investments and short-term investments held in the Commonwealth’s short-term investment pool are limited to a duration that does not exceed 90 days. Such investments in the Commonwealth’s intermediate-term investment pool must maintain a modified duration of less than three years.
Short-term investments managed by the University are generally limited to a maximum maturity of 24 months. The portfolio duration of short-term investments managed by and external manager must be within a range of +/- 0.5 years of the Barclays 1-5 Year Government/Credit Index.
Investment securities held in bond debt service reserve funds are required to have a maturity no later than two years from the date of the investment.
Endowment managers are permitted to use derivative instruments to limit interest rate risk. Additionally, endowment investments held by core-plus fixed income managers are limited to a duration that is within two years of the duration of the Barclays Aggregate Bond Index and new unconstrained fixed income strategies have been implemented to further protect against rising interest rates.
For June 30, 2014, below is the maturity distribution of the University’s fixed income investments (in thousands):
2014
Maturities in Years
Managed Less Greater based on
Investment Type than 1 1-3 3-5 5-10 than 10 duration Total
Cash and cash equivalents
Certificates of deposit
Corporate fixed income
Government agency fixed income
Guaranteed investment contracts
Pooled fixed income
Repurchase agreements
State and municipal fixed income
U.S. Treasury fixed income
$ 109,551
26,715
2,305
-
-
-
39,998
250
10
-$
-
12,305
-
-
-
-
10,496
29
-$
-
19,004
59,584
102
-
-
2,512
47
$ -
-
7,592
7,205
120
-
-
-
23
$ -
-
9,395
-
2,504
-
-
-
-
-$
-
6,141
2,634
-
615,555
-
-
11,585
$ 109,551
26,715
56,742
69,423
2,726
615,555
39,998
13,258
11,694
Total fixed income investments $ 178,829 $ 22,830 $ 81,249 $ 14,940 $ 11,899 $ 635,915 $ 945,662
31

For June 30, 2013, below is the maturity distribution of the University’s fixed income investments (in thousands):
2013
Maturities in Years
Managed Less Greater based on
Investment Type than 1 1-3 3-5 5-10 than 10 duration Total
Cash and cash equivalents $ 101,490 $ - $ - $ - $ - -$ $ 101,490
Certificates of deposit 26,703 - - - - - 26,703
Corporate fixed income - 547 200 261 - 24,149 25,157
Government agency fixed income - - 24,660 17,786 - 9,589 52,035
Guaranteed investment contracts - - 145 39 1,461 - 1,645
Pooled fixed income - - - - - 365,042 365,042
Repurchase agreements 79,171 1,013 - 3,957 - - 84,141
State and municipal fixed income - 4,691 2,449 278 - - 7,418
U.S. Treasury fixed income 2,223 10 52 45 - 8,835 11,165
Total fixed income investments $ 209,587 $ 6,261 $ 27,506 $ 22,366 $ 1,461 $ 407,615 $ 674,796
At June 30, 2014 and 2013, the University had the following investments managed based on duration (in thousands):
2014 2013
Modified Modified
Duration Duration
Investment Type Fair Value (Years) Fair Value (Years)
Corporate fixed income $ 6,141 0.4 $ 24,149 3.8
Government agency fixed income 2,634 2.5 9,589 4.3
Pooled fixed income
457 Deferred Compensation Plan - - 63 5.6
Commonwealth of Kentucky intermediate pool 60,028 1.3 69,683 2.0
Commonwealth of Kentucky short-term pool 461,218 0.1 196,044 0.1
Kentucky Technology, Inc. 52 2.2 52 2.1
KMSF 1,860 3.6 - -
Other endowment investments 2,283 5.4 2,139 5.5
Pooled endowment fund 90,114 0.6 97,061 3.5
U.S. Treasury fixed income 11,585 0.5 8,835 7.8
Total $ 635,915 $ 407,615
Foreign Currency Risk. Foreign currency risk is the risk that fluctuations in exchange rates will adversely affect the fair value of an investment or deposit.
The University’s exposure to foreign currency risk derives from certain endowment investments. The University’s endowment investment policy allows fixed income managers to invest a portion of their portfolios in non-U.S. securities. Additionally, the investment policy allows various pooled fund managers to invest in accordance with the guidelines established in each individual fund’s prospectus, which allows for investment in non-U.S. securities. Endowment managers are permitted to use derivative instruments to limit foreign currency risk.
32
As of June 30, 2014 and 2013, the following investments were subject to foreign currency risk (in thousands):
Endowment Investment Fair Value
2014 2013
Common stock Pooled private equity funds Cash equivalents
51,320 $ $ 8,712
372
43,060 8,034
-
Total 60,404 $ $ 51,094
Derivative Financial Instruments. The University has entered into a forward delivery agreement (the Forward Delivery Agreement). The Forward Delivery Agreement requires the counterparty to deposit U.S. Treasury securities into the University’s debt service reserve trust account and provides the University with a guaranteed rate of return. The securities that are deposited into the Consolidated Educational Building Revenue Bonds (CEBRB) debt service reserve trust accounts are required to mature prior to the scheduled debt service payment dates.
The Forward Delivery Agreement allows the University to earn a guaranteed fixed rate of return over the life of the investment. This agreement was utilized by the University to earn a rate of return in excess of a rate that would otherwise be feasible by investing in securities with a shorter term.
The original date of the Forward Delivery Agreement is June 16, 2004, with a termination date of May 1, 2024. The scheduled reserve amount varies throughout the term and was $2.2 million as of June 30, 2013. The guaranteed rate is 4.73% and the fair market value of the Forward Delivery Agreement was $561,000 as of June 30, 2013.
The amendment to the Forward Delivery Agreement dated June 26, 2014 amended the required reserve amount to approximately $853,000 as of June 30, 2014, which was solely invested in cash. The required reserve balance will remain at approximately $853,000 through June 30, 2024. The guaranteed rate is 4.73% and there is a zero fair market value of the Forward Delivery Agreement as of June 30, 2014.
The fair value of the Forward Delivery Agreement is based on the value of the future discounted cash flows expected to be received over the life of the agreement. The fair value of the Forward Delivery Agreement is classified as a noncurrent asset in the Statement of Net Position at June 30, 2013. As the Forward Delivery Agreement is an effective hedging instrument, the offsetting balance is reflected as deferred inflows of resources in the Statement of Net Position.
33
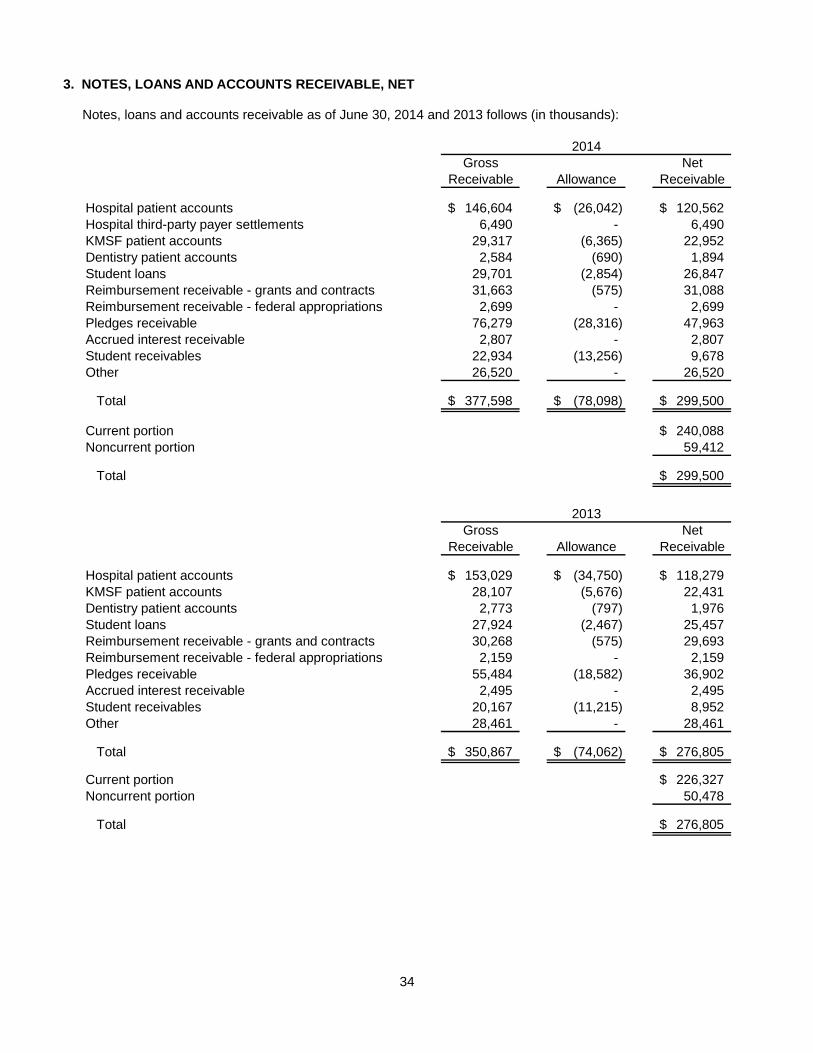
3. NOTES, LOANS AND ACCOUNTS RECEIVABLE, NET
Notes, loans and accounts receivable as of June 30, 2014 and 2013 follows (in thousands):
2014 Gross Net
Receivable Allowance Receivable
Hospital patient accounts $ 146,604 (26,042) $ 120,562 $ Hospital third-party payer settlements 6,490 - 6,490 KMSF patient accounts 29,317 (6,365) 22,952 Dentistry patient accounts 2,584 (690) 1,894 Student loans 29,701 (2,854) 26,847 Reimbursement receivable - grants and contracts 31,663 (575) 31,088 Reimbursement receivable - federal appropriations 2,699 - 2,699 Pledges receivable 76,279 (28,316) 47,963 Accrued interest receivable 2,807 - 2,807 Student receivables 22,934 (13,256) 9,678 Other 26,520 - 26,520
Total $ 377,598 (78,098) $ 299,500 $
Current portion 240,088 $ Noncurrent portion 59,412
Total 299,500 $
2013 Gross Net
Receivable Allowance Receivable
Hospital patient accounts $ 153,029 (34,750) $ 118,279 $ KMSF patient accounts 28,107 (5,676) 22,431 Dentistry patient accounts 2,773 (797) 1,976 Student loans 27,924 (2,467) 25,457 Reimbursement receivable - grants and contracts 30,268 (575) 29,693 Reimbursement receivable - federal appropriations 2,159 - 2,159 Pledges receivable 55,484 (18,582) 36,902 Accrued interest receivable 2,495 - 2,495 Student receivables 20,167 (11,215) 8,952 Other 28,461 - 28,461
Total $ 350,867 (74,062) $ 276,805 $
Current portion 226,327 $ Noncurrent portion 50,478
Total 276,805 $
34

4. CAPITAL ASSETS, NET
Capital assets as of June 30, 2014 and capital asset activity for the year ended June 30, 2014 are summarized below (in thousands):
June 30, 2013 Additions Deletions June 30, 2014
Land 71,480 $ 914 $ -$ 72,394$ Land improvements - nonexhaustible 40,492 2,151 - 42,643 Land improvements - exhaustible 68,472 1,788 29 70,231 Buildings 2,184,296 36,216 11,180 2,209,332 Fixed equipment - communications 90,775 5,862 58 96,579 Infrastructure 93,561 1,915 91 95,385 Equipment 553,165 46,676 28,620 571,221 Vehicles 20,684 1,344 628 21,400 Library materials 142,576 2,212 458 144,330 Nondepreciable library materials 6,618 33 - 6,651 Capitalized software 135,824 6,756 - 142,580 Art 11,148 311 - 11,459 Certificate of need license 11,609 - - 11,609 Construction in progress 34,762 82,411 25,536 91,637
3,465,462 188,589 66,600 3,587,451
Accumulated Depreciation Land improvements - exhaustible 52,709 2,595 26 55,278 Buildings 772,551 57,367 7,552 822,366 Fixed equipment - communications 53,382 6,023 58 59,347 Infrastructure 29,561 3,514 74 33,001 Equipment 387,387 45,289 24,608 408,068 Vehicles 17,383 1,497 628 18,252 Library materials 131,496 2,981 - 134,477 Capitalized software 65,262 11,996 - 77,258
1,509,731 131,262 32,946 1,608,047
Capital assets, net $ 1,955,731 $ 57,327 $ 33,654 $ 1,979,404
35

Capital assets as of June 30, 2013 and capital asset activity for the year ended June 30, 2013 are summarized below (in thousands):
June 30, 2012 Additions Deletions June 30, 2013
Land 63,666 $ 7,814 $ -$ 71,480 $ Land improvements - nonexhaustible 37,447 3,045 - 40,492 Land improvements - exhaustible 61,842 7,338 708 68,472 Buildings 2,135,650 58,106 9,460 2,184,296 Fixed equipment - communications 83,939 6,902 66 90,775 Infrastructure 91,507 2,090 36 93,561 Equipment 541,492 32,022 20,349 553,165 Vehicles 20,631 1,398 1,345 20,684 Library materials 140,377 2,339 140 142,576 Nondepreciable library materials 6,601 17 - 6,618 Capitalized software 126,366 9,516 58 135,824 Art 10,991 215 58 11,148 Certificate of need license 11,609 - - 11,609 Construction in progress 57,420 28,069 50,727 34,762
3,389,538 158,871 82,947 3,465,462
Accumulated Depreciation Land improvements - exhaustible 50,992 2,425 708 52,709 Buildings 722,365 57,646 7,460 772,551 Fixed equipment - communications 47,536 5,912 66 53,382 Infrastructure 25,858 3,719 16 29,561 Equipment 357,167 47,114 16,894 387,387 Vehicles 16,926 1,546 1,089 17,383 Library materials 128,167 3,329 - 131,496 Capitalized software 53,965 11,375 78 65,262
1,402,976 133,066 26,311 1,509,731
Capital assets, net $ 1,986,562 $ 25,805 $ 56,636 $ 1,955,731
At June 30, 2014, the University had construction projects in progress totaling approximately $475.5 million in scope. The estimated cost to complete these projects was approximately $381.3 million. Such construction was principally financed by cash reserves, gifts and grants, and proceeds from the University’s general receipts bonds.
Interest costs incurred during construction, net of related investment income, are capitalized. Total interest capitalized was $454,000 for 2014 and $17,000 for 2013.
During fiscal years 2014 and 2013, the University utilized capital leases to acquire various items of equipment. As of June 30, 2014 and 2013, the net book value of land, buildings, equipment and software acquired through capital lease included in the above schedules totaled $130.9 million and $147.8 million, respectively.
During fiscal year 2014, five student housing buildings were demolished with an original cost of $7.6 million and accumulated depreciation of $6.8 million, for a total net book value written off of $779,000. As of June 30, 2014, seven student housing buildings are scheduled for demolition in subsequent fiscal years and have been recorded as impaired assets. A portion of the net book value of each building was written off with the remainder to be written off in subsequent years. The total original cost of impaired assets was $7.3 million with accumulated depreciation of $6.5 million, and a total net book value written off in fiscal year 2014 of $356,000.
During fiscal year 2013, five student housing buildings were demolished with an original cost of $8.3 million and accumulated depreciation of $7.2 million, for a total net book value written off of $1.1 million. As of June 30, 2013, 14 student housing buildings were scheduled for demolition in subsequent fiscal years and were recorded as impaired assets. A portion of the net book value of each building was written off with the
36
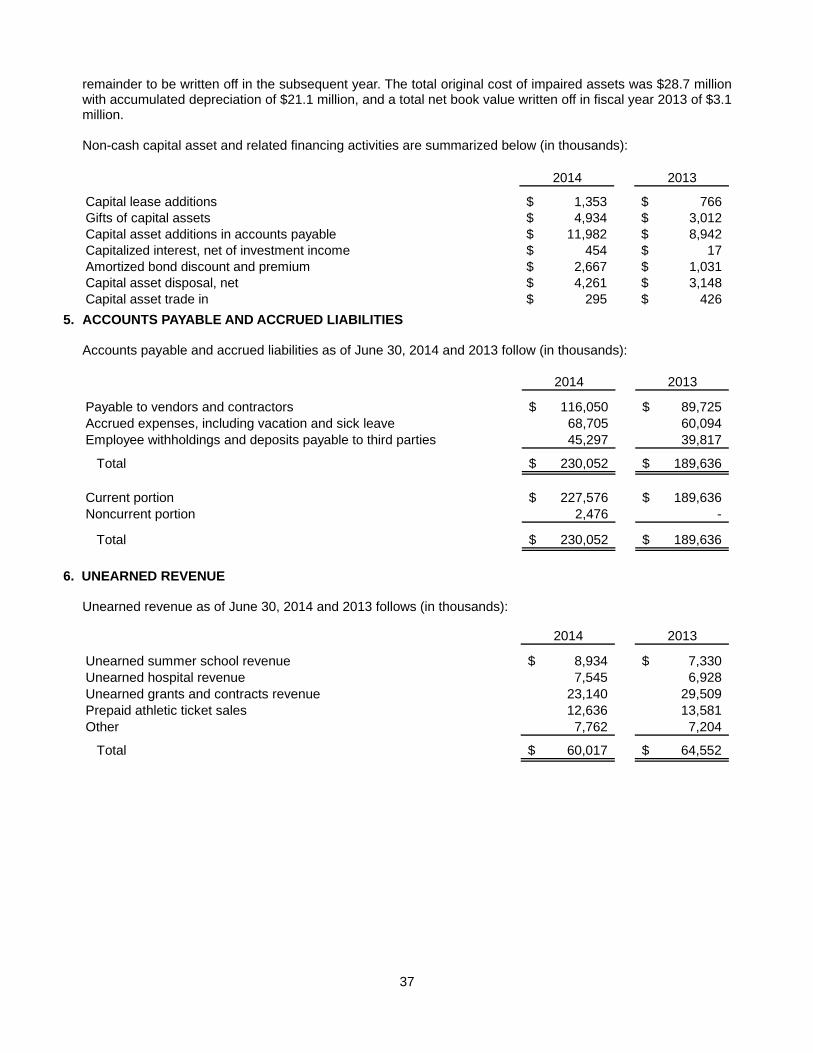
remainder to be written off in the subsequent year. The total original cost of impaired assets was $28.7 million with accumulated depreciation of $21.1 million, and a total net book value written off in fiscal year 2013 of $3.1 million.
Non-cash capital asset and related financing activities are summarized below (in thousands):
2014 2013
Capital lease additions Gifts of capital assets Capital asset additions in accounts payable Capitalized interest, net of investment income Amortized bond discount and premium Capital asset disposal, net Capital asset trade in
5. ACCOUNTS PAYABLE AND ACCRUED LIABILITIES
1,353 $ 4,934 $
11,982 $ 454$
2,667 $ 4,261 $
295$
$ $ $ $ $ $ $
766 3,012 8,942
17 1,031 3,148
426
Accounts payable and accrued liabilities as of June 30, 2014 and 2013 follow (in thousands):
2014 2013
Payable to vendors and contractors Accrued expenses, including vacation and sick leave Employee withholdings and deposits payable to third parties
116,050 $ 68,705 45,297
$ 89,725 60,094 39,817
Total 230,052 $ $ 189,636
Current portion Noncurrent portion
227,576 $ 2,476
$ 189,636 -
Total 230,052 $ $ 189,636
6. UNEARNED REVENUE
Unearned revenue as of June 30, 2014 and 2013 follows (in thousands):
2014 2013
Unearned summer school revenue Unearned hospital revenue Unearned grants and contracts revenue Prepaid athletic ticket sales Other
8,934 $ 7,545
23,140 12,636 7,762
$ 7,330 6,928
29,509 13,581 7,204
Total 60,017 $ $ 64,552
37

- -
7. LONG-TERM LIABILITIES
Long-term liabilities as of June 30, 2014 and long-term liability activity for the year ended June 30, 2014 are summarized below (in thousands):
Bonds, notes and capital leases
General Receipts notes
General Receipts bonds
Educational buildings bonds
Capital leases and other
long-term obligations
Notes payable
Total bonds, notes and capital leases
Other liabilities
Medical malpractice
Long-term disability
Annuities payable
Health insurance
Automobile and property self insurance
Retiree health benefits trust
Federal loan programs
Workers compensation
Compensated absences
Arbitrage rebate
Unamortized bond premium
Unemployment compensation
Other
Total other liabilities
Total
June 30,
2013
$ 280,175
199,295
37,960
108,641
21,719
647,790
26,346
6
4,788
6,038
414
75,362
20,992
19,765
7,634
5
7,662
629
5,644
175,285
$ 823,075
Additions
$ -
238,975
-
2,840
-
241,815
8,440
-
1,473
36,447
1,119
21,955
375
7,743
-
22
12,715
744
3,984
95,017
$ 336,832
Reductions
$ 14,995
5,770
4,610
24,996
1,055
51,426
5,489
6
560
35,296
1,093
-
834
5,735
-
-
1,707
751
3,702
55,173
$ 106,599
June 30,
2014
$ 265,180
432,500
33,350
86,485
20,664
838,179
29,297
-
5,701
7,189
440
97,317
20,533
21,773
7,634
27
18,670
622
5,926
215,129
$ 1,053,308
Current Non-Current
Portion Portion
$ 15,685 $ 249,495
5,940 426,560
4,795 28,555
19,964 66,521
1,089 19,575
47,473 790,706
5,235 24,062
566 5,135
7,189 -
440 -
- 97,317
- 20,533
5,445 16,328
651 6,983
- 27
1,526 17,144
622 -
1,320 4,606
22,994 192,135
$ 70,467 $ 982,841
38
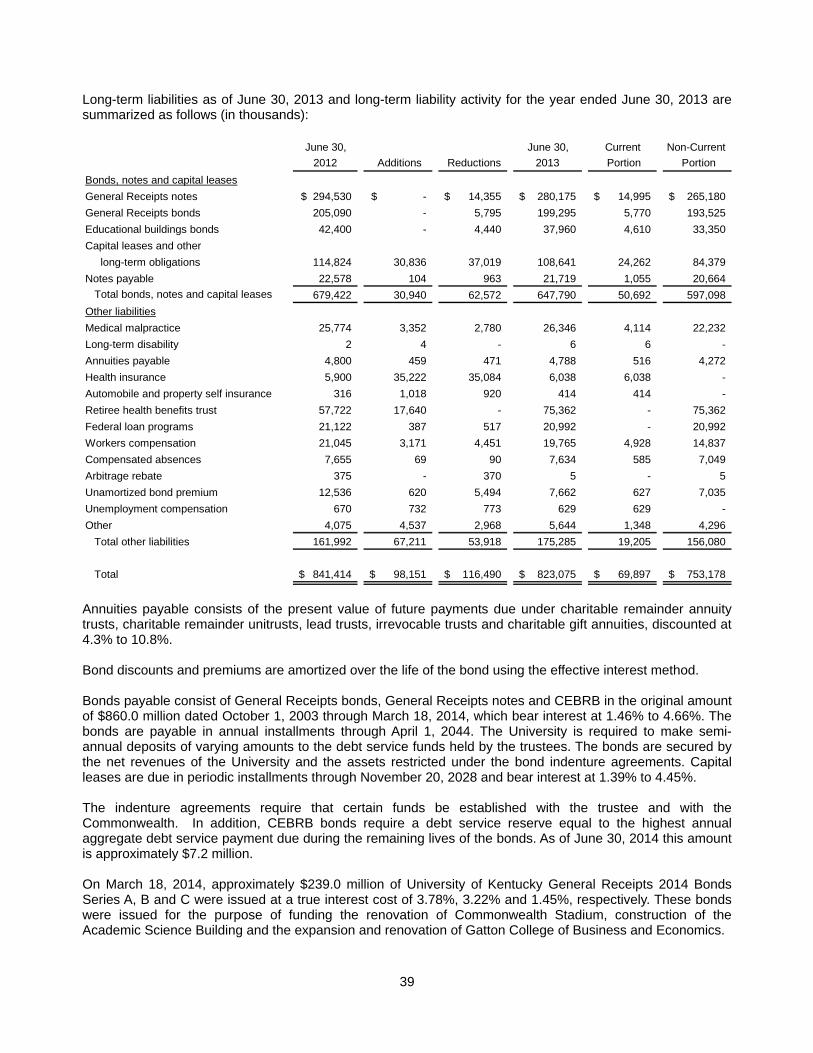
Long-term liabilities as of June 30, 2013 and long-term liability activity for the year ended June 30, 2013 are summarized as follows (in thousands):
June 30, June 30, Current Non-Current
2012 Additions Reductions 2013 Portion Portion
Bonds, notes and capital leases
General Receipts notes $ 294,530 -$ 14,355 $ 280,175 $ 14,995 $ 265,180 $
General Receipts bonds 205,090 - 5,795 199,295 5,770 193,525
Educational buildings bonds 42,400 - 4,440 37,960 4,610 33,350
Capital leases and other
long-term obligations 114,824 30,836 37,019 108,641 24,262 84,379
Notes payable 22,578 104 963 21,719 1,055 20,664
Total bonds, notes and capital leases 679,422 30,940 62,572 647,790 50,692 597,098
Other liabilities
Medical malpractice 25,774 3,352 2,780 26,346 4,114 22,232
Long-term disability 2 4 - 6 6 -
Annuities payable 4,800 459 471 4,788 516 4,272
Health insurance 5,900 35,222 35,084 6,038 6,038 -
Automobile and property self insurance 316 1,018 920 414 414 -
Retiree health benefits trust 57,722 17,640 - 75,362 - 75,362
Federal loan programs 21,122 387 517 20,992 - 20,992
Workers compensation 21,045 3,171 4,451 19,765 4,928 14,837
Compensated absences 7,655 69 90 7,634 585 7,049
Arbitrage rebate 375 - 370 5 - 5
Unamortized bond premium 12,536 620 5,494 7,662 627 7,035
Unemployment compensation 670 732 773 629 629 -
Other 4,075 4,537 2,968 5,644 1,348 4,296
Total other liabilities 161,992 67,211 53,918 175,285 19,205 156,080
Total 841,414 $ 98,151 $ 116,490 $ 823,075 $ 69,897 $ 753,178 $
Annuities payable consists of the present value of future payments due under charitable remainder annuity trusts, charitable remainder unitrusts, lead trusts, irrevocable trusts and charitable gift annuities, discounted at 4.3% to 10.8%.
Bond discounts and premiums are amortized over the life of the bond using the effective interest method.
Bonds payable consist of General Receipts bonds, General Receipts notes and CEBRB in the original amount of $860.0 million dated October 1, 2003 through March 18, 2014, which bear interest at 1.46% to 4.66%. The bonds are payable in annual installments through April 1, 2044. The University is required to make semi-annual deposits of varying amounts to the debt service funds held by the trustees. The bonds are secured by the net revenues of the University and the assets restricted under the bond indenture agreements. Capital leases are due in periodic installments through November 20, 2028 and bear interest at 1.39% to 4.45%.
The indenture agreements require that certain funds be established with the trustee and with the Commonwealth. In addition, CEBRB bonds require a debt service reserve equal to the highest annual aggregate debt service payment due during the remaining lives of the bonds. As of June 30, 2014 this amount is approximately $7.2 million.
On March 18, 2014, approximately $239.0 million of University of Kentucky General Receipts 2014 Bonds Series A, B and C were issued at a true interest cost of 3.78%, 3.22% and 1.45%, respectively. These bonds were issued for the purpose of funding the renovation of Commonwealth Stadium, construction of the Academic Science Building and the expansion and renovation of Gatton College of Business and Economics.
39
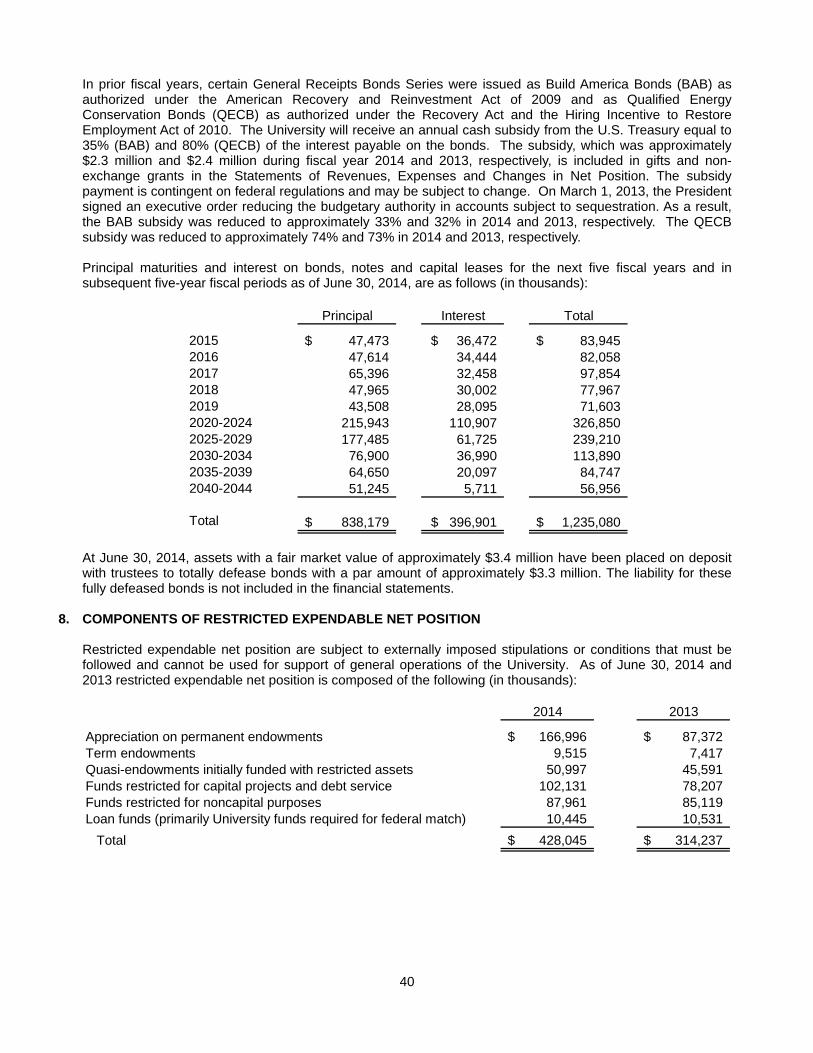
In prior fiscal years, certain General Receipts Bonds Series were issued as Build America Bonds (BAB) as authorized under the American Recovery and Reinvestment Act of 2009 and as Qualified Energy Conservation Bonds (QECB) as authorized under the Recovery Act and the Hiring Incentive to Restore Employment Act of 2010. The University will receive an annual cash subsidy from the U.S. Treasury equal to 35% (BAB) and 80% (QECB) of the interest payable on the bonds. The subsidy, which was approximately $2.3 million and $2.4 million during fiscal year 2014 and 2013, respectively, is included in gifts and non-exchange grants in the Statements of Revenues, Expenses and Changes in Net Position. The subsidy payment is contingent on federal regulations and may be subject to change. On March 1, 2013, the President signed an executive order reducing the budgetary authority in accounts subject to sequestration. As a result, the BAB subsidy was reduced to approximately 33% and 32% in 2014 and 2013, respectively. The QECB subsidy was reduced to approximately 74% and 73% in 2014 and 2013, respectively.
Principal maturities and interest on bonds, notes and capital leases for the next five fiscal years and in subsequent five-year fiscal periods as of June 30, 2014, are as follows (in thousands):
Principal Interest Total
2015 $ 47,473 $ 36,472 $ 83,945 2016 47,614 34,444 82,058 2017 65,396 32,458 97,854 2018 47,965 30,002 77,967 2019 43,508 28,095 71,603 2020-2024 215,943 110,907 326,850 2025-2029 177,485 61,725 239,210 2030-2034 76,900 36,990 113,890 2035-2039 64,650 20,097 84,747 2040-2044 51,245 5,711 56,956
Total $ 838,179 $ 396,901 $ 1,235,080
At June 30, 2014, assets with a fair market value of approximately $3.4 million have been placed on deposit with trustees to totally defease bonds with a par amount of approximately $3.3 million. The liability for these fully defeased bonds is not included in the financial statements.
8. COMPONENTS OF RESTRICTED EXPENDABLE NET POSITION
Restricted expendable net position are subject to externally imposed stipulations or conditions that must be followed and cannot be used for support of general operations of the University. As of June 30, 2014 and 2013 restricted expendable net position is composed of the following (in thousands):
2014 2013
Appreciation on permanent endowments $ 166,996 $ 87,372 Term endowments 9,515 7,417 Quasi-endowments initially funded with restricted assets 50,997 45,591 Funds restricted for capital projects and debt service 102,131 78,207 Funds restricted for noncapital purposes 87,961 85,119 Loan funds (primarily University funds required for federal match) 10,445 10,531
Total $ 428,045 $ 314,237
40

9. DESIGNATIONS OF UNRESTRICTED NET POSITION
Unrestricted net position is designated for specific purposes by action of the Board of Trustees or management or may otherwise be limited by contractual agreements. Commitments for the use of unrestricted net position as of June 30, 2014 and 2013 are as follows (in thousands):
2014 2013
W orking capital requirements 115,282 $ 82,879$ Budget appropriations for future year fiscal operations 145,083 156,034 Designated for capital projects 55,201 46,725 Designated for renewal and replacement of capital assets 25,559 24,395 Hospital System 414,062 326,740 Affiliated corporations and component units 38,847 38,933
Total 794,034 $ 675,706 $
10. PLEDGED REVENUES
Pledged revenue for 2014 and 2013 as defined by General Receipts Trust Indenture, is as follows (in thousands):
2014 2013
Student tuition and fees $ 287,517 $ 265,293 Nongovernmental grants and contracts 716 701 Recoveries of facilities and administrative costs 47,159 47,755 Sales and services 41,637 41,139 Hospital services 1,101,662 945,885 Auxiliary enterprises - housing and dining 51,153 50,426 Auxiliary enterprises - athletics 73,957 -Auxiliary enterprises - other 30,283 30,547 Other operating revenue 967 989 State appropriations 283,869 283,869 Gifts and grants 4,809 5,015 Investment income 6,208 2,704
Total $ 1,929,937 $ 1,674,323
The University has substantially pledged all of the unrestricted operating and nonoperating revenues to repay the General Receipts bonds and notes issued during 2005 to 2014. Proceeds from the bonds and notes provided funding for new constructions, major renovations, and for the refunding of bonds and notes issued over the years. The bonds are payable from unrestricted operating and nonoperating revenues and are payable through 2044. Annual principal and interest payments on bonds are expected to require approximately two percent of pledged revenue. The total principal and interest remaining to be paid on the bonds is approximately $1.07 billion and $711.6 million in 2014 and 2013, respectively. Principal and interest paid for 2014 and 2013 was $43.2 million, respectively.
41

11. INVESTMENT INCOME
Components of investment income (loss) for the years ended June 30, 2014 and 2013 are as follows (in thousands):
2014 2013 Interest and dividends earned on endowment investments Realized and unrealized gains and losses on endowment investments Interest and dividends on cash and non-endowment investments Realized and unrealized gains and losses on non-endowment investments
Investment income from external trusts
14,369 $
135,759
3,964
(317)
1,772
16,463 $
85,352
2,584
(1,293)
1,642
Total 155,547 $ 104,748 $
12. FUNDS HELD IN TRUST BY OTHERS
The University is the income beneficiary of various trusts that are held and controlled by external trustees. For the years ended June 30, 2014 and 2013, the University received income from these trusts of approximately $1.8 million and $1.6 million, respectively. The market value of the external trust assets as of June 30, 2014 and 2013 was approximately $42.1 million and $38.1 million, respectively. As the University does not have ownership of the trust assets held by external trustees, the trusts are recorded at a nominal value of $1 each.
13. PLEDGES AND DEFERRED GIFTS
At June 30, 2014 and 2013, respectively, pledges are expected to be collected primarily over the next ten years, as follows (in thousands):
2014 2013
Operating purposes $ 11,541 $ 15,508 Capital projects 70,046 44,208
Total 81,587 59,716
Less discounts and allowances (33,624) (22,814)
Total $ 47,963 $ 36,902
In accordance with GASB Statement No. 33, Accounting and Financial Reporting for Nonexchange Transactions, the University is required to record operating and capital pledges as revenue when all eligibility requirements have been met. Endowment pledges are not recognized as revenue until the gifts are actually received. For the years ended June 30, 2014 and 2013, the University recorded the discounted value of operating and capital pledges using a rate of two percent.
Deferred gifts through insurance, known bequests and irrevocable trusts in which the University has a remainder interest are estimated to be approximately $94.5 million and $115.6 million at June 30, 2014 and 2013, respectively. The University records these amounts as revenue when the cash is received.
42
14. GRANTS AND CONTRACTS AWARDED
At June 30, 2014 and 2013, grants and contracts of approximately $177.7 million and $189.0 million, respectively, have been awarded to the University and the University of Kentucky Research Foundation, but not expended. These amounts will be recognized in future periods.
15. PENSION PLANS
Regular full-time employees, including faculty, are participants in the University of Kentucky Retirement Plan, a defined contribution plan. The University of Kentucky Retirement Plan consists of five groups as follows:
Group I Established July 1, 1964, for faculty and certain administrative officials.
Group II Established July 1, 1971, for staff members in the clerical, technical and service categories.
Group III Established July 1, 1972, for staff members in the managerial, professional and scientific categories.
Group IV Established January 1, 1973, for staff members having U.S. Civil Service retirement entitlement.
Group V Established July 1, 1987, for staff members covered under the Federal Employees Retirement System that replaced Civil Service (those whose employment began during the period from January 1, 1984 to March 31, 1987). Staff members whose employment began after March 31, 1987 are under one of the above University of Kentucky Retirement Plans.
Participation in the University of Kentucky Retirement Plan is mandatory for all regular full-time employees ingroups I, II and III who are age 30 or older. Participation is voluntary for regular full-time employees under theage of 30 and for those employees in groups IV and V. Participants in groups I, II, III and IV contribute fivepercent and the University contributes 10% of the participant’s eligible compensation to the retirement plan.Participants in group V contribute one percent and the University contributes two percent of the participant’s eligible compensation to the retirement plan.
The University has authorized two retirement plan carriers, as follows:
Teachers Insurance and Annuity Association/College Retirement Equities Fund (TIAA/CREF)
Fidelity Investments Institutional Services Company
Under the fully funded University of Kentucky Retirement Plan, the University and plan participants make contributions to provide retirement benefits to employees in individually owned contracts. All payments are vested immediately for employees hired prior to January 1, 2010. For employees hired after January 1, 2010, employer contributions are vested after three years. The University's contributions and costs for 2014 and 2013 were approximately $91.4 million and $86.0 million, respectively. Employees contributed approximately $45.3 million in 2014 and $42.6 million in 2013. The University's total payroll costs were approximately $1.18 billion and $1.11 billion, respectively, for the years ended June 30, 2014 and 2013. The payroll for employees covered by the retirement plan was approximately $912.1 million and $857.7 million for the years ended 2014 and 2013, respectively.
Regular full-time KMSF employees become eligible to participate in a defined contribution plan on the first of the month following the employee’s regular full time hire date and attainment of age 21. KMSF contributes 10% of the employee’s earnings and employees do not contribute to this plan. KMSF contributions for 2014 and 2013 were approximately $700,000 and $800,000, respectively. The total payroll costs for employees covered by the defined contribution plan were approximately $7.2 million and $8.0 million for the years ended June 30, 2014 and 2013, respectively. Participants become vested in the plan according to years of service, with 100% vesting at three years or more.
43

In addition to retirement benefits provided from the group retirement plan, the University provides supplemental retirement income benefits to certain eligible employees in each of the retirement groups (see Note 16).
16. MINIMUM ANNUAL RETIREMENT BENEFITS AND SUPPLEMENTAL RETIREMENT INCOME
Employees in retirement groups I, II and III, referred to in Note 15 above, who were age 40 or older prior to the date of establishment of each group plan, and who were employed by the University prior to that date, qualify for the minimum annual retirement benefit provisions of the retirement plan. Benefits for these eligible employees are based upon a percentage, determined through years of service, of the participant's annual salary in the last year of employment prior to retirement. Retirement benefits as determined are funded by each individual retiree's accumulation in the group retirement plan, with the balance, if necessary, provided by the University as supplemental retirement income. No active employees were eligible for this benefit for the years ended June 30, 2014 and 2013.
The Legislature of the Commonwealth appropriates funds to the University which the University has used for payment of supplemental retirement income benefits since adoption of the group retirement plans, and is expected to continue this practice. However, the Constitution of the Commonwealth prohibits the commitment of future revenues beyond the end of the current biennium. The University does not recognize the liability for supplemental retirement income benefits during the service life of covered employees, but recognizes its costs when funds are appropriated by the Legislature and payments are made. The University intends to continue paying supplemental retirement income benefits. Supplemental retirement benefit payments were approximately $1.6 million and $1.7 million for the years ended June 30, 2014 and 2013, respectively.
The latest actuarial valuation was prepared as of July 1, 2014 by TIAA CREF. The actuarial present value of accumulated supplemental retirement income benefits as determined by this valuation, utilizing an assumed rate of return of seven percent, was approximately $5.9 million.
17. HEALTH INSURANCE BENEFITS FOR RETIREES
The University administers a single-employer defined benefit healthcare plan including medical and prescription drug benefits. The plan provides lifetime healthcare insurance benefits for eligible retirees and their surviving spouses. Employees are eligible for the University retiree health benefits upon retirement after (a) completing 15 years of continuous service and (b) age plus years of service equal at least 75 years (“rule of 75”). Employees hired on or after January 1, 2006 are eligible to participate in the retiree healthcare plan on an “access only” basis upon retirement, but must pay 100% of the cost of the selected plan. Employees hired prior to January 1, 2006 are eligible for the University subsidy based on their hire date and surviving spouses receive one-half of the health credit their spouse was entitled to if they were covered by the health plan at the time of the retiree’s death. No health credit is provided to a spouse of a living retiree. Human Resources policies and procedures define retiree health benefits and can be amended by the President of the University as delegated by the University’s Board of Trustees. Employees who were hired before August 1, 1965 are also eligible for $5,000 of life insurance coverage upon retirement.
The retiree health plan does not issue a publicly available financial report, but is included in this report of the University using the economic resources measurement focus and the accrual basis of accounting under which expenses, including benefits and refunds, are recorded when the liability is incurred. Employer contributions are recorded in the accounting period in which they are earned and become measureable. Investments are reported at fair market value and based on published prices and quotations from major investment brokers at current exchange rates, as available.
The contribution requirements of plan members and the University are established and may be amended by the President of the University. For employees hired before January 1, 2006, the University provides a pre-65 credit of up to 90% of the “true retiree” cost of the least expensive pre-65 medical plan. For post-65 benefits, the University provides a credit equal to 90% of the “true retiree” cost of the post-65 medical plan. For fiscal year 2014, the University contributed $20.0 million to the plan. Plan members receiving benefits contributed 31.2% of the premium costs, an average for combined single and family coverage. In fiscal year 2014, total member contributions were approximately $4.8 million.
44

The University has established a trust fund to segregate plan assets, and currently plans to contribute amounts to the trust fund sufficient to fully fund the annual required contribution (ARC), an amount actuarially determined in accordance with the parameters of GASB Statement No. 45. The University plans to continue to finance retiree benefits by pre-funding benefits and contributing the ARC into a segregated, protected trust fund and will amortize the initial unfunded accrued liability (UAL) over a 30 year closed period. The ARC represents a level of funding that, if paid on an ongoing basis, is projected to cover normal costs each year and amortize any unfunded actuarial liabilities (or funding excess) over a period not to exceed 30 years. The current ARC of $19.8 million is 3.9% of annual covered payroll. There are no long-term contracts for contributions to the plan.
The following table presents the other postemployment benefits (OPEB) cost for the year, the amount contributed and changes in the OPEB Plan for fiscal year 2014 (in thousands):
Annual required contribution $ 19,801
Contributions made (19,800)
Increase in net OPEB obligation/(asset) 1
Net OPEB obligation/(asset) - beginning of year (240)
Net OPEB obligation/(asset) - end of year $ (239)
The University’s annual OPEB cost, the percentage of annual OPEB cost contributed to the plan and the net OPEB obligation for fiscal year 2014, 2013 and 2012, were as follows (in thousands):
Percentage of Fiscal Year Annual Annual OPEB Net OPEB
Ended OPEB cost Cost Contributed Obligation/(Asset)
6/30/2012 $19,798 98.2% ($157)
6/30/2013 $20,392 100.4% ($240)
6/30/2014 $19,801 100.0% ($239)
As of July 1, 2014, the actuarial accrued liability (AAL) for benefits was $268.3 million, with an actuarial value of assets of $97.3 million, resulting in an unfunded actuarial accrued liability (UAAL) of $171.0 million. The covered payroll (annual payroll of active employees covered by the plan) was $513.7 million and the ratio of the UAAL to the covered payroll was 33.3% at June 30, 2014. The University implemented the University of Kentucky Other Postemployment Benefits (OPEB) Trust in July 2007, after the July 1, 2007 actuarial valuation date. As of June 30, 2014, net trust fund assets totaled $97.3 million.
Actuarial valuation of an ongoing plan involves estimates of the value of reported amounts and assumptions about the probability of events far into the future. Examples include assumptions about future employment, mortality and the healthcare cost trend. Actuarially determined amounts are subject to continual revisions as actual results are compared with past expectations and new estimates are made about the future. The schedule of funding progress, presented as required supplementary information following the notes to the financial statements, is designed to present multi-year trend information about whether the actuarial value of plan assets is increasing or decreasing over time relative to the actuarial accrued liabilities for benefits.
The projection of benefits for financial reporting purposes is based on the substantive plan (the plan as understood by the employer and the plan members) and includes the type of benefits provided at the time of each valuation and the historical pattern of sharing of benefit costs between the employer and plan members to that point. The projection of benefits for financial reporting purposes does not explicitly incorporate the potential effects for legal or contractual funding limitations on the pattern of cost sharing between the employer and plan member in the future. The actuarial methods and assumptions used include techniques that are designed to reduce the effects of short-term volatility in actuarial accrued liabilities and the actuarial value of assets, consistent with the long-term perspective of the calculations.
In the July 1, 2013 actuarial valuation, the projected unit credit actuarial cost method was used. The actuarial assumptions included a 7.5% discount rate based on the University’s funding policy (ARC funding) based on
45

the expected long-term return on the separate trust assets that will be used to finance the payment of plan benefits. The projected annual healthcare trend rate is nine percent for the pre-65 members and eight percent for the post-65 members initially, reduced in decrements to an ultimate rate of three percent for pre-65 members and five percent for post-65 members after nine years. The expected long-term payroll growth rate was assumed to be three percent per year. The initial UAAL is being amortized as a level percent of pay amount on a closed basis. The remaining amortization period at July 1, 2013 was 24 years.
18. LONG-TERM DISABILITY BENEFIT PLAN
The University is self-funded for a long-term disability income program and has established a trust for the purpose of paying claims and establishing necessary reserves. Regular employees with a full-time equivalent of .75 or greater who have completed 12 months of service are automatically enrolled in the plan. To be covered, an employee must be actively at work on the first day of the month after the employee completes one full year of service. An employee approved for long-term disability receives benefits based on the employee’s basic regular monthly salary at the time of the onset of the disabling condition. Primary income benefits provide payment of 60% of the basic regular monthly salary less any disability received from government programs and/or another employer for the same condition. Basic salary for medical faculty is defined as the tenure base salary. Other sources of income used in the benefit formula include Social Security, worker’s compensation or other similar government programs, veterans’ or other governmental disability payments, or other employer-sponsored disability benefits.
Employees approved for long-term disability receive 100% of their basic salary for the first six months and 60% thereafter. Benefits end when members recover, die, terminate employment or retire. In most cases, claimants retire at age 65. The plan also includes provisions for health insurance that allow participants who were enrolled in a health plan at the time their disability benefit began to continue health coverage (University subsidy limited to 29 months for claimants approved on or after October 1, 2006), life insurance benefit ($10,000 before July 1, 2007 or one times salary on or after July 1, 2007) and retirement contributions equal to 10% of pre-disability salary per year for applications filed on or after October 1, 2006 and 15% of pre-disability salary per year for applications filed before October 1, 2006.
The long-term disability plan does not issue a publicly available financial report, but is included in this report of the University using the economic resources measurement focus and the accrual basis of accounting under which expenses, including benefits and refunds, are recorded when the liability is incurred. Employer contributions are recorded in the accounting period in which they are earned and become measureable. Investments are reported at fair market value and based on published prices and quotations from major investment brokers at current exchange rates, as available. The coverage of the long-term disability benefits is established and may be amended by the President of the University.
The University currently plans to contribute amounts to the trust fund sufficient to fully fund the annual required contribution of the employer (ARC), an amount actuarially determined in accordance with the parameters of GASB Statement No. 45. The University plans to continue to finance long-term disabilities by pre-funding benefits and contributing to the ARC into a segregated, protected trust fund and will amortize the initial unfunded accrued liability (UAL) over a 30 year closed period. The ARC represents a level of funding that, if paid on an ongoing basis, is projected to cover normal costs each year and amortize any unfunded actuarial liabilities (or funding excess) over a period not to exceed 30 years. The current ARC of $2.1 million is 0.3% of annual covered payroll. There are no long-term contracts for contributions to the plan.
46
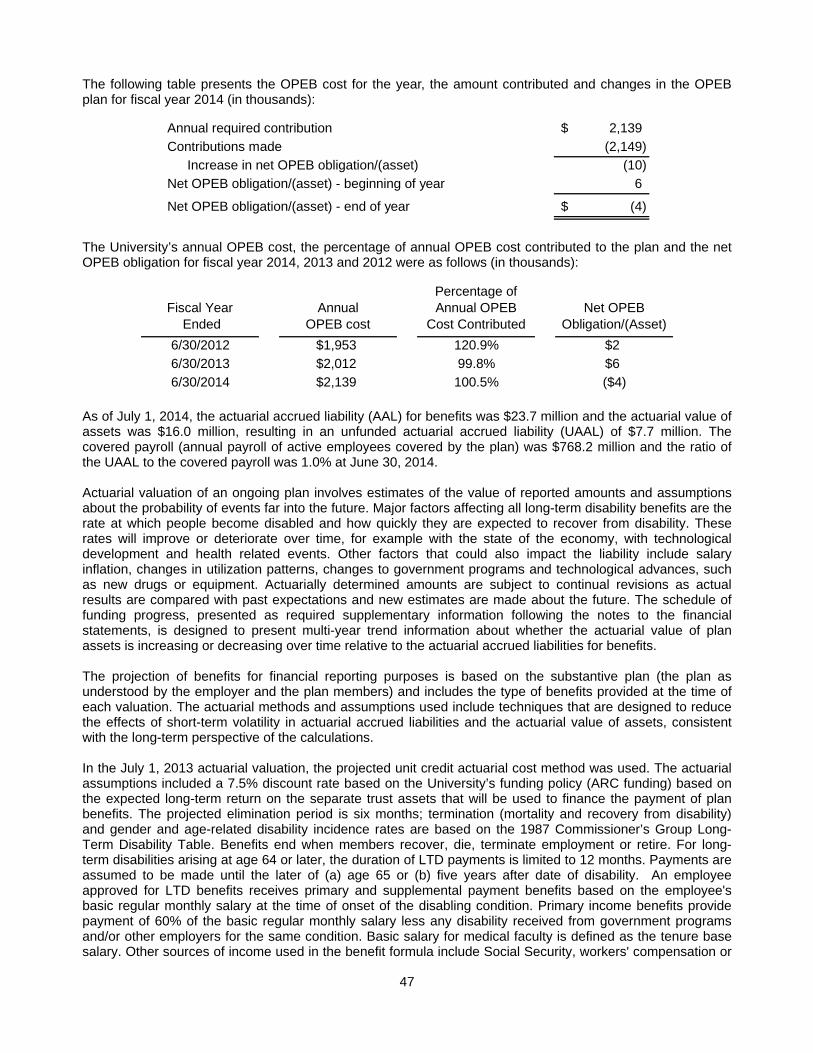
The following table presents the OPEB cost for the year, the amount contributed and changes in the OPEB plan for fiscal year 2014 (in thousands):
Annual required contribution $ 2,139
Contributions made (2,149)
Increase in net OPEB obligation/(asset) (10)
Net OPEB obligation/(asset) - beginning of year 6
Net OPEB obligation/(asset) - end of year $ (4)
The University’s annual OPEB cost, the percentage of annual OPEB cost contributed to the plan and the net OPEB obligation for fiscal year 2014, 2013 and 2012 were as follows (in thousands):
Percentage of Fiscal Year Annual Annual OPEB Net OPEB
Ended OPEB cost Cost Contributed Obligation/(Asset)
6/30/2012 $1,953 120.9% $2
6/30/2013 $2,012 99.8% $6
6/30/2014 $2,139 100.5% ($4)
As of July 1, 2014, the actuarial accrued liability (AAL) for benefits was $23.7 million and the actuarial value of assets was $16.0 million, resulting in an unfunded actuarial accrued liability (UAAL) of $7.7 million. The covered payroll (annual payroll of active employees covered by the plan) was $768.2 million and the ratio of the UAAL to the covered payroll was 1.0% at June 30, 2014.
Actuarial valuation of an ongoing plan involves estimates of the value of reported amounts and assumptions about the probability of events far into the future. Major factors affecting all long-term disability benefits are the rate at which people become disabled and how quickly they are expected to recover from disability. These rates will improve or deteriorate over time, for example with the state of the economy, with technological development and health related events. Other factors that could also impact the liability include salary inflation, changes in utilization patterns, changes to government programs and technological advances, such as new drugs or equipment. Actuarially determined amounts are subject to continual revisions as actual results are compared with past expectations and new estimates are made about the future. The schedule of funding progress, presented as required supplementary information following the notes to the financial statements, is designed to present multi-year trend information about whether the actuarial value of plan assets is increasing or decreasing over time relative to the actuarial accrued liabilities for benefits.
The projection of benefits for financial reporting purposes is based on the substantive plan (the plan as understood by the employer and the plan members) and includes the type of benefits provided at the time of each valuation. The actuarial methods and assumptions used include techniques that are designed to reduce the effects of short-term volatility in actuarial accrued liabilities and the actuarial value of assets, consistent with the long-term perspective of the calculations.
In the July 1, 2013 actuarial valuation, the projected unit credit actuarial cost method was used. The actuarial assumptions included a 7.5% discount rate based on the University’s funding policy (ARC funding) based on the expected long-term return on the separate trust assets that will be used to finance the payment of plan benefits. The projected elimination period is six months; termination (mortality and recovery from disability) and gender and age-related disability incidence rates are based on the 1987 Commissioner’s Group Long-Term Disability Table. Benefits end when members recover, die, terminate employment or retire. For long-term disabilities arising at age 64 or later, the duration of LTD payments is limited to 12 months. Payments are assumed to be made until the later of (a) age 65 or (b) five years after date of disability. An employee approved for LTD benefits receives primary and supplemental payment benefits based on the employee's basic regular monthly salary at the time of onset of the disabling condition. Primary income benefits provide payment of 60% of the basic regular monthly salary less any disability received from government programs and/or other employers for the same condition. Basic salary for medical faculty is defined as the tenure base salary. Other sources of income used in the benefit formula include Social Security, workers' compensation or
47

salary. Other sources of income used in the benefit formula include Social Security, workers' compensation or other similar government programs, veterans' or other governmental disability payments, or other employer-sponsored disability benefits.
The University provides supplemental payment benefits for 42 months following the date of disability onset based on the following schedule (for current LTD participants or employees approved for LTD benefits prior to October 1, 2006):
Months Percentage of Salary
1-6 100%
7-18 90%
19-30 80% 31-42 70%
43-End of Benefit 60%
Claimants that file applications and who are approved for benefits on October 1, 2006 or after will have benefits based on the following schedule:
Months Percentage of Salary
1-6 100%
7-End of Benefit 60%
The projected long-term income benefit is based on actual net benefit currently being paid with social security offset. For people who have been disabled for less than 24 months and are currently not entitled to a social security offset, it was assumed that the offset will eventually be approved according to the following table:
Months Since Disability Proportion
<12 5%
12-17 40%
18-23 40%
24+ 80%
The future salary increase for active members was assumed to be three percent per year. The UAAL is being amortized as a level percent of pay amount on a closed basis. The remaining amortization period at July 1, 2013 was 24 years.
19. RISK MANAGEMENT
The University is exposed to various risks of loss related to torts; theft of, damage to, and destruction of assets; errors and omissions; injuries to employees; and natural disasters. These risks are covered by (1) the State Fire and Tornado Insurance Fund (the Fund), (2) Sovereign Immunity and the State Board of Claims, or (3) in the case of risks not covered by the Fund and Sovereign Immunity, commercial insurance, participation in insurance risk retention groups or self-insurance.
The Fund covers losses to property from fire, wind, earthquake, flood and most other causes of loss between $250,000 and $1.0 million per occurrence. Losses in excess of $1.0 million are insured by commercial carriers up to $1.25 billion per occurrence with buildings and contents insured at replacement cost. As a state agency, the University is vested with Sovereign Immunity and is subject to the provisions of the Board of Claims Act, under which the University's liability for certain negligence claims is limited to $200,000 for any one person or $350,000 for all persons damaged by a single act of negligence. Claims against educators' errors and omissions and wrongful acts are insured through a reciprocal risk retention group. There have been no significant reductions in insurance coverage from 2013 to 2014. Settlements have not exceeded insurance coverage during the past three years.
48

The University and its agents are insured against medical malpractice by a combination of Sovereign Immunity, self-insurance, commercial liability insurance and an excess coverage fund established by the Commonwealth. An actuarial valuation is performed to determine the self-insurance funding requirements and the fund liability, which has been discounted using an interest rate of 3.5%. The malpractice liability as of June 30, 2014 is based on the requirements of GASB Statement No. 10, which requires that a liability for claims be recorded if it is probable that a loss has occurred and the amount of loss can be reasonably estimated. The liability includes an estimate for claims that have been incurred but not reported as of June 30, 2014.
The University also self-insures certain employee benefits, including health insurance, worker's compensation and unemployment claims to the extent not covered by insurance. The University has recorded an estimate for asserted claims at June 30, 2014.
20. CONTINGENCIES
The University is a defendant in various lawsuits. The nature of the educational and health care industries is such that, from time to time, claims will be presented on account of alleged negligence, acts of discrimination, medical malpractice, breach of contract or disagreements arising from the interpretation of laws or regulations. While some of these claims may be for substantial amounts, they are not unusual in the ordinary course of providing educational and health care services at a large institution. However, University officials are of the opinion, based on advice of in-house legal counsel, that the effect of the ultimate outcome of all litigation will not be material to the future operations or financial position of the University.
21. RESEARCH CHALLENGE TRUST FUND
The Research Challenge Trust Fund (RCTF) was created by the Kentucky General Assembly with the passage of the Postsecondary Education Improvement Act of 1997 (House Bill 1). The objectives of the RCTF, as stated in the Bill, include support of efforts by the University to attain status as a top-20 public research university. The RCTF Endowment Match Program provides state funds on a dollar-for-dollar match basis. This program, also known as “Bucks for Brains,” supports endowed chairs, professorships and graduate fellowships, and the research and graduate mission of the University.
With the passage of the 2008-10 budget of the Commonwealth, the 2008 General Assembly authorized $50.0 million in General Fund supported bonds in 2008-09 for the RCTF to support the Endowment Match Program and a newly created Research Capital Match Program. In accordance with KRS 164.7917, these funds were allocated two-thirds to the University of Kentucky ($33.3 million) and one-third to the University of Louisville ($16.7 million). At its June 9, 2009 Board Meeting, the University’s Board of Trustees approved the allocation of the University’s RCTF appropriation as follows: $21.9 million to the Research Capital Match Program and $11.4 million to the Endowment Match Program.
The status of the RCTF endowed funds as of June 30, 2014, is summarized as follows (in thousands):
Kentucky University General of Kentucky State Funds Matching
Assembly Share of Received Pledges Funding Funding to Date Receivable
1998 Biennium 100,000 $ 66,667 $ 66,667 $ $ -2000 Biennium 100,000 68,857 68,857 -2002 Biennium 100,000 66,667 66,667 -2008 Biennium: Capital Projects 21,927 21,927 21,927 147 2008 Biennium: RCTF 28,073 11,406 11,406 21
Total $ 350,000 $ 235,524 $ 235,524 $ 168
Interest income of approximately $2.2 million was earned on the state matching funds was included in the University’s share of the 2000 biennium funding.
49

21
The University expects to fully realize all outstanding matching pledges; however, it may be obligated to return any state funds and accrued interest income related to pledges not received within five years of the initial pledge dates if unable to replace the unpaid pledges with other eligible gifts.
A schedule of outstanding pledges is shown below (in thousands):
2008 2008 2002 Biennium: Biennium:
Biennium Capital Projects RCTF
Pledges due in fiscal year 2015 $ - $ 147 $
22. CANCER RESEARCH MATCHING FUND
The Kentucky General Assembly created the Cancer Research Institutions Matching Fund, which is funded by a one-cent surtax levied on each 20 cigarettes sold in Kentucky. Tax revenues are made available equally to the University of Kentucky and the University of Louisville when matched dollar-for-dollar by private sources.
A summary of the receipts and expenses related to the fund as of June 30, 2014 and 2013 follows (in thousands):
2014 2013
Funds from private sources approved for match $ 5,715 $ 6,999 Cigarette excise tax funds distributed 1,901 2,007
Total cancer research matching fund revenues $ 7,616 $ 9,006
Cancer research matching fund expenses $ 7,028 $ 6,987
23. STUDENT HOUSING PARTNERSHIP
The University entered an agreement in April 2012 with a third party developer, Education Realty Trust (EdR), to construct two four-story buildings, which comprise a 601 bed living-learning community with three classrooms, 16 active-learning spaces, Honor’s Program offices, and nine multipurpose meeting spaces on the former site of Haggin Field. The project, with an estimated cost of $25.2 million, is on land owned by the University and leased to EdR for a 50 year term with options for additional 10 year and 15 year terms thereafter. At the conclusion of the initial 50 year term or the first renewal option, the University will be required to purchase the buildings from EdR for an appraised value, unless the ground lease is renewed for the first or second optional extension. At the conclusion of the second optional extension, the University is required to purchase the buildings for the greater of current net book value or $10. Ground rent is a percentage of gross revenues. The University accounts for the ground lease as an operating lease. These facilities are subject to ad valorem tax. These two residence halls opened on August 16, 2013 for the Fall 2013 semester.
Phases II-A and II-B of the long-term housing plan agreements have also been signed with EdR. These phases include eight residence halls to be constructed between October 2012 and August 2015. The University has received authorization from the Kentucky legislature for the new projects, which the Commonwealth must approve statutorily even though EdR, not the University, is financing the projects.
Phase II-A, which came on line in August 2014, included the development of five residence halls at an approximate cost of $138.0 million and Phase II-B, expected on line in August 2015, includes the construction of three residence halls at an approximate cost of $101.2 million. The 75 year term lease with EdR includes maintenance standards for the facilities and parameters for the room rental rates for the duration. The University will receive a percentage of the total revenues and a share of the net income, after EdR achieves a minimum internal rate of return. These eight facilities are exempt from ad valorem tax. The University will account for the lease as a service concession arrangement in accordance with GASB Statement No. 60, Accounting and Financial Reporting for Service Concession Arrangements.
50

24. NATURAL CLASSIFICATION
The University’s operating expenses by natural classification were as follows for the years ended June 30, 2014 and 2013 (in thousands):
2014 2013 Salaries and wages 1,179,988 $ 1,114,676$ Employee benefits 358,804 345,945 Supplies and services 582,175 539,323 Depreciation 131,262 133,066 Student scholarships and financial aid 60,401 48,361 Purchased utilities 53,093 46,760 Other, various 75,860 71,787
Total 2,441,583 $ 2,299,918$
25. SUBSEQUENT EVENTS
In July 2014, the University entered into a nearly $250.0 million contract with Aramark, forming a 15 year public/private partnership. This partnership will transform dining services offered to students, faculty, staff, and the community served. Under the partnership, several new food brands will be located on campus starting in the Fall of 2014 and continuing the next year. Aramark will provide meals covered under the University’s student boarding plans and declining balance dollars. The contract allows for dining commissions to be paid to the University with guaranteed minimum amounts for each contract year. The 2014-15 minimum guaranteed commission will be approximately $1.8 million. Aramark will provide $70.0 million in facilities investments, including $40.0 million in new facilities, subject to board approval, to be completed by fiscal year 2017-18. As part of these facilities investments, Aramark will construct a new K Lair at Haggin Hall and make substantial upgrades to the Student Center Food Court to be completed for the Fall 2014 semester and construct a new Commons Food Court for the Fall 2015 semester. Additionally, the contract provides for various other annual payments to cover various expenses and new dining related initiatives totaling over $1.1 million in the first year of the contract. The contract also provides a one-time grant of $1.0 million to be paid in October 2014.
A multimedia rights partnership was also formed in July 2014 between the University and JMI Sports providing athletics and campus multimedia marketing rights in a 15 year, $210.0 million agreement. Under the contract, the University will receive a guaranteed rights fee in each of the 15 years of the partnership, starting at $9.1 million in 2015-16 and increasing to $16.0 million in fiscal year 2029-30. The agreement also included a $29.4 million signing bonus to be paid over the first two years of the contract.
On July 28, 2014, the University issued $88.1 million in General Receipts Refunding Bonds Series 2014 D to refund CEBRB, Series P, Q, R(2nd) and partially refund General Receipts Series 2005 A bonds and 2005 A notes. The $88.1 million of bond proceeds, the $13.7 million in premium (net of cost of issuance) paid by underwriters, the $5.4 million released from debt service reserves, and the $558,000 in termination payments combine to provide the total amount of $107.8 million needed to call the bonds. The debt service savings for fiscal year 2014-15 will be approximately $1.8 million and a total of $16.8 million through fiscal year 2025-26. The debt service payments on the new bonds are scheduled semi-annually at amounts that range from $5.8 million to $11.9 million with interest rates that range from three percent to 5.25%.
26. COMBINED CONDENSED STATEMENTS
The University of Kentucky and its blended component units’ condensed statements were summarized as follows for the years ended June 30, 2014 and 2013 (in thousands):
51

52
UN
IVE
RS
ITY
OF
KE
NT
UC
KY
A C
OM
PO
NE
NT
UN
IT O
F T
HE
CO
MM
ON
WE
AL
TH
OF
KE
NT
UC
KY
CO
MB
INE
D C
ON
DE
NS
ED
ST
AT
EM
EN
T O
F N
ET
PO
SIT
ION
AS
OF
JU
NE
30,
201
4(i
n t
ho
usa
nd
s)
Glu
ck
Cen
tral
Ken
tuck
y E
quin
e M
inin
g C
ente
r K
entu
cky
Med
ical
Res
earc
h T
he
Res
earc
h H
uman
ities
E
ngin
eeri
ngon
Man
agem
ent
Ser
vice
s U
K
Fou
ndat
ion
Fun
dF
ound
atio
n F
ound
atio
n F
ound
atio
n A
ging
S
ervi
ces
Fou
ndat
ion
E
limin
atio
ns
Tot
al
AS
SE
TS
Cu
rren
t A
sset
sC
ash
and
cash
equ
ival
ents
$
343,
011
$ 37
,115
$ 6,
313
$ 37
7$
94$
4$
109
$ 58
7$
253
$ -
$ 38
7,86
3N
otes
, loa
ns a
nd a
ccou
nts
rece
ivab
le, n
et
214,
446
33,5
97
4,39
3 -
--
--
24,7
33
(37,
081)
24
0,08
8 In
vest
men
ts
--
--
--
--
26,4
52
-26
,452
In
vent
orie
s an
d ot
her
asse
ts
37,4
83
2,89
8 -
--
--
14
53
(12)
40
,436
T
otal
cur
rent
ass
ets
594,
940
73,6
10
10,7
06
377
94
4 10
9 60
1 51
,491
(3
7,09
3)
694,
839
No
ncu
rren
t A
sset
sR
estr
icte
d ca
sh a
nd c
ash
equi
vale
nts
293,
028
--
--
--
--
-29
3,02
8 E
ndow
men
t inv
estm
ents
1,
198,
655
4,25
6 13
7 8,
859
1,37
0 1,
949
--
--
1,21
5,22
6 O
ther
long
-ter
m in
vest
men
ts
202,
498
1,41
7 -
--
--
-44
,470
(2
77)
248,
108
Not
es, l
oans
and
acc
ount
s re
ceiv
able
, net
58
,831
-
--
--
--
801
(220
) 59
,412
O
ther
non
curr
ent a
sset
s 54
0 16
2 -
--
--
--
-70
2 C
apita
l ass
ets,
net
1,
927,
980
13,5
22
--
--
-20
2 37
,700
-
1,97
9,40
4 T
otal
non
curr
ent a
sset
s 3,
681,
532
19,3
57
137
8,85
9 1,
370
1,94
9 -
202
82,9
71
(497
) 3,
795,
880
Tot
al a
sset
s 4,
276,
472
92,9
67
10,8
43
9,23
6 1,
464
1,95
3 10
9 80
3 13
4,46
2 (3
7,59
0)
4,49
0,71
9
LIA
BIL
ITIE
S A
ND
DE
FE
RR
ED
INF
LO
WS
OF
RE
SO
UR
CE
SC
urr
ent
Lia
bili
ties
Acc
ount
s pa
yabl
e an
d ac
crue
d lia
bilit
ies
210,
922
14,0
22
451
-1
--
601
95,1
26
(93,
547)
22
7,57
6 U
near
ned
reve
nue
31,2
42
28,7
10
77
--
--
--
(12)
60
,017
Lo
ng-t
erm
liab
ilitie
s -
curr
ent p
ortio
n
69,0
36
178
--
--
--
1,37
3 (1
20)
70,4
67
Tot
al c
urre
nt li
abili
ties
311,
200
42,9
10
528
-1
--
601
96,4
99
(93,
679)
35
8,06
0 N
on
curr
ent
Lia
bili
ties
Acc
ount
s pa
yabl
e an
d ac
crue
d lia
bilit
ies
2,47
6
--
--
--
--
-2,
476
Long
-ter
m li
abili
ties
961,
793
1,06
1 -
--
--
-20
,267
(2
80)
982,
841
Tot
al n
oncu
rren
t lia
bilit
ies
964,
269
1,06
1 -
--
--
-20
,267
(2
80)
985,
317
Tot
al li
abili
ties
1,27
5,46
9 43
,971
52
8 -
1 -
-60
1 11
6,76
6 (9
3,95
9)
1,34
3,37
7 D
efer
red
Infl
ow
s o
f R
eso
urc
es
3,49
0 -
--
--
--
--
3,49
0 T
otal
liab
ilitie
s an
d de
ferr
ed in
flow
s of
res
ourc
es
1,27
8,95
9 43
,971
52
8 -
1 -
-60
1 11
6,76
6 (9
3,95
9)
1,34
6,86
7
INT
ER
FU
ND
BA
LA
NC
ES
(2
,369
) 1,
564
806
--
(1)
--
--
-
NE
T P
OS
ITIO
NN
et in
vest
men
t in
cap
ital
ass
ets
1,31
7,48
3 13
,440
-
--
--
202
16,6
53
-1,
347,
778
Res
tric
ted
Non
expe
ndab
le
567,
263
823
31
4,60
7 61
7 65
4 -
--
-57
3,99
5 E
xpen
dabl
e 41
6,31
6 4,
192
653
4,62
9 84
6 1,
300
109
--
-42
8,04
5 T
otal
res
tric
ted
983,
579
5,01
5 68
4 9,
236
1,46
3 1,
954
109
--
-1,
002,
040
Un
rest
rict
ed
698,
820
28,9
77
8,82
5 -
--
--
1,04
3 56
,369
79
4,03
4
Tot
al n
et p
ositi
on
$ 2,
999,
882
$ 47
,432
$ 9,
509
$ 9,
236
$ 1,
463
$ 1,
954
$ 10
9$
202
$ 17
,696
$ 56
,369
$ 3,
143,
852

53
UN
IVE
RS
ITY
OF
KE
NT
UC
KY
A C
OM
PO
NE
NT
UN
IT O
F T
HE
CO
MM
ON
WE
AL
TH
OF
KE
NT
UC
KY
CO
MB
INE
D C
ON
DE
NS
ED
ST
AT
EM
EN
T O
F N
ET
PO
SIT
ION
AS
OF
JU
NE
30,
201
3(i
n t
ho
usa
nd
s)
Glu
ck
Cen
tral
Ken
tuck
yE
quin
e M
inin
g C
ente
rK
entu
cky
Med
ical
Res
earc
h T
he
Res
earc
h H
uman
ities
E
ngin
eeri
ngon
Man
agem
ent
Ser
vice
sU
K
Fou
ndat
ion
Fun
d F
ound
atio
n F
ound
atio
n F
ound
atio
n A
ging
S
ervi
ces
Fou
ndat
ion
Elim
inat
ions
T
otal
A
SS
ET
SC
urr
ent
Ass
ets
Cas
h an
d ca
sh e
quiv
alen
ts
$ 33
6,01
0$
46,6
73$
6,99
2$
128
$
98$
6
$
82$
49
8$
1,
488
$ -
$ 39
1,97
5N
otes
, lo
ans
and
acco
unts
rec
eiva
ble,
net
19
3,75
3 36
,042
2,
397
15
-
--
26,1
88
(29,
358)
22
9,03
7 In
vest
men
ts
--
--
--
--
6,94
4
-6,
944
In
vent
orie
s an
d ot
her
asse
ts
33,5
02
2,33
8
--
--
-13
65
-
35,9
18
Tot
al c
urre
nt a
sset
s 56
3,26
5 85
,053
9,
389
14
3
98
6
82
511
34
,685
(2
9,35
8)
663,
874
No
ncu
rren
t A
sset
sR
estr
icte
d ca
sh a
nd c
ash
equi
vale
nts
59,8
92
--
--
--
--
-59
,892
E
ndow
men
t in
vest
men
ts
1,03
9,49
4 3,
809
242
7,
934
1,
226
1,
743
-
--
-1,
054,
448
Oth
er lo
ng-t
erm
inve
stm
ents
11
9,18
4 1,
486
-
--
--
-41
,198
(2
94)
161,
574
Not
es,
loan
s an
d ac
coun
ts r
ecei
vabl
e, n
et
49,9
79
--
--
--
-83
9
(340
) 50
,478
O
ther
non
curr
ent
asse
ts
1,33
7 16
2
--
--
--
--
1,49
9
Cap
ital a
sset
s, n
et
1,90
4,39
0 14
,704
-
--
--
161
36
,476
-
1,95
5,73
1 T
otal
non
curr
ent
asse
ts
3,17
4,27
6 20
,161
24
2
7,93
4
1,22
6
1,74
3
-16
1
78,5
13
(634
) 3,
283,
622
Tot
al a
sset
s 3,
737,
541
105,
214
9,63
1 8,
077
1,
324
1,
749
82
67
2
113,
198
(29,
992)
3,
947,
496
LIA
BIL
ITIE
S A
ND
DE
FE
RR
ED
IN
FL
OW
S O
F R
ES
OU
RC
ES
Cu
rren
t L
iab
ilit
ies
Acc
ount
s pa
yabl
e an
d ac
crue
d lia
bilit
ies
170,
711
17,2
31
419
-
-7
-
511
75
,006
(7
1,53
9)
192,
346
Une
arne
d re
venu
e 29
,861
34
,558
13
3
--
--
--
-64
,552
Lo
ng-t
erm
liab
iliie
s -
curr
ent
port
ion
68,4
40
312
-
--
--
-1,
265
(1
20)
69,8
97
Tot
al c
urre
nt li
abili
ties
269,
012
52,1
01
552
-
-7
-
511
76
,271
(7
1,65
9)
326,
795
No
ncu
rren
t L
iab
ilit
ies
Long
-ter
m li
abili
ies
731,
203
1,41
1
--
--
--
20,9
64
(400
) 75
3,17
8 T
otal
non
curr
ent
liabi
litie
s 73
1,20
3 1,
411
-
--
--
-20
,964
(4
00)
753,
178
Tot
al li
abili
ties
1,00
0,21
5 53
,512
55
2
--
7
-51
1
97,2
35
(72,
059)
1,
079,
973
Def
erre
d I
nfl
ow
s o
f R
eso
urc
es
5,01
7 -
--
--
--
--
5,01
7
Tot
al li
abili
ties
and
defe
rred
inflo
ws
of r
esou
rces
1,
005,
232
53,5
12
552
-
-7
-
511
97
,235
(7
2,05
9)
1,08
4,99
0
INT
ER
FU
ND
BA
LA
NC
ES
(2
,910
) 2,
131
77
9
--
--
--
--
NE
T P
OS
ITIO
NN
et i
nve
stm
ent
in c
apit
al a
sset
s 1,
263,
284
14,4
67
--
--
-16
1
15,3
66
-1,
293,
278
Res
tric
ted
Non
expe
ndab
le
560,
949
822
31
4,
607
61
7
650
-
--
-56
7,67
6 E
xpen
dabl
e 30
4,67
1 3,
660
55
5
3,47
0
707
1,
092
82
-
--
314,
237
Tot
al r
estr
icte
d 86
5,62
0 4,
482
58
6
8,07
7
1,32
4
1,74
2
82
--
-88
1,91
3 U
nre
stri
cted
60
6,31
5 30
,622
7,
714
-
--
--
597
42
,067
68
7,31
5
Tot
al n
et p
ositi
on
$ 2,
735,
219
$ 49
,571
$ 8,
300
$ 8,
077
$ 1,
324
$ 1,
742
$
82$
16
1$
15,9
63$
42,0
67$
2,86
2,50
6

54
UN
IVE
RS
ITY
OF
KE
NT
UC
KY
A C
OM
PO
NE
NT
UN
IT O
F T
HE
CO
MM
ON
WE
AL
TH
OF
KE
NT
UC
KY
CO
MB
INE
D C
ON
DE
NS
ED
ST
AT
EM
EN
T O
F R
EV
EN
UE
S, E
XP
EN
SE
S A
ND
CH
AN
GE
S IN
NE
T P
OS
ITIO
N F
OR
TH
E Y
EA
R E
ND
ED
JU
NE
30,
201
4(i
n t
ho
usa
nd
s)
Glu
ck
Cen
tral
Ken
tuck
y E
quin
e M
inin
g C
ente
r K
entu
cky
Med
ical
Res
earc
h T
he
Res
earc
h H
uman
ities
E
ngin
eeri
ngon
Man
agem
ent
Ser
vice
s U
K
Fou
ndat
ion
Fun
dF
ound
atio
n F
ound
atio
n F
ound
atio
n A
ging
S
ervi
ces
Fou
ndat
ion
E
limin
atio
ns
Tot
al
OP
ER
AT
ING
RE
VE
NU
ES
Stu
dent
tuiti
on a
nd fe
es, n
et
$ 28
7,51
7$
-$
-$
-$
-$
-$
-$
-$
-$
-$
287,
517
Fed
eral
gra
nts
and
cont
ract
s 1,
553
158,
831
--
--
--
--
160,
384
Sta
te a
nd lo
cal g
rant
s an
d co
ntra
cts
47,6
53
19,1
02
1,00
0 -
--
--
--
67,7
55
Non
gove
rnm
enta
l gra
nts
and
cont
ract
s 14
0,47
5 27
,283
9,
193
--
--
--
(148
,911
) 28
,040
R
ecov
erie
s of
faci
litie
s an
d ad
min
istr
ativ
e co
sts
320
46
,839
-
--
--
--
-47
,159
S
ales
and
ser
vice
s 27
,635
14
,065
13
,781
-
--
34
6,77
9 -
(7,5
29)
54,7
65
Fed
eral
app
ropr
iatio
ns
17,9
21
--
--
--
--
-17
,921
C
ount
y ap
prop
riat
ions
20
,338
-
--
--
--
--
20,3
38
Pro
fess
iona
l clin
ical
ser
vice
fees
-
--
--
--
-20
7,73
4 (4
,013
) 20
3,72
1 H
ospi
tal s
ervi
ces
1,11
3,45
3 -
--
--
--
-(1
1,79
1)
1,10
1,66
2 A
uxili
ary
ente
rpri
ses:
Hou
sing
and
din
ing,
net
53
,401
-
--
--
--
-(2
,248
) 51
,153
A
thle
tics
73,9
57
--
--
--
--
-73
,957
O
ther
aux
iliar
ies
32,3
47
--
--
--
--
(2,0
64)
30,2
83
Oth
er o
pera
ting
reve
nues
96
7 -
--
--
--
21,7
32
(18,
183)
4,
516
Tot
al o
pera
ting
reve
nues
1,
817,
537
266,
120
23,9
74
--
-34
6,
779
229,
466
(194
,739
) 2,
149,
171
OP
ER
AT
ING
EX
PE
NS
ES
Edu
catio
nal a
nd g
ener
al:
Inst
ruct
ion
260,
345
11,5
46
981
-6
52
--
-(1
,073
) 27
1,85
7 R
esea
rch
89,9
77
157,
451
302
24
--
--
-(2
,441
) 24
5,31
3 P
ublic
ser
vice
15
2,61
4 71
,145
3,
154
--
--
--
(15,
434)
21
1,47
9 Li
brar
ies
21,0
89
--
--
--
--
(19)
21
,070
A
cade
mic
sup
port
64
,270
2,
882
4,64
7 -
--
--
-(3
17)
71,4
82
Stu
dent
ser
vice
s 36
,141
24
1,
094
-2
--
--
(471
) 36
,790
In
stitu
tiona
l sup
port
48
,845
72
0 12
2 -
--
125
6,67
6 -
(7,1
93)
49,2
95
Ope
ratio
ns a
nd m
aint
enan
ce o
f pla
nt
79,8
06
7 23
7 -
--
--
-(2
27)
79,8
23
Stu
dent
fina
ncia
l aid
37
,960
1,
281
2,87
6 -
40
--
--
(58)
42
,099
D
epre
ciat
ion
64,6
82
1,48
0 -
--
--
62
--
66,2
24
Tot
al e
duca
tiona
l and
gen
eral
85
5,72
9 24
6,53
6 13
,413
24
48
52
12
5 6,
738
-(2
7,23
3)
1,09
5,43
2 C
linic
al o
pera
tions
(in
clud
ing
depr
ecia
tion
of $
2,02
1)
116,
783
--
--
--
-22
6,91
7 (1
72,7
45)
170,
955
Hos
pita
l (in
clud
ing
depr
ecia
tion
of $
51,4
60)
1,02
0,90
4 -
59
--
--
--
(8,3
38)
1,01
2,62
5 A
uxili
ary
ente
rpri
ses:
Hou
sing
and
din
ing
(inc
ludi
ng d
epre
ciat
ion
of $
5,82
3)
52,9
30
--
--
--
--
(514
) 52
,416
A
thle
tics
(inc
ludi
ng d
epre
ciat
ion
of $
5,73
4)
92,7
84
--
--
--
--
(1,4
62)
91,3
22
Oth
er a
uxili
arie
s 17
,986
-
--
--
--
-(5
37)
17,4
49
Oth
er o
pera
ting
expe
nses
1,
384
--
--
--
--
-1,
384
Tot
al o
pera
ting
expe
nses
2,
158,
500
246,
536
13,4
72
24
48
52
125
6,73
8 22
6,91
7 (2
10,8
29)
2,44
1,58
3 N
et in
com
e (l
oss)
from
ope
ratio
ns
(340
,963
) 19
,584
10
,502
(2
4)
(48)
(5
2)
(91)
41
2,
549
16,0
90
(292
,412
) N
ON
OP
ER
AT
ING
RE
VE
NU
ES
(E
XP
EN
SE
S)
Sta
te a
ppro
pria
tions
28
3,86
9 -
--
--
--
--
283,
869
Gift
s an
d no
n-ex
chan
ge g
rant
s 97
,185
19
1 20
8 92
1
-11
8 -
(1,0
24)
96,7
71
Inve
stm
ent i
ncom
e (l
oss)
15
3,92
2 39
9 29
1,
220
189
268
-87
(5
67)
155,
547
Inte
rest
on
capi
tal a
sset
-rel
ated
deb
t (2
9,37
1)
(14)
-
--
--
-(9
03)
-(3
0,28
8)
Gra
nt to
/(fr
om)
the
Uni
vers
ity fo
r no
n-ca
pita
l pur
pose
s 21
,502
(1
1,83
9)
(9,5
26)
(129
) (3
) (5
) -
--
--
Oth
er n
onop
erat
ing
reve
nues
and
exp
ense
s, n
et
4,51
7 2,
932
--
--
--
--
7,44
9 N
et n
onop
erat
ing
reve
nues
(ex
pens
es)
531,
624
(8,3
31)
(9,2
89)
1,18
3 18
7 26
3 11
8 -
(816
) (1
,591
) 51
3,34
8 N
et in
com
e (l
oss)
bef
ore
othe
r re
venu
es, e
xpen
ses,
gai
ns, o
r lo
sses
19
0,66
1 11
,253
1,
213
1,15
9 13
9 21
1 27
41
1,
733
14,4
99
220,
936
Cap
ital g
rant
s an
d gi
fts
50,6
26
3,59
9 -
--
--
-(1
57)
54,0
68
Add
ition
s to
per
man
ent e
ndow
men
ts
7,61
4 1
--
-3
--
-(4
0)
7,57
8 G
rant
to/(
from
) th
e U
nive
rsity
for
capi
tal p
urpo
ses
16,9
49
(16,
943)
(4
) -
-(2
) -
--
--
Oth
er, n
et
(1,1
87)
(49)
-
--
--
--
-(1
,236
) T
otal
oth
er r
even
ues
(exp
ense
s)
74,0
02
(13,
392)
(4
) -
-1
--
-(1
97)
60,4
10
INC
RE
AS
E (
DE
CR
EA
SE
) IN
NE
T P
OS
ITIO
N
264,
663
(2,1
39)
1,20
9 1,
159
139
212
27
41
1,73
3 14
,302
28
1,34
6 N
ET
PO
SIT
ION
, beg
inn
ing
of
year
2,
735,
219
49,5
71
8,30
0 8,
077
1,32
4 1,
742
82
161
15,9
63
42,0
67
2,86
2,50
6 N
ET
PO
SIT
ION
, en
d o
f ye
ar
$ 2,
999,
882
$ 47
,432
$ 9,
509
$ 9,
236
$ 1,
463
$ 1,
954
$ 10
9$
202
$ 17
,696
$ 56
,369
$ 3,
143,
852

55
UN
IVE
RS
ITY
OF
KE
NT
UC
KY
A C
OM
PO
NE
NT
UN
IT O
F T
HE
CO
MM
ON
WE
AL
TH
OF
KE
NT
UC
KY
CO
MB
INE
D C
ON
DE
NS
ED
ST
AT
EM
EN
T O
F R
EV
EN
UE
S, E
XP
EN
SE
S A
ND
CH
AN
GE
S IN
NE
T P
OS
ITIO
N F
OR
TH
E Y
EA
R E
ND
ED
JU
NE
30,
201
3(i
n t
ho
usa
nd
s)
Glu
ck
Cen
tral
Ken
tuck
y E
quin
e M
inin
g C
ente
r K
entu
cky
Med
ical
Res
earc
h T
he
Res
earc
h H
uman
ities
E
ngin
eeri
ngon
Man
agem
ent
Ser
vice
s R
esta
ted
UK
F
ound
atio
n F
und
Fou
ndat
ion
Fou
ndat
ion
Fou
ndat
ion
Agi
ng
Ser
vice
s F
ound
atio
n
Elim
inat
ions
(Not
e 1)
Tot
alO
PE
RA
TIN
G R
EV
EN
UE
SS
tude
nt tu
ition
and
fees
, net
$
265,
293
$ -
$ -
$ -
$ -
$ -
$ -
$ -
$ -
$ -
$ 26
5,29
3F
eder
al g
rant
s an
d co
ntra
cts
1,42
6 16
3,78
8 -
--
--
--
-16
5,21
4 S
tate
and
loca
l gra
nts
and
cont
ract
s 39
,633
46
,528
98
2 -
--
--
--
87,1
43
Non
gove
rnm
enta
l gra
nts
and
cont
ract
s 14
0,38
0 30
,321
6,
748
--
--
--
(146
,428
) 31
,021
R
ecov
erie
s of
faci
litie
s an
d ad
min
istr
ativ
e co
sts
263
47
,599
-
--
--
--
-47
,862
S
ales
and
ser
vice
s 26
,987
10
,881
13
,833
1
--
31
6,55
8 -
(7,8
18)
50,4
73
Fed
eral
app
ropr
iatio
ns
16,8
90
--
--
--
--
-16
,890
C
ount
y ap
prop
riat
ions
19
,312
-
--
--
--
--
19,3
12
Pro
fess
iona
l clin
ical
ser
vice
fees
-
--
--
--
-20
0,55
9 (3
,585
) 19
6,97
4 H
ospi
tal s
ervi
ces
950,
013
--
--
--
--
(4,1
28)
945,
885
Aux
iliar
y en
terp
rise
s:
-H
ousi
ng a
nd d
inin
g, n
et
52,1
02
--
--
--
--
(1,6
76)
50,4
26
Ath
letic
s 72
,033
-
--
--
--
--
72,0
33
Oth
er a
uxili
arie
s 32
,571
-
--
--
--
-(2
,024
) 30
,547
O
ther
ope
ratin
g re
venu
es
988
--
--
--
-6,
422
(3,6
38)
3,77
2 T
otal
ope
ratin
g re
venu
es
1,61
7,89
1 29
9,11
7 21
,563
1
--
31
6,55
8 20
6,98
1 (1
69,2
97)
1,98
2,84
5 O
PE
RA
TIN
G E
XP
EN
SE
SE
duca
tiona
l and
gen
eral
:In
stru
ctio
n 24
4,78
7 12
,998
31
5 -
-80
-
--
(664
) 25
7,51
6 R
esea
rch
84,1
71
165,
670
228
9 -
--
--
(2,5
28)
247,
550
Pub
lic s
ervi
ce
131,
085
98,1
75
1,14
9 -
--
--
-(6
52)
229,
757
Libr
arie
s 19
,497
-
3 -
--
--
-(1
3)
19,4
87
Aca
dem
ic s
uppo
rt
58,0
68
2,87
9 4,
161
--
--
--
(343
) 64
,765
S
tude
nt s
ervi
ces
33,4
23
39
1,12
0 -
1 -
--
-(4
77)
34,1
06
Inst
itutio
nal s
uppo
rt
51,9
25
818
224
10
--
109
6,54
9 -
(6,9
33)
52,7
02
Ope
ratio
ns a
nd m
aint
enan
ce o
f pla
nt
63,2
16
--
--
--
--
(18)
63
,198
S
tude
nt fi
nanc
ial a
id
25,9
80
1,75
6 2,
529
-30
-
--
-(4
4)
30,2
51
Dep
reci
atio
n 67
,882
1,
553
--
--
-73
-
-69
,508
T
otal
edu
catio
nal a
nd g
ener
al
780,
034
283,
888
9,72
9 19
31
80
10
9 6,
622
-(1
1,67
2)
1,06
8,84
0 C
linic
al o
pera
tions
(in
clud
ing
depr
ecia
tion
of $
1,99
5)
125,
369
--
--
--
-20
6,55
6 (1
45,1
36)
186,
789
Hos
pita
l (in
clud
ing
depr
ecia
tion
of $
51,2
61)
899,
280
-55
-
--
--
-(8
,330
) 89
1,00
5 A
uxili
ary
ente
rpri
ses:
Hou
sing
and
din
ing
(inc
ludi
ng d
epre
ciat
ion
of $
5,02
0)
47,6
37
--
--
--
--
(106
) 47
,531
A
thle
tics
(inc
ludi
ng d
epre
ciat
ion
of $
5,28
2)
85,7
24
--
--
--
--
(1,6
88)
84,0
36
Oth
er a
uxili
arie
s 21
,575
-
--
--
--
-(5
40)
21,0
35
Oth
er o
pera
ting
expe
nses
68
2 -
--
--
--
--
682
Tot
al o
pera
ting
expe
nses
1,
960,
301
283,
888
9,78
4 19
31
80
10
9 6,
622
206,
556
(167
,472
) 2,
299,
918
Net
inco
me
(los
s) fr
om o
pera
tions
(3
42,4
10)
15,2
29
11,7
79
(18)
(3
1)
(80)
(7
8)
(64)
42
5 (1
,825
) (3
17,0
73)
NO
NO
PE
RA
TIN
G R
EV
EN
UE
S (
EX
PE
NS
ES
)S
tate
app
ropr
iatio
ns
283,
869
--
--
--
--
-28
3,86
9 G
ifts
and
non-
exch
ange
gra
nts
98,9
71
116
107
96
3 -
149
--
(1,0
24)
98,4
18
Inve
stm
ent i
ncom
e (l
oss)
10
4,08
1 39
5 37
85
2 13
2 18
7 -
1 11
9 (1
,056
) 10
4,74
8 In
tere
st o
n ca
pita
l ass
et-r
elat
ed d
ebt
(28,
263)
(6
1)
--
--
--
(920
) -
(29,
244)
G
rant
to/(
from
) th
e U
nive
rsity
for
non-
capi
tal p
urpo
ses
22,8
06
(11,
186)
(1
1,23
3)
(380
) (3
) (4
) -
--
--
Oth
er n
onop
erat
ing
reve
nues
and
exp
ense
s, n
et
7,28
8 2,
568
--
--
--
--
9,85
6 N
et n
onop
erat
ing
reve
nues
(ex
pens
es)
488,
752
(8,1
68)
(11,
089)
56
8 13
2 18
3 14
9 1
(801
) (2
,080
) 46
7,64
7 N
et in
com
e (l
oss)
bef
ore
othe
r re
venu
es, e
xpen
ses,
gai
ns, o
r lo
sses
14
6,34
2 7,
061
690
550
101
103
71
(63)
(3
76)
(3,9
05)
150,
574
Cap
ital g
rant
s an
d gi
fts
25,4
14
5,36
9 -
--
--
--
(111
) 30
,672
A
dditi
ons
to p
erm
anen
t end
owm
ents
10
,303
2
--
--
--
-(8
0)
10,2
25
Gra
nt to
/(fr
om)
the
Uni
vers
ity fo
r ca
pita
l pur
pose
s 11
,487
(9
,878
) (1
,595
) (1
4)
--
--
--
-O
ther
, net
(1
,241
) (2
57)
--
--
--
(178
) -
(1,6
76)
Tot
al o
ther
rev
enue
s (e
xpen
ses)
45
,963
(4
,764
) (1
,595
) (1
4)
--
--
(178
) (1
91)
39,2
21
INC
RE
AS
E (
DE
CR
EA
SE
) IN
NE
T P
OS
ITIO
N
192,
305
2,29
7 (9
05)
536
101
103
71
(63)
(5
54)
(4,0
96)
189,
795
NE
T P
OS
ITIO
N, b
eg
inn
ing
of
ye
ar,
as
pre
vio
us
ly r
ep
ort
ed
2,
546,
590
47,2
74
9,20
5 7,
541
1,22
3 1,
639
11
224
16,5
17
46,1
63
2,67
6,38
7 C
um
ula
tiv
e e
ffe
ct
of
ad
op
tio
n o
f a
cc
ou
nti
ng
pri
nc
iple
(3
,676
) -
--
--
--
--
(3,6
76)
NE
T P
OS
ITIO
N, b
eg
inn
ing
of
ye
ar,
as
re
sta
ted
2,
542,
914
47,2
74
9,20
5 7,
541
1,22
3 1,
639
11
224
16,5
17
46,1
63
2,67
2,71
1 N
ET
PO
SIT
ION
, en
d o
f ye
ar
$ 2,
735,
219
$ 49
,571
$ 8,
300
$ 8,
077
$ 1,
324
$ 1,
742
$ 82
$ 16
1$
15,9
63$
42,0
67$
2,86
2,50
6
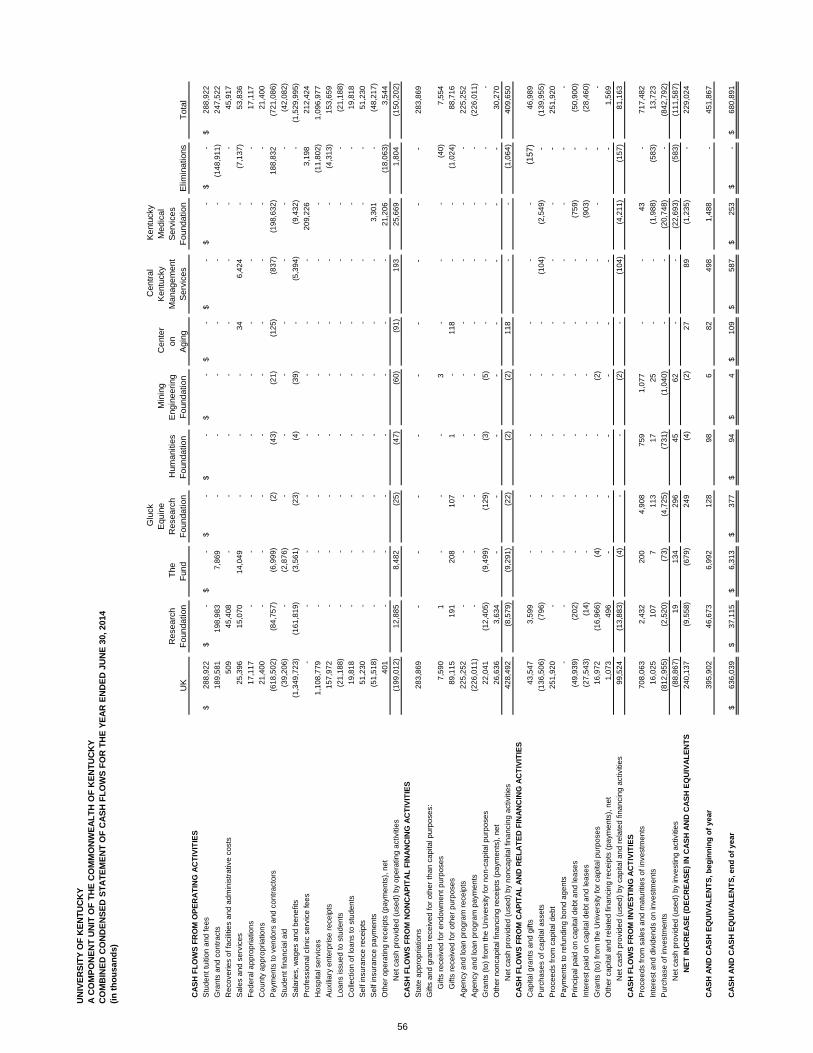
56
UN
IVE
RS
ITY
OF
KE
NT
UC
KY
A C
OM
PO
NE
NT
UN
IT O
F T
HE
CO
MM
ON
WE
AL
TH
OF
KE
NT
UC
KY
CO
MB
INE
D C
ON
DE
NS
ED
ST
AT
EM
EN
T O
F C
AS
H F
LO
WS
FO
R T
HE
YE
AR
EN
DE
D J
UN
E 3
0, 2
014
(in
th
ou
san
ds)
Glu
ck
Cen
tral
Ken
tuck
y E
quin
e M
inin
g C
ente
r K
entu
cky
Med
ical
Res
earc
h T
he
Res
earc
h H
uman
ities
E
ngin
eeri
ngon
Man
agem
ent
Ser
vice
s U
K
Fou
ndat
ion
Fun
dF
ound
atio
n F
ound
atio
n F
ound
atio
n A
ging
S
ervi
ces
Fou
ndat
ion
Elim
inat
ions
T
otal
C
AS
H F
LO
WS
FR
OM
OP
ER
AT
ING
AC
TIV
ITIE
S
Stu
de
nt t
uiti
on
an
d fe
es
$ 2
88
,92
2$
-$
-$
-$
-$
-$
-$
-$
-$
-$
28
8,9
22
Gra
nts
an
d c
on
tra
cts
18
9,5
81
1
98
,98
3
7,8
69
--
--
--
(14
8,9
11
) 2
47
,52
2
Re
cove
ries
of f
aci
litie
s a
nd
ad
min
istr
ativ
e c
ost
s 5
09
4
5,4
08
--
--
--
--
45
,91
7
Sa
les
an
d s
erv
ice
s 2
5,3
96
1
5,0
70
14
,04
9 -
--
34
6,4
24
-(7
,13
7)
53
,83
6
Fe
de
ral a
pp
rop
riatio
ns
17
,11
7
--
--
--
--
-1
7,1
17
Co
un
ty a
pp
rop
riatio
ns
21
,40
0
--
--
--
--
-2
1,4
00
Pa
yme
nts
to v
en
do
rs a
nd
co
ntr
act
ors
(6
18
,50
2)
(84
,75
7)
(6,9
99
) (2
) (4
3)
(21
) (1
25
) (8
37
) (1
98
,63
2)
18
8,8
32
(7
21
,08
6)
Stu
de
nt f
ina
nci
al a
id
(39
,20
6)
-(2
,87
6)
--
--
--
-(4
2,0
82
)
Sa
larie
s, w
ag
es
an
d b
en
efit
s (1
,34
9,7
23
) (1
61
,81
9)
(3,5
61
) (2
3)
(4)
(39
) -
(5,3
94
) (9
,43
2)
-(1
,52
9,9
95
)
Pro
fess
ion
al c
linic
se
rvic
e fe
es
--
--
--
--
20
9,2
26
3
,19
8
21
2,4
24
Ho
spita
l se
rvic
es
1,1
08
,77
9
--
--
--
--
(11
,80
2)
1,0
96
,97
7
Au
xilia
ry e
nte
rpris
e r
ece
ipts
1
57
,97
2
--
--
--
--
(4,3
13
) 1
53
,65
9
Lo
an
s is
sue
d to
stu
de
nts
(2
1,1
88
) -
--
--
--
--
(21
,18
8)
Co
llect
ion
of l
oa
ns
to s
tud
en
ts
19
,81
8
--
--
--
--
-1
9,8
18
Se
lf in
sura
nce
re
ceip
ts
51
,23
0
--
--
--
--
-5
1,2
30
Se
lf in
sura
nce
pa
yme
nts
(5
1,5
18
) -
--
--
--
3,3
01
-(4
8,2
17
)
Oth
er
op
era
ting
re
ceip
ts (
pa
yme
nts
), n
et
40
1
--
--
--
-2
1,2
06
(18
,06
3)
3,5
44
Ne
t ca
sh p
rovi
de
d (
use
d)
by
op
era
ting
act
iviti
es
(19
9,0
12
) 1
2,8
85
8,4
82
(25
) (4
7)
(60
) (9
1)
19
3 2
5,6
69
1,8
04
(15
0,2
02
)
CA
SH
FL
OW
S F
RO
M N
ON
CA
PIT
AL
FIN
AN
CIN
G A
CT
IVIT
IES
Sta
te a
pp
rop
riatio
ns
28
3,8
69
-
--
--
--
--
28
3,8
69
Gift
s a
nd
gra
nts
re
ceiv
ed
for
oth
er
tha
n c
ap
ital p
urp
ose
s:
G
ifts
rece
ive
d fo
r e
nd
ow
me
nt p
urp
ose
s 7
,59
0
1 -
--
3 -
--
(40
) 7
,55
4
G
ifts
rece
ive
d fo
r o
the
r p
urp
ose
s 8
9,1
15
1
91
20
8 1
07
1 -
11
8 -
-(1
,02
4)
88
,71
6
Ag
en
cy a
nd
loa
n p
rog
ram
re
ceip
ts
22
5,2
52
-
--
--
--
--
22
5,2
52
Ag
en
cy a
nd
loa
n p
rog
ram
pa
yme
nts
(2
26
,01
1)
--
--
--
--
-(2
26
,01
1)
Gra
nts
(to
) fr
om
the
Un
ive
rsity
for
no
n-c
ap
ital p
urp
ose
s 2
2,0
41
(1
2,4
05
) (9
,49
9)
(12
9)
(3)
(5)
--
--
-
Oth
er
no
nca
pita
l fin
an
cin
g r
ece
ipts
(p
aym
en
ts),
ne
t 2
6,6
36
3
,63
4 -
--
--
--
-3
0,2
70
Ne
t ca
sh p
rovi
de
d (
use
d)
by
no
nca
pita
l fin
an
cin
g a
ctiv
itie
s 4
28
,49
2
(8,5
79
) (9
,29
1)
(22
) (2
) (2
) 1
18
--
(1,0
64
) 4
09
,65
0
CA
SH
FL
OW
S F
RO
M C
AP
ITA
L A
ND
RE
LA
TE
D F
INA
NC
ING
AC
TIV
ITIE
S
Ca
pita
l gra
nts
an
d g
ifts
43
,54
7
3,5
99
--
--
--
-(1
57)
46
,98
9
Pu
rch
ase
s o
f ca
pita
l ass
ets
(1
36
,50
6)
(79
6)
--
--
-(1
04
) (2
,54
9)
-(1
39
,95
5)
Pro
cee
ds
fro
m c
ap
ital d
eb
t 2
51
,92
0
--
--
--
--
-2
51
,92
0
Pa
yme
nts
to r
efu
nd
ing
bo
nd
ag
en
ts
--
--
--
--
--
-
Prin
cip
al p
aid
on
ca
pita
l de
bt a
nd
lea
ses
(49
,93
9)
(20
2)
--
--
--
(75
9)
-(5
0,9
00
)
Inte
rest
pa
id o
n c
ap
ital d
eb
t an
d le
ase
s (2
7,5
43
) (1
4)
--
--
--
(90
3)
-(2
8,4
60
)
Gra
nts
(to
) fr
om
the
Un
ive
rsity
for
cap
ital p
urp
ose
s 1
6,9
72
(1
6,9
66
) (4
) -
-(2
) -
--
--
Oth
er
cap
ital a
nd
re
late
d fi
na
nci
ng
re
ceip
ts (
pa
yme
nts
), n
et
1,0
73
4
96
--
--
--
-1
,56
9
Ne
t ca
sh p
rovi
de
d (
use
d)
by
cap
ital a
nd
re
late
d fi
na
nci
ng
act
iviti
es
99
,52
4
(13
,88
3)
(4)
--
(2)
-(1
04
) (4
,21
1)
(15
7)
81
,16
3
CA
SH
FL
OW
S F
RO
M IN
VE
ST
ING
AC
TIV
ITIE
S
Pro
cee
ds
fro
m s
ale
s a
nd
ma
turit
ies
of i
nve
stm
en
ts
70
8,0
63
2
,43
2 2
00
4,9
08
75
9 1
,07
7 -
-4
3 -
71
7,4
82
Inte
rest
an
d d
ivid
en
ds
on
inve
stm
en
ts
16
,02
5
10
7 7
11
3 1
7 2
5 -
-(1
,98
8)
(58
3)
13
,72
3
Pu
rch
ase
of i
nve
stm
en
ts
(81
2,9
55
) (2
,52
0)
(73
) (4
,72
5)
(73
1)
(1,0
40
) -
-(2
0,7
48
) -
(84
2,7
92
)
Ne
t ca
sh p
rovi
de
d (
use
d)
by
inve
stin
g a
ctiv
itie
s (8
8,8
67
) 1
9 1
34
29
6 4
5 6
2 -
-(2
2,6
93
) (5
83
) (1
11
,58
7)
NE
T IN
CR
EA
SE
(D
EC
RE
AS
E)
IN C
AS
H A
ND
CA
SH
EQ
UIV
AL
EN
TS
2
40
,13
7
(9,5
58
) (6
79
) 2
49
(4)
(2)
27
89
(1,2
35
) -
22
9,0
24
CA
SH
AN
D C
AS
H E
QU
IVA
LE
NT
S, b
eg
inn
ing
of
ye
ar
39
5,9
02
4
6,6
73
6
,99
2 1
28
98
6 8
2 4
98
1,4
88
-4
51
,86
7
CA
SH
AN
D C
AS
H E
QU
IVA
LE
NT
S, e
nd
of
ye
ar
$
63
6,0
39
$
37
,11
5$
6,3
13
$ 3
77
$ 9
4$
4$
10
9$
58
7$
25
3$
-$
68
0,8
91

57
UN
IVE
RS
ITY
OF
KE
NT
UC
KY
A C
OM
PO
NE
NT
UN
IT O
F T
HE
CO
MM
ON
WE
AL
TH
OF
KE
NT
UC
KY
CO
MB
INE
D C
ON
DE
NS
ED
ST
AT
EM
EN
T O
F C
AS
H F
LO
WS
FO
R T
HE
YE
AR
EN
DE
D J
UN
E 3
0, 2
013
(in
th
ou
san
ds)
Glu
ck
Cen
tral
Ken
tuck
y E
quin
e M
inin
g C
ente
r K
entu
cky
Med
ical
Res
earc
h T
he
Res
earc
h H
uman
ities
E
ngin
eeri
ngon
Man
agem
ent
Ser
vice
s U
K
Fou
ndat
ion
Fun
dF
ound
atio
n F
ound
atio
n F
ound
atio
n A
ging
S
ervi
ces
Fou
ndat
ion
E
limin
atio
ns
Tot
al
CA
SH
FL
OW
S F
RO
M O
PE
RA
TIN
G A
CT
IVIT
IES
Stu
de
nt t
uiti
on
an
d fe
es
$ 2
65
,13
6$
-$
-$
-$
-$
-$
-$
-$
-$
-$
26
5,1
36
Gra
nts
an
d c
on
tra
cts
17
1,4
88
2
48
,58
3
7,5
71
--
--
--
(14
6,4
28
) 2
81
,21
4
Re
cove
ries
of f
aci
litie
s a
nd
ad
min
istr
ativ
e c
ost
s 1
67
4
9,1
81
--
--
--
--
49
,34
8
Sa
les
an
d s
erv
ice
s 2
8,0
70
1
0,2
67
13
,81
6 1
--
31
6,1
72
-(7
,32
2)
51
,03
5
Fe
de
ral a
pp
rop
riatio
ns
14
,85
8
--
--
--
--
-1
4,8
58
Co
un
ty a
pp
rop
riatio
ns
18
,93
5
--
--
--
--
-1
8,9
35
Pa
yme
nts
to v
en
do
rs a
nd
co
ntr
act
ors
(5
11
,23
2)
(12
4,5
57
) (4
,71
0)
(11
) (3
1)
(33
) (1
08
) (1
,00
5)
(19
5,1
91
) 1
69
,30
8
(66
7,5
70
)
Stu
de
nt f
ina
nci
al a
id
(27
,64
1)
-(2
,52
8)
--
--
--
-(3
0,1
69
)
Sa
larie
s, w
ag
es
an
d b
en
efit
s (1
,28
2,8
91
) (1
61
,21
4)
(2,5
75
) (8
) -
(41
) (1
) (5
,21
5)
(11
,04
4)
-(1
,46
2,9
89
)
Pro
fess
ion
al c
linic
se
rvic
e fe
es
--
--
--
--
20
1,2
09
(1
,89
2)
19
9,3
17
Ho
spita
l se
rvic
es
97
7,9
94
-
--
--
--
-(4
,16
4)
97
3,8
30
Au
xilia
ry e
nte
rpris
e r
ece
ipts
1
57
,44
0
--
--
--
--
(3,6
99
) 1
53
,74
1
Lo
an
s is
sue
d to
stu
de
nts
(1
7,1
37
) -
--
--
--
--
(17
,13
7)
Co
llect
ion
of l
oa
ns
to s
tud
en
ts
16
,42
2
--
--
--
--
-1
6,4
22
Se
lf in
sura
nce
re
ceip
ts
45
,03
5
--
--
--
--
-4
5,0
35
Se
lf in
sura
nce
pa
yme
nts
(4
2,3
16
) -
--
--
--
(1,6
05
) -
(43
,92
1)
Oth
er
op
era
ting
re
ceip
ts (
pa
yme
nts
), n
et
(1,6
26
) -
--
--
-5
,96
3 (3
,51
9)
81
8
Ne
t ca
sh p
rovi
de
d (
use
d)
by
op
era
ting
act
iviti
es
(18
7,2
98
) 2
2,2
60
1
1,5
74
(18
) (3
1)
(74
) (7
8)
(48
) (6
68
) 2
,28
4 (1
52
,09
7)
CA
SH
FL
OW
S F
RO
M N
ON
CA
PIT
AL
FIN
AN
CIN
G A
CT
IVIT
IES
Sta
te a
pp
rop
riatio
ns
28
3,8
69
-
--
--
--
--
28
3,8
69
Gift
s a
nd
gra
nts
re
ceiv
ed
for
oth
er
tha
n c
ap
ital p
urp
ose
s:
G
ifts
rece
ive
d fo
r e
nd
ow
me
nt p
urp
ose
s 1
0,3
03
2
--
--
--
-(8
0)
10
,22
5
G
ifts
rece
ive
d fo
r o
the
r p
urp
ose
s 8
1,0
55
1
16
10
7 1
09
3 -
14
9 -
-(1
,02
3)
80
,51
6
Ag
en
cy a
nd
loa
n p
rog
ram
re
ceip
ts
21
0,9
58
-
--
--
--
--
21
0,9
58
Ag
en
cy a
nd
loa
n p
rog
ram
pa
yme
nts
(2
10
,59
4)
--
--
--
--
-(2
10
,59
4)
Gra
nts
(to
) fr
om
the
Un
ive
rsity
for
no
n-c
ap
ital p
urp
ose
s 2
4,2
55
(1
2,5
75
) (1
1,2
93
) (3
80
) (3
) (4
) -
--
--
Oth
er
no
nca
pita
l fin
an
cin
g r
ece
ipts
(p
aym
en
ts),
ne
t 2
2,6
10
4,
849
--
--
--
--
27
,45
9
Ne
t ca
sh p
rovi
de
d (
use
d)
by
no
nca
pita
l fin
an
cin
g a
ctiv
itie
s 4
22
,45
6
(7,6
08
) (1
1,1
86
) (2
71
) -
(4)
14
9 -
-(1
,10
3)
40
2,4
33
CA
SH
FL
OW
S F
RO
M C
AP
ITA
L A
ND
RE
LA
TE
D F
INA
NC
ING
AC
TIV
ITIE
S
Ca
pita
l gra
nts
an
d g
ifts
30
,99
1
5,3
69
--
--
--
-(1
11)
36
,24
9
Pu
rch
ase
s o
f ca
pita
l ass
ets
(9
9,4
80
) (1
,99
3)
--
--
-(1
0)
(1,0
37)
-(1
02
,52
0)
Pro
cee
ds
fro
m c
ap
ital d
eb
t 3
0,7
28
-
--
--
--
104
-3
0,8
32
Pa
yme
nts
to r
efu
nd
ing
bo
nd
ag
en
ts
(5,6
33
) -
--
--
--
--
(5,6
33
)
Prin
cip
al p
aid
on
ca
pita
l de
bt a
nd
lea
ses
(54
,47
1)
(1,2
46
) -
--
--
-(7
02)
-(5
6,4
19
)
Inte
rest
pa
id o
n c
ap
ital d
eb
t an
d le
ase
s (2
8,5
54
) (6
1)
--
--
--
(920
) -
(29
,53
5)
Gra
nts
(to
) fr
om
the
Un
ive
rsity
for
cap
ital p
urp
ose
s 1
1,5
60
(9
,96
4)
(1,5
82
) (1
4)
--
--
--
-
Oth
er
cap
ital a
nd
re
late
d fi
na
nci
ng
re
ceip
ts (
pa
yme
nts
), n
et
(25
8)
387
--
--
--
(170
) -
(41
)
Ne
t ca
sh p
rovi
de
d (
use
d)
by
cap
ital a
nd
re
late
d fi
na
nci
ng
act
iviti
es
(11
5,1
17
) (7
,50
8)
(1,5
82
) (1
4)
--
-(1
0)
(2,7
25
) (1
11
) (1
27
,06
7)
CA
SH
FL
OW
S F
RO
M IN
VE
ST
ING
AC
TIV
ITIE
S
Pro
cee
ds
fro
m s
ale
s a
nd
ma
turit
ies
of i
nve
stm
en
ts
72
5,9
14
3
,14
5 1
20
5,2
09
80
5 1
,07
0 -
-4
,89
6 -
74
1,1
59
Inte
rest
an
d d
ivid
en
ds
on
inve
stm
en
ts
17
,47
7
64
15
13
3 2
1 2
9 -
1 (1
,19
4)
(1,0
70
) 1
5,4
76
Pu
rch
ase
of i
nve
stm
en
ts
(76
6,3
15
) (2
,68
8)
(15
0)
(4,9
19
) (7
60
) (1
,08
1)
--
(30
4)
-(7
76
,21
7)
Ne
t ca
sh p
rovi
de
d (
use
d)
by
inve
stin
g a
ctiv
itie
s (2
2,9
24
) 5
21
(15
) 4
23
66
18
-1
3,3
98
(1,0
70
) (1
9,5
82
)
NE
T IN
CR
EA
SE
(D
EC
RE
AS
E)
IN C
AS
H A
ND
CA
SH
EQ
UIV
AL
EN
TS
9
7,1
17
7
,66
5 (1
,20
9)
12
0 3
5 (6
0)
71
(57
) 5
-1
03
,68
7
CA
SH
AN
D C
AS
H E
QU
IVA
LE
NT
S, b
eg
inn
ing
of
ye
ar
29
8,7
85
3
9,0
08
8,2
01
8 6
3
66
11
55
5 1
,48
3 -
34
8,1
80
CA
SH
AN
D C
AS
H E
QU
IVA
LE
NT
S, e
nd
of
ye
ar
$
39
5,9
02
$
46
,67
3$
6,9
92
$ 1
28
$ 9
8$
6$
82
$ 4
98
$ 1
,48
8$
-$
45
1,8
67

UNIVERSITY OF KENTUCKY A COMPONENT UNIT OF THE COMMONWEALTH OF KENTUCKY
REQUIRED SUPPLEMENTARY INFORMATION
1. HEALTH INSURANCE BENEFITS FOR RETIREES
The University of Kentucky's (the University) Other Postemployment Benefit Plan (OPEB Plan) is administered through the University's OPEB Trust Fund as an irrevocable trust. Assets of the trust fund are dedicated to providing post-retirement health insurance coverage to current and eligible future university retirees. Only employees hired prior to January 1, 2006 are eligible to receive post-retirement health insurance benefits.
The following schedules present the University’s actuarially determined funding progress and required contributions for the University’s Other Postemployment Benefits Trust using the projected unit credit actuarial cost method:
Schedule of Funding Progress by Valuation Date (In thousands)
Unfunded UAAL as a Actuarial Actuarial Actuarial Annual Percentage of Value of Accrued Accrued Funded Covered Covered
Valuation Date Assets Liability (AAL) Liability (UAAL) Ratio Payroll Payroll
July 1, 2012 $57,722 $239,068 $181,346 24.1% $560,092 32.4%
July 1, 2013 $75,362 $252,938 $177,576 29.8% $526,073 33.7%
July 1, 2014 $97,317 $268,335 $171,018 36.3% $513,748 33.3%
Schedule of Employer Contr butions (In thousands)
Annual Required Percentage
Year Ended Contr butions Contributed
June 30, 2012 $19,798 98.2% June 30, 2013 $20,392 100.4% June 30, 2014 $19,801 100.0%
2. LONG-TERM DISABILITY BENEFIT PLAN
The University is self-funded for a long-term disability income program and has established a trust for the purpose of paying claims and establishing necessary reserves. Regular employees with a full-time equivalent of .75 or greater who have completed 12 months of service are automatically enrolled in the plan.
The following schedules present the University’s actuarially determined funding progress and required contributions for the University’s long-term disability benefit trust fund using the projected unit credit actuarial cost method:
Schedule of Funding Progress by Valuation Date (In thousands)
Unfunded UAAL as a Actuarial Actuarial Actuarial Annual Percentage of Value of Accrued Accrued Funded Covered Covered
Valuation Date Assets Liability (AAL) Liability (UAAL) Ratio Payroll Payroll
July 1, 2012 $11,883 $20,898 $9,015 56.9% $532,303 1.7%
July 1, 2013 $13,362 $22,667 $9,305 58.9% $725,189 1.3%
July 1, 2014 $15,977 $23,650 $7,673 67.6% $768,214 1.0%
58

Schedule of Employer Contributions (In thousands)
Year Ended
Annual Required Contr butions
Percentage Contr buted
June 30, 2012 June 30, 2013 June 30, 2014
$1,953 $2,012 $2,139
120.9% 99.8%
100.5%
59
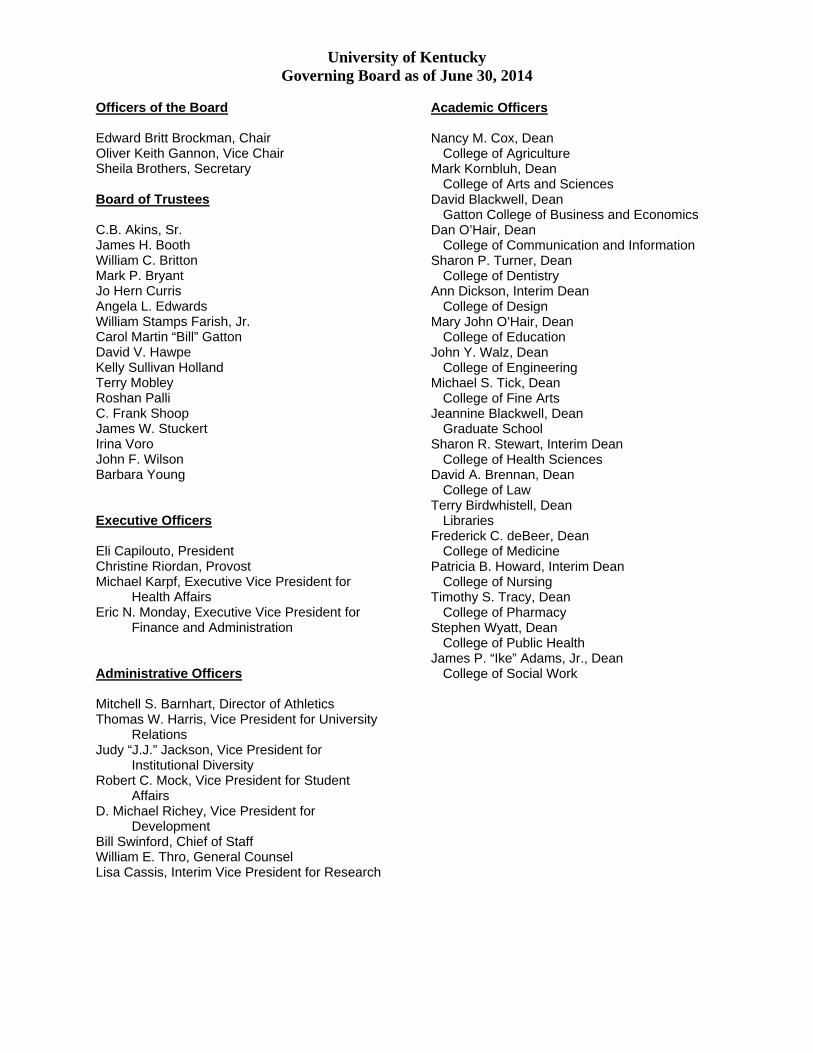
University of Kentucky Governing Board as of June 30, 2014
Officers of the Board
Edward Britt Brockman, Chair Oliver Keith Gannon, Vice Chair Sheila Brothers, Secretary
Board of Trustees
C.B. Akins, Sr. James H. Booth William C. Britton Mark P. Bryant Jo Hern Curris Angela L. Edwards William Stamps Farish, Jr. Carol Martin “Bill” Gatton David V. Hawpe Kelly Sullivan Holland Terry Mobley Roshan Palli C. Frank Shoop James W. Stuckert Irina Voro John F. Wilson Barbara Young
Executive Officers
Eli Capilouto, President Christine Riordan, Provost Michael Karpf, Executive Vice President for
Health Affairs Eric N. Monday, Executive Vice President for
Finance and Administration
Administrative Officers
Mitchell S. Barnhart, Director of Athletics Thomas W. Harris, Vice President for University
Relations Judy “J.J.” Jackson, Vice President for
Institutional Diversity Robert C. Mock, Vice President for Student
Affairs D. Michael Richey, Vice President for
Development Bill Swinford, Chief of Staff William E. Thro, General Counsel Lisa Cassis, Interim Vice President for Research
Academic Officers
Nancy M. Cox, Dean College of Agriculture
Mark Kornbluh, Dean College of Arts and Sciences
David Blackwell, Dean Gatton College of Business and Economics
Dan O’Hair, Dean College of Communication and Information
Sharon P. Turner, Dean College of Dentistry
Ann Dickson, Interim Dean College of Design
Mary John O’Hair, Dean College of Education
John Y. Walz, Dean College of Engineering
Michael S. Tick, Dean College of Fine Arts
Jeannine Blackwell, Dean Graduate School Sharon R. Stewart, Interim Dean
College of Health Sciences David A. Brennan, Dean
College of Law Terry Birdwhistell, Dean Libraries Frederick C. deBeer, Dean
College of Medicine Patricia B. Howard, Interim Dean
College of Nursing Timothy S. Tracy, Dean
College of Pharmacy Stephen Wyatt, Dean
College of Public Health James P. “Ike” Adams, Jr., Dean
College of Social Work

University of Kentucky A Component Unit of the Commonwealth of Kentucky
Single Audit Reports and Schedule of Expenditures of Federal Awards
Year Ended June 30, 2014
University of Kentucky A Component Unit of the Commonwealth of Kentucky Single Audit Reports and Schedule of Expenditures of Federal Awards
Year Ended June 30, 2014
Contents
Schedule of Expenditures of Federal Awards ..................................................................... 1
Notes to Schedule of Expenditures of Federal Awards
Independent Auditor’s Report on Internal Control Over Financial
.................................................... 10
Reporting and on Compliance and Other Matters Based on an Audit of the Financial Statements Performed in Accordance With Government Auditing Standards .................................................................................... 14
Independent Auditor’s Report on Compliance for Each Major Federal Program, Report on Internal Control Over Compliance and Report on Schedule of Expenditures of Federal Awards Required by OMB Circular A-133 ............................ 16
Schedule of Findings and Questioned Costs.................................................................... 19
Summary Schedule of Prior Audit Findings ...................................................................... 24

UNIVERSITY OF KENTUCKY
SCHEDULE OF EXPENDITURES OF FEDERAL AWARDS FOR THE YEAR ENDED JUNE 30, 2014
FEDERAL GRANTOR/PASS-THROUGH GRANTOR/PROGRAM OR CLUSTER TITLE PASS-THROUGH ENTITY CFDA FEDERAL IDENTIFYING NUMBER NUMBER EXPENDITURES
RESEARCH AND DEVELOPMENT CLUSTER Agricultural Research Basic and Applied Research 10.001 $ 867,600 US Department of Agriculture Contract 09-CS-11080226-013 10.09-CS-11080226-013 2,589 US Department of Agriculture Contract 09-CS-11132422-229 10.09-CS-11132422-229 2,300 US Department of Agriculture Contract 10-JV-11330152-119 10.10-JV-11330152-119 25,161 US Department of Agriculture Contract 10-PA-11080222-029 10.10-PA-11080222-029 1,084 US Department of Agriculture Contract 12-CS-11221637-133 10.12-CS-11221637-133 103,329 Federal-State Marketing Improvement Program 10.156 50,139 Through Kentucky Specialty Grains LLC USDA092013-1 10.170 1,847 Through Kentucky Specialty Grains LLC USDA092013-2 10.170 2,639 Through Kentucky Department of Agriculture PON2 035 1100001313 10.170 50 Through Kentucky Department of Agriculture PON2 035 1100001315 10.170 1,378 Through Kentucky Department of Agriculture PON2 035 1200000903 10.170 22,027 Through Kentucky Department of Agriculture PON2 035 1200000905 10.170 5,680 Through Kentucky Department of Agriculture PON2 035 1200000906 10.170 5,252 Through Kentucky Department of Agriculture PON2 035 1200000907 10.170 45,312 Through Kentucky Department of Agriculture PON2 035 1300001314 10.170 38,932 Through Kentucky Department of Agriculture PON2 035 1400000841 10.170 10,560 Through Iowa State University 416-30-18A 10.170 75,286 Through Brigham Young University 12-0352 10.170 59,314 Through Iowa State University 416-30-05A 10.200 37,787 Grants for Agricultural Research Special Research Grants 10.200 38,058 Cooperative Forestry Research 10.202 577,247 Payments to Agricultural Experiment Stations Under Hatch Act 10.203 6,528,883 Grants for Agricultural Research Competitive Research Grants 10.206 (11,919) Animal Health and Disease Research 10.207 61,714 Through University of Georgia RD309-122/4940686 10.215 9,771 Through University of Georgia RD309-122/4941256 10.215 96,471 Through University of Georgia RD309-122/4944366 10.215 1,907 Through University of Georgia RD309-122/4944796 10.215 5,212 Through American Livestock Breeds Conservancy RD309-117/4893656 10.215 18,939 Through Kentucky State University 2010-38821-21522 10.216 76 Through Purdue University 8000058251-AG 10.217 13,236 Biotechnology Risk Assessment Research 10.219 139,570 Through University of Tennessee 72891 10.302 1,571 Through Washington State University 112890_G002645 10.303 5,055 Through Washington State University 121310_G003264 10.303 27,212 Through University of Florida UF12235 10.304 17,623 International Science and Education Grants 10.305 646 Through Rutgers University 4826 S1758552 4351510414 10.307 38,716 Through Iowa State University 416-30-06B 10.307 (17,411) Through West Virginia University 11-708-UKRF 10.310 138,908 Through University of Connecticut KFS #5614250 10.310 41,008 Through University of California Davis 201015718-14 10.310 72,674 Through Regents of the University of California S-000480 10.310 7,464 Through Pennsylvania State University 4382-UK-USDA-0017 10.310 43,045 Through Louisiana State University 87288 10.310 1,865 Through Kansas State University S13166 10.310 67,137 Agriculture and Food Research Initiative (AFR) 10.310 2,903,233 Biomass Research and Development Initiative Competitive Grants 10.312 604,511 Through North Carolina State University 2013-1814-01 10.320 40,090 Through University of Massachusetts 12-006968 10.500 (89) Through University of Arkansas 21660-21 10.500 4,704 Through Michigan State University RC103176H 10.500 53,358 Cooperative Extension Service 10.500 530,412 Through Binational Agricultural Research and Development Fund US-4318-10 R 10.600 30,864 Forestry Research 10.652 75,545 Through Slow the Spread Foundation 12-01-02 10.664 (45) Through National Fish and Wildlife Foundation 1905.14.041345 10.664 2,578 Forest Health Protection 10.680 56,115 Norman E Borlaug International Agricultural Science and Technology Fellowship 10.777 5,520 Soil and Water Conservation 10.902 (3) Soil Survey 10.903 12,808 Through University of Tennessee 8500025673 10.912 17,500 Environmental Quality Incentives Program 10.912 105,374 SUBTOTAL DEPARTMENT OF AGRICULTURE 13,725,419 Through Kentucky Highlands Investment Corp EDA 04-79-06480 11.307 54,858 ARRA-Measurement and Engineering Research and Standards 11.609 40,199 SUBTOTAL DEPARTMENT OF COMMERCE 95,057 Through Enomalies LLC ONR022014 12.300 17,765 Basic and Applied Scientific Research 12.300 709,531 Through Oak Ridge National Laboratory 4000100727 12.4000100727 2,341 Through Lockheed Martin 41X0316121 12.41X0316121 355,441 Military Medical Research and Development 12.420 935,905 Through Denver Research Institute 005-03 12.420 203,596 Through Tulane University TUL-590-09/10 12.431 514,243 Basic Scientific Research 12.431 268,831 Through Materials Sciences Corp 5652-SD21-122 12.5652-SD21-122 118,511 Through Materials Sciences Corp 6658-SD26 12.6658-SD26 29,493 Mathematical Sciences Grants Program 12.901 81,745 Through VSee Lab DOD092009 12.910 22,331 Research and Technology Development 12.910 274,281 Through ObjectVideo Inc FA8650-12-C-7212 12.FA8650-12-C-7212 81,874 Through Physical Sciences Inc N00014-13-P-1008 12.N00014-13-P-1008 23,982 Through Spectrum Magnetics LLC N0001413P1009 12.N0001413P1009 7,635 Through Materials Sciences Corp PO 2690-DG13 12.PO 2690-DG13 16,309 Through Charles River Analytics Inc SC1208901 12.SC1208901 90,195 Department of Defense Contract W9124D-13-P-0349 12.W9124D-13-P-0349 102,976 Department of Defense Contract W9124D-13-P-0357 12.W9124D-13-P-0357 60,167 Department of Defense Contract W912P5-14-P-0014 12.W912P5-14-P-0014 17,972 Through Wake Forest University WFUHS 10183 12.WFUHS 10183 43,824 Through Wake Forest University WFUHS 330974 12.WFUHS 330974 251,179 SUBTOTAL DEPARTMENT OF DEFENSE 4,230,127 Central Intelligence Agency 2011-11070800001 13.2011-11070800001 68,057 SUBTOTAL CENTRAL INTELLIGENCE AGENCY 68,057 Through Louisville Metro Housing Authority HUD042013 14.866 60,000 Through Louisville Metro Housing Authority HUD042014 14.866 17,915 SUBTOTAL DEPARTMENT OF HOUSING AND URBAN DEVELOPMENT 77,915 Through University of Southern Mississippi USM-GR03958-001 15.021 14,111 Wildland Fire Research and Studies Program 15.232 70,849 Through University of Wyoming 1001541-DAVIS 15.252 272,128 Science and Technology Projects Related to Coal Mining and Reclamation 15.255 61,745 Through Kentucky Tourism Arts and Heritage Cabinet PON2 660 1200003129 15.611 (138) Through Kentucky Tourism Arts and Heritage Cabinet PON2 660 1300002835 15.611 55,000 Through Kentucky Tourism Arts and Heritage Cabinet PON2 660 1300002872 15.611 93,000 Through Kentucky Tourism Arts and Heritage Cabinet PON2 660 1300002995 15.611 136,615 Assistance to State Water Resources Research Institutes 15.805 57,371 Earthquake Hazards Reduction Program 15.807 2,695 Through University of Southern California Y82308 15.808 10,915 U.S. Geological Survey Research and Data Collection 15.808 178,693 National Cooperative Geologic Mapping Program 15.810 210,302 Technical Preservation Services 15.915 48,366 Through Mammoth Cave National Park H5530060064 15.H5530060064 48 SUBTOTAL DEPARTMENT OF THE INTERIOR 1,211,700
1

FEDERAL GRANTOR/PASS-THROUGH GRANTOR/PROGRAM OR CLUSTER TITLE PASS-THROUGH ENTITY CFDA FEDERAL IDENTIFYING NUMBER NUMBER EXPENDITURES
National Institute of Justice Research Evaluation and Development Project Grants 16.560 $ 163,292 Through Kentucky Court of Justice PO2 025 0600004985 16.585 63 Department of Justice Contract A2OTD3041 16.A2OTD3041 (106) Department of Justice Contract A30TD6067 16.A30TD6067 25,051 SUBTOTAL DEPARTMENT OF JUSTICE 188,300 Through Kentucky Tourism Arts and Heritage Cabinet M-05463785 17.261 1,186 SUBTOTAL DEPARTMENT OF LABOR 1,186 Through Louisiana Department of Transportation and Development 12-4PF / 30000542 20.200 11,505 Through Louisiana Department of Transportation and Development 14-3PF / 30001422 20.200 9,109 Through State of Alaska Department of Transportation and Public Facilities 025-3-1-020 20.205 491 Through Kentucky Transportation Cabinet FRT 157 20.205 40,879 Through Kentucky Transportation Cabinet FRT 158 20.205 29,252 Through Kentucky Transportation Cabinet FRT 159 20.205 23,270 Through Kentucky Transportation Cabinet FRT 160 20.205 30,253 Through Kentucky Transportation Cabinet FRT 179 20.205 28,685 Through Kentucky Transportation Cabinet FRT 183 20.205 (1,459) Through Kentucky Transportation Cabinet FRT 184 20.205 1,632 Through Kentucky Transportation Cabinet FRT 190 20.205 18,004 Through Kentucky Transportation Cabinet FRT 191 20.205 73,750 Through Kentucky Transportation Cabinet FRT 194 20.205 24,514 Through Kentucky Transportation Cabinet FRT 198 20.205 54,223 Through Kentucky Transportation Cabinet FRT 199 20.205 66,172 Through Kentucky Transportation Cabinet FRT 200 20.205 68,437 Through Kentucky Transportation Cabinet FRT 201 20.205 75,354 Through Kentucky Transportation Cabinet FRT 2013 20.205 135,038 Through Kentucky Transportation Cabinet KHIT 58 20.205 24,578 Through Kentucky Transportation Cabinet LA 11-JLH 20.205 3,139 Through Kentucky Transportation Cabinet LA 15-DBD 20.205 5,479 Through Kentucky Transportation Cabinet LA 16-DBD 20.205 40,495 Through Kentucky Transportation Cabinet LA 25-JLH 20.205 6,868 Through Kentucky Transportation Cabinet LA 26-JLH 20.205 12,411 Through Kentucky Transportation Cabinet LA 27-JLH 20.205 4,609 Through Kentucky Transportation Cabinet LA 28-DBD 20.205 8,391 Through Kentucky Transportation Cabinet LA 30-JLH 20.205 4,703 Through Kentucky Transportation Cabinet LA 32-JLH 20.205 12,401 Through Kentucky Transportation Cabinet LA 37-JLH 20.205 9,045 Through Kentucky Transportation Cabinet LA 38-JPL 20.205 8,453 Through Kentucky Transportation Cabinet LA 3-CRS 20.205 29,501 Through Kentucky Transportation Cabinet TA 2 20.205 8,012 Through Kentucky Transportation Cabinet TA 45 20.205 24,486 Through ARRA-Kentucky Transportation Cabinet LA 36-JLH 20.205 17,041 Through Kentucky Transportation Cabinet RSF 20 20.217 60,068 Through Kentucky Transportation Cabinet RSF 27 20.217 (653) Through Kentucky Transportation Cabinet RSF 30 20.217 153,429 Through Kentucky Transportation Cabinet RSF 33 20.217 51,162 Through Kentucky Transportation Cabinet RSF 36 20.217 112,583 Through Kentucky Transportation Cabinet RSF 38 20.217 76,096 Through Kentucky Transportation Cabinet RSF 39 20.217 69,337 Through Kentucky Transportation Cabinet RSF 41 20.217 51,147 Through Kentucky Transportation Cabinet RSF 43 20.217 10,980 Through Kentucky Transportation Cabinet RSF 35 20.231 259,192 Through National Waterways Foundation DOT0313 20.515 134,683 Through Kentucky Transportation Cabinet KCTRP 2012-2013 20.515 3 Through Kentucky Transportation Cabinet KYSPR 11-426 20.515 779 Through Kentucky Transportation Cabinet KYSPR 11-427 20.515 64 Through Kentucky Transportation Cabinet KYSPR 12-429 20.515 3,089 Through Kentucky Transportation Cabinet KYSPR 12-431 20.515 398 Through Kentucky Transportation Cabinet KYSPR 12-434 20.515 9 Through Kentucky Transportation Cabinet KYSPR 12-435 20.515 36 Through Kentucky Transportation Cabinet KYSPR 12-437 20.515 33 Through Kentucky Transportation Cabinet KYSPR 12-438 20.515 27 Through Kentucky Transportation Cabinet KYSPR 12-445 20.515 22 Through Kentucky Transportation Cabinet KYSPR 12-447 20.515 3,989 Through Kentucky Transportation Cabinet KYSPR 12-449 20.515 1,598 Through Kentucky Transportation Cabinet KYSPR 13-452 20.515 1,533 Through Kentucky Transportation Cabinet KYSPR 13-456 20.515 1,518 Through Kentucky Transportation Cabinet KYSPR 13-457 20.515 560 Through Kentucky Transportation Cabinet KYSPR 13-458 20.515 1,290 Through Kentucky Transportation Cabinet KYSPR 13-461 20.515 2,364 Through Kentucky Transportation Cabinet KYSPR 13-463 20.515 1,923 Through Kentucky Transportation Cabinet KYSPR 13-464 20.515 819 Through Kentucky Transportation Cabinet KYSPR 13-467 20.515 1,472 Through Kentucky Transportation Cabinet KYSPR 13-51 20.515 181 Through Kentucky Transportation Cabinet KYSPR 13-56 20.515 3,648 Through Kentucky Transportation Cabinet KYSPR 85-107 20.515 1,275 Through Kentucky Transportation Cabinet PLANNING STUDY 20 20.515 10,472 Through Kentucky Transportation Cabinet PLANNING STUDY 21 20.515 37,197 Through Kentucky Transportation Cabinet PLANNING STUDY 22 20.515 23,172 Through Kentucky Transportation Cabinet PLANNING STUDY 23 20.515 13,818 Through Kentucky Transportation Cabinet PLANNING STUDY 24 20.515 10,623 Through Kentucky Transportation Cabinet RSS 16 20.515 103,006 Through Kentucky Transportation Cabinet SPR 09-379 20.515 19,012 Through Kentucky Transportation Cabinet SPR 10-395 20.515 4,603 Through Kentucky Transportation Cabinet SPR 10-408 20.515 17,318 Through Kentucky Transportation Cabinet SPR 11-416 20.515 10,997 Through Kentucky Transportation Cabinet SPR 11-423 20.515 13,589 Through Kentucky Transportation Cabinet SPR 12-429 20.515 21,111 Through Kentucky Transportation Cabinet SPR 12-431 20.515 20,895 Through Kentucky Transportation Cabinet SPR 12-435 20.515 78,117 Through Kentucky Transportation Cabinet SPR 12-436 20.515 11,748 Through Kentucky Transportation Cabinet SPR 12-437 20.515 71,855 Through Kentucky Transportation Cabinet SPR 12-445 20.515 39,059 Through Kentucky Transportation Cabinet SPR 12-447 20.515 49,923 Through Kentucky Transportation Cabinet SPR 13-452 20.515 19,150 Through Kentucky Transportation Cabinet SPR 13-453 20.515 34,998 Through Kentucky Transportation Cabinet SPR 13-454 20.515 74,953 Through Kentucky Transportation Cabinet SPR 13-455 20.515 41,040 Through Kentucky Transportation Cabinet SPR 13-456 20.515 49,990 Through Kentucky Transportation Cabinet SPR 13-458 20.515 64,978 Through Kentucky Transportation Cabinet SPR 13-459 20.515 21,244 Through Kentucky Transportation Cabinet SPR 13-460 20.515 60,146 Through Kentucky Transportation Cabinet SPR 13-461 20.515 71,302 Through Kentucky Transportation Cabinet SPR 13-462 20.515 60,354 Through Kentucky Transportation Cabinet SPR 13-463 20.515 43,228 Through Kentucky Transportation Cabinet SPR 13-464 20.515 17,195 Through Kentucky Transportation Cabinet SPR 13-465 20.515 59,074 Through Kentucky Transportation Cabinet SPR 13-466 20.515 48,416 Through Kentucky Transportation Cabinet SPR 13-467 20.515 16,381 Through Kentucky Transportation Cabinet SPR 14-468 20.515 30,074 Through Kentucky Transportation Cabinet SPR 14-469 20.515 57,733 Through Kentucky Transportation Cabinet SPR 14-470 20.515 50,580 Through Kentucky Transportation Cabinet SPR 14-471 20.515 59,998 Through Kentucky Transportation Cabinet SPR 14-472 20.515 4,450 Through Kentucky Transportation Cabinet SPR 14-473 20.515 56,666 Through Kentucky Transportation Cabinet SPR 14-474 20.515 44,242 Through Kentucky Transportation Cabinet SPR 14-475 20.515 70,113
2
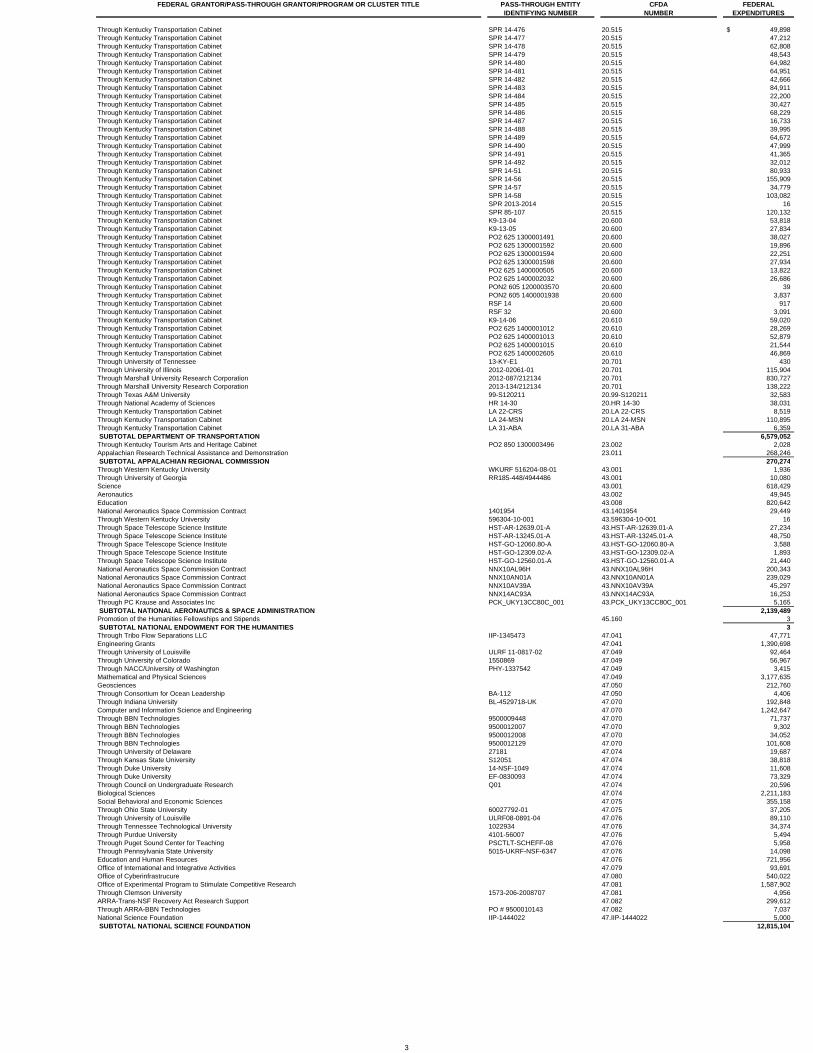
FEDERAL GRANTOR/PASS-THROUGH GRANTOR/PROGRAM OR CLUSTER TITLE PASS-THROUGH ENTITY CFDA FEDERAL IDENTIFYING NUMBER NUMBER EXPENDITURES
Through Kentucky Transportation Cabinet SPR 14-476 20.515 $ 49,898 Through Kentucky Transportation Cabinet SPR 14-477 20.515 47,212 Through Kentucky Transportation Cabinet SPR 14-478 20.515 62,808 Through Kentucky Transportation Cabinet SPR 14-479 20.515 48,543 Through Kentucky Transportation Cabinet SPR 14-480 20.515 64,982 Through Kentucky Transportation Cabinet SPR 14-481 20.515 64,951 Through Kentucky Transportation Cabinet SPR 14-482 20.515 42,666 Through Kentucky Transportation Cabinet SPR 14-483 20.515 84,911 Through Kentucky Transportation Cabinet SPR 14-484 20.515 22,200 Through Kentucky Transportation Cabinet SPR 14-485 20.515 30,427 Through Kentucky Transportation Cabinet SPR 14-486 20.515 68,229 Through Kentucky Transportation Cabinet SPR 14-487 20.515 16,733 Through Kentucky Transportation Cabinet SPR 14-488 20.515 39,995 Through Kentucky Transportation Cabinet SPR 14-489 20.515 64,672 Through Kentucky Transportation Cabinet SPR 14-490 20.515 47,999 Through Kentucky Transportation Cabinet SPR 14-491 20.515 41,365 Through Kentucky Transportation Cabinet SPR 14-492 20.515 32,012 Through Kentucky Transportation Cabinet SPR 14-51 20.515 80,933 Through Kentucky Transportation Cabinet SPR 14-56 20.515 155,909 Through Kentucky Transportation Cabinet SPR 14-57 20.515 34,779 Through Kentucky Transportation Cabinet SPR 14-58 20.515 103,082 Through Kentucky Transportation Cabinet SPR 2013-2014 20.515 16 Through Kentucky Transportation Cabinet SPR 85-107 20.515 120,132 Through Kentucky Transportation Cabinet K9-13-04 20.600 53,818 Through Kentucky Transportation Cabinet K9-13-05 20.600 27,834 Through Kentucky Transportation Cabinet PO2 625 1300001491 20.600 38,027 Through Kentucky Transportation Cabinet PO2 625 1300001592 20.600 19,896 Through Kentucky Transportation Cabinet PO2 625 1300001594 20.600 22,251 Through Kentucky Transportation Cabinet PO2 625 1300001598 20.600 27,934 Through Kentucky Transportation Cabinet PO2 625 1400000505 20.600 13,822 Through Kentucky Transportation Cabinet PO2 625 1400002032 20.600 26,686 Through Kentucky Transportation Cabinet PON2 605 1200003570 20.600 39 Through Kentucky Transportation Cabinet PON2 605 1400001938 20.600 3,837 Through Kentucky Transportation Cabinet RSF 14 20.600 917 Through Kentucky Transportation Cabinet RSF 32 20.600 3,091 Through Kentucky Transportation Cabinet K9-14-06 20.610 59,020 Through Kentucky Transportation Cabinet PO2 625 1400001012 20.610 28,269 Through Kentucky Transportation Cabinet PO2 625 1400001013 20.610 52,879 Through Kentucky Transportation Cabinet PO2 625 1400001015 20.610 21,544 Through Kentucky Transportation Cabinet PO2 625 1400002605 20.610 46,869 Through University of Tennessee 13-KY-E1 20.701 430 Through University of Illinois 2012-02061-01 20.701 115,904 Through Marshall University Research Corporation 2012-087/212134 20.701 830,727 Through Marshall University Research Corporation 2013-134/212134 20.701 138,222 Through Texas A&M University 99-S120211 20.99-S120211 32,583 Through National Academy of Sciences HR 14-30 20.HR 14-30 38,031 Through Kentucky Transportation Cabinet LA 22-CRS 20.LA 22-CRS 8,519 Through Kentucky Transportation Cabinet LA 24-MSN 20.LA 24-MSN 110,895 Through Kentucky Transportation Cabinet LA 31-ABA 20.LA 31-ABA 6,359 SUBTOTAL DEPARTMENT OF TRANSPORTATION 6,579,052 Through Kentucky Tourism Arts and Heritage Cabinet PO2 850 1300003496 23.002 2,028 Appalachian Research Technical Assistance and Demonstration 23.011 268,246 SUBTOTAL APPALACHIAN REGIONAL COMMISSION 270,274 Through Western Kentucky University WKURF 516204-08-01 43.001 1,936 Through University of Georgia RR185-448/4944486 43.001 10,080 Science 43.001 618,429 Aeronautics 43.002 49,945 Education 43.008 820,642 National Aeronautics Space Commission Contract 1401954 43.1401954 29,449 Through Western Kentucky University 596304-10-001 43.596304-10-001 16 Through Space Telescope Science Institute HST-AR-12639.01-A 43.HST-AR-12639.01-A 27,234 Through Space Telescope Science Institute HST-AR-13245.01-A 43.HST-AR-13245.01-A 48,750 Through Space Telescope Science Institute HST-GO-12060.80-A 43.HST-GO-12060.80-A 3,588 Through Space Telescope Science Institute HST-GO-12309.02-A 43.HST-GO-12309.02-A 1,893 Through Space Telescope Science Institute HST-GO-12560.01-A 43.HST-GO-12560.01-A 21,440 National Aeronautics Space Commission Contract NNX10AL96H 43.NNX10AL96H 200,343 National Aeronautics Space Commission Contract NNX10AN01A 43.NNX10AN01A 239,029 National Aeronautics Space Commission Contract NNX10AV39A 43.NNX10AV39A 45,297 National Aeronautics Space Commission Contract NNX14AC93A 43.NNX14AC93A 16,253 Through PC Krause and Associates Inc PCK_UKY13CC80C_001 43.PCK_UKY13CC80C_001 5,165 SUBTOTAL NATIONAL AERONAUTICS & SPACE ADMINISTRATION 2,139,489 Promotion of the Humanities Fellowships and Stipends 45.160 3 SUBTOTAL NATIONAL ENDOWMENT FOR THE HUMANITIES 3 Through Tribo Flow Separations LLC IIP-1345473 47.041 47,771 Engineering Grants 47.041 1,390,698 Through University of Louisville ULRF 11-0817-02 47.049 92,464 Through University of Colorado 1550869 47.049 56,967 Through NACC/University of Washington PHY-1337542 47.049 3,415 Mathematical and Physical Sciences 47.049 3,177,635 Geosciences 47.050 212,760 Through Consortium for Ocean Leadership BA-112 47.050 4,406 Through Indiana University BL-4529718-UK 47.070 192,848 Computer and Information Science and Engineering 47.070 1,242,647 Through BBN Technologies 9500009448 47.070 71,737 Through BBN Technologies 9500012007 47.070 9,302 Through BBN Technologies 9500012008 47.070 34,052 Through BBN Technologies 9500012129 47.070 101,608 Through University of Delaware 27181 47.074 19,687 Through Kansas State University S12051 47.074 38,818 Through Duke University 14-NSF-1049 47.074 11,608 Through Duke University EF-0830093 47.074 73,329 Through Council on Undergraduate Research Q01 47.074 20,596 Biological Sciences 47.074 2,211,183 Social Behavioral and Economic Sciences 47.075 355,158 Through Ohio State University 60027792-01 47.075 37,205 Through University of Louisville ULRF08-0891-04 47.076 89,110 Through Tennessee Technological University 1022934 47.076 34,374 Through Purdue University 4101-56007 47.076 5,494 Through Puget Sound Center for Teaching PSCTLT-SCHEFF-08 47.076 5,958 Through Pennsylvania State University 5015-UKRF-NSF-6347 47.076 14,098 Education and Human Resources 47.076 721,956 Office of International and Integrative Activities 47.079 93,691 Office of Cyberinfrastrucure 47.080 540,022 Office of Experimental Program to Stimulate Competitive Research 47.081 1,587,902 Through Clemson University 1573-206-2008707 47.081 4,956 ARRA-Trans-NSF Recovery Act Research Support 47.082 299,612 Through ARRA-BBN Technologies PO # 9500010143 47.082 7,037 National Science Foundation IIP-1444022 47.IIP-1444022 5,000 SUBTOTAL NATIONAL SCIENCE FOUNDATION 12,815,104
3

FEDERAL GRANTOR/PASS-THROUGH GRANTOR/PROGRAM OR CLUSTER TITLE PASS-THROUGH ENTITY CFDA FEDERAL IDENTIFYING NUMBER NUMBER EXPENDITURES
Through American Rivers EPA022013 66.050 $ 112,407 Through Kentucky Tourism Arts and Heritage Cabinet PON2 129 1200002602 66.460 (2,338) Science To Achieve Results (STAR) Research Program 66.509 496,060 Office of Research and Development Consolidated Research/Training/Fellowships 66.511 94,969 P3 Award: National Student Design Competition for Sustainability 66.516 4,370 Environmental Protection Agency Contract EP-12-D-000386 66.EP-12-D-000386 830 Through Physical Sciences Inc SC60900-6429-001 66.SC60900-6429-001 19,151 SUBTOTAL ENVIRONMENTAL PROTECTION AGENCY 725,449 Through University of Southern California Y82308 81.003 42,653 Through Battelle Energy Alliance LLC 0129388 81.0129388 334,949 Through University of Chicago FP048826 81.049 42,674 Office of Science Financial Assistance Program 81.049 1,651,638 Through Green Technology Limited Company DE-SC0006378 81.049 33,711 Through Cornell University SUBAWARD #: 63079-9708 81.049 180,318 Through South Dakota State University 3TD152 81.079 35,422 Through West Virginia University 10-733-UKRF 81.087 318,946 Through South Dakota State University 3TE153 81.087 10,982 Through Virginia Polytechnic Institute and State University 429307-19660 81.089 121,726 Through Novozymes North America Inc DE-FE0007741 81.089 156,278 Fossil Energy Research and Development 81.089 6,073,579 Through CoalTek Inc DE-FE0005293 81.089 37,912 Through Center for Advanced Separation DE-FE0000699 81.089 4,912 Environmental Restoration 81.092 356,043 Through Kentucky Cabinet for Health and Family Services PO2 728 1200004525 81.104 123,697 Stewardship Science Grant Program 81.112 125,509 Through University of Houston R-10-0030 81.117 16,802 Through ARRA-University of Illinois 2010-00636-01 A2349 81.132 102,427 Through University of California Berkeley 00007863 81.135 139,316 Through Texas AgriLife Research 06-570792 81.135 122,825 Through Texas AgriLife Research 570792 81.135 2,908 Through ITN Energy Systems Inc DE-AR0000260 81.135 157,558 Through ARRA-Pennsylvania State University 4199-UK-DOE-0092 81.135 (88) ARRA-Advanced Research Projects Agency - Energy 81.135 (562) Through Battelle Memorial Institute 349541 81.349541 61,525 Through Oak Ridge National Laboratory 4000103052 81.4000103052 20,325 Through Oak Ridge National Laboratory 4000103637 81.4000103637 59,617 Through Oak Ridge National Laboratory 4000120600 81.4000120600 994 Through Oak Ridge National Laboratory 4000130203 81.4000130203 13,909 Department of Energy Contract DE-NT0005988 81.DE-NT0005988 271,763 Through Argonne National Laboratory OF33642/DEAC0206CH111357 81.OF33642/DEAC0206CH111357 8,694 Through General Motors Research TCS68344 PR3731RY 001 81.TCS68344 PR3731RY 001 51,038 Through Battelle Memorial Institute US001-0000378113 81.US001-0000378113 24,678 SUBTOTAL DEPARTMENT OF ENERGY 10,704,678 National Institute on Disability and Rehabilitation Research 84.133 100,133 Through Gallaudet University 0000021918 84.133 20,729 Education Research Development and Dissemination 84.305 361,351 Through Duke University 10-ED-1097 84.305 54,660 Through University of South Carolina 12-2108 PO#42179 84.324 41,809 Research in Special Education 84.324 233,033 Through American Printing House for the Blind DOE022014 84.327 933 Through Kentucky Department of Education M-04125856 84.357 57 Through Georgetown College DOE062013 84.365 67,797 Through Georgetown College DOE072012 84.365 18 Through Georgetown College T365Z120064 84.365 15,748 SUBTOTAL DEPARTMENT OF EDUCATION 896,268 Through Ohio State University 60042250 PO RF01347515 93.077 24,452 Through Kentucky River Community Care Inc ACF021114 93.087 51,457 Through Kentucky River Community Care Inc ACF022013 93.087 14,029 Through National Institute for Pharmaceutical Technology NIPTE-U01-KY-001-2012 93.103 2,784 Through National Institute for Pharmaceutical Technology NIPTE-U01-KY-002-2012 93.103 20,631 Food and Drug Administration Research 93.103 464,495 Through Boulder Nonlinear Systems Inc DHHS2013 93.103 77,726 Through University of North Carolina 5-37946 93.110 114,086 Through Wayne State University WSU12085 93.113 47,499 Through Scout Diagnostics LLC NIEHS112012 93.113 17,461 Environmental Health 93.113 1,821,927 Through Columbia University 4(GG005166) 93.113 (1,368) Oral Diseases and Disorders Research 93.121 34,386 Through Health Decision Technologies LLC NIDCR032014 93.121 90,488 Through Four Tigers LLC NIDCR012014 93.121 67,121 Through Bluegrass Advanced Materials LLC NIH 112013 93.121 64,743 Injury Prevention and Control Research and State and Community Based Programs 93.136 360,881 Through Macro International Co 13EDSK0105 93.13EDSK0105 20,762 NIEHS Superfund Hazardous Substances Basic Research and Education 93.143 768,400 Through Brown University 00000649 93.143 44,768 Through University of North Carolina 5-32779 93.172 194,931 Through University of Michigan 3001396589 93.173 59,552 Research Related to Deafness and Communication Disorders 93.173 698,333 Through Indiana University BL-4633516-UK PO#1232663 93.173 22,103 Through Childrens Hospital Medical Center 130990 / PO#3100355367 93.173 97,511 Through Childrens Hospital Medical Center PO#3100287147 130990 93.173 41,409 Department of Health and Human Services Contract 200-2009-30678 93.200-2009-30678 238,715 Department of Health and Human Services Contract 200-2011-40628 93.200-2011-40628 196,663 Department of Health and Human Services Contract 200-2013-56808 93.200-2013-56808 112,229 Department of Health and Human Services Contract 200-2013-M-55678 93.200-2013-M-55678 33,353 Through St Louis University 208141/039 93.208141/039 335 Through University of Virginia GC12121 144545 93.211 9,938 Research and Training in Complementary and Alternative Medic 93.213 17,501 Through Ohio State University 60035714 / R01 AT004922 93.213 25,118 Through Naprogenix AgTeCC NAPROGENIX-UKRF 10-01-10 93.213 19,762 National Center on Sleep Disorders Research 93.233 779,910 Through University of Notre Dame 201705 93.242 38,598 Through The Research Institute at Nationwide Children's Hospital 663412, PO WX00223037 93.242 8,249 Mental Health Research Grants 93.242 677,007 Through Kentucky Cabinet for Health and Family Services PO2 729 1300005602 93.243 49,485 Through Kentucky Cabinet for Health and Family Services PON2 729 1200002821 93.243 119,968 Through HOPE Center of Lexington CSAT-MEN 93.243 24,543 Through Catholic Social Services of the Diocese 5H79SM059210-03 93.243 6,804 Department of Health and Human Services Contract 254-2012-M-53283 93.254-2012-M-53283 13,138 Occupational Safety and Health Program 93.262 1,460,263 Through University of Tennessee 9000010391/9000008357 93.273 9,284 Through University of Mississippi Medical Center 66100080712-UKY01 93.273 26,697 Through University of Georgia RR274-346/3503288 93.273 14,280 Through Northern Kentucky University NKU-UKRF-4000644-01 93.273 21,151 Through Naprogenix AgTeCC 2R44AA018266-03A1 93.273 81,273 Through Naprogenix AgTeCC NAPROGENIX-UKRF 10-1-08 93.273 5,379 Alcohol Research Programs 93.273 2,365,254 Through Kentucky Justice and Public Safety Cabinet PON2 527 1300001431 93.275 89,300 Through University of South Carolina 14-2449 PO# 81368 93.279 74,595 Through University of Louisville ULRF 10-0085 93.279 23,833 Through University of Georgia RR274-332/3506508 93.279 14,020 Through University of Georgia RR274-381/4785666 93.279 20,033 Through University of Georgia RR274-403/4895506 93.279 15,667 Through University of Cincinnati COEUS # 7073 93.279 47,361 Through University of Cincinnati COEUS # 7073-022 93.279 387,250 Through University of Arkansas 39672 93.279 50,050
4

FEDERAL GRANTOR/PASS-THROUGH GRANTOR/PROGRAM OR CLUSTER TITLE PASS-THROUGH ENTITY CFDA FEDERAL IDENTIFYING NUMBER NUMBER EXPENDITURES
Through New York University School of Medicine 11-00991/PROJECT # 26550 93.279 $ 16,880 Through New York University School of Medicine 11-00991; #265504 93.279 19,448 Through Health Decision Technologies LLC 8533-1, 112390-00001-03 93.279 20,476 Drug Abuse and Addiction Research Programs 93.279 11,062,431 Through Boston University 4500000109/4500001301 93.279 97,481 Through AntiOp Inc NIH052013 93.279 147,657 Through AntiOp Inc NIH052014 93.279 40,942 Through AllTranz NIH102012 93.279 (22,772) Through Alcomed Inc NIH052012 93.279 40,099 Through Kentucky Cabinet for Health and Family Services PON2 728 1200002278 93.283 108,939 Discovery and Applied Research for Technological Innovations 93.286 523,999 Through University of North Texas Health Science Center RN0080-2013-003 93.307 12,180 Minority Health and Health Disparities Research 93.307 734,277 Through Case Western Reserve RES507038 93.307 55,241 Through University of Michigan 3000691501-RPT 93.310 2,329 Through University of Louisville ULRF 13-0593 93.310 15,980 Trans-NIH Research Support 93.310 1,777,437 National Center for Advancing Translational Sciences 93.350 3,788,581 Through University of Missouri C00039341-1 93.361 (7) Through University of Missouri C00043419-1 93.361 8,069 Nursing Research 93.361 889,324 Through NACC/University of Washington 737298 93.361 5,629 National Center for Research Resources 93.389 104,521 Through Miami University HERSHBERGER-NIH-UKRF 93.389 30,564 Through University of Miami ACCT 662484, PO MR82711 93.393 9,832 Through University of Massachusetts 6114214/RFS900200 93.393 12,709 Cancer Cause and Prevention Research 93.393 1,507,266 Cancer Detection and Diagnosis Research 93.394 784,034 Through University of South Florida 6119-1222-30-AY 93.395 13,299 Through University of South Florida 6145-1028-00-C 93.395 42,065 Through The Gynecologic Oncology Group 27469-060 93.395 112,324 Through St Jude Childrens Research Hospital 111495030-7481426 93.395 (307) Through St Jude Childrens Research Hospital 111495040-7538417 93.395 3,544 Through Southwest Oncology Group CA32102 93.395 5,203 Through NSABP Foundation TIND 182 93.395 22,499 Through National Childhood Cancer Foundation 020742 93.395 1,000 Through Exatherm LLC NIH072011 93.395 7,222 Through Childrens Hospital of Philadelphia FP00013013_SUB101_01 93.395 33,280 Through Childrens Hospital of Philadelphia FP00013013_SUB477_01 93.395 7,383 Through Childrens Hospital of Philadelphia FP00013087_SUB100_01 93.395 22,826 Through Childrens Hospital of Philadelphia FP00013744_SUB171_01 93.395 (2,874) Cancer Treatment Research 93.395 1,444,619 Through American College of Radiology 0526 93.395 27,078 Cancer Biology Research 93.396 2,590,536 Cancer Centers Support Grants 93.397 1,147,763 Cancer Research Manpower 93.398 185,424 Through Washington University WU-13-126 PO2917010W 93.399 4,904 Through Southwest Oncology Group CA37429 93.399 29 Cancer Control 93.399 76,475 Through Marshall Miller & Associates 200-2012-52497 93.521 75,847 Through University of North Texas Health Science Center RF7032-2013-002 93.531 9,170 Through Kentucky Cabinet for Health and Family Services PON2 736 1200002220 93.558 5,211,524 Through Eastern Kentucky University 452664-14-140 93.558 34,923 Department of Health and Human Services Contract 5R01AI078756-06 93.5R01AI078756-06 104,224 Through Northwestern University 60028841 UKY 93.60028841 UKY 52,206 Strong Start for Mothers and Newborns 93.611 516,225 Through Kentucky Council on Developmental Disabilities PON2 729 1200001693 93.630 148,628 Through ARRA-University of Pittsburgh 0015124 PROJECT # 116763 93.701 1,947 ARRA-Non-Construction Grants 93.701 191,498 Through ARRA-University of Texas Health Science Center at San Antonio 00075121 93.728 7,950 Through National Opinion Research Center 7570.UKRF.01 93.7570.UKRF.01 13,198 Through Kentucky Cabinet for Health and Family Services PO2 746 1400003710 93.767 82,925 Through W-Z Biotech LLC NIH032013 93.837 39,457 Through W-Z Biotech LLC NIH052014 93.837 6,213 Through W-Z Biotech LLC NIH122011 93.837 (16) Through New York University School of Medicine 10-01073 93.837 8,752 Through Duke Clinical Research Institute NIH082012 93.837 31,982 Through Carl T. Hayden Medical Research Foundation R01HL094775 93.837 1,102 Cardiovascular Diseases Research 93.837 4,979,003 Through Brigham and Women's Hospital 107223 93.837 3,031 Through Biomedical Development Corporation 12-0972-F2L 93.837 47,955 Through University of Michigan 3002442423 93.838 89,419 Lung Diseases Research 93.838 716,837 Through Lovelace Biomedical and Environmental Research Institute JK121185 MOD 1 93.838 16,911 Through Cornell University R01HL114055 93.838 35,100 Through University of Louisville ULRF12-1403 93.839 51,324 Through University of Arkansas 40864 93.839 2,777 Through National Marrow Donor Program 0901 93.839 9,009 Blood Diseases and Resources Research 93.839 345,855 Through Wake Forest University 14-004 93.846 36,898 Through Johns Hopkins University 2001073065 93.846 20,788 Through CytoInformatics LLC NIH082013 93.846 74,774 Arthritis Musculoskeletal and Skin Diseases Research 93.846 1,975,972 Through Washington University in St Louis WU-13-238 93.847 99,091 Through University of South Florida HHSN267200800019C 93.847 113 Through University of North Texas Health Science Center RN0065-2013-002 93.847 58,092 Through University of North Carolina 5-31706 93.847 7,456 Through Texas A&M Research Foundation 02-S140205 93.847 20,607 Through Lexington Biomedical Research Inst. NIH062012 93.847 103,270 Through Georgia Regents University 25034-31 93.847 57,392 Through Georgia Regents University 25732-26 93.847 42,153 Diabetes Digestive and Kidney Diseases Extramural Research 93.847 3,913,615 Through Yale University A09394 (M10A10562) 93.853 10,013 Through Yale University M07A00656 (A08383) 93.853 56 Through Yale University M10A10562 (A08580) 93.853 4,956 Through Yale University M10A10562 (A09014) 93.853 (5,159) Through University of Pennsylvania 543952 93.853 (512) Through University of Michigan 3000770498-ALIAS 93.853 37,932 Through University of Michigan 3001300372-PIII 93.853 115,444 Through University of Michigan 3001413335-PNT 93.853 54,077 Through University of Michigan 3001922357-BPT 93.853 82,034 Through University of Michigan 3002112003-SHN 93.853 68,967 Through University of Michigan 3002672039-ISPOT 93.853 60 Through University of Michigan U01NS058967 93.853 109,894 Through Signal Solutions LLC 1R43NS083218-01 93.853 52,099 Extramural Research Programs in the Neurosciences and Neurological Disorders 93.853 6,398,662 Through Washington University WU-09-57 PO2904914N 93.855 118,654 Through University of South Florida SUBAWARD #6408-1070-00-A 93.855 6,209 Through University of Pittsburgh 0011210, 115316-1 93.855 280,683 Through University of North Carolina 5-33339 93.855 104,931 Through University of Chicago 37045 93.855 1,144 Through MosquitoMate Inc NIH102012 93.855 3,014 Through Cornell University 13070868 93.855 17,327 Allergy Immunology and Transplantation Research 93.855 4,309,841 Microbiology and Infectious Diseases Research 93.856 16,625 Through University of Vermont 26835SUB51331 93.859 10,518 Through University of Minnesota P657611701 93.859 114,146 Through University of Louisville NO ID 93.859 38,474 Through University of Louisville ULRF 09-0109D1-08 93.859 216,268 Through Rice University R22303 93.859 $ 79,875 Through ParaTechs Corp NIH 092013 93.859 25,692 Biomedical Research and Research Training 93.859 8,001,965 Through Benaroya Research Institute FY14197601 93.859 26,768
5

FEDERAL GRANTOR/PASS-THROUGH GRANTOR/PROGRAM OR CLUSTER TITLE PASS-THROUGH ENTITY CFDA FEDERAL IDENTIFYING NUMBER NUMBER EXPENDITURES
Through University of Illinois 2012-06945-01 93.862 32,760 Through University of Illinois 2010-06423-01-00 93.865 18,283 Through University of California San Diego 41567532 93.865 24,988 Through Palo Alto University BALSAM-R01 HD069370-SCUK 93.865 9,722 Through Palo Alto University BALSAM-R01HD069370-SCUK 93.865 14,081 Child Health and Human Development Extramural Research 93.865 1,541,850 Through Alkymos Inc NIH082011 93.865 2,445 Through University of Pittsburgh 0010382 (407708-1) 93.866 60,499 Through University of Illinois 2008-03931-06-03 93.866 250,013 Through University of California San Diego 45886762 93.866 15,260 Through University of California San Diego ADC-030 93.866 18,110 Through University of California San Diego ADC-031 93.866 (573) Through University of California San Diego ADC-037 93.866 3,503 Through University of California San Diego ADC-039 93.866 121,605 Through University of California San Diego ADC-046-INI 93.866 18,257 Through University of California San Diego CSSA 23-UKL-IGIV M-00-AD 93.866 178,488 Through Seattle Institute for Biomedical and Clinical Research BW22-KENTUCKY 3 93.866 96,231 Through Scout Diagnostics LLC 5R24AG030239-03 93.866 19,541 Through NACC/University of Washington 752713 93.866 24,929 Through CoPlex Therapeutics LLC NIA112012 93.866 15,790 Aging Research 93.866 8,541,689 Vision Research 93.867 1,824,288 Through University of Dayton Research Institute RSC12039 93.867 51,837 Through University of Dayton Research Institute RSC13037 93.867 73,757 Through St Luke's Roosevelt Institute for Health Sciences NIH052013 93.867 4,090 Through Jaeb Center for Health Research Inc C_AV511-14 93.867 5,168 Through Jaeb Center for Health Research Inc CEB_AV511-14 93.867 2,584 Through Rutgers University 8044 93.879 72,654 Through University of North Texas Health Science Center N-01137 93.941 3,571 Through Kentucky Cabinet for Health and Family Services PO2 729 1300004828 93.959 847,280 Through Kentucky Cabinet for Health and Family Services PO2 728 1200004963 93.994 (365) Department of Health and Human Services Contract HHSN261201300013I 93.HHSN261201300013I 1,207,929 Department of Health and Human Services Contract HHSN271201100710P 93.HHSN271201100710P 40,123 Through Brigham and Women's Hospital KY010 93.KY010 194 Through Naprogenix AgTeCC NAPROGENIX2013 93.NAPROGENIX2013 64,980 Through Bavarian Nordic POX-MVA-008 93.POX-MVA-008 4,989 SUBTOTAL DEPARTMENT OF HEALTH AND HUMAN SERVICES 94,591,815 Through National Institute for Hometown Security 02-09-UK 97.02-09-UK 700,991 Through National Institute for Hometown Security 02-10-UK 97.02-10-UK 239,359 Through National Institute for Hometown Security 03-09-UK 97.03-09-UK 524,448 Through University of Louisville ULRF 13-1097-01 97.039 8,499 Through National Institute for Hometown Security 04-09-UK 97.04-09-UK 268,608 Through University of Southern California 33775811 PO 10010594 97.061 2,419 Through University of Southern California 45789417 PO 10137382 97.061 35,184 Through University of Minnesota P001955409 97.061 175,641 Through Kansas State University S11199 97.061 (528) Through National Institute for Hometown Security 12-07-UK 97.12-07-UK 208,102 Through Flashscan 3D HSHQDC-11-C-00115 97.HSHQDC-11-C-00115 879 Through University of Louisville ULRF 08-0292-01 97.ULRF 08-0292-01 7,822 Through Western Kentucky University WKURF 547103-10-001 97.WKURF 547103-10-001 857 SUBTOTAL DEPARTMENT OF HOMELAND SECURITY 2,172,281 Through DevTech Systems Inc 1096-SC-13-004-00 98.1096-SC-13-004-00 26,288 SUBTOTAL US AGENCY FOR INTERNATIONAL DEVELOPMENT 26,288 TOTAL RESEARCH AND DEVELOPMENT CLUSTER 150,518,462 STUDENT FINANCIAL AID CLUSTER Federal Supplemental Educational Opportunity Grants 84.007 437,946 Federal Work-Study Program 84.033 1,117,873 Federal Perkins Loan Cancellations 84.038 25,030,944 Federal Pell Grant Program 84.063 22,486,221 Federal Direct Student Loans 84.268 168,551,011 SUBTOTAL DEPARTMENT OF EDUCATION 217,623,995 Nurse Faculty Loan Program 93.264 147,264 Health Careers Opportunity Program 93.342 5,275,458 SUBTOTAL DEPARTMENT OF HEALTH AND HUMAN SERVICES 5,422,722 TOTAL STUDENT FINANCIAL AID CLUSTER 223,046,717 SNAP CLUSTER Through Kentucky Cabinet for Health and Family Services PO2 736 1300002697 10.561 800,805 Through Kentucky Cabinet for Health and Family Services PO2 736 1400002244 10.561 2,389,239 SUBTOTAL DEPARTMENT OF AGRICULTURE 3,190,044 TOTAL SNAP CLUSTER 3,190,044 HIGHWAY PLANNING AND CONSTRUCTION CLUSTER Through Kentucky Transportation Cabinet PON2 6051400000496 20.205 12,329 SUBTOTAL DEPARTMENT OF TRANSPORTATION 12,329 TOTAL HIGHWAY PLANNING AND CONSTRUCTION CLUSTER 12,329 HIGHWAY SAFETY CLUSTER Through Kentucky Transportation Cabinet PO2 625 1300001620 20.601 28,416 Through Kentucky Transportation Cabinet PO2 625 1400001006 20.610 46,999 SUBTOTAL DEPARTMENT OF TRANSPORTATION 75,415 TOTAL HIGHWAY SAFETY CLUSTER 75,415 SPECIAL EDUCATION CLUSTER (IDEA) Through Kentucky Education and Workforce Development Cabinet PON2 540 1200002224 84.027 129,541 Through Kentucky Education and Workforce Development Cabinet PON2 540 1200002637 84.027 (3,721) Through Kentucky Education and Workforce Development Cabinet PON2 540 1300000498 84.027 58,799 Through Kentucky Education and Workforce Development Cabinet PON2 540 1300002578 84.027 99,687 Through Kentucky Education and Workforce Development Cabinet PON2 540 1300002844 84.027 232,921 Through Kentucky Education and Workforce Development Cabinet PON2 540 1300002890 84.027 262,052 Through Kentucky Education and Workforce Development Cabinet PON2 540 1300003014 84.027 250,393 Through Kentucky Education and Workforce Development Cabinet PON2 540 1400000467 84.027 250,082 Through Georgetown College PON2 540 1300002651 84.027 11,409 Through Kentucky Education and Workforce Development Cabinet PON2 540 1200002926 84.173 110,460 Through Kentucky Education and Workforce Development Cabinet PON2 540 1300003115 84.173 145,775 SUBTOTAL DEPARTMENT OF EDUCATION 1,547,398 TOTAL SPECIAL EDUCATION CLUSTER (IDEA) 1,547,398 TRIO CLUSTER TRIO Student Support Services 84.042 260,605 SUBTOTAL DEPARTMENT OF EDUCATION 260,605 TOTAL TRIO CLUSTER 260,605 SCHOOL IMPROVEMENT GRANTS CLUSTER Through Kentucky Education and Workforce Development Cabinet PON2 540 1200003442 84.377 11,707 Through Kentucky Education and Workforce Development Cabinet PON2 540 1300002928 84.377 47,097 SUBTOTAL DEPARTMENT OF EDUCATION 58,804 TOTAL SCHOOL IMPROVEMENT GRANTS CLUSTER 58,804 HEALTH CENTERS CLUSTER Consolidated Health Centers 93.224 1,394,157 SUBTOTAL DEPARTMENT OF HEALTH AND HUMAN SERVICES 1,394,157 TOTAL HEALTH CENTERS CLUSTER 1,394,157 TANF CLUSTER Through Kentucky Cabinet for Health and Family Services PO2 736 1200004856 93.558 2,261,593 SUBTOTAL DEPARTMENT OF HEALTH AND HUMAN SERVICES 2,261,593 TOTAL TANF CLUSTER 2,261,593 CCDF CLUSTER Through University of Delaware 34109 93.575 24,944 Through Kentucky Cabinet for Health and Family Services PO2 736 1200004968 93.596 2,687,878 SUBTOTAL DEPARTMENT OF HEALTH AND HUMAN SERVICES 2,712,822 TOTAL CCDF CLUSTER 2,712,822
6

FEDERAL GRANTOR/PASS-THROUGH GRANTOR/PROGRAM OR CLUSTER TITLE PASS-THROUGH ENTITY CFDA FEDERAL IDENTIFYING NUMBER NUMBER EXPENDITURES
MEDICAID CLUSTER Through Kentucky Cabinet for Health and Family Services PON2 729 1200001394 93.778 $ 2,887,267 SUBTOTAL DEPARTMENT OF HEALTH AND HUMAN SERVICES 2,887,267
TOTAL MEDICAID CLUSTER 2,887,267 OTHER FEDERAL ASSISTANCE Through Kentucky Cabinet for Health and Family Services M-06080751 66.032 29 SUBTOTAL ENVIRONMENTAL PROTECTION AGENCY 29 Agricultural Research Basic and Applied Research 10.001 84,524 Plant and Animal Disease Pest Control and Animal Care 10.025 487,517 Through Kentucky Department of Agriculture PON2 035 1200003674 10.025 118 Through Kentucky Department of Agriculture PON2 035 1300002288 10.025 17,400 Through Kentucky Department of Agriculture PON2 035 1100001314 10.170 (34) Through Kentucky Department of Agriculture PON2 035 1200000904 10.170 42,134 Through Kentucky Department of Agriculture PON2 035 1200000908 10.170 10,223 Through Kentucky Department of Agriculture PON2 035 1300001315 10.170 14,270 Through University of Florida 1200141260 10.200 4 Through University of Florida 1200141704 10.200 29 Through University of Georgia RD309-117/4893466 10.215 (1,661) Through University of Georgia RD309-122/4941306 10.215 22,000 Through University of Georgia RD309-125/4944906 10.215 1,317 Through University of Georgia RE675-116 4892296 10.215 1,375 Through University of Georgia RE675-116/4892206 10.215 1,212 Through University of Georgia RE675-167/4940156 10.215 6,548 Through University of Georgia RE675-167/4941226 10.215 39,000 Through University of Illinois 2012-00593-01 10.250 9,499 Food Assistance and Nutrition Research Programs (FANRP) 10.253 29,934 Through Texas A&M University 451010 10.303 12,202 Through Purdue University 8000035690-AG 10.304 23,994 Through Purdue University 8000057940-AG 10.304 29,788 International Science and Education Grants 10.305 24,420 Through Washington State University 118978 G003158 10.310 12,538 Through University of Wisconsin 210K840; 129200 10.310 10,731 Through University of Tennessee 8500031743 10.310 71,550 Through University of Florida UF10071 10.310 (2) Through Texas A&M University 06-S130683 10.310 10,433 Through Texas A&M Research Foundation 99-S140654 10.310 9,335 Through Purdue University 8000041337-AG 2010-38411 10.310 39,096 Beginning Farmer and Rancher Development Program 10.311 160,757 Through Kansas State University S14028 10.319 49,215 Through Meat Hook LLC USDA072012 10.352 11,274 Through University of Nebraska - Lincoln 25-6329-0059-808 10.500 18,147 Through University of Nebraska - Lincoln 25-6365-0040-004 10.500 412,517 Through University of Nebraska - Lincoln 25-6365-0040-131 10.500 8,910 Through University of Minnesota A003899801 10.500 601 Through University of Georgia RE675-171/4940896 10.500 1,949 Through University of Arkansas 21662-16 10.500 8,386 Through Purdue University 8000053242 10.500 191,142 Through Purdue University 8000059371 10.500 72,016 Through Pennsylvania State University 4907-UKRF-USDA-0946 10.500 13,635 Through National Four H Council USDA082013 10.500 25,000 Through Mississippi State University 018000.340436.04 10.500 12,081 Through Kansas State University S13140 10.500 24,888 Through Kansas State University S14112 10.500 25,243 Cooperative Extension Service 10.500 11,411,560 Through Kentucky Tourism Arts and Heritage Cabinet PON2 128 1400000416 10.664 10,280 Through Kentucky Energy and Environment Cabinet PON2 128 1200003171 10.664 (1) Through Kentucky Energy and Environment Cabinet PON2 128 1200003271 10.664 30,962 Through Kentucky Energy and Environment Cabinet PON2 128 1300000194 10.664 (99) Through Kentucky Energy and Environment Cabinet PON2 128 1300000851 10.664 31,158 Through Kentucky Energy and Environment Cabinet PON2 128 1400000134 10.664 31,990 Through Kentucky Energy and Environment Cabinet PON2 128 1200002731 10.678 14,844 Rural Energy for America Program 10.868 32,348 Soil and Water Conservation 10.902 27,338 Technical Agricultural Assistance 10.960 20,689 Cochran Fellowship Program-International Training-Foreign Participant 10.962 102,162 US Department of Agriculture Contract AG-3198-B-10-0028 10.AG-3198-B-10-0028 2,041,918 Through Altarum Institute SC-10-013 10.SC-10-013 16,569 SUBTOTAL DEPARTMENT OF AGRICULTURE 15,816,973 Economic Development Technical Assistance 11.303 125,237 Measurement and Engineering Research and Standards 11.609 24,433 SUBTOTAL DEPARTMENT OF COMMERCE 149,670 Through Kentucky Department of Military Affairs TASK ORDER #1 12.401 6,499 Through Kentucky Department of Military Affairs TASK ORDER #2 12.401 104,589 Through Kentucky Department of Military Affairs TASK ORDER #3 12.401 9,995 Military Medical Research and Development 12.420 24,683 Through Clarksville Montgomery County School System 00207949-000 12.556 49,612 Through Clarksville Montgomery County School System 00207950-000 12.556 16,422 Through Christian County Schools HE1254-13-1-0023 12.556 7,733 Language Grant Program 12.900 (4,761) Department of Defense Contract W912KZ-13-9-0070 12.W912KZ-13-9-0070 61,625 SUBTOTAL DEPARTMENT OF DEFENSE 276,397 Sustainable Communities Regional Planning Grant Program 14.703 148,176 SUBTOTAL DEPARTMENT OF HOUSING AND URBAN DEVELOPMENT 148,176 National Geological and Geophysical Data Preservation Program 15.814 42,791 Through City of Frankfort FRANK103112 15.904 (1,468) SUBTOTAL DEPARTMENT OF THE INTERIOR 41,323 Through Kentucky Association of Sexual Assault Programs KASAP 072012 16.529 752 Through Kentucky Court of Justice PON2 025 1200002134 16.585 951 Through Kentucky Court of Justice PON2-025-1200002134 16.585 2,142 Through Mountain Comprehensive Care Center 2011-RN-BX-0009 16.812 11,266 Through Mountain Comprehensive Care Center 2011-RW-BX-0001 16.812 15,374 Through Mountain Comprehensive Care Center 2013-RW-BX-0008 16.812 17,238 Through Kentucky Justice and Public Safety Cabinet PON2 527 1300000957 16.812 1,339 Through Kentucky Justice and Public Safety Cabinet PON2 527 1400000317 16.812 43,694 Through Kentucky Justice and Public Safety Cabinet PON2 527 1400000359 16.812 1,776 Through Chrysalis Inc BJA102012 16.812 4,391 Department of Justice Contract DJBP0109MF510001 16.DJBP0109MF510001 9,255 SUBTOTAL DEPARTMENT OF JUSTICE 108,178 Through Kentucky Community and Technical College System TC-23843-12-60-A-21 17.282 57,274 Through Kentucky Community and Technical College System TC-25151-13-60-A-21 17.282 33,846 SUBTOTAL DEPARTMENT OF LABOR 91,120 Environmental and Scientific Partnerships and Programs 19.017 203,669 Through Institute of International Education Inc STATE122013 19.432 14,864 Public Diplomacy Programs for Afghanistan and Pakistan 19.501 547,794 General Department of State Assistance 19.700 3,883 SUBTOTAL DEPARTMENT OF STATE 770,210 Through National Academy of Sciences HR 15-32A 20.215 73,627 Through Kentucky Transportation Cabinet 8780701N 20.215 146,048 Through Kentucky Transportation Cabinet LTAP-4 20.215 158,205 Highway Training and Education 20.215 10,985 SUBTOTAL DEPARTMENT OF TRANSPORTATION 388,865 Through Morehead State University 2012-13-085-001 23.001 312,185 Through Greenup County Health Department KY-17095-11 23.002 19,718 Appalachian Research Technical Assistance and Demonstration 23.011 358 SUBTOTAL APPALACHIAN REGIONAL COMMISSION 332,261 Intergovernmental Personnel Act (IPA) Mobility Program 27.011 12,464 SUBTOTAL OFFICE OF PERSONNEL MANAGEMENT 12,464 Through Illinois State University 11510-04890009477 42.11510-04890009477 (1) SUBTOTAL LIBRARY OF CONGRESS (1)
7

FEDERAL GRANTOR/PASS-THROUGH GRANTOR/PROGRAM OR CLUSTER TITLE PASS-THROUGH ENTITY CFDA FEDERAL IDENTIFYING NUMBER NUMBER EXPENDITURES
Science 43.001 $ 4,615 Education 43.008 11,817 National Aeronautics Space Commission Contract NNX10AV39A 43.NNX10AV39A 736 SUBTOTAL NATIONAL AERONAUTICS & SPACE ADMINISTRATION 17,168 Promotion of the Arts Grants to Organizations and Individuals 45.024 19,905 Promotion of the Humanities Division of Preservation and Access 45.149 66,235 Through Open Knowledge Commons HUBS_KEN-NEH_001_2012 45.169 591 Conservation Project Support 45.303 17,319 Through Saint Johns University VHMML-002 45.312 23,686 National Leadership Grants 45.312 101,981 SUBTOTAL NATIONAL ENDOWMENT FOR THE HUMANITIES 229,717 Small Business Development Centers 59.037 1,720,006 SUBTOTAL SMALL BUSINESS ADMINISTRATION 1,720,006 Through Kentucky Cabinet for Health and Family Services PO2 728 1400003642 66.032 20,528 Urban Waters Small Grants 66.440 14,098 Through Watershed Watch in Kentucky Inc EPA022014 66.460 19,981 Through Kentucky Energy and Environment Cabinet PO2 129 0900025111 66.460 243,455 Through Kentucky Energy and Environment Cabinet PON2 128 1100000957 66.460 3,590 Through Kentucky Energy and Environment Cabinet PON2 128 1200000603 66.460 1 Through Kentucky Energy and Environment Cabinet PON2 128 1300000613 66.460 55,171 Through Kentucky Energy and Environment Cabinet PON2 128 1300001321 66.460 58,813 Through Kentucky Department of Agriculture PON2 035 1200002554 66.605 27,506 SUBTOTAL ENVIRONMENTAL PROTECTION AGENCY 443,143 Through Kentucky Energy and Environment Cabinet PON2 127 1200001650 81.041 (15) Through ARRA-Arizona Geological Survey KY-EE0002850 81.086 62,809 Through University of Central Florida UCF01-0000280883 81.087 25,664 Fossil Energy Research and Development 81.089 1,337,763 Energy Efficiency and Renewable Energy Information Dissemination Outreach Training and Technical Analysis/Assistance 81.117 221,051 Through Kentucky Department of Local Government PON2 112 1400000339 81.119 30,383 ARRA-Electricity Delivery and Energy Reliability Research Development and Analysis 81.122 506,045 Through Sandia National Laboratories 1343014 81.1343014 17,616 SUBTOTAL DEPARTMENT OF ENERGY 2,201,316 Through Kentucky Council on Postsecondary Education PO2 415 1200000900 84.002 (1,382) Through Kentucky Council on Postsecondary Education PO2 415 1200006998 84.002 670 Through Kentucky Education and Workforce Development Cabinet PON2 540 1300001933 84.048 103 Through Kentucky Education and Workforce Development Cabinet PON2 540 1300002711 84.048 5,865 Through Kentucky Education and Workforce Development Cabinet PON2 540 1400002035 84.048 2,616 Through Kentucky Education and Workforce Development Cabinet PON2 531 1200003944 84.051 (192) Fund for the Improvement of Postsecondary Education 84.116 103,091 Through Kentucky Education and Workforce Development Cabinet PON2 531 1200002711 84.126 497,757 Through Kentucky Education and Workforce Development Cabinet PON2 531 1200003951 84.126 150,364 Through Kentucky Education and Workforce Development Cabinet PON2 531 1200003953 84.126 137,728 Through Kentucky Education and Workforce Development Cabinet PON2 531 1200003954 84.126 32,925 Through Kentucky Cabinet for Health and Family Services PON2 531 1300002832 84.126 17,176 Rehabilitation Long-Term Training 84.129 303,434 Safe and Drug-Free Schools and Communities National Programs 84.184 630 Through University of Tennessee 14492-001-02 84.323 72,955 Through University of Louisville ULRF 14-0745-02 84.323 7,098 Through Kentucky Education and Workforce Development Cabinet PON2 540 1300001408 84.323 87,535 Through Kentucky Education and Workforce Development Cabinet PON2 540 1400000509 84.323 59,791 Through Kentucky Education and Workforce Development Cabinet PON2 540 1400000548 84.323 10,638 Through Kentucky Education and Workforce Development Cabinet PON2 540 1400000564 84.323 271,813 Through Kentucky Education and Workforce Development Cabinet PON2 540 1400000599 84.323 11,571 Research in Special Education 84.324 260,800 Through University of North Carolina 5-54471 H325J070007 84.325 39,186 Special Education Personnel Development to Improve Services 84.325 395,644 Through Eastern Kentucky University 452764-14-232 84.325 98,245 Special Education Technical Assistance and Dissemination to Improve Services and Results for Children with Disabilities 84.326 1,195,025 Through Kentucky Education and Workforce Development Cabinet PON2 540 1300000802 84.326 53,488 Through Kentucky Education and Workforce Development Cabinet PON2 540 1400000568 84.326 119,633 Through Kentucky Education and Workforce Development Cabinet PON2 540 1300000243 84.366 52,457 Through Kentucky Education and Workforce Development Cabinet PON2 540 1300000731 84.366 4,565 Through Kentucky Education and Workforce Development Cabinet PON2 540 1300000753 84.366 5,409 Through Kentucky Education and Workforce Development Cabinet PON2 540 1300001859 84.366 96,287 Through Kentucky Education and Workforce Development Cabinet PON2 540 1400000320 84.366 51,533 Through Kentucky Education and Workforce Development Cabinet PON2 540 1400000329 84.366 136,497 Through Kentucky Education and Workforce Development Cabinet PON2 540 1400000786 84.366 50,433 Through Kentucky Education and Workforce Development Cabinet PON2 540 1400000827 84.366 64,343 Through Murray State University OSP 2014-101 84.367 9,780 Through Kentucky Council on Postsecondary Education PO2 415 1200003084 84.367 30,977 Through Kentucky Council on Postsecondary Education PO2 415 1200003087 84.367 30,309 Through Kentucky Council on Postsecondary Education PO2 415 1200003090 84.367 14,077 Through Kentucky Council on Postsecondary Education PO2 415 1300003317 84.367 112,358 Through Kentucky Council on Postsecondary Education PO2 415 1300003321 84.367 49,448 Through Kentucky Council on Postsecondary Education PO2 415 1400003293 84.367 44,185 Through Kentucky Council on Postsecondary Education PO2 415 1400003460 84.367 86,979 Through Kentucky Council on Postsecondary Education PO2 415 1400003461 84.367 23,169 Through Westat 6189-S-007 84.373 164,206 Through University of Minnesota A001945803 84.373 1,293,175 Through ARRA-Ohio State University 60029197 / PO RF01229388 84.396 218,175 Transition Programs for Students with Intellectual Disabilities into Higher Education 84.407 348,095 SUBTOTAL DEPARTMENT OF EDUCATION 6,820,664 Training in General Pediatric and Public Health Dentistry 93.059 505,431 Through Kentucky Energy and Environment Cabinet PON2 129 1300000791 93.070 17,951 Food and Drug Administration Research 93.103 74,664 Through University of Louisville AHEC 2012-2013 93.107 82,518 Through University of Louisville ULRF-12-1074A1-01 93.107 168,361 Through University of Arizona Y553522 93.110 5,863 Through The Commission for Children with Special Health Care Needs PON2 767 1400000156 93.110 52,196 Maternal and Child Health Federal Consolidated Programs 93.110 35,436 Through Kentucky Cabinet for Health and Family Services PON2 728 1200002206 93.110 1,994 Through Hemophilia of Georgia Inc HRSA122013 93.110 17,384 Environmental Health 93.113 207,105 Through Kentucky Cabinet for Health and Family Services PO2 728 1300005045 93.130 2,500 Through University of South Florida 6416-1013-11-A 93.135 23,497 Centers for Research and Demonstration for Health Promotion 93.135 1,247,286 Through Kentucky Association of Sexual Assault Programs KASAP 072012 93.136 164 Injury Prevention and Control Research and State and Community Based Programs 93.136 703,498 Through Emory University Office of Sponsored Programs T136337 93.145 26,519 Through American International Health H-F4-ZAM-08-P-PTR-ZAMI 93.145 20,131 AIDS Education and Training Centers 93.145 183,727 Coordinated Services and Access to Research for Women Infants Children and Youth 93.153 370,401 Grants To States for Loan Repayment Program 93.165 215,886 Research Related to Deafness and Communication Disorders 93.173 8,670 Through University of North Carolina 5-42319 93.184 9,382 Through University of North Carolina 5-44792 93.184 5,254 Through North American Association Central Cancer Registries 2005-12-01 93.2005-12-01 6,015 Through University of Illinois 2010-06621-21-02 93.2010-06621-21-02 4,386 Telehealth Programs 93.211 176,996 Through Kentucky Cabinet for Health and Family Services PON2 728 1200001981 93.217 (874) Through Kentucky Cabinet for Health and Family Services PON2 728 1300001977 93.217 115,229 Through Kentucky Cabinet for Health and Family Services PO2 728 1300005192 93.236 6,425 State Rural Hospital Flexibility Program 93.241 540,482 Substance Abuse and Mental Health Services Projects of Regional and National Significance 93.243 419,506 Through Pennyroyal Regional Mental Health-Mental Retardation Board 999 93.243 57,560 Through Mountain Comprehensive Care Center 5H79TI023188-03 93.243 43,008
8

FEDERAL GRANTOR/PASS-THROUGH GRANTOR/PROGRAM OR CLUSTER TITLE PASS-THROUGH ENTITY CFDA FEDERAL IDENTIFYING NUMBER NUMBER EXPENDITURES
Through Kentucky River Community Care Inc SAMHSA092012 93.243 $ 10,381 Through Kentucky Court of Justice PON2 025 1200002134 93.243 50,846 Through Catholic Social Services of the Diocese 5H79SM059210-05 93.243 17,161 Public Health Training Centers Program 93.249 210,302 Occupational Safety and Health Program 93.262 576,218 Alcohol Research Programs 93.273 76,387 Drug Abuse and Addiction Research Programs 93.279 475,570 Through American Academy of Child and Adolescent Psychiatry AACAP020210 93.279 8,799 Department of Health and Human Services Contract 2801808 93.2801808 67,999 Through Public Health Foundation CDC042012 93.283 12,944 Through Kentucky Cabinet for Health and Family Services PON2 728 1200001871 93.283 30,001 Through Kentucky Cabinet for Health and Family Services PON2 728 1200002206 93.283 26,227 Through Kentucky Cabinet for Health and Family Services PON2 728 1300000784 93.283 65,116 Through Kentucky Cabinet for Health and Family Services PON2 728 1400000669 93.283 10,265 Centers for Disease Control and Prevention Investigations and Technical Assistance 93.283 1,690,270 Small Rural Hospital Improvement Grant Program 93.301 341,172 Department of Health and Human Services Contract 3217146 93.3217146 37,481 National Center for Advancing Translational Sciences 93.350 2,103 Through Vanderbilt University VUMC35255-R 93.359 14,305 Through Vanderbilt University VUMC35826 93.359 66,125 Through Vanderbilt University VUMC35826-R 93.359 346 Through Kentucky Council on Developmental Disabilities PO2 729 1400001975 93.360 65,095 National Center for Research Resources 93.389 278,139 Cancer Cause and Prevention Research 93.393 43,109 Through The Gynecologic Oncology Group CA27469-33 93.395 5,806 Through Meharry Medical College 091214MKH358 04 01 93.397 1,821 Cancer Centers Support Grants 93.397 1,144,283 Cancer Research Manpower 93.398 550,756 Through Mathematica Policy Research Inc 40146S03625 93.40146S03625 42,226 Through Kentucky Cabinet for Health and Family Services PON2 728 1200002206 93.505 46,788 Through Kentucky Cabinet for Health and Family Services PON2 728 1300001748 93.505 76,511 Affordable Care Act (ACA) Public Health Training Centers Program 93.516 (486) Through Kentucky Cabinet for Health and Family Services PO2 728 1200005194 93.521 248,376 Through Kentucky Cabinet for Health and Family Services PO2 728 1300005386 93.544 36,150 Through Kentucky Cabinet for Health and Family Services PON2 736 1200003048 93.556 197,584 Through Eastern Kentucky University 452529-13-123 93.556 2,080 Through Eastern Kentucky University 4525680-14-139 93.556 38,239 Through Eastern Kentucky University 452680-14-144 93.556 339,691 University Centers for Excellence in Developmental Disabilities Education Research and Service 93.632 492,555 Through ARRA-Macro International Co 635243-10S-1572 93.635243-10S-1572 113,920 Through Kentucky Cabinet for Health and Family Services PO2 736 1200004473 93.643 14,606 Through Eastern Kentucky University 452500-13-137 93.658 (12) Through Eastern Kentucky University 452502-13-136 93.658 804 Through Eastern Kentucky University 452506-13-120 93.658 470 Through Eastern Kentucky University 452506-13-124 93.658 281 Through Eastern Kentucky University 452650-14-142 93.658 112,393 Through Eastern Kentucky University 452652-14-138 93.658 276,293 Through Eastern Kentucky University 452653-14-151 93.658 364,583 Through Eastern Kentucky University 452655-14-143 93.658 6,980 Through Eastern Kentucky University 452656-14-141 93.658 320,243 Through Eastern Kentucky University 452656-14-145 93.658 114,505 Through Eastern Kentucky University 452656-14-152 93.658 227,699 Through Kentucky Cabinet for Health and Family Services PO2 736 1200004473 93.669 67,956 Through Eastern Kentucky University 452650-14-142 93.669 44,960 Child Abuse and Neglect Discretionary Activities 93.670 (10,810) Through ARRA-Kentucky Cabinet for Health and Family Services PO2 746 1200003495 93.718 353,895 Through ARRA-HealthBridge 90RC0025/01-UK 93.718 388,925 ARRA-Health Information Technology Regional Extension Centers Program 93.718 1,903,940 Through Kentucky Cabinet for Health and Family Services PO2 746 1200002881 93.767 56,359 Through Kentucky Cabinet for Health and Family Services PON2 746 1200001392 93.791 1,850,274 Cardiovascular Diseases Research 93.837 319,381 Lung Diseases Research 93.838 20,458 Arthritis Musculoskeletal and Skin Diseases Research 93.846 10,112 Diabetes Digestive and Kidney Diseases Extramural Research 93.847 147,048 Extramural Research Programs in the Neurosciences and Neurological Disorders 93.853 259,039 Allergy Immunology and Transplantation Research 93.855 8,000 Through University of Louisville 2 P20 GM103436-14 93.859 22,610 Through University of Louisville ULRF 09-0109D1-07 93.859 93,022 Biomedical Research and Research Training 93.859 641,754 Aging Research 93.866 236,000 Grants for Training in Primary Care Medicine and Dentistry 93.884 256,317 Health Care and Other Facilities 93.887 121,889 Specially Selected Health Projects 93.888 (1,124) Through University of Louisville ULRF 13-1475A2 93.889 30,858 Through Kentucky Cabinet for Health and Family Services PON2 728 1200002645 93.889 100,686 Resource and Manpower Development in the Environmental Health 93.894 7 Through Trover Clinic Foundation HRSA082012 93.912 10,419 Through Lotts Creek Community School Inc 1 D04RH23591-01-00 93.912 (11) Through Kentucky Education and Workforce Development Cabinet PON2 531 1200002711 93.912 15,556 Through Kentucky Education and Workforce Development Cabinet PON2 531 1400000013 93.912 26,821 Grants to States for Operation of Offices of Rural Health 93.913 172,382 Through Kentucky Cabinet for Health and Family Services PON2 728 1300000422 93.917 29,119 Through Kentucky Cabinet for Health and Family Services PON2 728 1300001994 93.917 1,463,987 Through Emory University Office of Sponsored Programs S847054 93.917 (702) Through Emory University Office of Sponsored Programs T066576 93.917 154,669 Grants to Provide Outpatient Early Intervention Services wit Respect to HIV Disease 93.918 627,814 Ryan White HIV/AIDS Dental Reimbursements\Community Based Dental Partnerships Grants 93.924 67,159 Special Projects of National Significance 93.928 26,548 Through Kentucky Cabinet for Health and Family Services PON2 1200001987 93.944 76,150 Through Kentucky Cabinet for Health and Family Services PON2 728 14000006411 93.945 10,265 PPHF-2012 Geriatric Education Centers 93.969 417,392 Through Kentucky Cabinet for Health and Family Services PO2 728 1200004963 93.994 4,542 Through Kentucky Cabinet for Health and Family Services PO2 728 1200005251 93.994 227,947 Through Kentucky Cabinet for Health and Family Services PON2 728 1200001981 93.994 (60) Through Kentucky Cabinet for Health and Family Services PON2 728 1200002124 93.994 (381) Through Kentucky Cabinet for Health and Family Services PON2 728 1200002194 93.994 37,941 Through Kentucky Cabinet for Health and Family Services PON2 728 1200002277 93.994 130,757 Through Kentucky Cabinet for Health and Family Services PON2 728 1300002245 93.994 5,153 Through George Washington University 12-M101 93.999 1,103 Department of Health and Human Services Contract HHSF223201110045C 93.HHSF223201110045C 875 Department of Health and Human Services Contract HHSF223201310059C 93.HHSF223201310059C 44,982 Department of Health and Human Services Contract HHSN261201000031C 93.HHSN261201000031C 148,356 SUBTOTAL DEPARTMENT OF HEALTH AND HUMAN SERVICES 24,926,396 Through National Institute for Hometown Security 01-09-UK 97.01-09-UK 238,388 Through Kentucky Department of Military Affairs PO2 095 1200004867 97.039 7,059 Through Kentucky Department of Military Affairs PON2 095 1100001421 97.039 90,970 Through Kentucky Department of Military Affairs PON2 095 1100001569 97.039 1,165,524 Assistance to Firefighters Grant 97.044 188,702 Through Kentucky Department of Military Affairs PO2 095 1200006117 97.047 234,197 SUBTOTAL DEPARTMENT OF HOMELAND SECURITY 1,924,840 Through Oklahoma State University AB-5-18880-UKRF 98.001 5,471 Through FHI Development 360 LLC 4273-UKY-01 98.4273-UKY-01 5,025 Through Chemonics International Inc AID-497-C-12-00001-UKY-0 98.AID-497-C-12-00001-UKY-0 169,477 SUBTOTAL US AGENCY FOR INTERNATIONAL DEVELOPMENT 179,973 TOTAL OTHER FEDERAL ASSISTANCE 56,598,888 GRAND TOTAL SCHEDULE OF EXPENDITURES OF FEDERAL AWARDS $ 444,564,501
9

University of Kentucky A Component Unit of the Commonwealth of Kentucky
Notes to Schedule of Expenditures of Federal Awards Year Ended June 30, 2014
Note 1: Basis of Presentation
The accompanying Schedule of Expenditures of Federal Awards (Schedule) of the University of Kentucky (University) has been prepared in the format as set forth in the U.S. Office of Management and Budget (OMB) Circular A-133, Audits of States, Local Governments, and Non-Profit Organizations. Therefore, some amounts presented in this Schedule may differ from amounts presented in, or used in the preparation of, the basic financial statements. The purpose of the Schedule is to present a consolidated summary of those expenditures of the University for the year ended June 30, 2014, which has been financed by the U.S. Government (Federal awards). For purposes of the Schedule, Federal awards include all Federal assistance and procurement relationships entered into directly and indirectly between the University and the Federal government and sub-awards from nonfederal organizations made under federally sponsored agreements.
The accounting principles followed by the University and used in preparing the Schedule are as follows:
• The Schedule includes amounts expended by the University and its affiliated corporation, the University of Kentucky Research Foundation, Inc.
• Deductions (expenditures) for direct costs are recognized as incurred using the accrual method of accounting and the cost accounting principles contained in OMB Circular A-21, Cost Principles for Educational Institutions. Under those cost principles, certain types of expenditures are not allowable or are limited as to reimbursement. Moreover, expenditures include a portion of costs associated with general University activities (facilities and administrative costs) which are allocated to awards under negotiated formulas commonly referred to as indirect cost rates.
10
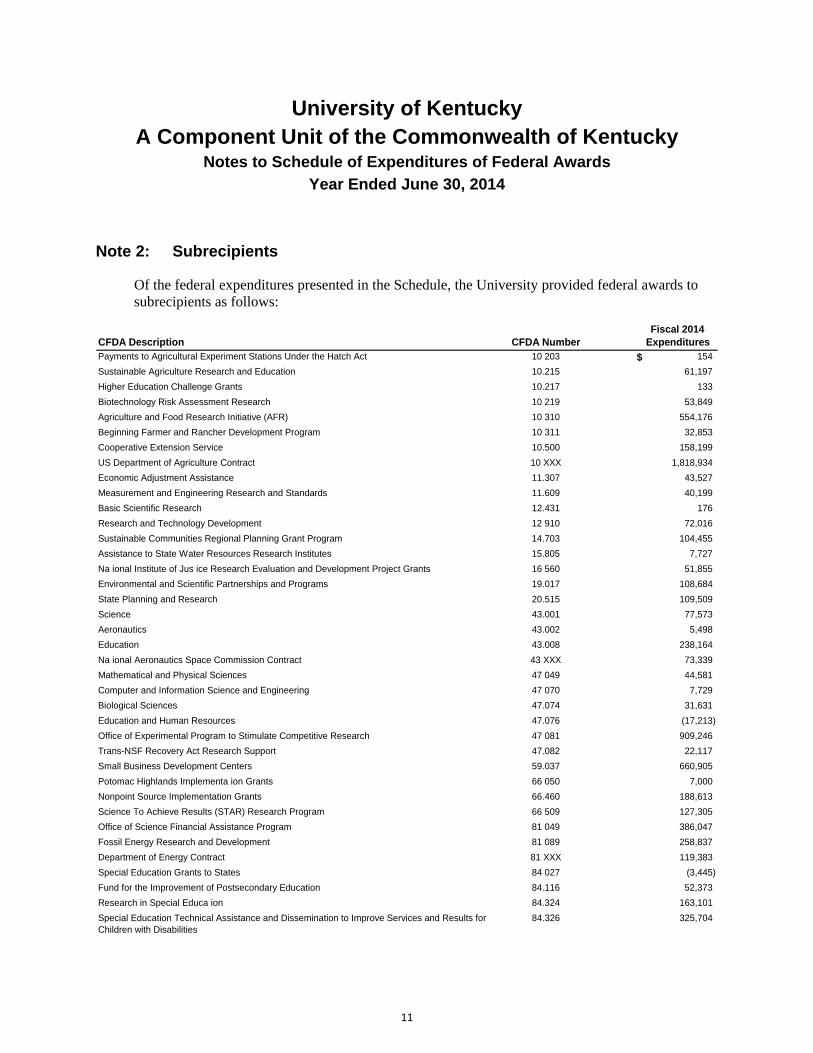
University of Kentucky A Component Unit of the Commonwealth of Kentucky
Notes to Schedule of Expenditures of Federal Awards Year Ended June 30, 2014
Note 2: Subrecipients
Of the federal expenditures presented in the Schedule, the University provided federal awards to subrecipients as follows:
Fiscal 2014 CFDA Description CFDA Number Expenditures Payments to Agricultural Experiment Stations Under the Hatch Act 10 203 $ 154
Sustainable Agriculture Research and Education 10.215 61,197
Higher Education Challenge Grants 10.217 133
Biotechnology Risk Assessment Research 10 219 53,849
Agriculture and Food Research Initiative (AFR) 10 310 554,176
Beginning Farmer and Rancher Development Program 10 311 32,853
Cooperative Extension Service 10.500 158,199
US Department of Agriculture Contract 10 XXX 1,818,934
Economic Adjustment Assistance 11.307 43,527
Measurement and Engineering Research and Standards 11.609 40,199
Basic Scientific Research 12.431 176
Research and Technology Development 12 910 72,016
Sustainable Communities Regional Planning Grant Program 14.703 104,455
Assistance to State Water Resources Research Institutes 15.805 7,727
Na ional Institute of Jus ice Research Evaluation and Development Project Grants 16 560 51,855
Environmental and Scientific Partnerships and Programs 19.017 108,684
State Planning and Research 20.515 109,509
Science 43.001 77,573
Aeronautics 43.002 5,498
Education 43.008 238,164
Na ional Aeronautics Space Commission Contract 43 XXX 73,339
Mathematical and Physical Sciences 47 049 44,581
Computer and Information Science and Engineering 47 070 7,729
Biological Sciences 47.074 31,631
Education and Human Resources 47.076 (17,213)
Office of Experimental Program to Stimulate Competitive Research 47 081 909,246
Trans-NSF Recovery Act Research Support 47.082 22,117
Small Business Development Centers 59.037 660,905
Potomac Highlands Implementa ion Grants 66 050 7,000
Nonpoint Source Implementation Grants 66.460 188,613
Science To Achieve Results (STAR) Research Program 66 509 127,305
Office of Science Financial Assistance Program 81 049 386,047
Fossil Energy Research and Development 81 089 258,837
Department of Energy Contract 81 XXX 119,383
Special Education Grants to States 84 027 (3,445)
Fund for the Improvement of Postsecondary Education 84.116 52,373
Research in Special Educa ion 84.324 163,101
Special Education Technical Assistance and Dissemination to Improve Services and Results for 84.326 325,704 Children with Disabilities
11
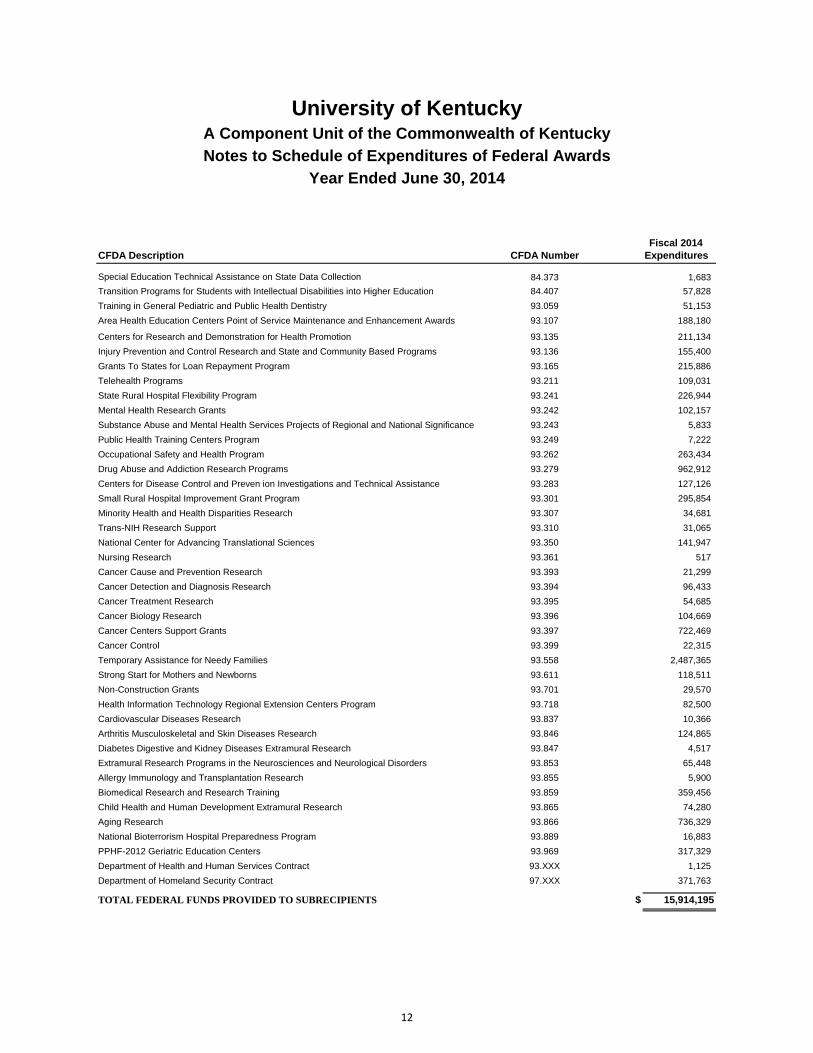
University of Kentucky A Component Unit of the Commonwealth of Kentucky Notes to Schedule of Expenditures of Federal Awards
Year Ended June 30, 2014
Special Education Technical Assistance on State Data Collection 84.373 1,683
Transition Programs for Students with Intellectual Disabilities into Higher Education 84.407 57,828
Training in General Pediatric and Public Health Dentistry 93.059 51,153
Area Health Education Centers Point of Service Maintenance and Enhancement Awards 93.107 188,180
Centers for Research and Demonstration for Health Promotion 93.135 211,134
Injury Prevention and Control Research and State and Community Based Programs 93.136 155,400
Grants To States for Loan Repayment Program 93.165 215,886
Telehealth Programs 93.211 109,031
State Rural Hospital Flexibility Program 93.241 226,944
Mental Health Research Grants 93.242 102,157
Substance Abuse and Mental Health Services Projects of Regional and National Significance 93.243 5,833
Public Health Training Centers Program 93.249 7,222
Occupational Safety and Health Program 93.262 263,434
Drug Abuse and Addiction Research Programs 93.279 962,912
Centers for Disease Control and Preven ion Investigations and Technical Assistance 93.283 127,126
Small Rural Hospital Improvement Grant Program 93.301 295,854
Minority Health and Health Disparities Research 93.307 34,681
Trans-NIH Research Support 93.310 31,065
National Center for Advancing Translational Sciences 93.350 141,947
Nursing Research 93.361 517
Cancer Cause and Prevention Research 93.393 21,299
Cancer Detection and Diagnosis Research 93.394 96,433
Cancer Treatment Research 93.395 54,685
Cancer Biology Research 93.396 104,669
Cancer Centers Support Grants 93.397 722,469
Cancer Control 93.399 22,315
Temporary Assistance for Needy Families 93.558 2,487,365
Strong Start for Mothers and Newborns 93.611 118,511
Non-Construction Grants 93.701 29,570
Health Information Technology Regional Extension Centers Program 93.718 82,500
Cardiovascular Diseases Research 93.837 10,366
Arthritis Musculoskeletal and Skin Diseases Research 93.846 124,865
Diabetes Digestive and Kidney Diseases Extramural Research 93.847 4,517
Extramural Research Programs in the Neurosciences and Neurological Disorders 93.853 65,448
Allergy Immunology and Transplantation Research 93.855 5,900
Biomedical Research and Research Training 93.859 359,456
Child Health and Human Development Extramural Research 93.865 74,280
Aging Research 93.866 736,329
National Bioterrorism Hospital Preparedness Program 93.889 16,883
PPHF-2012 Geriatric Education Centers 93.969 317,329
Department of Health and Human Services Contract 93.XXX 1,125
Department of Homeland Security Contract 97.XXX 371,763
TOTAL FEDERAL FUNDS PROVIDED TO SUBRECIPIENTS $ 15,914,195
12
Fiscal 2014 CFDA Description CFDA Number Expenditures

University of Kentucky A Component Unit of the Commonwealth of Kentucky Notes to Schedule of Expenditures of Federal Awards
Year Ended June 30, 2014
Note 3: Noncash Financial Assistance
The following loans received by students and outstanding loan balances are included in the Schedule in accordance with OMB Circular A-133, Audits of States, Local Government, and Non-Profit Organizations.
Loans received by students for the year ended June 30, 2014, were as follows:
CFDA # Total
Federal Perkins Loan Program 84.038 $ 4,685,218 Nurse Faculty Loan Program 93.264 31,809 Health Professions Primary Care 93.342 418,500
Total noncash financial assistance $ 5,135,527
Outstanding loan balances at June 30, 2014, were as follows:
CFDA # Total
Federal Perkins Loan Program 84.038 $ 20,345,726 Nurse Faculty Loan Program 93.264 115,455 Health Professions Primary Care 93.342 4,856,958
Total student loans outstanding $ 25,318,139
13

Independent Auditor's Report on Internal Control Over Financial Reporting and on Compliance and Other Matters Based on an
Audit of the Financial Statements Performed in Accordance With Government Auditing Standards
Board of Trustees University of Kentucky Lexington, Kentucky
We have audited, in accordance with auditing standards generally accepted in the United States of America and the standards applicable to financial audits contained in Government Auditing Standards, issued by the Comptroller General of the United States, the basic financial statements of the University of Kentucky (University), a component unit of the Commonwealth of Kentucky, which comprise the statement of financial position as of June 30, 2014, and the related statements of revenues, expenses and changes in net position and cash flows for the year then ended and the related notes to the basic financial statements, and have issued our report thereon dated October 3, 2014, which contained a reference to the report of other auditors and an emphasis of a matter paragraph regarding a change in an accounting principle. Other auditors audited the financial statements of Kentucky Medical Services Foundation, Inc. (KMSF), as described in our report on the University’s financial statements. The financial statements of KMSF, a component unit included in the financial statements of the University, were not audited in accordance with Governmental Auditing Standards.
Internal Control Over Financial Reporting
Management of the University is responsible for establishing and maintaining effective internal control over financial reporting (internal control). In planning and performing our audit, we considered the University’s internal control to determine the audit procedures that are appropriate in the circumstances for the purpose of expressing our opinion on the financial statements, but not for the purpose of expressing an opinion on the effectiveness of the University’s internal control. Accordingly, we do not express an opinion on the effectiveness of the University’s internal control.
A deficiency in internal control exists when the design or operation of a control does not allow management or employees, in the normal course of performing their assigned functions, to prevent or detect and correct misstatements on a timely basis. A material weakness is a deficiency, or a combination of deficiencies, in internal control such that there is a reasonable possibility that a material misstatement of the University’s financial statements will not be prevented or detected and corrected on a timely basis. A significant deficiency is a deficiency, or a combination of deficiencies, in internal control that is less severe than a material weakness, yet important enough to merit attention by those charged with governance.
14
Board of Trustees University of Kentucky Page 2
Our consideration of internal control was for the limited purpose described in the first paragraph of this section and was not designed to identify all deficiencies in internal control that might be material weaknesses. Given these limitations, during our audit we did not identify any deficiencies in internal control that we consider to be material weaknesses as defined above. However, material weaknesses may exist that have not been identified.
Compliance and Other Matters
As part of obtaining reasonable assurance about whether the University’s financial statements are free of material misstatement, we performed tests of its compliance with certain provisions of laws, regulations, contracts and grant agreements, noncompliance with which could have a direct and material effect on the determination of financial statement amounts. However, providing an opinion on compliance with those provisions was not an objective of our audit and, accordingly, we do not express such an opinion. The results of our tests disclosed no instances of noncompliance or other matters that are required to be reported under Government Auditing Standards.
Purpose of this Report
The purpose of this report is solely to describe the scope of our testing of internal control and compliance and the results of that testing and not to provide an opinion on the effectiveness of the University’s internal control or on compliance. This report is an integral part of an audit performed in accordance with Government Auditing Standards in considering the University’s internal control and compliance. Accordingly, this communication is not suitable for any other purpose.
Louisville, Kentucky October 3, 2014
15
Report on Compliance for Each Major Federal Program, Report on Internal Control Over Compliance and
Report on Schedule of Expenditures of Federal Awards Required by OMB Circular A-133
Independent Auditor’s Report
Board of Directors University of Kentucky Lexington, Kentucky
Report on Compliance for Each Major Federal Program
We have audited the compliance of the University of Kentucky (University) with the types of compliance requirements described in the OMB Circular A-133, Compliance Supplement that could have a direct and material effect on each of its major federal programs for the year ended June 30, 2014. The University’s major federal programs are identified in the summary of auditor’s results section of the accompanying schedule of findings and questioned costs.
Management’s Responsibility
Management is responsible for compliance with the requirements of laws, regulations, contracts and grants applicable to its federal programs.
Auditor’s Responsibility
Our responsibility is to express an opinion on compliance for each of the University’s major federal programs based on our audit of the types of compliance requirements referred to above.
We conducted our audit of compliance in accordance with auditing standards generally accepted in the United States of America, the standards applicable to financial audits contained in Government Auditing Standards, issued by the Comptroller General of the United States and OMB Circular A-133, Audits of States, Local Governments, and Non-Profit Organizations. Those standards and OMB Circular A-133 require that we plan and perform the audit to obtain reasonable assurance about whether noncompliance with the types of compliance requirements referred to above that could have a direct and material effect on a major federal program occurred. An audit includes examining, on a test basis, evidence about the University’s compliance with those requirements and performing such other procedures as we considered necessary in the circumstances.
We believe that our audit provides a reasonable basis for our opinion on compliance for each major federal program. However, our audit does not provide a legal determination of the University’s compliance.
16

Board of Directors University of Kentucky Page 2
Basis for Qualified Opinion on Student Financial Aid Cluster
As described in item 2014-001 in the accompanying schedule of findings and questioned costs, the University did not comply with requirements regarding verification for its Student Financial Aid Cluster program. Compliance with such requirements is necessary, in our opinion, for the University to comply with requirements applicable to that program.
Qualified Opinion on Student Financial Aid Cluster
In our opinion, except for the noncompliance described in the Basis for Qualified Opinion on Student Financial Aid Cluster paragraph, the University complied, in all material respects, with the types of compliance requirements referred to above that could have a direct and material effect on the Student Financial Aid cluster for the year ended June 30, 2014.
Unmodified Opinion on Each of the Other Major Federal Programs
In our opinion, the University complied, in all material respects, with the types of compliance requirements referred to above that could have a direct and material effect on each of its other major federal programs identified in the summary of auditor’s results section of the accompanying schedule of findings and questioned costs for the year ended June 30, 2014.
Other Matter
The University’s response to the finding identified in our audit is described in the accompanying schedule of findings and questioned costs. The University’s response was not subjected to the auditing procedures applied in the audit of compliance and, accordingly, we express no opinion on the response.
Report on Internal Control Over Compliance
Management of the University is responsible for establishing and maintaining effective internal control over compliance with the types of compliance requirements referred to above. In planning and performing our audit of compliance, we considered the University’s internal control over compliance with the types of requirements that could have a direct and material effect on each major federal program to determine the auditing procedures that are appropriate in the circumstances for the purpose of expressing our opinion on compliance for each major federal program and to test and report on internal control over compliance in accordance with OMB Circular A-133, but not for the purpose of expressing an opinion on the effectiveness of internal control over compliance. Accordingly, we do not express an opinion on the effectiveness of the University’s internal control over compliance.
A deficiency in internal control over compliance exists when the design or operation of a control over compliance does not allow management or employees, in the normal course of performing their assigned functions, to prevent, or detect and correct, noncompliance with a type of compliance requirement of a federal program on a timely basis. A material weakness in internal control over compliance is a deficiency, or combination of deficiencies, in internal control over compliance such
17

Board of Directors University of Kentucky Page 3
that there is a reasonable possibility that material noncompliance with a type of compliance requirement of a federal program will not be prevented, or detected and corrected, on a timely basis. A significant deficiency in internal control over compliance is a deficiency, or a combination of deficiencies, in internal control over compliance with a type of compliance requirement of a federal program that is less severe than a material weakness in internal control over compliance, yet important enough to merit attention by those charged with governance.
Our consideration of internal control over compliance was for the limited purpose described in the first paragraph of this section and was not designed to identify all deficiencies in internal control over compliance that might be material weaknesses and therefore, material weaknesses may exist that were not identified. We consider the deficiency in internal control over compliance described in the accompanying schedule of findings and questioned costs as item 2014-001 to be a material weakness.
The University’s response to the finding identified in our audit is described in the accompanying schedule of findings and questioned costs. The University’s response was not subjected to the auditing procedures applied in the audit of compliance and, accordingly, we express no opinion on the response.
The purpose of this report on internal control over compliance is solely to describe the scope of our testing of internal control over compliance and the results of that testing based on the requirements of OMB Circular A-133. Accordingly, this report is not suitable for any other purpose.
Report on Schedule of Expenditures of Federal Awards Required by OMB Circular A-133
We have audited the financial statements of the University as of and for the year ended June 30, 2014, and the related notes to the financial statements, which collectively comprise the University's basic financial statements. We issued our report thereon dated October 3, 2014, which contained an unmodified opinion on those financial statements, a reference to the report of other auditors, and an emphasis of a matter paragraph regarding a change in an accounting principle. Our audit was performed for the purpose of forming an opinion on the financial statements that collectively comprise the basic financial statements. The accompanying schedule of expenditures of federal awards is presented for purposes of additional analysis as required by OMB Circular A-133 and is not a required part of the basic financial statements. Such information is the responsibility of management and was derived from and relates directly to the underlying accounting and other records used to prepare the basic financial statements. The information has been subjected to the auditing procedures applied in the audit of the basic financial statements and certain additional procedures, including comparing and reconciling such information directly to the underlying accounting and other records used to prepare the basic financial statements or to the basic financial statements themselves, and other additional procedures in accordance with auditing standards generally accepted in the United States of America. In our opinion, the schedule of expenditures of federal awards is fairly stated in all material respects in relation to the basic financial statements as a whole.
Louisville, Kentucky October 3, 2014
18

University of Kentucky A Component Unit of the Commonwealth of Kentucky
Schedule of Findings and Questioned Costs Year Ended June 30, 2014
Summary of Auditor’s Results
1. The opinion expressed in the independent auditor’s report was:
Unmodified Qualified Adverse Disclaimer
2. The independent auditor’s report on internal control over financial reporting disclosed:
Significant deficiency(ies)? Yes None reported
Material weakness(es)? Yes No
3. Noncompliance considered material to the financial statements was disclosed by the audit? Yes No
4. The independent auditor’s report on internal control over compliance for major federal awards programs disclosed:
Significant deficiency(ies)? Yes None reported
Material weakness(es)? Yes No
5. The opinions expressed in the independent auditor’s report on compliance for major federal awards were:
Unmodified Qualified Adverse Disclaimer
SNAP Cluster – Unmodified
Research and Development Cluster – Unmodified
Student Financial Aid Cluster – Qualified
6. The audit disclosed findings required to be reported by OMB Circular A-133? Yes No
19
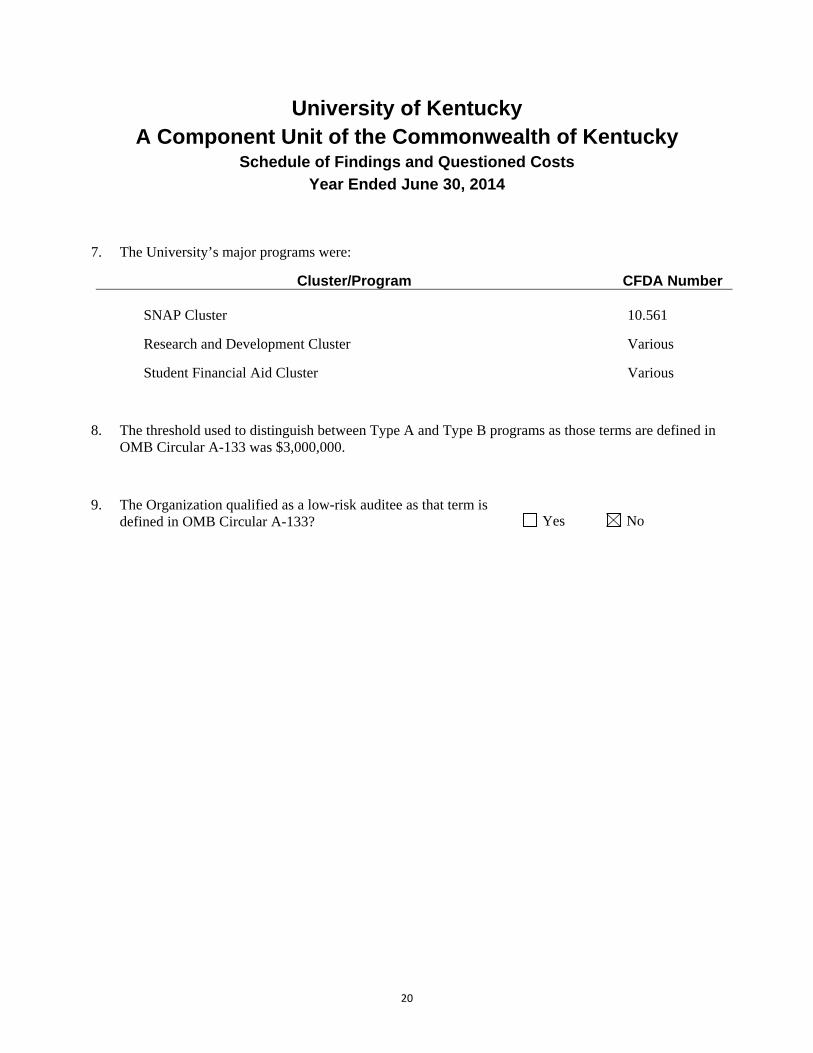
University of Kentucky A Component Unit of the Commonwealth of Kentucky
Schedule of Findings and Questioned Costs Year Ended June 30, 2014
7. The University’s major programs were:
Cluster/Program CFDA Number
SNAP Cluster 10.561
Research and Development Cluster Various
Student Financial Aid Cluster Various
8. The threshold used to distinguish between Type A and Type B programs as those terms are defined in OMB Circular A-133 was $3,000,000.
9. The Organization qualified as a low-risk auditee as that term is defined in OMB Circular A-133? Yes No
20

University of Kentucky A Component Unit of the Commonwealth of Kentucky
Schedule of Findings and Questioned Costs Year Ended June 30, 2014
Findings Required to be Reported by Government Auditing Standards
Reference Questioned Number Finding Costs
No matters are reportable.
21

University of Kentucky A Component Unit of the Commonwealth of Kentucky
Schedule of Findings and Questioned Costs Year Ended June 30, 2014
Findings Required to be Reported by OMB Circular A-133
Reference Questioned Number Finding Costs
2014-001 Federal Program – Student Financial Aid Cluster, U.S. $ 2,583 Department of Education, Program Year 2014
Criteria or Specific Requirement: Special tests and provisions – Verification
Condition: Federal regulations provide that the University is responsible for verifying certain information on the student’s application for financial aid. The University did not update certain students’ award information for exceptions noted during the verification program.
Context: Out of a population of 4,045 students selected by the Central Processing System for verification, a sample of 25 students was selected for testing. For three students tested, the University did not properly complete verification and update the students’ applications. For two of these students, the student’s Expected Family Contribution changed based on these updates.
Effect: An incorrect amount of Pell Grants and direct loans were awarded to one student.
Cause: The Financial Aid Office did not obtain appropriate information to verify the information on the students’ applications in some instances and did not update the amounts awarded based on the information received.
Recommendation: The University should ensure all information obtained during the verification process is appropriate and sufficient and is used to update the student applications/financial aid awards. This could include adding a secondary review of the verification changes worksheet and information technology system.
Views of Responsible Officials and Planned Corrective Action Plan: Management is in agreement that at the time of the audit testing, the verification records for three students were not completed properly. The University contracted with our state
22
University of Kentucky A Component Unit of the Commonwealth of Kentucky
Schedule of Findings and Questioned Costs Year Ended June 30, 2014
Reference Questioned Number Finding Costs
agency, Kentucky Higher Education Assistance Authority (KHEAA), for verification services beginning June 2013. As part of its verification process, KHEAA completes an initial and second verification review of all verified files. The mistakes which resulted in this finding were made by the staff at KHEAA during the early phase of implementing the University’s contract.
In December of 2013, KHEAA implemented a new quality control program which should eliminate the likelihood of these types of errors in the future. As part of the quality control program KHEAA will be continuously monitoring the flow of the verification process and will be regularly reviewing the document processing on behalf of the University of Kentucky. Additionally, KHEAA will conduct a monthly evaluation and verification review of 10 percent of all the accounts with verification completed by the agency, testing to ensure accurate handling of the verification process and outcomes. They will be conducting selected reviews of individual employees as part of this process based on their level of training and/or the results of prior reviews. In addition to these reviews, KHEAA will also be testing 5 percent of all the documents imaged, 5 percent of all electronic correspondences (emails) and 5 percent of all telephone communications to ensure accuracy of their handling and disposition.
The University is currently receiving a report denoting the outcomes of these reviews each month, which is promptly reviewed and discussed with KHEAA’s management. In addition to these aggressive steps implemented by KHEAA to ensure UK’s Title IV compliance, the UK Student Financial Aid office will implement an in-house review process beginning in the 2014-2015 aid year. Each fall semester, UK staff will review 100 randomly selected KHEAA verified records during the month of October to ensure accuracy. If the review results in an error finding, then we will request that KHEAA take action to resolve the finding during the current semester.
UK is confident that the actions already taken by KHEAA and University Staff will help to ensure accurate verification in future years.
23

University of Kentucky A Component Unit of the Commonwealth of Kentucky
Summary Schedule of Prior Audit Findings Year Ended June 30, 2014
Reference Number Summary of Finding Status
No matters are reportable.
24