2015-16 executive budget
TRANSCRIPT

Commonwealth of Pennsylvania
2015-16 Executive Budget
Randy AlbrightSecretary of the Budget
March 3, 2015
This budget rebuilds the middle class by investing in education to prepare students and workers for good‐paying, 21st‐century jobs, ensures government uses taxpayer dollars effectively and efficiently, cuts corporate taxes and improves our business climate, significantly reduces school district property taxes, and decreases the government’s overall tax burden on hard‐working, middle‐class homeowners.
Jobs that PaySchools that Teach
Government that Works
2015‐16 Budget HighlightsOverview
2
2015‐16 Budget HighlightsOverview
3
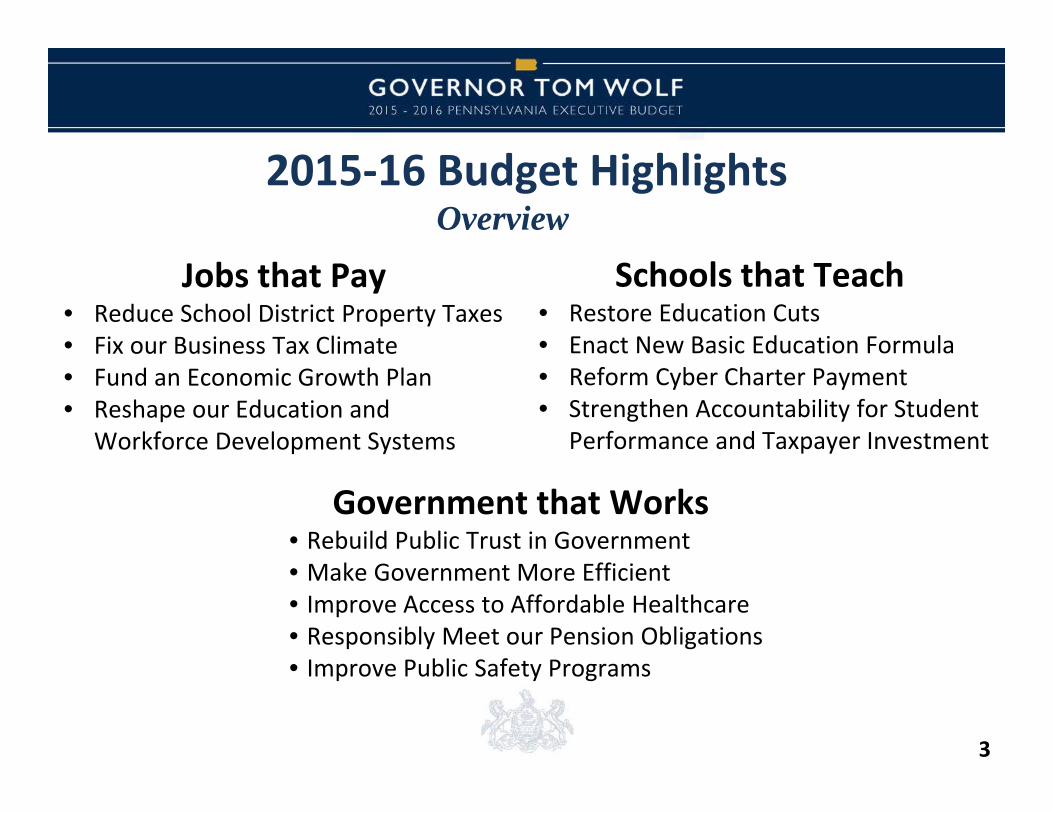
Jobs that Pay• Reduce School District Property Taxes• Fix our Business Tax Climate• Fund an Economic Growth Plan• Reshape our Education and
Workforce Development Systems
Schools that Teach• Restore Education Cuts• Enact New Basic Education Formula• Reform Cyber Charter Payment• Strengthen Accountability for Student
Performance and Taxpayer Investment
Government that Works• Rebuild Public Trust in Government• Make Government More Efficient• Improve Access to Affordable Healthcare• Responsibly Meet our Pension Obligations• Improve Public Safety Programs

4
Our Challenge• Pennsylvania Faces Three Deficits
– Permanently Fix a Structural Budget Deficit: Take steps to improve our long‐term fiscal health and restore our bond rating
– Repair an Education Deficit: Restore education cuts, establish predictable education funding, and refocus workforce systems
– Eliminate a Jobs Deficit: Fix our business tax climate and reinvest in economic development programs that leverage private dollars and create quality jobs
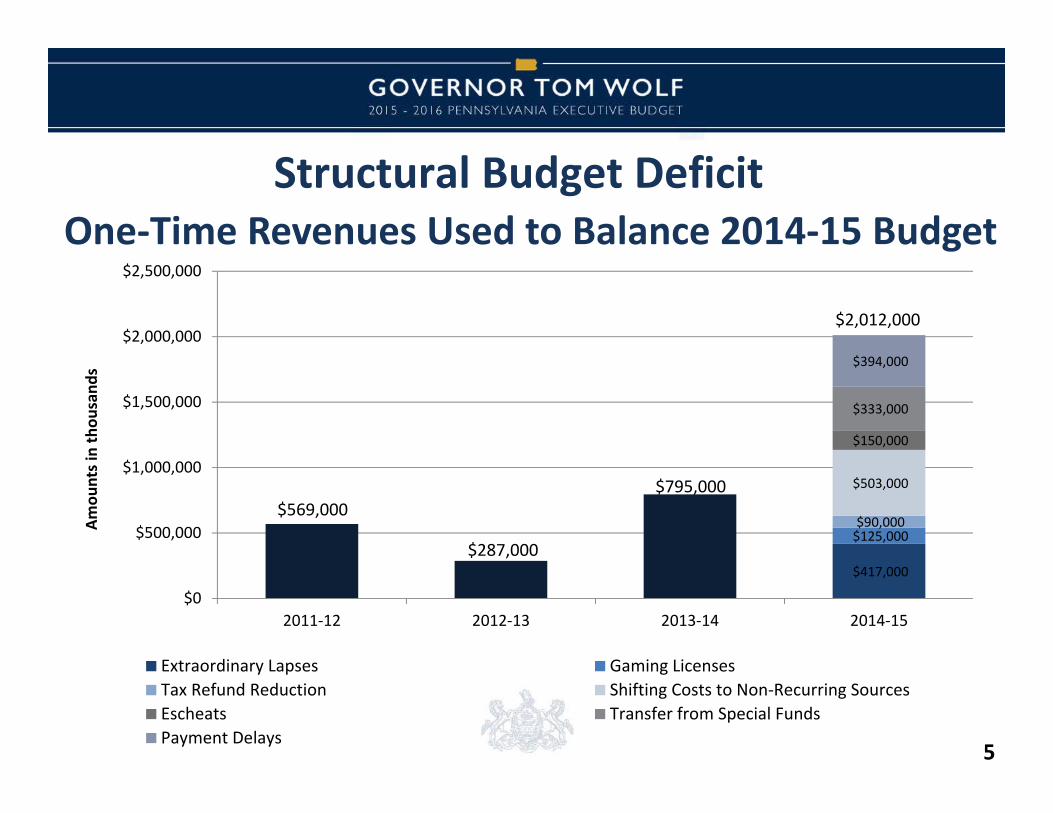
$569,000
$287,000
$795,000
$417,000
$125,000 $90,000
$503,000
$150,000
$333,000
$394,000
$0
$500,000
$1,000,000
$1,500,000
$2,000,000
$2,500,000
2011‐12 2012‐13 2013‐14 2014‐15
Extraordinary Lapses Gaming LicensesTax Refund Reduction Shifting Costs to Non‐Recurring SourcesEscheats Transfer from Special FundsPayment Delays
$2,012,000
One‐Time Revenues Used to Balance 2014‐15 Budget
Amou
nts in th
ousand
s
Structural Budget Deficit
5

Structural Budget Deficit
6
• Mandated spending growth of more than $1.6 billion– $900 million in Department of Human Services
– $200 million in Department of Corrections
– $500 million in Pension Costs
• Expiration of public employee contracts in June 2015
• Addressing other long‐term obligations, such as post‐employment benefits

7
Education Deficit• More than 23,000 education jobs lost through 2012• 93% of Pennsylvania school districts reported staff
reductions in the last five years• 91% of districts raised property taxes• Steady improvements in student test scores reversed
$0
$1,000
$2,000
$3,000
$4,000
$5,000
$6,000
$7,000
Education Classroom Funding(in millions)
67%68%
70%71% 72%
74%72%
70% 70%
60%62%64%66%68%70%72%74%76%78%
PSSA Results:Advanced/Proficient Reading
68%69%
72%
73%
76%77%
76%
73%72%
62%64%66%68%70%72%74%76%78%
PSSA Results:Advanced/Proficient Math
Source: Pennsylvania Department of Education

8
Jobs Deficit• Pennsylvania went from one of the top 10 states in job growth in
2010 to 50th in December 2014• Had state job growth matched the national monthly average over
the past four years, Pennsylvania would have an additional 225,000 jobs

9
2014‐15 General Fund Financial Statement(Dollars in Millions)
2013‐14 2014‐15Actual Update
Beginning Balance . . . . . . . . . . . . . . . . . . . . . . . 541$ 81$ Beginning Balance Adjustment. . . . . . . . . . . . . 6 ‐ Revenue Estimate (adj. for Phila. Cig. Tax) . . . 28,607 30,177 Refunds . . . . . . . . . . . . . . . . . . . . . . . . . . . . . . (1,105) (1,287) Total Revenue . . . . . . . . . . . . . . . . . . . . . . . . . 27,502 28,890
Prior‐Year Lapses . . . . . . . . . . . . . . . . . . . . . . . 427 89 Funds Available. . . . . . . . . . . . . . . . . . . . . . . . 28,476 29,060
Enacted Expenditures . . . . . . . . . . . . . . . . . . . (28,424) (29,027) Supplemental Appropriations . . . . . . . . . . . . . (173) (81) Current‐Year Lapses . . . . . . . . . . . . . . . . . . . . . 202 60 Total Expenditures . . . . . . . . . . . . . . . . . . . . (28,395) (29,048)
Preliminary Balance . . . . . . . . . . . . . . . . . . . . 81 12 Transfer to the Rainy Day Fund . . . . . . . . . . . . ‐ (3)
Ending Balance . . . . . . . . . . . . . . . . . . . . . . . . . . 81$ 9$

10
The total 2015‐16 operating budget, including all commonwealth funds, is $78.6 billion. The General Fund represents 38 percent of this amount.
General Fund, 38.0%
Federal Funds, 35.5%
Augmentations and Fees, 4.1%
Motor License Fund, 3.5%
Lottery Fund, 2.4%All Other Funds,
16.5%
2015‐16 Total Operating Budget – $78.6 Billion

11
Amounts in Thousands
Pre‐K‐12 Education . . . . . $ 9,763,859
Medical Assistance / Long‐Term Living . . . . . . 6,927,343
Other Human Services . . . 4,980,552
Higher Education . . . . . . . 1,765,861
Corrections/Probation and Parole . . . . . . . . . . . . . . . . 2,435,976
Debt Service . . . . . . . . . . . 1,275,007
All Other . . . . . . . . . . . . . . 2,735,753
Total General Fund Expenditures . . . . . . . . . $ 29,884,351
2015‐16 State General Fund Budget – $29.88 Billion
Pre‐K‐12 Education, 32.6%
Medical Assistance /
Long‐Term Living, 23.2%
Other Human Services, 16.6%
Higher Education,
5.9%
Corrections/Probation and Parole, 8.2%
Debt Service, 4.3%
All Other, 9.2%

• Provide $3.8 billion in School District Property Tax relief in October 2016
• Provide more than $1,000 in tax relief for average homeowner• Reduce homeowner property taxes by an average of more than
50%• Eliminate school property taxes for 270,000 senior households
(nearly a third of senior households)• Target greater tax relief for high‐tax, high‐poverty communities• Enhance Renter Rebate eligibility to households earning up to
$50,000 a year12
Jobs that Pay: Reduce School District Property Taxes

Tax Changes• Reduce the CNI rate from 9.99% to
5.99% effective January 1, 2016• Implement Mandatory Combined
Reporting effective January 1, 2016• Closing the Delaware loophole
provides further opportunity to support a phased in CNI reduction to 4.99% effective January 1, 2018
• Phase out Capital Stock and Franchise Tax on January 1, 2016
Tax Credits• Eliminate Underperforming
Existing Credits• Institute New
Manufacturing Tax Credit: $5 million
Making Work Pay• Increase the minimum
wage to $10.10
13
Jobs that Pay: Fix the Business Tax Climate

Invest Marcellus Shale Resources to Create Jobs:• Bond Issuance: $675 million
• Recapitalize DCED Loan Programs (PIDA): $100 million• Business in Our Sites: $250 million• Energy Portfolio: $225 million
– Alternative Energy: $100 million– Last Mile: $25 million– Solar Investment: $50 million– Energy Efficiency: $50 million
• Technology Investment: $100 million– New Technology Initiatives: $50 million– IRC Manufacturing: $50 million
• Debt Service paid from Marcellus Shale Severance Tax: $55 million annually
14
Jobs that Pay: Bond Funding an Economic Growth Plan

Transportation: $500 million per Act 89• $145 million in 2014‐15• $195 million in 2015‐16• $160 million in 2016‐17
PennVest Securitization: $500 million
15
Jobs that Pay: $1 Billion Infrastructure Investment Initiative

Industrial Resource Center (IRC) Manufacturing Initiative: $12 million• IRCs: $7 million• University Manufacturing Consortium: $5 million• The Manufacturing Initiative supports a consortium of
Pennsylvania research universities to advance manufacturing technology and commercialization
16
Jobs that Pay: Funding an Economic Growth Plan

• Career and Technical Education:– Career Technology Center (CTC) Initiative: $15 million– Career Counselors: $8 million– Equipment Grants: $5 million
• Community Colleges: $15 million• Industry Partnerships: $10 million• WEDnetPA: $8 million (part of $25 million PA First)• Vocational Rehabilitation Fund: $5 million
17
Jobs that Pay: PA Rising ─ Higher Education and Workforce Development

• Fully restore higher education cuts over two years• $140 million first‐year increase restores more than 50% of
funding– State‐Related Universities: $80 million– PASSHE: $45 million
• New PHEAA‐Funded Initiatives: $25 million– Enhance STEM Scholarship Initiatives: $7.5 million– Health Practitioners for Underserved Communities: $8.5 million– Dual Enrollment Grant Program: $9 million
• Institutional Assistance Grants: $5 million• Ready to Succeed Scholarships: $10 million 18
Jobs that Pay: PA Rising ─ Higher Education and Workforce Development
$0
$200
$400
$600
$800
$1,000
$1,200
$1,400
2015‐16 2016‐17 2017‐18 2018‐19 2019‐20
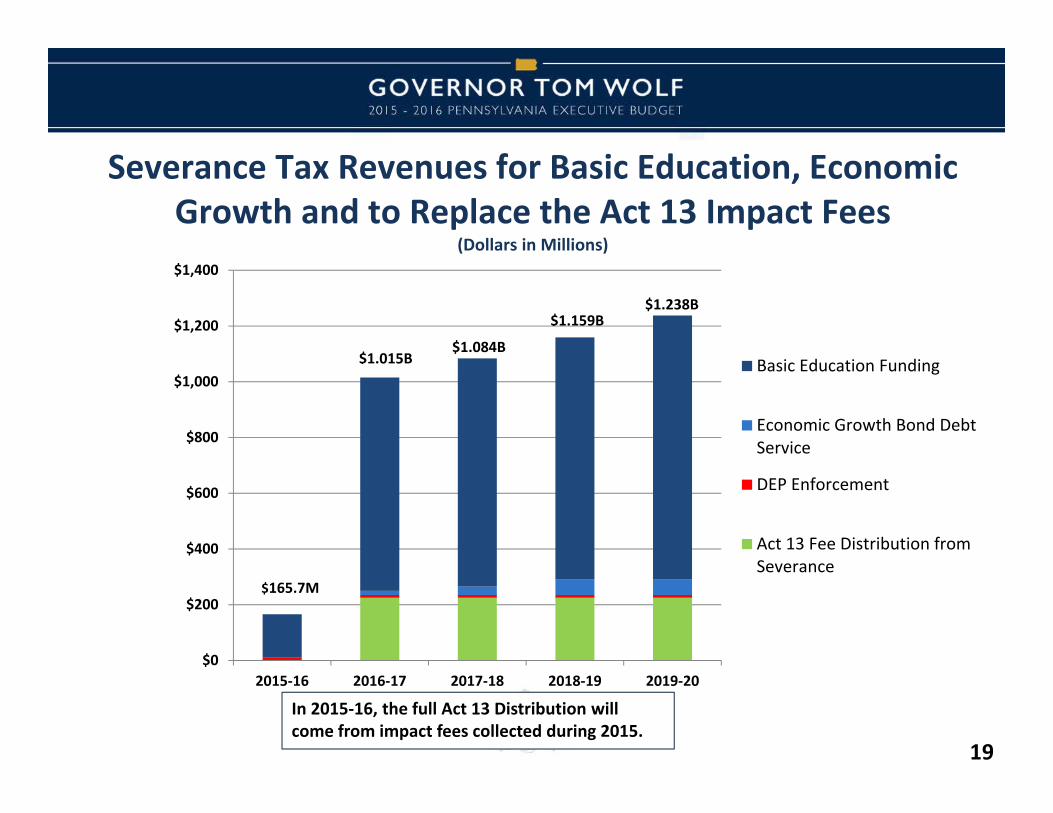
Basic Education Funding
Economic Growth Bond DebtService
DEP Enforcement
Act 13 Fee Distribution fromSeverance
$165.7M
$1.015B$1.084B
$1.159B$1.238B
Severance Tax Revenues for Basic Education, Economic Growth and to Replace the Act 13 Impact Fees
(Dollars in Millions)
In 2015‐16, the full Act 13 Distribution will come from impact fees collected during 2015.
19

• $1 billion in new education investment including:– Basic Education Funding: $400 million – Special Education: $100 million– Cyber Charter Funding Reform: $160 million
• $2 billion increase over four years for basic education, special education, and early learning initiatives
• Property tax relief and new education investment increases state share of education funding above 50% threshold
20
Schools that Teach

• Pre‐K Counts New Investment: $100 million• Head Start Supplemental Assistance: $20 million• Increase number of children served by 75%
Down payment on Pennsylvania’s plan for universal high‐quality pre‐K education for 3‐ and
4‐year‐olds.
21
Schools that Teach: Early Childhood Education

• Renew focus on strong and fair accountability for students, educators, and schools
• Ensure public’s return on investment and maximize the impact of new funding to increase student achievement
• Require investment in evidence‐based programs and demonstrate impact with quantifiable performance goals
22
Schools that Teach: Accountability

Governor’s Office of Transformation, Innovation, Management and Efficiency (GO TIME)• 2015‐16 savings of more than $150 million:‒ Improve procurement strategies: $100 million‒ Consolidate administrative functions: $6 million‒ Modernize technology used to manage public works
projects: $3 million
23
Government that Works: Transparency and Accountability

• Reduce PSERS unfunded liability by more than $10 billion• Reform SERS and PSERS investment strategies to reduce costs of
fund management fees paid to Wall Street firms• Refinance $3 billion in existing PSERS pension debt
– Enhance operations of Wine and Spirits stores to maximize state profit– Transfer $185 million annually in 2017‐18 and thereafter to pay bond
debt service
• Create restricted account to guarantee future employer payments• Total Five‐Year Savings: nearly $1.3 billion
– School District Savings: $370 million– State Savings: more than $900 million 24
Government that Works: Responsibly Meet Pension Obligations

• Medicaid Expansion: More than $500 million in savings• Initiatives to further reduce Department of Human Services spending – $130 million maximizing revenue opportunities– $31 million in additional pharmacy rebates– $38.3 million initiative for home and community‐based services
• Implement Medicaid managed long term care plan– Phase 1 Initiative– Full implementation in three years
• Children’s Health Insurance Program (CHIP): expand coverage to 15,881 children
25
Government that Works: Human Services

• Reduce Waiting Lists for Individuals with Disabilities, including Autism: $45.9 million
• Domestic Violence Services: $1.5 million• Rape Crisis: $876,000• Treatment to Combat Increase in Heroin Use:‒ Behavioral Health Services: $2.5 million‒ Assistance to Drug and Alcohol Programs: $5 million
26
Government that Works: Human Services

Improve Treatment and Caseload Management:• Provide continuity of care following release
Improve Public Safety:• Provide seamless supervision and better control
Reduce Costs:• Eliminate duplicate executive and administrative functions• Eliminate multiple offices within communities• Single point of financial responsibility
Improve Accountability:• Provide unified leadership and supervision
27
The Board of Probation and Parole and the Sexual Offenders Assessment Board will maintain independent parole and assessment responsibility.
Government that Works: Consolidation of the Department of Corrections and the Pennsylvania Board of Probation and Parole

• Increased Services for Veterans‒ Homeless Assistance: $1 million‒ Veterans’ Children Education Program: $500,000‒ Dedicating Capital Redevelopment Assistance Grants for
Veterans’ Housing: $25 million
• Four State Police Cadet Classes: $9 million
28
Government that Works: Other Program Enhancements

• Institute revenue‐neutral 1.25% Bank Shares Tax retroactive to fiscal year 2013‐14
• Increase PIT to 3.7% effective July 1, 2015– Increase eligibility for poverty exemption to 150% of poverty line for family of four
• Expand base and increase Sales Tax to 6.6% effective January 1, 2016, but exempt food, clothing, and prescription drugs
• Increase Cigarette Tax by $1.00 per pack effective October 1, 2015• Impose tax on all other tobacco products including e‐cigarettes
effective October 1, 2015
29
Revenue Package

30
2015‐16 General Fund Financial Statement(Dollars in Millions)
2013‐14 2014‐15 2015‐16 2016‐17Actual Update Budget Preliminary
Beginning Balance . . . . . . . . . . . . . . . . . . . . . . . 541$ 81$ 9$ 97$ Beginning Balance Adjustment. . . . . . . . . . 6 ‐ ‐ ‐ Revenue Estimate (adj. for Phila. Cig. Tax) 28,607 30,177 30,625 31,820 Proposed Revenue Changes . . . . . . . . . . . . ‐ ‐ 4,662 8,053 Transfer to PSERS Restricted Account. . . . . ‐ ‐ (1,750) (2,247) Transfers for Property Tax and Rent Relief ‐ ‐ (2,140) (4,596) Severance Tax Transfers. . . . . . . . . . . . . . . . ‐ ‐ (10) (250) Refunds . . . . . . . . . . . . . . . . . . . . . . . . . . . . . . (1,105) (1,287) (1,383) (1,512) Total Revenue . . . . . . . . . . . . . . . . . . . . . . . . 27,502 28,890 30,004 31,268
Prior‐Year Lapses . . . . . . . . . . . . . . . . . . . . . . 427 89 ‐ ‐ Funds Available. . . . . . . . . . . . . . . . . . . . . . . 28,476 29,060 30,013 31,365
Enacted Expenditures . . . . . . . . . . . . . . . . . . (28,424) (29,027) (29,884) (31,305) Supplemental Appropriations . . . . . . . . . . . (173) (81) ‐ ‐ Current‐Year Lapses . . . . . . . . . . . . . . . . . . . 202 60 ‐ ‐ Total Expenditures . . . . . . . . . . . . . . . . . . . . (28,395) (29,048) (29,884) (31,305)
Preliminary Balance . . . . . . . . . . . . . . . . . . . 81 12 129 60 Transfer to the Rainy Day Fund . . . . . . . . . . ‐ (3) (32) (15)
Ending Balance . . . . . . . . . . . . . . . . . . . . . . . . . . 81$ 9$ 97$ 45$

Commonwealth of Pennsylvania
2015-16 Executive Budget
Randy AlbrightSecretary of the Budget
March 3, 2015
31