2015 1q15 2q 15 earnings mancomm meeting presentation · 202 573 952 971 0 200 400 600 800 1,000...
TRANSCRIPT

1
1Q15 2Q 15 Mancomm Meeting
2015
EARNINGS
PRESENTATION

Investor Presentation Highlights
2
FINANCIAL & OPERATING
HIGHLIGHTS
GROWTH
PLANS COMPANY
OVERVIEW

Company Overview
3
Established and licensed by
the SEC in 1999
The leading and fastest-
growing online stockbroker in
the Philippines
Focused on tapping the
underserved retail investor
base in the stock market
Founder (Edward K. Lee)
retains a 20.3% stake and
actively manages the
Company

Ownership Structure
4
EDWARD K. LEE
OUTSTANDING SHARES 475.0Mil
FREE FLOAT 182.9Mil
MARKET CAP* Php7.1Bil
ALEXANDER L. YU
OTHER DIRECTORS & OFFICER
PUBLIC 14.0%
27.0%
38.5% 20.5%
*AS OF END DECEMBER 2015

Business Objective
5
To be the preferred source of financial services, a trusted
provider of guidance and investment and a strong
organization committed to delivering great value to its
customers.
Our goal is to be the
Champion of the Filipino Investor
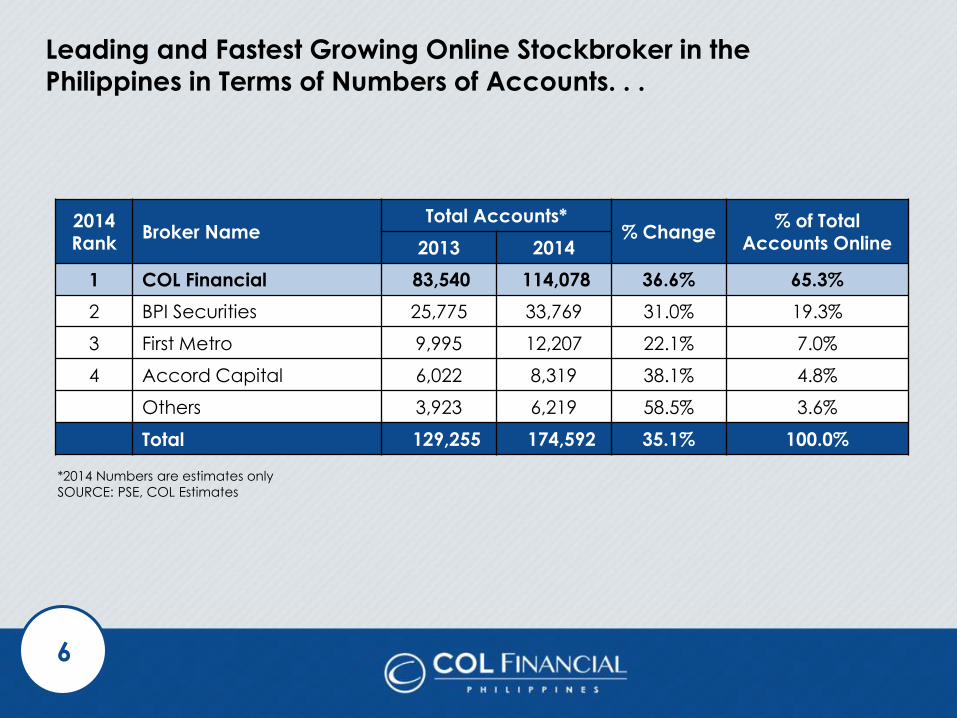
Leading and Fastest Growing Online Stockbroker in the
Philippines in Terms of Numbers of Accounts. . .
6
2014 Rank
Broker Name Total Accounts*
% Change % of Total
Accounts Online 2013 2014
1 COL Financial 83,540 114,078 36.6% 65.3%
2 BPI Securities 25,775 33,769 31.0% 19.3%
3 First Metro 9,995 12,207 22.1% 7.0%
4 Accord Capital 6,022 8,319 38.1% 4.8%
Others 3,923 6,219 58.5% 3.6%
Total 129,255 174,592 35.1% 100.0%
*2014 Numbers are estimates only
SOURCE: PSE, COL Estimates

Amongst the Biggest Philippine-Based Brokers
7
2015 Rank
Broker Name 2015 Value
Turnover (PhpBil)
% of Total
1 Deutsche Regis Partners Inc. 445.9 10.4%
2 Maybank ATR Kim Eng Securities, Inc. 428.5 10.0%
3 UBS Securities Philippines Inc. 352.3 8.2%
4 CLSA Philippines, Inc. 344.0 8.0%
5 Macquarie Capital Securities (Phil), Inc. 279.2 6.5%
6 Credit Suisse Securities (Phil), Inc. 258.7 6.0%
7 Philippine Equity Partners, Inc. 211.0 4.9%
8 COL Financial Group, Inc. 167.9 3.9%
9 Mandarin Securities Corp. 154.8 3.6%
10 J.P. Morgan Securities Philippines, Inc. 137.7 3.2%
SOURCE: PSE

8

0%
10%
20%
30%
40%
50%
60%
70%
80%
90%
100%
FY15
Bulk of Revenues Generated From Philippine Operations
9
COL’s Philippine operations account for 95.9% of revenues, while its HK
operations account for the balance. Commissions from both Philippines and HK account for 66.0% of revenues.
Interest income from margin loans and cash accounts for 31.6% of revenues.
REVENUE BREAKDOWN
2.3% OTHERS
31.6% INTEREST
4.1% HK COM
21.8% PH COM-AGENCY
& ADVISORY
40.1% PH COM-SELF
DIRECTED

Investor Presentation Highlights
10
FINANCIAL & OPERATING
HIGHLIGHTS
GROWTH
PLANS COMPANY
OVERVIEW

Key Highlights
11
• 2015 net income flat
• Strong growth in new
accounts
• Interest income from cash
placements continued to
grow
• Balance sheet remained
healthy
• Strong start for the funds
distribution business
• 2015 recurring profits fell
2.2%
• Margin lending down
• Lower market share in
terms of value turn over
POSITIVE NEGATIVE

2015 Net Income Flat, Recurring Income – 2.2%
12
2015 net income was flat at Php262.7 Mil. Recurring income fell by 2.2% to Php286.4 Mil.
Consolidated revenues increased by 1.8% Y/Y as growth in interest and other income offset weakness in commission revenues. Operating profit was up 2.4% to Php361.8
Mil. Excluding non-recurring expenses booked in 2014 and 2015, operating profits were flat at Php385.5 Mil. Income taxes increased by 9.0% to
Php99.1 Mil.
2014 2015 Change
Amount %
Income
Commissions 503.4 486.9 (16.5) -3.3%
Interest 215.4 233.2 17.8 8.3%
Other income 5.0 17.1 12.1 240.2%
Total 723.8 737.2 13.4 1.8%
Expenses
Commission expenses 85.3 83.9 (1.4) -1.6%
Personnel costs 107.0 110.8 3.8 3.6%
Professional fees 23.5 27.4 3.9 16.5%
Stock exch. dues & fees 20.7 21.1 0.4 2.1%
Communication 24.7 26.2 1.5 6.2%
Rentals & utilities 17.6 20.0 2.4 13.8%
Depreciation 15.2 17.7 2.5 16.1%
Advertising & marketing 9.7 9.5 (0.2) -2.5%
Others 36.3 34.9 -1.4 -3.8%
Non-recurring expenses 30.4 23.7 (6.7) -22.1%
Total 370.6 375.4 4.8 1.3%
PRE-TAX INCOME 353.2 361.8 8.6 2.4%
TAXES 91.0 99.1 8.1 9.0%
NET INCOME 262.3 262.7 0.4 0.2%
RECURRING NET INCOME 292.7 286.4 -6.3 -2.2%
CONSOLIDATED INCOME STATEMENT (IN PHP MIL)
2014 2015 Change
Amount %
Philippines
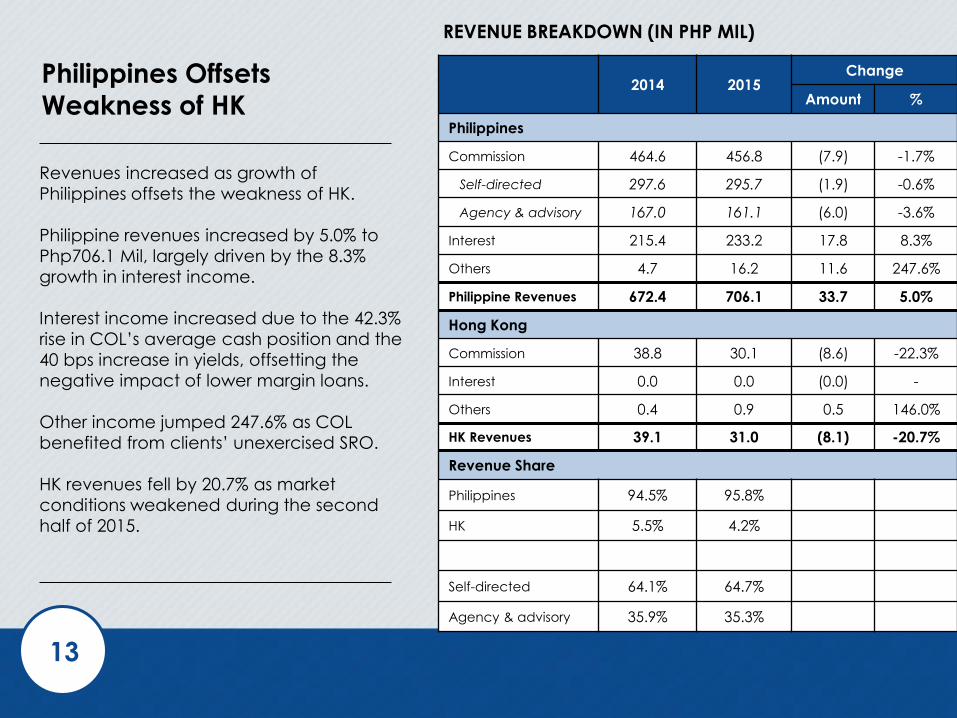
Commission 464.6 456.8 (7.9) -1.7%
Self-directed 297.6 295.7 (1.9) -0.6%
Agency & advisory 167.0 161.1 (6.0) -3.6%
Interest 215.4 233.2 17.8 8.3%
Others 4.7 16.2 11.6 247.6%
Philippine Revenues 672.4 706.1 33.7 5.0%
Hong Kong
Commission 38.8 30.1 (8.6) -22.3%
Interest 0.0 0.0 (0.0) -
Others 0.4 0.9 0.5 146.0%
HK Revenues 39.1 31.0 (8.1) -20.7%
Revenue Share
Philippines 94.5% 95.8%
HK 5.5% 4.2%
Self-directed 64.1% 64.7%
Agency & advisory 35.9% 35.3%
Philippines Offsets
Weakness of HK
13
Revenues increased as growth of
Philippines offsets the weakness of HK.
Philippine revenues increased by 5.0% to
Php706.1 Mil, largely driven by the 8.3%
growth in interest income.
Interest income increased due to the 42.3%
rise in COL’s average cash position and the
40 bps increase in yields, offsetting the
negative impact of lower margin loans.
Other income jumped 247.6% as COL
benefited from clients’ unexercised SRO.
HK revenues fell by 20.7% as market
conditions weakened during the second
half of 2015.
REVENUE BREAKDOWN (IN PHP MIL)

Strong and Highly Liquid Balance Sheet
COL remained cash rich and debt free.
Total assets grew by 25.0% to Php8.0 Bil largely driven by the 40.8% increase in cash. Receivables fell by 25.2% to Php1.1 Bil
largely due to the drop in margin lending from an average of Php1.2 Bil in 2014 to Php971 Mil during 2015. Trade payables grew 32.3% to Php6.5Bil largely due to the increase of COL's client
cash. Stockholders’ equity was up 3.2% to Php1.3 Bil due to the booking of Php262.7 Mil in profits, partly offset by the payment
of Php0.50/sh of cash dividends. BVPS increased slightly to Php2.77/sh.
14
12/31/14 12/31/15 Change
Amount %
Cash & equivalents 4,794.3 6,749.2 1,954.9 40.8%
Receivables 1,438.4 1,075.8 (362.6) -25.2%
Other current assets 23.8 23.8 12.2 (11.6)
Property & equipment – net
35.8 35.8 44.3 8.4
Other non-current assets – net
69.1 71.4 2.3 3.3%
TOTAL ASSETS 6,361.4 7,952.8 1,591.4 25.0%
Trade payables 4,940.9 6,539.1 1,598.2 32.3%
Other current liabilities 115.8 70.4 (45.4) -39.2%
Non-current liabilities 28.2 26.3 (1.9) -6.8%
Total Liabilities 5,085.0 6,635.8 1,550.9 30.5%
Total Stockholders’ Equity
1,276.5 1,317.0 40.5 3.2%
TOTAL LIABILITIES & STOCKHOLDERS’ EQUITY
6,361.4 7,952.8 1,591.4 25.0%
BVPS 2.69 2.77
CONSOLIDATED BALANCE SHEET (IN PHP MIL)

8,7
16
15
,34
5
28
,06
7
46
,16
6
82
,47
6 1
12
,82
7
16
2,3
30
-
20,000
40,000
60,000
80,000
100,000
120,000
140,000
160,000
180,000
2009 2010 2011 2012 2013 2014 2015
Sustained Customer Growth
15
COL’s client base grew by 43.9% Y/Y to 162,330 as of end 2015.
Average monthly additions reached a record high of 4,125 in 2015.
CLIENT BASE +43.9%

Healthy Retail Client Inflow
16
Client equity fell by 17.2% Y/Y to Php46.9 Bil largely due to the Php12.4 Bil outflow by an
institutional client who previously used COL as a custodian. Equity of retail clients continued to grow, up by 8.4% Y/Y to Php46.9 Bil.
Net new flow of retail clients remained positive at Php5.8 Bil in 2015.
CLIENT EQUITY - 17.2% 5
,12
2
11
,96
2
16
,44
7
25
,65
0 3
2,0
51
43
,29
0
46
,92
9
8,7
09
15
,89
1
13
,41
2
-
5,000
10,000
15,000
20,000
25,000
30,000
35,000
40,000
45,000
50,000
2009 2010 2011 2012 2013 2014 2015
Retail
Insitutional

Margin Loans Drop
17
Average daily margin loans were down 20.4% at Php971 Mil Y/Y.
As of end December, the total number of approved margin accounts reached 1,142, up 2.2% Y/Y.
However, only 30.9% of approved margin accounts utilized their margin lines as of end 2015, down from 31.2% as of end 2014. In terms of value of margin granted, only 19.0% was utilized in 2015, down
from 23.0% in 2014.
AVE DAILY
MARGIN LOANS
-20.4%
202
573
1,1
02
952
1,2
31
1,2
20
971
0
200
400
600
800
1,000
1,200
1,400
2009 2010 2011 2012 2013 2014 2015

Market Share Declines
COL’ average daily turnover fell 2.1% Y/Y
to Php699.6 Mil in 2015. In contrast, the
PSE’s average daily turnover grew by
1.9%.
Consequently, COL’s market share in
terms of value turnover fell to 3.9% in 2015
for the whole market from 4.1% in 2014.
Share of value turnover for local investors
fell during the same period to 7.7% from a
record high of 8.2% in 2014. However, it
was still higher compared to its 2013 level
of 7.5%.
Share of number of transactions also
dropped to 19.6% from 21.8%.
Nevertheless, COL’s ranking in the PSE was
maintained at 1st in terms of number of
transactions and 8th in terms of value
turnover.
18
2014 2015 Change
Amount %
PSE Ave. Daily T/O (PhpMil)
8,800.4 8,964.2 163.8 1.9%
COL Ave. Daily T/O (PhpMil)
714.8 699.6 (15.2) -2.1%
COL Market Share (Total)
4.1% 3.9%
COL Market Share (Local)
8.2% 7.7%
PSE Ranking* 8 8
No. of Transactions – PSE (‘000)
18,506.1 25,511.4 7,005.3 37.9%
No. of Transactions – COL (‘000)
4,038.3 5,001.7 963.4 23.9%
COL Market Shares 21.8% 19.6%
PSE Ranking 1 1
COMPARATIVE PERFORMANCE (COL VS. PSE)
Investor Presentation Highlights
19
FINANCIAL & OPERATING
HIGHLIGHTS GROWTH
PLANS
COMPANY
OVERVIEW

Update on Fund Distribution Business
20
ASSET MGMT. CO.S AVAILABLE THROUGH “COL FUND SOURCE”
Asset Mgmt Co.
AUM (as of end ‘15)
Value (PhpBil)
Mkt Share
BPI (ALFM) 86.1 39.4%
Sun Life* 47.4 21.7%
Philam* 42.9 19.6%
Philequity* 16.5 7.6%
First Metro Asset Mgmt.* 13.1 6.0%
ATR KimEng* 8.0 3.7%
Total 213.9 97.9%
Total MF Market** 218.4 100.0%
SOURCE: PIFA, ASSET MANAGEMENT COS.
* Products currently available to COL clients
** Peso only

Update on Fund Distribution Business
21
AUA According to Fund Type*
Type of Fund AUA (PhpMil) % of
Total
Money Market 87.1 17.4%
Bond Fund 36.9 7.3%
Balanced Fund 44.2 8.3%
Equity Fund 331.5 66.3%
Total 499.7 100.0%
* As of end December
7,526 accounts have mutual funds in their portfolios (4.6% of total accounts)

Update on Fund Distribution Business
22
Market Share of Industry Net Sales*
Fund Type Industry
(PhpMil)
COL
(PhpMil) % Share
Bond Fund -3,249.8 35.2 -
Balanced Fund -677.8 42.1 -
Equity Fund 3,332.0 311.0 9.3%
* Second half of 2015 only, excludes US dollar funds

23
Thank You

This presentation was prepared solely and exclusively for discussion purposes. This
presentation and/or any part thereof may not be reproduced, disclosed or used without the prior written consent of COL Financial (the “Company”). This presentation, as well as discussions arising therefrom, may contain statements relating to future expectations and/or projections of the Company by its management team, with respect to the Company. These statements are: (i) presented on the basis of current
assumptions which the Company’s management team believes to be reasonable and presumed correct based on available data at the time these were made, (ii) based on assumptions regarding the Company’s present and future business strategies, and the environment in which it will operate in the future, (iii) a reflection of our current views with respect to future events and not a guarantee of future performance, and (iv) subject to certain factors which may cause some or all of the assumptions not to occur or cause
actual results to diverge significantly from those projected. Any and all forward looking statements made by the Company or any persons acting on its behalf are deemed qualified in their entirety by these cautionary statements . This presentation is solely for informational purposes and should in no way be construed as
a solicitation or an offer to buy or sell securities or related financial instruments of the Company.
Disclaimer