2015-2016 annual report · 2015-2016 annual report in 2015-16, the career center (tcc) continued...
TRANSCRIPT

1
The Career Center 2015-2016 Annual Report
In 2015-16, The Career Center (TCC) continued its strong commitment to students, quality career services, innovative programs, outreach to the university community, enhanced engagement with employers, and effective assessment that informs practice. Our 2015-2020 Strategic Plan guides our goals, initiatives, and assessment activities. As evidence of the excellent work, TCC received five awards including the NACE Technology Excellence-College award for the HireIllini Data Dashboard, the NCDA Outstanding International Service award for the Career Certificate-International program, the MWACE John D. Shingleton Award for innovative assessment of our individual counseling appointments, and two assessment awards related to our work on the Career Certificate-International program: the Student Affairs Recognition of Exemplary Assessment Projects for past assessment and the MWACE John Steele Grant Award to fund continued research in this area.
With many staff securing advanced positions in University of Illinois Colleges, higher-level positions in career services at other universities, and private-sector opportunities, TCC replaced five positions. The fall semester was consumed with search committees, interviews, on-boarding, and training. As a result new staff alongside seasoned professionals made exceptional contributions to the work of TCC, brought new perspectives to their jobs, and created an inspiring work environment.
Major Accomplishments Below is a selection of TCC’s major accomplishments aligned to the Student Affairs strategic plan goals.
Foster collaboration, discovery, and innovation
Launched the Illini Success website with campus-wide partners in academic colleges and administrative offices producing the first campus-wide and college reports for first destinations of Illinois graduates
Auto-populated and updated student information within I-Link for the benefit of students and 10 campus career offices
Sponsored and trained two counseling psychology Ph.D. graduate students for Beginning Counseling Practicum at TCC
Worked with the Department of English, College of Media, Department of Journalism, Graduate College, and Career Services Council (CSC) to offer Pitchapalooza (first ever at Illinois) that included three workshops about publishing and a final “pitch” contest for students to win a free consultation with publishing experts
Provide transformative learning experiences
Initiated an extensive website redesign incorporating user input with content revisions and restructured architecture
Offered first Health Professions Certificate program (CC-H) to intentionally introduce competencies and resources for students pursuing health professions
Streamlined personal statement review procedure to better meet student needs
Collaborated with Veteran Student Support Services and Center for Wounded Veterans in Higher Education to offer Military to College to Career – 4-part series with 50 participants
Enhanced networking programs to connect special populations and professionals including:
Diversity and Inclusion Networking Exchange (D.I.N.E.; 68 students, 36 companies)
Conexiones (Latino/a Networking event; 47 students, 11 alumni/professionals)
Disability Resources & Education Services (DRES) event connecting students with disabilities and “best employers for individuals with disabilities” (27 students)
International Illini Networking in Chicago (83 students, 30 alumni)
Make a significant and visible societal and community impact
Shared 10 Illinois graduates’ success stories with advice to current and prospective students on the Illini Success website
Expanded UIntern program with 25 internships in nonprofit organizations in the Champaign-Urbana area
Recruited the highest number of Peace Corps applications in recent years
Organized Educators’ Job Fair in collaboration with Eastern Illinois University (first “teacher-focused” fair in many years hosted by the Illinois campus)
Collaborated with LAS career services and advancement to identify employers and alumni for first LAS Career Forum
Facilitated professional connections for students through two job shadowing programs (winter and summer) that matched nearly 100 students, fairs that connected approximately 1,431 students with 365 organizations, and 1,135 interviews between students and employers
Connected students to employers through various avenues including 16,552 positions publicized through I-Link or other platforms, 134 employers recruiting at the Illini Career and Internship Fair, and 121 organizations conducting 1,135 interviews at The Career Center Interview Suite
Collaborated with BigTen+ Consortium to host employer reception at annual conference of National Association of Colleges and Employers

2
Steward current resources and generate additional resources for strategic investment
Hired and trained five new career professionals
Created CSC subcommittee structure to organize events and activities, and offer opportunities for career services professionals across campus to contribute to programs and engage with colleagues
Initiated brown bag sessions for TCC and CSC community to brainstorm proposals and provide constructive feedback to enhance acceptance at conferences (over 25 conference acceptances this year)
Launched new features of Schedule Q (scheduling, check-in, and data system) such as online scheduling and alumni tracking
Revamped organization and delivery schedule of both the Health Careers Chronicle and CSC email newsletters
Service Trends 2015-2016
Student Engagement:
26,114 student services were provided (17% decrease compared to last year) by TCC in programs/workshops and individual appointments (this includes an estimated headcount of 7,442 students attending larger events)
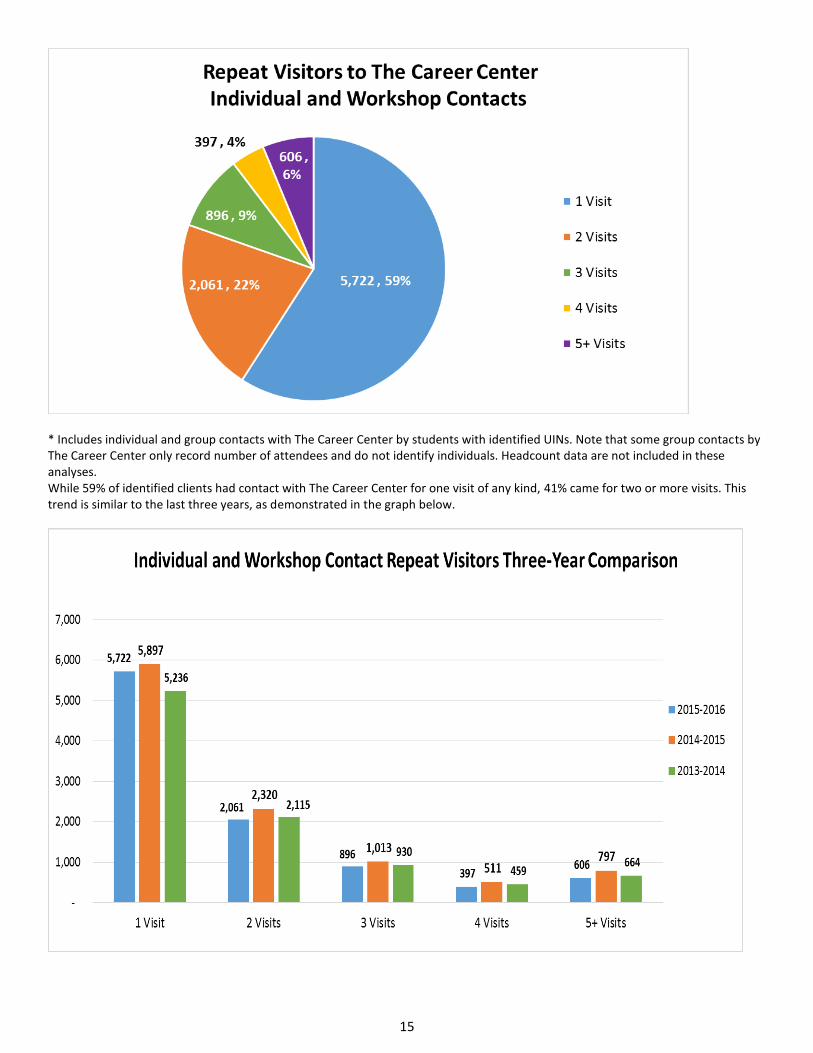
5,722 (59%) individuals used TCC services once during the year, 2,061 (21%) participated in at least two services or activities, and 1,899 (20%) participated in 3 or more services or activities. Compared to last year, there was a 3% decrease for one-time visits, an 11% decrease for two visits, and an 18% decrease for 3 or more visits
9,682 unique students used TCC, representing the following colleges: Liberal Arts and Sciences (37%), Division of General Studies (15%), Applied Health Sciences (10%), Engineering (10%), ACES (8%), Business (7%), Education (3%), FAA (2%), Media (2%), Social Work (1%), and Graduate College (<1%)
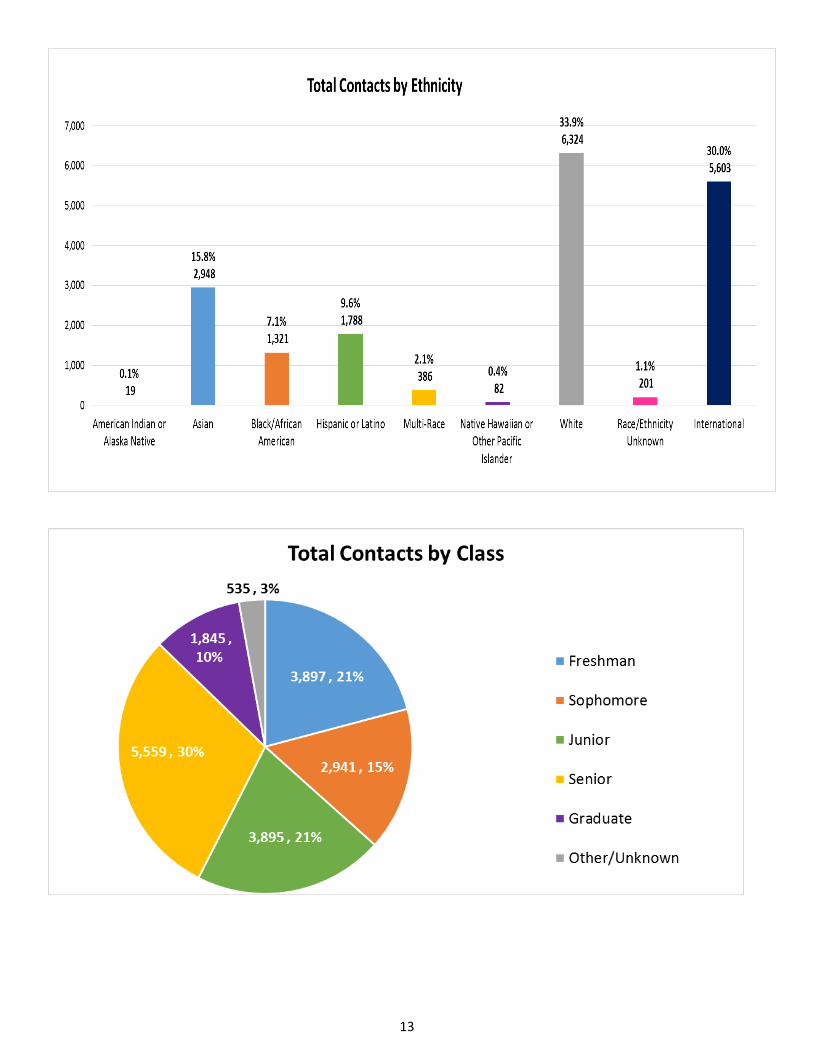
60% (5,765) of students using TCC services with known race/ethnicity were students of color or international; 16% Asian; 7% Black/African-American; 11% Latino/a; 2% multi-race; 23% International
39% of students using TCC services were freshmen and sophomores, 19% were juniors, 29% were seniors, and 10% were graduate students (class standing data were missing for 211 unique visitors – 2%)
Career Development Services:
9,767 individual student service contacts were made including scheduled appointments, drop-in advising, resume and cover letter reviews, personal statement reviews, mock interviews, and email and phone correspondence
3,685 resumes and cover letters were reviewed (4% decrease compared to last year); 73% of those were completed by undergraduate Career Services Paraprofessionals (CSPs) and 22% by graduate student paraprofessionals
17,330 student service contacts (21% decrease) were made at 548 speaking engagements, workshops, fairs, and outreach events (17% decrease); average attendance per event was 31.6
Professional Connections and Employer Engagement:
Offered the sixth annual Illini Career and Internship Fair with academic and career services partners across the University, bringing over 740 students and 134 employers (an 18% decrease compared to last year’s record 164 employers)
16,552 positions were publicized to students through I-Link or other platforms (8% increase compared to last year); 5,956 were internships (8% increase) and 10,596 were entry-level positions for new graduates (8% increase)
121 organizations (42% increase) conducted 1,135 interviews (17% decrease) at The Interview Suite; 71% of the interviews were for full-time positions
Organized the 29th annual Graduate and Professional School Fair in which over 440 students attended (16% decrease compared to last year) and 122 graduate and professional school/programs were represented (19% decrease)
72 students participated in three Health Professions Deans Nights (Optometry, Dental, OT, Pharmacy) and 30 students met individually with admissions deans
Technology Resources:
2,257 new accounts were created in EPICS (Exploring Pathways in Career Success), TCC’s nationally recognized online, interactive career exploration program (a 49% increase compared to last year)
169,875 unique visitors to TCC’s website (22% decrease), with 287,204 visits to the website (6% decrease)
35,098 unique visitors to the INTLConnect website - a resource for international students (101% increase compared to last year), with 41,066 total visits to the website (130% increase)
Charts and graphs displaying details of TCC’s services and demographics of clients may be found in Appendix A (Total Contacts), Appendix B (Individual Contacts) and Appendix C (Group Contacts - Workshops/Programs). Recruiting data are summarized in Appendix D and electronic and web-based services are summarized in Appendix E.
The decrease in the number of programs, services, and participation is due to the replacement of one-third of our professional staff during the fall term. Despite operating with only 67% of full-time staff through the fall, as compared to the previous year, we: (1)

3
reached nearly the same number of unique students (over 90%), and (2) made 83% of the total student contacts. Of particular note, program and service areas with stable staffing (e.g., international students, technology resources) experienced impressive growth. Furthermore, our achievement of five program and assessment awards demonstrates our high-quality work. We enter the 2016-2017 year with an energetic, well-trained team, and goals that demonstrate plans for continued growth and excellence.
In Office Services TCC strives to meet students’ individual needs at any stage of career development and offers several one‐on‐one services including scheduled appointments (career counseling, health professions advising, mock interviews) and drop‐in services (health professions advising, career drop-in advising - CDA, resume and cover letter reviews, and personal statement reviews).
8,784 individual contacts took place (8% decrease compared to last year)
Drop-in Services accounted for 67% of all interactions
38% of individual contacts returned for one or more additional individual services
28% of students for whom data was available identified as international
October is the busiest month for both scheduled appointments and drop-ins, followed by April for scheduled appointments and September for Drop-ins. February is the third busiest month for both
Of students utilizing individual services, 7% identified as African-American (compared to 5% of campus population), 9% as Latino/a (8% of campus population), and 18% as Asian-American (14% of campus population)
Career Counseling. Five new Assistant Directors and two Beginning Counseling Practicum doctoral students from the Counseling Psychology program completed 30 hours of initial counseling training. All professional staff and practicum students participated in ongoing counseling training and supervision.
1,595 individual appointments were completed (6% decrease compared to last year)
Resume/Cover Letter Review (561), Job/Internship Search (473), and Explore Careers/Occupations (300) were the top three reasons for visits
Health Professions Advising. Health professions advising appointments are offered by career counselors who complete a minimum of 20 hours of training specific to health professions. Both scheduled appointments and drop‐ins are offered by professional staff. Personal statements are reviewed and returned via email by a part-time personal statement reviewer.
801 heath professions advising appointments were completed, accounting for 33% of all scheduled appointments
342 drop-in appointments were completed and 200 personal statements were reviewed
The most common topic, medicine (pre-med), accounted for 53% of all health appointments and drop-ins
Career Drop-in Advising. The Career Drop-in Advising (CDA) service offers students a 10‐15 minute career consultation. CDAs assist students in identifying relevant, career‐related resources and next steps. The CDA service is offered year round and staffed primarily by graduate student paraprofessionals who participate in 20 hours of initial training in career coaching and campus resources, followed by ongoing training throughout the year.
1,631 CDA appointments were completed, nearly the same number as last year
66% were completed by graduate student paraprofessionals and 44% by professional staff who cover the CDA desk during the summer and school breaks
Jobs & Internships (53%), followed by Career & Major Exploration (24%), is the most common reason for visiting the CDA
The Mock Interview Program. The Mock Interview Program provides students an opportunity to improve their interviewing skills in a one‐on‐one session in person, over the phone, or via Skype. The program is staffed by volunteer graduate students whose professional interests are related to human resources. Training sessions were expanded this year and included discussion of common concerns, success stories, and feedback from students.
518 mock interviews were completed, with heaviest demand in the first four weeks of each semester
75% of the mock interviews focused on job and internship preparation
50% of the mock interview participants were seniors
The majority of participants were from the Colleges of LAS (38%), ACES (21%) and AHS (15%)
Resume and Cover Letter Reviews. Resume and cover letter reviews are the most utilized individual service. During the academic year, resume and cover letter reviews are provided primarily by undergraduate CSPs on weekday afternoons at TCC, evenings at the Undergraduate Library (UGL) and Ikenberry Commons (IKE), and on Sundays at UGL. Two undergraduate interns are trained to provide resume and cover letter reviews during the summer. During high traffic times, CDAs and professional staff support this service.

4
3,112 resume reviews were completed along with 573 cover letter reviews (4.2% decrease overall) accounting for 42% of all individual contacts at TCC
45% of all resume reviews were completed in September (808) and October (840)
72% of resume and cover letter reviews are completed by undergraduate CSPs and 22% by graduate paraprofessionals
Off-site reviews accounted for 10% of the total; 297 reviews took place at UGL and 86 at IKE
Career Assessments. In addition to TCC’s nationally recognized EPICS (Exploring Pathways in Career Success) program, with five modules accessible online, career counselors can assign the Strong Interest Inventory (SII) or Myers-Briggs Type Indicator (MBTI) when appropriate for individual career counseling clients. Large increases in the usage of EPICS are likely due to Interest Explorer’s adoption as a common assignment for DGS 101 courses (Note: DGS enrollment also increased by 10%). Some instructors assigned additional modules as well.
2,257 new EPICS Accounts were created (33% increase over last year)
1,398 students completed Interest Explorer (53% increase); 636 completed Competency Builder (25% increase); 393 completed Dream Resume Builder (143% increase); 174 completed Making the Leap (126% increase); 136 completed Career Choice Navigator (62% increase)
65 Strong Interest Inventories and 13 Myers-Briggs Type Indicators were assigned with 55 students completing an assessment and interpretation appointment with a counselor
Campus Engagement and Programming TCC cultivates partnerships with student organizations, academic departments, and various units across campus. A core strategy this year was to focus effort on maintaining outreach to academic partners. Due to staffing, outreach to student organizations was limited this past year.
518 programs and workshops were attended by approximately 16,000 students
313 (60%) programs and events related to Jobs & Internship Preparation, 42 focused on Career Exploration, 49 on Preparation for Health Professions, and 28 on Graduate School. An additional 86 Informational programs were offered, introducing students to TCC programs, services, and staff
65% of all programs and events were co-sponsored, including 151 with Academic Units, 75 with Student Affairs Units, and 49 with Registered Student Organizations (RSOs)
50% of all programs and workshops were coordinated or presented by professional staff, 11% by graduate student staff, and 34% by undergraduate CSPs
91 events were held with 2,626 participants in September
129 students attended the fourth annual Opportunities Fair along with nine campus partners promoting experiential opportunities for students
Career Exploration. TCC continued to create career exploration programming to encourage students to learn about themselves and the world of work. Making Your Major Decision, offered in person and online in collaboration with the Division of General Studies, assisted students in solidifying their major/career interests. New partnerships between the TCC Outreach Team and Employer Relations Team proved helpful in establishing connections with alumni to participate in our Pizza & Professional Lunch Series. Additionally, the staff continued to promote EPICS 2.0 through trainings with academic professionals. It is also important to note that significantly more first-year students were reached this past year than in previous years.
31% increase in student participation in the Pizza & Professional Lunch Series which featured opportunities to interact with professionals from: careers in the sports industry, careers working with social media, and interning at research park
740 first-year, exploring students were reached through 21 presentations to General Studies 101 classes (60% increase compared to last year)
222 students were reached during 10 presentations for EPSY 220, a course on career theory and practice (31% increase)
42 programs were held, with 1,116 attendees, 62% of attendees were first-year students (33% increase; average 26 students per program)
83% of Career Exploration programs and workshops were requested by or in collaboration with an academic unit
Diversity & Inclusion Initiatives. TCC staff continued to demonstrate their commitment to creating an inclusive environment on campus and in the workplace through many programs offered in collaboration with campus partners. A few examples of targeted outreach programs are listed below.
Partnered with the Career Services Network, Office of Minority Student Affairs, and the Office of Inclusion and Intercultural Relations to coordinate the third Diversity & Inclusion Networking Exchange (D.I.N.E.; approximately 36 companies, 68 students participated)

5
Collaborated with La Casa Cultural Latina and the Latino/a Alumni Association to host Conexiones: Latino/a Student and Alumni Networking Event which focused on practicing career readiness skills such as delivering an elevator pitch, conducting informational interviews, general networking and learning career perspectives from a panel of alumni
The Backyard BBQ was held again in collaboration with the Women’s Resource Center in the courtyard; roughly 75 students learned about the support services offered by both offices
Military to College to Career Professional Development Series for Veterans, a collaboration among TCC, Veteran Student Support Services and the Center for Wounded Veterans in Higher Education, focused on translating military experience on resumes, cover letters and throughout the job search process; 50 student veterans and representatives from five organizations participated in the four-part series
Job and Internship Preparation. Knowledge of specific occupations, exposure to workplace expectations, and ability to connect education and experience to professional goals are essential components of job and internship preparation. Providing students with direct feedback from recruiters and opportunities to network with professionals are areas of emphasis for TCC. In partnership with the College of LAS, the first LAS Career Forum brought LAS alumni and recruiters together to share with students how to leverage their degree in pursuit of career opportunities. Job shadow and UIntern programs continue to engage more students. Targeted workshops and networking events were developed in partnership with other campus units to prepare students for career fairs and job/internship searches.
98 students were matched to job shadow opportunities at 36 companies, an increase in student and employer participants
Secured 35 internships for UIntern program at 18 local non-profit organizations; nine students selected as UIntern Fellows
Conducted 313 job and internship preparation workshops; 48% were customized by request from staff and faculty
102 students were provided professional attire from The Career Closet, an initiative that collects clothing donations from the campus and local community
Health Professions. The new Assistant Director for Campus Engagement was hired. The Health and Grad team completed their year plan, and created strong collaborations with campus and external partners. Some of the highlights include:
Health Professions Certificate program entered its second year, encouraging students to communicate their motivations for a health profession and the competencies they have developed for their future professional goals (12 students completed)
The Health Careers Chronicle weekly newsletter was sent 40 times (2,877 subscribers; 30% increase compared to last year)
96 students attended the fifth annual Health Related RSO Fair, a collaboration with the Health Professions Living Learning Community
Health Professions Council (HPC), promoting collaboration across the health related student organizations on campus, hosted two educational events for students, a Global Health Panel and a Mock Multiple Mini Interview (MMI) day.
Third annual Application Month was held in April with 4 presentations (approximately 144 students; 50% increase compared to last year)
Eight Health Professions Wednesday events were held on a variety of preparation topics reaching 144 students (147% increase compared to last year)
Graduate & Professional School. 28 workshops focused on graduate & professional schools were presented throughout the year to academic classes and RSOs reaching approximately 827 students. October 2015 was designated as Graduate School Prep Month for the fourth year. Some of the highlights include:
Collaborated with the Writer’s Workshop and Graduate College Career Development Office for more intentional programming
Grad School Prep Month reached approximately 170 students with the following presentations/workshops: Exploring Graduate School, Q and A Panel with Admissions Representatives, Writing Personal Statements, Finding Undergraduate Research, Funding Graduate School, The Graduate School Application Process, and Life in Graduate School (featuring a panel of current graduate students)
International Student Services TCC won the National Career Development Association’s Service to International Students award for the CC-I program and its dedication to meeting career and professional development needs of international students. While TCC continues to prepare students to successfully land CPT/OPT positions in the U.S., we also work in collaboration with international RSOs and other career offices to provide in-country career fairs, programs on home country re-entry, and workshops on employment opportunities and search strategies beyond the U.S. borders. Key partnerships across the career services community and with ISSS, UIAAN, the China office, and international RSOs are essential to our work with international students.
Coordinated The International Student’s Guide to Finding a Job in the United States by Dan Beaudry (250 students attended)

6
Offered workshops focused on career and internship opportunities in Australia, Singapore and other global locations (133 students participated)
Encouraged students to network, conduct informational interviews, and maximize connections with international alumni at International Illini Networking in Chicago event (83 students, 30 alumni attended)
83 students completed the CC-I program; training for CC-I group leaders was enhanced
Shanghai Career Forum connected 150 students/alumni with 47 employers
International Career Forum brought 6 global companies to campus to recruit international students (163 students attended)
2,681 students received the weekly INTLConnect e-newsletter (41% increase compared to last year); and membership in the INTLConnect LinkedIn group grew to 2,868
Professional Connections and Employer Engagement Engagement of employers and representatives from graduate and professional programs continues to enhance services and resources provided by TCC. Recruiters and representatives from the world of work co-presented workshops, participated in panel discussions, and contributed to professional development activities for students. To reach aspirational goals established by the Strategic Plan, planning for deeper and broader engagement of professionals began and an existing role was adjusted for increased focus on experiential education.
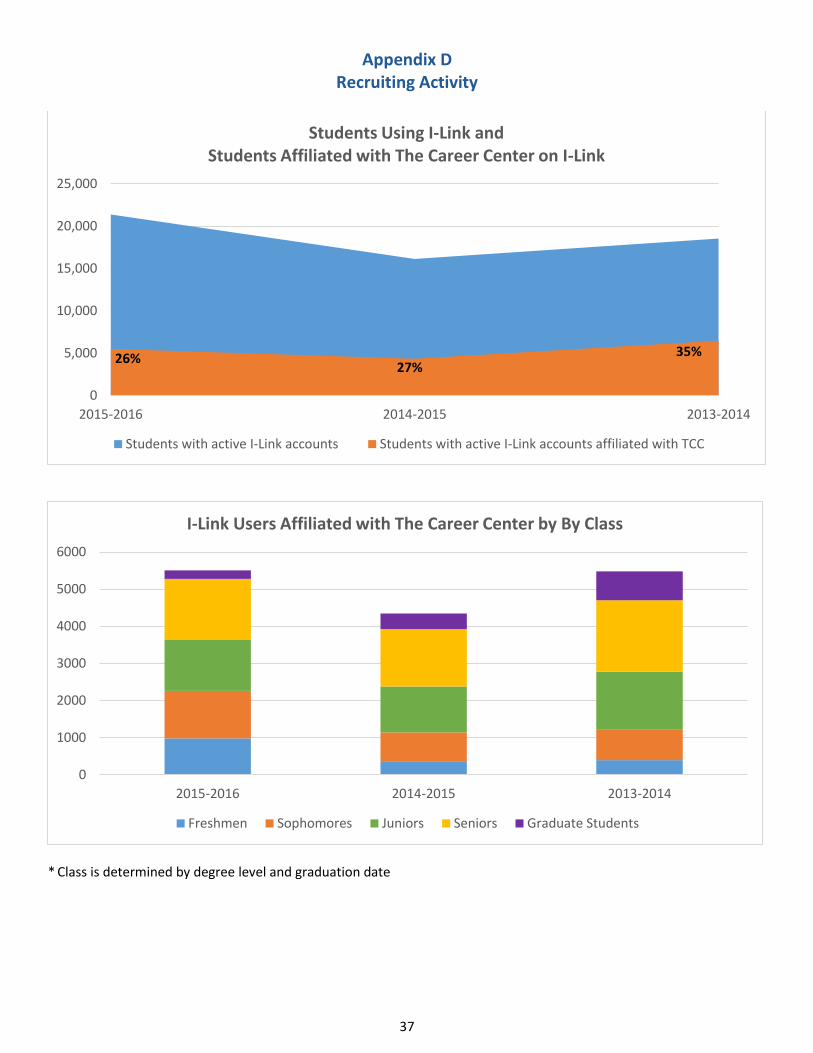
I-Link and On-Campus Recruiting. Employer recruiting activity continues to be very heavy in the fall semester. September and October account for half of annual I-Link activity. Sporadic on-campus recruiting activities in the spring semester tend to be tied to career fairs. TCC led the initiative of creating I-Link accounts for all students and updating academic profiles of existing I-Link users. Upon the closure of the Alumni Career Center by the University of Illinois Alumni Association, TCC led integration of the alumni-focused NACElink platform into I-Link and the transition of UIUC alumni clientele to campus-based services and resources. See Appendix D for detailed reports on recruiting activities and I-Link usage.
21,381 students had active I-Link accounts (26% increase compared to last year). Of those, 5,504 were affiliated with TCC (24% increase)
Hosted 113 organizations that conducted 1,135 interviews, of which 71% were for full-time positions
Organized informational sessions or tabling events for 86 organizations (139% increase)
16,552 positions were publicized to students through I-Link or other platforms used by career offices; of those, 5,956 were internships and 10,596 were entry-level positions for new graduates
Illini Career and Internship Fair. In its sixth year, the name of the All-Campus Career Fair was changed to reflect that participating organizations were seeking candidates for internship opportunities, in addition to entry-level jobs. 741 students, representing majors from every college, and 134 companies attended the event. 52% of the student participants were seniors.
20 organizations participated in the Employer Spotlight that preceded the fair (58 students attended)
17 organizations hosted next-day interviews; 103 students were interviewed as a result of their interaction at the fair
Educators’ Job Fair. The Educators’ Job Fair, held in partnership with Eastern Illinois University (EIU), was hosted by TCC this year. The College of Education also played a significant role in coordinating prep workshops, promoting online resources, and engaging secondary education coordinators across campus. One of the workshops was filmed while being delivered on campus to a group of 75 students. The recording was shared with all students who were student teaching via email and uploaded on the College of Education website.
109 school districts, a 30% increase, and 250 students attended; of those, 130 were Illinois students (250% increase compared to last year)
31 districts conducted 183 interviews immediately following the fair (64% with Illinois students)
Health Professional and Graduate School Engagement. A key feature of health professions advising and graduate school services at TCC is providing students with opportunities to engage with admissions representatives, alumni, and other relevant stakeholders.
Graduate and Professional School Fair: 122 graduate schools/programs represented; 440 students attended
72 students participated in three Health Professions Deans Nights (Optometry, Dental, OT, Pharmacy)
Hosted information sessions for 10 Graduate or Health Professions Programs
30 individual appointments with external partners including dental and pharmacy schools
Illinois Cooperative Work Study Grant. TCC secured $21,920 through the Illinois Cooperative Work Study program from the Illinois Board of Higher Education to support meaningful internships and encourage permanent employment within the State of Illinois. The grant supported 13 students from various majors who completed internships at nine organizations. The interns collectively earned over $93,000 to help offset their educational expenses.

7
Peace Corps. The Peace Corps had another successful year at Illinois with 46 applications from Illinois students and alumni (24% increase compared to last year). The campus is consistently recognized as a top Peace Corps institution with 35 graduates currently serving. In the ninth year as a Peace Corps grant recipient, the Peace Corps recruiter conducted 127 office hours, delivered 16 presentations, and held 14 Returning Peace Corps Volunteer meetings.
Newly-created Peace Corps Club at UIUC promoted the Peace Corps through marketing, presentations, chalking, and other promotional events
Outreach was enhanced through increased social media presence and “boosted” Peace Corps at UIUC Facebook posts
Career Services Paraprofessionals The Career Services Paraprofessionals (CSPs) are 20-25 undergraduates who review resumes and cover letters, facilitate workshops, and represent TCC at events on campus. The four key workshops that CSPs present are Creating Powerful Resumes and Cover Letters, Career Fair Prep: Maximize Your Experience, Getting the Job: Interviewing Tips and Finding an Internship. CSPs assist the employer relations team in hosting employers, assist the marketing team in flyer delivery to campus residence halls and main buildings, and assist in writing book reviews for TCC’s Resource Library and other various projects.
CSPs conducted 176 workshops with 3,594 attendees, and provided 2,670 individual resume and cover letter reviews
CSPs provided workshop and individual service contacts to 6,264 students (24% of the total annual TCC contacts)
Received 108 CSP applications, a 15% increase over last year
Our 2016-2017 CSP cohort reports the following ethnic and racial identities; 16% Asian, 16% Multiracial, 45% Caucasian, 13% Latino/a, 4% African American and 4% undisclosed. The majority of our new hires are from the College of Business at 38%, followed by LAS students at 30%, 23% DGS, and 7% from College of Media
Marketing and Communications The marketing and communications team coordinated promotional efforts for nearly two dozen special events with focuses ranging from career exploration (e.g., Job Shadow, Pizza and a Professional Lunch Series), to experiential learning (e.g., Opportunities Fair, Pitchapalooza, UIntern), to job search preparation (e.g., Career Closet, Career Certificate-International), to professional connections (e.g., Diversity and Inclusion Networking Exchange, Illini Career and Internship Fair), and continuing education (e.g., Grad School Prep Month, Health-Related RSO Fair). Significant resources were also dedicated to a redesign of the TCC website, to be launched in early Fall 2016. Some highlights of our efforts include:
Designed 12 professional print marketing pieces and distributed 30,000+ copies to students
Implemented event-specific marketing campaigns through targeted email messages, Lincoln Hall digital monitors, the Illini Union’s Campus Connections website, poster and audio ads on 14 MTD campus buses, and numerous creative “guerrilla marketing” events on the Main Quad
Conducted office-wide branding efforts promoting core services in Daily Illini ads and a newly-designed strategy for TCC front window displays implemented in Spring/Summer 2016
Continued to enhance TCC’s social media presence and communications, as evidenced by:
“Get Hired Illini” Pinterest page has 1,232 followers, increasing 18% in the past year
Twitter (@UoICareerCenter) has 1,575 followers, increasing 14% in the past year
Facebook generated approximately 70% of the social media referrals to TCC website
Website and Information Resources With more than 340,000 visits to careercenter.illinois.edu and intlconnect.illinois.edu, delivering high-quality web-based information is critical to meeting the needs of students. To meet user expectations, TCC’s completely redesigned website will be launched as the Fall 2016 semester begins. The new site will incorporate information currently held at intlconnect.illinois.edu, be mobile-responsive, and have streamlined content that integrates information, resources, and services across the site. Referral traffic from Illinois.edu nearly doubled over the last year and accounts for 31% of referrals to TCC’s website. More users arrive at TCC’s site from the campus homepage than those arriving from the sum of general search engines. Additional website analytics can be found in Appendix E.
Circulation of our library materials decreased and use of online subscriptions was mixed with some resources having increased use and others having decreased use. The reference collection was reduced by 50% by moving some of the materials to the circulating collection and disposing of out-of-date materials. Only the most-used online subscriptions were renewed for the upcoming year. The library collection will be promoted and better integrated into the redesigned website.
careercenter.illinois.edu had 287,204 visits and INTLconnect had 41,066 visits
Top search terms were related to I-Link, resumes, and companies that hire international students
Career Spots videos were viewed 12,293 times (12% increase compared to last year)

8
GoinGlobal usage increased 20% with 30,539 pages accessed
Technology, Data Systems, and IT Infrastructure TCC continues to enhance our IT infrastructure, technology, data systems, and processes to effectively serve students. Online scheduling of counseling appointments was developed and launched this year. I-Link accounts were created for all new students and profile information was periodically updated for I-Link users. While this appears like an automated process to students, it is a monumental task. Additionally, access to I-Link was connected to shibboleth authentication to eliminate the need for a separate I-Link password. Comprehensive and cost-effective updates were made to desktop machines to extend their life expectancy, and the inventory of mobile devices was augmented to meet staff and service needs.
Career Services Council (CSC) Kim Surles, Director of Business Career Services, served as Chair for the CSC in 2015-2016. Three sub-committees of CSC were formed to better support and implement CSC activities: Employer Professional Development, Staff Professional Development, and International Student Career Connections. Several events throughout the year provided a venue to focus on sharing best practices and learning from each other. CSC provides grants to support programs and staff professional development. This year CSC provided $18,277 for 10 Innovative Programming Grants and $4,344 for 11 Professional Development Grants. Monthly meeting topics included:
Working with International Students, presentation by the International Student and Scholar Services Office
Student and Employer Engagement, sharing and brainstorming by CSC members on strategies to increase student and employer engagement
Trends in Recruiting, summary by UIUC staff on insights gained from two conferences on current trends in recruiting
Undergraduate Education Initiatives, presentation by Chuck Tucker, Vice Provost for Undergraduate Education and Innovation
Serving Veterans, presentation by UIUC staff on collaborating across campus; overview of the Center for Wounded Veterans and their services
Research Park Overview, panel discussion with several Research Park employers
CSC Steering Committee. The CSC Steering Committee establishes policies, guides campus-wide career services activities, and advocates for career services and the integration of career and professional development into the Illinois educational experience. This year the Committee 1) advocated for and assisted in implementation of the Illini Success initiative; 2) responded to closure of Alumni Career Services and exclusion of local part-time positions from Student Virtual Job Board hosted by Office of Financial Aid; and 3) assessed vendor-provided platforms to meet needs of our coordinated and collaborative model of managing on-campus recruiting activities. Additionally, the committee met with campus experts regarding legal and contractual obligations related to unpaid internships and career fair booth agreements. Special accomplishments included:
Won national award for Technology Excellence from NACE for development of the HireIllini Data Dashboard
Met twice with the Employer Advisory Board, HR thought leaders from across the country that guide and advise our service to employers
Guided absorption of local part-time positions into I-Link
HireIllini Initiative. This was the 10th consecutive year of funding from the Provost’s Office for the HireIllini marketing initiative. Initiatives and projects to enhance employer relations for the year included:
Launched HireIllini Data Dashboard – interactive graphs that provide statistics on student enrollment and degrees awarded
53,005 visits to HireIllini website (75% increase compared to last year)
Organized seventh annual Illinois Recruiters’ Forum: Using Data Insights to Hire Illinois Talent (94 recruiters from 68 organizations attended)
Represented Illinois at Big10+ reception in Chicago in conjunction with the NACE Conference
Sponsored Midwest ACE and NACE Conferences for visibility to employers
Planned a workshop in Chicago for employers presented by JB Training Solutions: Navigating the Lifecycle of Recruiting: Inspiring, Engaging, and Retaining Today’s College Talent
The Career Center Advisory Committee Zhourui (Ryan) Ni, junior in Economics and Statistics, served as chair with nine students, six faculty/staff, TCC’s Director, and three Associate Directors comprising the committee. Monthly assignments and discussions encouraged members to learn about TCC, as well as gain members’ perceptions of challenges and improvements for services. Monthly meeting topics included:
The Career Center – barriers to students using our services and strategies to encourage more participation

9
Illini Success initiative and reports – updates, reviews, and recommendations
LinkedIn profiles – best practices and promotion of new services
The Career Center’s website redesign – benchmarked other sites
The Career Center’s marketing campaign – messages, channels, and opportunities
Assessment Assessment continues to be a foundational element of the TCC culture. Highlights of our assessment efforts this year focused on exploring career-related graduate outcomes, assessing learning outcomes related to networking programs, and sharing our story with students and professional colleagues. Sample assessment reports can be found in Appendix F on the TCC website.
Illini Success Initiative. Spearheaded by TCC, the University of Illinois at Urbana-Champaign’s campus-wide first destination survey of graduate outcomes enjoyed a highly successful public launch of the Illini Success website and annual reports in April 2016. In our first year, the Illini Success Team achieved a 74% knowledge rate for the 2014-2015 graduating class, with 84% reporting first destinations within 6 months of graduation. Partnerships across campus made this initiative possible, with contributions from the Office of the Provost, Division of Management Information (DMI), Council of Undergraduate Deans, Career Services Council, Illini Union Marketing Team, Engineering IT Shared Services, Institutional Review Board, and countless partners in academic units. Data have also already been collected from more than 60% of August 2015, December 2015, and May 2016 graduates, building up to the 2015-2016 annual reports to be released in Spring 2017. Finally, the 2014-2015 dataset was also used to investigate the impact of career services on first destination outcomes at graduation. Preliminary results of this study are available in Appendix F.
Medical School Outcomes Study. TCC developed an annual process for analyzing data provided by AMCAS (American Medical College Application Service) and AACOMAS (American Association of Colleges of Osteopathic Medicine) regarding acceptance and matriculation into MD and DO programs. Our TCC Assessment Committee works with DMI to connect this to academic background data, and examine use of career services to better understand our outreach and influence. One product is a set of infographics and messages, currently in development, that can be updated annually for use with academic units, prospective students, current students, and their families.
Learning Outcomes and Networking Programs for Diverse Student Populations. Assessment of networking events for diverse student populations was expanded to include Conexiones, Diversity and Inclusion Networking Exchange, and International Illini Networking in Chicago. In these programs, students learn skills for professional networking, and practice with alumni and professionals. Assessment of the events uses a pre-post, brief survey design to assess student learning and growth in confidence regarding initiating networking relationships, creating meaningful connections, and following-up after the events. Results demonstrated program strengths and provide insights for future program development.
Sharing our Story of the Value of Career Services. TCC is a recognized leader in career services and student affairs assessment, locally and nationally. The TCC Assessment Committee strives to share our experiences and knowledge broadly to benefit the field, communicating the value of career services with students, partners across campus, and colleagues and researchers across the country. The following examples demonstrate our efforts:
Exploring new strategies for enhancing communications with students through a data-driven approach, including infographics about student outcomes, incorporating student reflections and intended learning outcomes into marketing pieces, and developing targeted mailing lists based on service usage data
Sharing assessment resources at five conferences and events across the country on topics ranging from assessing paraprofessional programs, to strategizing graduate outcomes surveys, to conceptualizing assessment as storytelling
Receiving three assessment awards from the Division of Student Affairs and the Midwest Association of Colleges and Employers, recognizing the excellent quality of our work
Professional Development, Service, Research, Presentations, and Publications TCC values professional development and service as essential components to providing high quality experiences for students.
TCC Professional Development Programs. TCC on-boarded five new staff members during the Fall 2015 semester, which includes completing a multi-session New Counselor Training. During the Spring semester, four staff development sessions were offered to engage with campus units regarding special student populations: “Working with Students in Crisis” (Office of Dean of Students), “Exploring Students” (Division of General Studies), “Working with Military-Connected Students” (Center for Wounded Veterans in Higher Education), and presentations on the “Government Job Search” and “Working with Pre-Health Students.” Staff also participated in counseling observations and group supervision chat sessions throughout the year.

10
Professional Association Leadership and Service. TCC staff are leaders and active participants in several professional associations including:
Midwest Association of Colleges and Employers (MwACE) – Trends Conference Planning Committee, Membership Committee, Professional Exchange Committee
National Association of Colleges and Employers (NACE) – Leadership Advancement Program
Hire BigTen+ Consortium – NACE Conference Employer Reception Planning Committee (Chair)
National Career Development Association (NCDA) - Ethics Committee, International Student Services Committee, Publications Development Council
Robert P. Larsen Grant for Research in Career Development. The Larsen Grant continues to support and encourage research related to career development conducted by graduate students. This year, TCC received a record 10 applications, representing six academic schools and colleges. Three projects were funded, including Tianjun Sun and Bo Zhang (Labor and Employment Relations) for their study Overcoming Biased Vocational Interest Interpretations: Forcing Improved Measurement, Gaeun Seo (College of Education) for her study Faculty Careers from Socio-Cognitive and Contextual Perspectives, and Lin Bin (College of Liberal Arts and Sciences) for her study The Pervasive and Early-Emerging Bias against Women in Careers Where Success is Thought to Depend on Intellectual Talent.
Presentations and Publications. TCC actively contributes to discovery and innovation in the career development field through presentations and publication in a variety of media. In this academic year, TCC’s professional staff conducted 25 presentations at local/campus (1), state (2), regional (7), and national (13 onsite, 2 web-based) conferences and venues. Of these presentations, 7 (28%) were invited. Staff also published three manuscripts, including two association magazine articles and one professional technical report. Full references for all presentations and publications can be found in Appendix G.
Goals for 2016-2017 In the summer of 2015 The Career Center completed its Strategic Plan 2015-2020, https://www.careercenter.illinois.edu/about, which established the vision and framework for our work in support of the strategic plan for the Division of Student Affairs and the campus. Goals and initiatives are identified annually to realize these aspirations. Sample 2016-2017 goals and initiatives include:
Foster collaboration, discovery, and innovation
Connect with and use alumni and health practitioners to serve as consultants for students and staff
Build and release a secure faculty and staff data portal (fall 2016) and open-access career exploration tool (late spring 2017) based on Illini Success graduate outcomes data
Provide outreach and education to faculty and staff for integration of career development into the curriculum
Support development of meaningful experiential learning opportunities for students through collaboration with employers, campus partners, and department internship coordinators
Provide transformative learning experiences
Embrace a holistic approach to evidence-based practice, embedding learning outcomes and a data-informed approach to develop, market, implement, and continuously improve programs and services
Incorporate perspective of alumni/recruiters into TCC services/programs with an employer in residence program, etiquette dinners, and job shadow programs
Leverage technology and website platforms for broader and deeper engagement with students
Teach students to become strong storytellers with narratives that connect their experiences and passion to future endeavors
Make a significant and visible societal and community impact
Launch new website with improved navigation, architecture, and size-responsive design
Design industry-based programming that encourages partnership with RSOs, faculty, alumni, and employers
Increase on-campus recruiting activities with specialized events/fairs focused on academic areas, career interests of students, and employers’ recruiting targets
Submit proposals to conferences, best-practices awards, and publications to share our outstanding work
Steward current resources and generate additional resources for strategic investment
Develop and implement annual communication plan that elevates TCC’s brand and provides operational direction for advertising and promoting of TCC’s events, programs and initiatives
Leverage technology and expertise to increase efficiency of business processes such as I-Link account creation and profile updates, online scheduling, electronic document submission, and data feeds to web calendar
Continue extensive professional development opportunities for staff

11
Appendix A Total Contacts (Individual and Workshops/Programs)
Return Rates per Service 3-Year Comparison*
2015 – 2016 2014 – 2015 2013 – 2014
Individual 37.7% 43.9% 35.4%
Programs/Workshops 28.3% 37.1% 36.7%
All Services 40.9% 50.9% 50.3%
* Individual return rate calculated for individuals who use any in-office service (Scheduled appointment, drop-in pre-health counseling, or resume/cover letter review) Programs/Workshops return rate calculated for individuals who attended a program, workshop or career fair All Services return rate calculated for individuals who use any in-office service, program or workshop or any combination of services

12
*Total Users 26,114
13

14
15
* Includes individual and group contacts with The Career Center by students with identified UINs. Note that some group contacts by The Career Center only record number of attendees and do not identify individuals. Headcount data are not included in these analyses. While 59% of identified clients had contact with The Career Center for one visit of any kind, 41% came for two or more visits. This trend is similar to the last three years, as demonstrated in the graph below.

16
The charts below represent a snapshot of The Career Center’s services, the demographics of students served, and how they relate to the campus population as a whole.
Ethnicity In
Office Workshops Total Users
% of TCC
Users Unique
Students
% of Unique
TCC Users Campus Total **
% of Campus
% of Ethnicity
Used Services
American Indian or Alaska Native 8 11 19 0.1% 6 0.1% 37 0.1% 16.2%
Asian 1,578 1,370 2,948 15.8% 1,556 16.1% 6,269 14.2% 24.8%
Black/African American 626 695 1,321 7.1% 695 7.2% 2,167 4.9% 32.1%
Hispanic or Latino 798 990 1,788 9.6% 1,012 10.5% 3,592 8.1% 28.2%
Multi-Race 185 201 386 2.1% 228 2.4% 1,115 2.5% 20.4%
Native Hawaiian or Other Pacific Islander 79 3 82 0.4% 28 0.3% 30 0.1% 93.3%
White 2,879 3,445 6,324 33.9% 3,804 39.3% 20,068 45.5% 19.0%
Race/Ethnicity Unknown 135 66 201 1.1% 113 1.2% 428 1.0% 26.4%
International* 2,496 3,107 5,603 30.0% 2,240 23.1% 10,381 23.5% 21.6%
Total 18,672 9,682 44,087 22.0%
*DMI classifies International as an ethnicity
Gender In
Office Workshops Total Users
% of TCC
Users Unique
Students
% of Unique
TCC Users Campus
Total % of
Campus
% of Gender
Used Services
Female 6,139 6,770 12,909 69.1% 5,408 55.9% 19,761 44.8% 27.4%
Male 2,534 3,109 5,643 30.2% 4,250 43.9% 24,322 55.2% 17.5%
Unknown 111 9 120 0.6% 24 0.2% 4 0.0% --
Total 18,672 9,682 44,087 22.0%
% of TCC Users: Percentage of each demographic as it relates to the whole population of students who used The Career Center services % of Unique TCC Users: Percentage of each unique demographic as it relates to the whole population of students who used TCC Services
Campus Total: Number of each demographic attending the university (From DMI, 2015 Fall 10-day enrollment data) % of Campus: Percentage of each demographic as it relates to the whole population of students attending the university % of … Used Services: Percentage of each demographic on campus who used TCC services

17
College In
Office Workshops Total Users
% of TCC
Users Unique Users
% of Unique
TCC Users Campus
Total
% of Campus
Total
% of College
Used Services
Agricultural, Consumer, & Env Sciences 729 683 1,412 7.6% 773 8.0% 3,265 7.4% 23.7%
Applied Health Sciences 861 1,318 2,179 11.7% 995 10.3% 2,181 4.9% 45.6%
College of Business 385 920 1,305 7.0% 698 7.2% 4,266 9.7% 16.4%
College of Media 148 163 311 1.7% 192 2.0% 1,104 2.5% 17.4%
Division of General Studies 1,069 1,442 2,511 13.4% 1,471 15.2% 2,790 6.3% 52.7%
Education 124 260 384 2.1% 284 2.9% 1,195 2.7% 23.8%
Engineering 822 832 1,654 8.9% 1,012 10.5% 10,732 24.3% 9.4%
Fine & Applied Arts 207 169 376 2.0% 228 2.4% 2,321 5.3% 9.8%
Graduate College 5 3 8 0.0% 5 0.1% 76 0.2% 6.6%
Liberal Arts & Sciences 4,113 3,616 7,729 41.4% 3,625 37.4% 14,032 31.8% 25.8%
School of Social Work 38 100 138 0.7% 99 1.0% 468 1.1% 21.2%
College of Veterinary Medicine 11 9 20 0.1% 14 0.1% 567 1.3% 2.5%
College of Law 4 9 13 0.1% 9 0.1% 580 1.3% 1.6%
Other 38 69 107 0.6% 66 0.7% 510 1.2% 12.9%
Unknown 230 295 525 2.8% 211 2.2% -- 0.0% 0.0%
Total 18,672 9,682 44,087 22.0%
% of TCC Users: Percentage of each demographic as it relates to the whole population of students who used The Career Center services % of Unique TCC Users: Percentage of each unique demographic as it relates to the whole population of students who used TCC Services
Campus Total: Number of each demographic attending the university (From DMI, 2015 Fall 10-day enrollment data) % of Campus: Percentage of each demographic as it relates to the whole population of students attending the university % of … Used Services: Percentage of each demographic on campus who used TCC services From Campus total, Library & Infor Sci (n=269), Center Inno in Teach Learn (n=47), and Labor and Employment Relations (n=141) are categorized as "Other"

18
Class In
Office Workshops Total Users
% of TCC
Users Unique
Students
% of Unique
TCC Users Campus
Total % of
Campus
% of Class Used
Services
Freshman 1,676 2,221 3,897 20.9% 2,270 23.4% 7,222 16.4% 31.4%
Sophomore 1,322 1,619 2,941 15.8% 1,539 15.9% 7,077 16.1% 21.7%
Junior 1,672 2,223 3,895 20.9% 1,870 19.3% 8,117 18.4% 23.0%
Senior 3,024 2,535 5,559 29.8% 2,820 29.1% 9,744 22.1% 28.9%
Graduate 854 991 1,845 9.9% 965 10.0% 10,245 23.2% 9.4%
Unknown/Other 236 299 535 2.9% 218 2.3% 1,682 3.8% 13.0%
Total 18,672 9,682 44,087 22.0%
Citizenship In
Office Workshops Total Users
% of TCC
Users Unique
Students
% of Unique
TCC Users Campus
Total % of
Campus
% of Citizenship
Used Services
Domestic 6,139 6,770 12,909 69.1% 7,361 76.0% 33,278 75.5% 22.1%
International 2,534 3,109 5,643 30.2% 2,255 23.3% 10,381 23.5% 21.7%
Unknown 111 9 120 0.6% 66 0.7% 428 1.0% 15.4%
Total 18,672 9,682 44,087 22.0%
% of TCC Users: Percentage of each demographic as it relates to the whole population of students who used The Career Center services % of Unique TCC Users: Percentage of each unique demographic as it relates to the whole population of students who used TCC Services
Campus Total: Number of each demographic attending the university (From DMI, 2015 Fall 10-day enrollment data) % of Campus: Percentage of each demographic as it relates to the whole population of students attending the university % of … Used Services: Percentage of each demographic on campus who used TCC services

19
Appendix B Individual Contacts
2015-2016 2014-2015 2013-2014
Total students 9,733 12,083 13,626
General Appointments 1,595 1,703 1,589
Pre-Health Appointments 801 1,056 1,087
Pre-Health Drop-Ins 342 464 458
Resume Reviews 3,112 3,232 2,941
Cover Letter Reviews 573 616 676
Mock Interviews 518 673 656
Career Drop-in Advising 1,631 1,647 1,754
Personal Statement Drop-offs 200 183 172
I-Link Support* 10 N/A N/A
Linked In Profile Review* 2 N/A N/A
Weston Drop-Ins N/A 15 17
Email Contacts** 906 2,837 4,219
Phone Contacts** 43 107 57
* New services added to Spring 2016 semester ** Estimates of activity by counselors
For one-on-one individual contact with clients, 61% were drop-in resume/cover letter reviews. Health counseling and drop-ins account for 13% of total services.

20
* Includes individual contacts with The Career Center by students with identified UINs. While 62% of identified clients had contact with The Career Center for one individual visit, 38% came for two or more visits. This trend is similar to the previous two years, as demonstrated in the graph below.

21
Capacity index is defined by total number of available appointments, divided by completed appointments.
50.0% 52.5%
98.0%98.3%
93.6%
74.2%
60.4%55.1%
49.1%
59.6%55.7%
43.3%
0%
10%
20%
30%
40%
50%
60%
70%
80%
90%
100%
July Aug Sept Oct Nov Dec Jan Feb Mar Apr May June
Per
cen
t Fi
lled
Ap
po
intm
ents
Monthly Capacity Index of Scheduled Appointments

22
Drop-in services are resume/cover letter reviews, career drop-in advising, LinkedIn profile reviews, and I-Link support
Academic Standing by Service Type
Drop-in Reviews / Resources
General Career
Counseling Health
Counseling Health
Drop-Ins
Online Personal
Statement Review
Mock Interviews Total
Class # % # % # % # % # % # % # %
Freshman 1,269 24% 227 14% 100 12% 58 17% 1 1% 21 4% 1,676 19%
Sophomore 915 17% 159 10% 143 18% 63 18% 0 0% 42 8% 1,322 15%
Junior 1,032 19% 259 16% 189 24% 75 22% 3 2% 114 22% 1,672 19%
Senior 1,423 27% 661 41% 359 45% 131 38% 183 92% 267 52% 3,024 34%
Graduate 516 10% 251 16% 8 1% 4 1% 7 4% 68 13% 854 10%
Other / Unknown
173 3% 38 2% 2 0% 11 3% 6 3% 6 1% 236 3%
Total 5,328 1,595 801 342 200 518 8,784

23
The most common primary reasons for seeking career advising include: resume/cover letter writing (25%), job/internship searches (21%), interviewing (13%), and exploring careers/occupations (11%).
The most common primary reason for seeking assistance with pre-health advising is medicine (67%).
228
402
64
236
50 14
242
473
74
800
52
942
45
159
0
200
400
600
800
1000
Nu
mb
er o
f In
div
idu
al A
pp
oin
tmen
ts a
nd
Dro
p-I
ns Primary Reason for Visit Related to
Individual Career Advising
75
717
51 41 1349 50 75
00
200
400
600
800
1000
Nu
mb
er o
f A
pp
oin
tmen
ts a
nd
Dro
p-I
ns
Primary Reason for Visit Related to Pre-Health Advising

24
A greater percentage of females seek services from The Career Center as compared to males, consistent with reports from career services professionals across the country.
A little more than a third 37% of TCC’s individual student contacts were conducted by professional staff, while the remainder of individual contact service delivery was conducted by graduate (30%) and undergraduate (33%) staff.

25

26
Individual Contacts by College
College Total Percentage
Agricultural, Consumer, & Environmental Sciences 729 8.3%
Applied Health Sciences 861 9.8%
College of Business 385 4.4%
College of Media 148 1.7%
Division of General Studies 1,069 12.2%
Education 124 1.4%
Engineering 822 9.4%
Fine & Applied Arts 207 2.4%
Graduate College 5 0.1%
Liberal Arts & Sciences 4,113 46.8%
School of Social Work 38 0.4%
College of Veterinary Medicine 11 0.1%
College of Law 4 0.0%
Other 38 0.4%
Unknown 230 2.6%
Total 8,784 100.0%
237
123 114
300
87130
3
149124
362
167131
251
655
32
460
89
444
0
50
100
150
200
250
300
350
400
450
500
Individual Student Contact by Professional Staff

27
* A data gap was discovered in coding of Mock Interview types. The type of Mock Interview was misrepresented for 18 mock interviews this year.
390, 75%
83, 16%
27, 5%18, 4%
Types of Mock Interviews
Jobs & Internships
Graduate and Professional School
Health Professions Advising
Unknown*
390
83
27 18
533
9248
0
473
65101
00
100
200
300
400
500
600
Jobs & Internships Graduate andProfessional School
Health ProfessionsAdvising
Unknown
Mock Interviews Three-Year Comparison
2015-2016 2014-2015 2013-2014

28

29
Appendix C Group Contacts – Programs and Workshops
The Career Center Programs and Workshops by Type of Presenter
Presenter Type 2015-2016 2014-2015 2013-2014
Events Attendance Events Attendance Events Attendance
Campus Partner 2 65 2 63
CSP 176 3,594 183 5,059 210 4260
External Partner 11 265 19 416 (no data) (no data)
Graduate Staff/Undergrad Intern
96 3,387 63 1,791 36 743
Professional Staff 263 10,019 392 14,675 333 14,152
Totals 548 17,330 659 22,004 579 19,155
Average Attendance per event
31.6 33.4 33.1

30

31
Includes group programs/workshops with identified student participants—some group programs only record total number of attendees and are not included in this graph.

32

33

34
Program & Workshop Attendance by College
Program & Workshops Attendance by College Total Percentage
Agricultural, Consumer, & Environmental Sciences 683 6.9%
Applied Health Sciences 1,318 13.3%
College of Business 920 9.3%
College of Media 163 1.6%
Division of General Studies 1,442 14.6%
Education 260 2.6%
Engineering 832 8.4%
Fine & Applied Arts 169 1.7%
Graduate College 3 0.0%
Liberal Arts & Sciences 3,616 36.6%
School of Social Work 100 1.0%
College of Veterinary Medicine 9 0.1%
College of Law 9 0.1%
Other 69 0.7%
Unknown 295 3.0%
Total 9,888 100.0%

35

36
The Career Center Programs and Workshops by Month
2015-2016 2014-2015 2013-2014
Programs by month:
Events
Attendance
Events
Attendance
Events
Attendance
July 12 215 5 75 8 91
August 30 2,699 35 3,266 21 2,228
September 91 2,682 146 6,242 109 3,866
October 83 2,293 102 3,074 88 3,056
November 56 1,732 70 1,134 59 1,509
December 4 51 11 111 14 236
January 31 919 35 1,083 27 1,100
February 82 2,130 75 1,676 76 1,613
March 66 2,057 70 2,515 77 2,678
April 53 1,114 68 1,533 77 1,946
May 10 224 12 307 10 422
June 30 1,214 30 988 13 410
Totals 548 17,330 659 22,004 579 19,155
37
Appendix D Recruiting Activity
* Class is determined by degree level and graduation date
0
5,000
10,000
15,000
20,000
25,000
2015-2016 2014-2015 2013-2014
Students Using I-Link and Students Affiliated with The Career Center on I-Link
Students with active I-Link accounts Students with active I-Link accounts affiliated with TCC
26%27%
35%
0
1000
2000
3000
4000
5000
6000
2015-2016 2014-2015 2013-2014
I-Link Users Affiliated with The Career Center by By Class
Freshmen Sophomores Juniors Seniors Graduate Students

38
Active I-Link Users That are Affiliated with TCC by College/School
2015-2016 2014-2015 2013-2014
Agricultural, Consumer and Environmental Sciences 156 378 615
Applied Health Sciences 511 322 359
Business 24 135 296
Chemical Sciences 21 41 -
Education 103 47 84
Engineering 158 36 862
Fine & Applied Arts 18 129 181
Division of General Studies 629 242 193
Labor and Employment Relations 1 3 22
Liberal Arts & Sciences 3,828 2,881 3,448
Library and Information Science 10 25 39
Media 22 131 360
Social Work 30 26 24
Other (Law, Nursing, Vet Med) 24 37 35
On-Campus Recruiting and Interviews
2015-2016 2014-2015 2013-2014
Employment opportunities on I-Link 10,596 9,821 -
Internship opportunities on I-Link 5,956 5,462 -
Number of employers at All-Campus Career Fair 134 164 136
Number of employers at Educators’ Job Fair 105 84 -
Number of interview schedules for jobs and internships hosted by TCC
161 218 135
Number of student interviews for jobs and internships hosted by TCC
1,135 1,372 836
Number of employers hosted by TCC for interviewing 113 79 64
Number of employers hosted by TCC for informational sessions/tabling
86 36 -
Number of schools/programs at Graduate and Professional School Fair
122 150 122
Number of graduate/professional schools hosted by TCC for informational sessions
11 12 -
Number of representatives attending health occupation information nights for pre-professional students
14 18 -
Number of schedules with graduate/professional school representatives hosted by TCC
8 26 -
Number of student meetings with graduate/professional school representatives hosted by TCC
30 65 -

39
Appendix E Website Analytics
Definitions:
Unique Visitors - Number of unduplicated (counted only once) visitors to our website over the course of a specified time period.
Search Traffic - Visitors who reached our website through a search engine or search site.
Direct Traffic - Visitors who clicked a bookmark to come to our site or typed our site URL into their browser.
Referral Traffic - Visitors who clicked on a link on another website to reach our website.
The Career Center – www.careercenter.illinois.edu
The Career Center Website Traffic 2015-2016 2014-2015 2013-2014
Visits 287,204 306,025 332,783
Unique Visitors 169,875 217,240 195,068
Search Traffic 218,247 235,729 150,285 Direct Traffic 30,646 43,150 28,971
Referral Traffic 36,997 25,248 12,881 Social Referrals 1,302 1,872
Page Views/Visit 2.23 2.31 2.22
Time on Site 00:01:45 00:01:48 00:01:48
Top Referrers to The Career Center Website
Percentage of Referrals
2015-2016 Rank
2014-2015 Rank
illinois.edu 30.82% 1 1
bing.com 4.60% 2 -
compass2g.illinois.edu 5.00% 3 7
search.yahoo.com 3.35% 4 -
mail.google.com 2.95% 5 3
academics.aces.edu 2.79% 6 4
livebinders.com 2.61% 7 2
webmail.illinois.edu 2.07% 8 10
intlconnect.illinois.edu 1.85% 9 -
las.illinois.edu 1.22% 10 -
Facebook.com (#5), ecs.engineering.illinois.edu (#6), search.ask.com (#8), and psychology.illinois.edu (#9) were top ten referrers last year, but not this year.

40
Top Search Terms Used to Reach The Career Center Website
2015-2016 Rank
2014-2015 Rank
ilink 1 2
Sample resume 2 1
ilink uiuc 3 7
uiuc Ilink 4 9
i link uiuc 5 8
resume samples 5 -
view resume samples 7 4
sample resumes 8 -
resume examples 9 3
samples of resumes 10 -
illinois career center 10 -
uiuc career center (#5), career center uiuc (#6) example of a resume (#10) were top ten search terms last year, but not this year.
Hire Illini - www.hireillini.com
Hire Illini Website Traffic 2015-2016 2014-2015 2013-2014
Visits 53,005 29,996 25,479
Unique Visitors 44,946 23,278 18,944
Search Traffic 23,458 16,100 12,750 Direct Traffic 22,916 8,752 7,347
Referral Traffic 6,052 4,423 4,158 Social Referrals 577 721 -
Page Views/Visit 2.41 2.05 1.95
Time on Site 00:01:09 00:01:30 00:02:20
Top Referrers to the Hire Illini Website
Percentage of Referrals
2015-2016 Rank
2014-2015 Rank
ecs.engineering.illinois.edu 7.19% 1 3
careerservices.illinois.edu 5.52% 2 4
international.illinois.edu 4.69% 3 -
illinois.edu 4.53% 4 1
Illinoisksa.org 2.15% 5 2
ece.illinois.edu (#5) was a top five referrer last year, but not this year.

41
INTL Connect - www.intlconnect.illinois.edu
INTL Connect Traffic 2015-2016 2014-2015 2013-2014
Visits 41,066 20,475 18,667
Unique Visitors 35,098 15,276 13,566
Search Traffic 20,235 14,032 10,790 Direct Traffic 19,307 5,175 4,709
Referral Traffic 1,522 826 2,095 Social Referrals 442
Page Views/Visit 1.94 1.68 1.78
Time on Site
00:01:42 00:02:16 00:02:42
Top Referrers to the INTL Connect Website
Percentage of Referrals
2015-2016 Rank
2014-2015 Rank
facebook.com 16.23% 1 2
international.illinois.edu 14.13% 2 9
LinkedIn.com 8.15% 3 5
illinoisksa.org 7.36% 4 1
illinois.edu 6.70% 5 7
isss.illinois.edu 6.24% 6 3
m.facebook.com 5.45% 7 4
cgu.edu 2.17% 8 -
luc.edu 1.77% 9 -
economics.illinois.edu 1.71% 10 -
ecs.engineering.illinois.edu (#6), l.facebook.com (#8), and lnkd.in (#10) were top ten referrers last year, but not this year.
Top Search Terms Used to Reach the INTL Connect Website 2015-2016
Rank 2014-2015
Rank
Companies that sponsor international students 1 1
Companies hiring international students 2
List of companies that sponsor international students 3 4
Companies that hire international students & sponsor h1b 4
Organizations that sponsor international students 5
Intlconnect (#2), companies that hire international students (#3), intlconnect.illinois.edu/companies (#5) were top five search terms last year, but not this year.

42
INTL Connect Visits by Language
Rank 2015-2016
Rank 2014-2015
English (US) 1 1
English (GB) 2 3
Chinese 3 2 Korean 4 4
Spanish 5 5 Portuguese 6 8
French 7 6 Russian 8 9 German 9 10
Taiwanese 10 7
TCC Resource Library – library.careercenter.illinois.edu
TCC Resource Library Traffic 2015-2016 2014-2015 2013-2014
Visits 2,054 2,965 2,221
Unique Visitors 1,376 1,856 1,721
Search Traffic - 191 216 Direct Traffic 1,607 622 916
Referral Traffic 447 2,146 1,089
Page Views/Visit 1.78 2.87 2.29
Time on Site 00:00:52 00:02:59 00:01:34
Illini Success – illinisuccess.illinois.edu (Launched April 19, 2016)
Illini Success Traffic 2015-2016
Visits 8,188
Unique Visitors 6,218
Search Traffic 274 Direct Traffic 3,469
Referral Traffic 627 Social Referrals 1,884
Page Views/Visit 2.27
Time on Site 00:01:43

43
Top 5 Illini Success Pages Number Percent
Home Page 2,836 35%
Annual Reports 2,451 30%
Graduate Success Stories Home 746 9% Get to Know Us 477 6%
“Networking is Key” Success Story 245 3% Top Referrers to Illini Success # (%)Sessions # (%) New Users
1 m.facebook.com 343 (25%) 284 (27%)
2 reddit.com 224 (16%) 180 (17%)
3 facebook.com 205 (15%) 147 (14%)
4 linkedin.com 113 (8%) 96 (9%)
5 t.co 63 (5%) 42 (4%)
6 news.illinois.edu 38 (3%) 11 (1%)
7 lnkd.in 26 (2%) 26 (3%)
8 google.com 24 (2%) 24 (2%)
9 illinoishomepage.net 21 (2%) 9 (1%)
10 nessie.uihr.uillinois.edu 21 (2%) 10 (1%)

44

45
Appendix F
Sample Assessment Reports
(Available Online: www.careercenter.illinois.edu/tcc-impact)

46

47
Appendix G
Presentations and Publications
Presentations
Invited
Makela, J. P. (2016, March). Assessment as storytelling: Understanding needs, communicating value. Invited webinar presentation
for the Association for Christians in Student Development.
Makela, J. P. (2016, April). Career development paraprofessional programs: Telling our story of need, impact, and value. Keynote
presentation for the Missouri Career Development Association conference in Columbia, MO.
Makela, J. P., & Rooney, G. S. (2016, April). From decentralized graduate outcomes collection, to coordinated Illini success. Invited
webinar presentation for the GradLeaders Client Spotlight Series.
Neef, J. (2015, November). Career and professional development for international students. Invited roundtable discussion at the
Midwest Association of Colleges and Employers’ Trends in Recruiting conference in Chicago, IL.
Neighbors, B. E. (2016, April). Connecting with special populations with invisible differences. Panel presentation at Illinois Recruiters
Forum, Champaign, IL.
Rooney, G. S., & Mikell, T. D. (2016. March). Strategic career development for student affairs. Invited presentation for University of
Illinois at Urbana-Champaign Student Affairs Professional Development Committee in Champaign, IL.
Rooney, G. S., Neef, J., & Haycraft, E. (2016, June). Building professional skills: From campus employment to career services. Invited
presentation at the Midwest Association of Student Employment Administrators conference in Champaign, IL.
Submitted
Haycraft, E. & Howard, B.. (2015, December). Careers in the city: Connecting students with alumni off campus. Presented at
Southern Association of Colleges and Employers Annual Conference, Austin, TX.
Haycraft, E. & Knowles, L.. (2015, December). Meet their needs – Career and academic advisors unite! Presented at Southern
Association of Colleges and Employers Annual Conference, Austin, TX.
Makela, J. P., & Hoff, K. (2016, May). College graduates, career services use, and career outcomes: Exploring relationships. Poster
presentation at the Society for Vocational Psychology Biennial Conference in Tallahassee, FL.
Makela, J. P., & Perlus, J. (2016, May). Ethical use of social technologies in counseling and career services: A literature review.
Roundtable presentation at the Society for Vocational Psychology Biennial Conference in Tallahassee, FL.
Makela, J. P., Seo, G., & Perlus, J. (2016, June). Crowd-pleasing data management for career services: Easy, accessible, instant, and
meaningful. Presentation at the 2016 National Career Development Association conference in Chicago, IL.
Mansour, V., Siwiec, A. K., Jones, C. D., Flansburg, J. & Makela, J. P. (2016, June). Ethical development in the workplace: Strategic
ways to facilitate ethical development and behavior. Presentation at the 2016 National Career Development Association
conference in Chicago, IL.
Neef, J., & Madigan, N. (2015, July). Hire Illini: Transforming campus collaboration. Presentation at the Midwest Association of
Colleges and Employers annual conference in Lombard, IL.
Neighbors, B. E., & Sakowski, J. (2016, February). Military to college to career: Collaboration & connections of shared service, multiple
expertise. Presentation at the annual NAPSA Symposium on Military-Connected Students, Orlando, FL.
Ng, J., Zehr, S., & Park, U. Y. (2016, June). Coaching for home country careers. Presentation at the 2016 National Association of
Colleges and Employers Conference in Chicago, IL.
Park, U. Y., & Seo, G. (2015, July). A certificate program for international students: CC-I. Presentation at the 2016 Midwest
Association of Colleges and Employers Conference in Chicago, IL.
Park, U. Y., Seo, G., & Makela, J. P. (2016, June). Career certificate program for international students: Enhancing self-efficacy and job
search skills. Presentation at the 2016 National Career Development Association conference in Chicago, IL.
48
Perlus, J., Makela, J. P., Diaz, R., & Almanza, D. (2016, June). Conexiones: Innovative collaborations to reach underrepresented
populations. Presentation at the 2016 National Career Development Association conference in Chicago, IL.
Perlus, J., Makela, J. P., Scholes, D., Park, U. Y., Seo, G., & Hoff, K. (2016, May). Evaluating the effectiveness of a career certificate
program for international students. Presentation at the Society for Vocational Psychology Biennial Conference in Tallahassee, FL.
Rooney, G. S., & Jaunarajs, I. (2016, June). Career and leadership education: Common ground for meaningful collaboration.
Roundtable presentation at the 2016 National Career Development Association annual conference in Chicago, IL.
Rooney, G. S., Neef, J., & Cox, A. (2015, July). More than student employment: Contributing to student career success with skill
building and story telling. Presentation at the Midwest Association of Colleges and Employers annual conference in Lombard, IL.
Rooney, G. S., & Pipkins, K. C. (2016, May). Back to the basics: Counseling as the foundation of career services. Roundtable
presentation at the Society for Vocational Psychology Biennial Conference, Tallahassee, FL.
Rooney, G. S., & Romano, R. (2016, March). Aligning student affairs and department strategic plans to campus planning: Formula for
success. Poster presentation at the 2016 National Association of Student Personnel Administrators (NASPA) annual conference
in Indianapolis, IN.
Rooney, G. S., Spencer, G., Hoag, B., & Smith, K. (2016, March). Leadership and career education: Connecting for a new vision.
Presentation at the 2016 National Association of Student Personnel Administrators (NASPA) annual conference in Indianapolis,
IN.
Publications
Makela, J. P. (2016, Spring). Ethics in a nutshell: Seeking best practice in client assessment. Career Developments Magazine, 32(2),
27.
Makela, J. P. (2015, December). Ethical foundations and social technologies. Career Convergence. Broken Arrow, OK: National Career
Development Association.
Makela, J. P. (2015, July). Ethical use of social networking technologies in career services [Technical Report]. Broken Arrow, OK:
National Career Development Association.