2015-2016 comprehensive an financial report
TRANSCRIPT

2015-2016 Comprehensive Annual
Financial Report City of Palo Alto, California
FISCAL YEAR ENDED: June 30, 2016


CITY OF PALO ALTO, CALIFORNIA
2015-2016 Comprehensive Annual Financial Report
Fiscal Year Ended June 30, 2016
Prepared by: Administrative Services Department


CITY OF PALO ALTO For the Year Ended June 30, 2016
Table of Contents Page
INTRODUCTORY SECTION:
Transmittal Letter .................................................................................................................................... i
City Officials ........................................................................................................................................... vi
Organizational Structure ....................................................................................................................... vii
Administrative Services Organization .................................................................................................. viii
GFOA Certificate of Achievement for Excellence in Financial Reporting ............................................... ix
FINANCIAL SECTION:
Independent Auditor’s Report .............................................................................................................. 1
Management’s Discussion and Analysis
(Required Supplementary Information – Unaudited) ...................................................................... 5
Basic Financial Statements
Government‐wide Financial Statements:
Statement of Net Position ....................................................................................................... 29
Statement of Activities ............................................................................................................ 31
Governmental Fund Financial Statements:
Balance Sheet .......................................................................................................................... 33
Reconciliation of the Balance Sheet of Governmental Funds to
the Statement of Net Position ‐ Governmental Activities ................................................. 34
Statement of Revenues, Expenditures and Changes in Fund Balances .................................. 35
Reconciliation of the Statement of Revenues, Expenditures and Changes
in Fund Balances of Governmental Funds to the Statement of Activities –
Governmental Activities ................................................................................................... 36
Statement of Revenues, Expenditures and Changes in Fund Balance –
Budget and Actual – General Fund ................................................................................... 37
Proprietary Fund Financial Statements:
Statement of Net Position ....................................................................................................... 38
Statement of Revenues, Expenses and Changes in Fund Net Position ................................... 40
Statement of Cash Flows ......................................................................................................... 42
Fiduciary Fund Financial Statement:
Statement of Fiduciary Net Position ....................................................................................... 44
Index to the Notes to the Basic Financial Statements ................................................................. 45
Notes to the Basic Financial Statements ...................................................................................... 47
Required Supplementary Information:
Schedule of Changes in Net Pension Liability and related Ratios – Miscellaneous Plan ............. 105
Schedule of Contributions – Miscellaneous Plan ......................................................................... 106

CITY OF PALO ALTO For the Year Ended June 30, 2016
Table of Contents (Continued)
Page
Required Supplementary Information:
Schedule of Changes in Net Pension Liability and Related Ratios – Safety Plan ......................... 107
Schedule of Contributions – Safety Plan ...................................................................................... 108
Supplementary Information:
Non‐Major Governmental Funds:
Combining Balance Sheet ...................................................................................................... 109
Combining Statement of Revenues, Expenditures and
Changes in Fund Balances ............................................................................................... 111
Non‐Major Special Revenue Funds:
Combining Balance Sheet ...................................................................................................... 114
Combining Statement of Revenues, Expenditures and
Changes in Fund Balances ............................................................................................... 116
Combining Schedule of Revenues, Expenditures and
Changes in Fund Balances – Budget and Actual ............................................................. 118
Non‐Major Debt Service Funds:
Combining Balance Sheet ...................................................................................................... 124
Combining Statement of Revenues, Expenditures and
Changes in Fund Balances ............................................................................................... 125
Combining Schedule of Revenues, Expenditures and
Changes in Fund Balances – Budget and Actual ............................................................. 126
Non‐Major Permanent Fund:
Schedule of Revenues, Expenditures and
Changes in Fund Balances – Budget and Actual ............................................................. 128
Internal Service Funds:
Combining Statement of Fund Net Position .......................................................................... 130
Combining Statement of Revenues, Expenses and
Changes in Fund Net Position ......................................................................................... 131
Combining Statement of Cash Flows ..................................................................................... 132
Fiduciary Funds:
Statement of Changes in Assets and Liabilities – All Agency Funds ...................................... 134
STATISTICAL SECTION:
Financial Trends:
Net Position by Component ......................................................................................................... 137
Changes in Net Position ............................................................................................................... 138

CITY OF PALO ALTO For the Year Ended June 30, 2016
Table of Contents (Continued)
Page
STATISTICAL SECTION:
Financial Trends:
Fund Balances of Governmental Funds ....................................................................................... 140
Changes in Fund Balances of Governmental Funds ..................................................................... 142
Revenue Capacity:
Electric Operating Revenue by Source ......................................................................................... 143
Supplemental Disclosure for Water Utilities ............................................................................... 144
Assessed Value of Taxable Property ............................................................................................ 145
Property Tax Rates, All Overlapping Governments ..................................................................... 146
Property Tax Levies and Collections ............................................................................................ 147
Principal Property Taxpayers ....................................................................................................... 148
Assessed Valuation and Parcels by Land Use .............................................................................. 149
Per Parcel Assessed Valuation of Single Family Residential ........................................................ 150
Debt Capacity:
Ratio of Outstanding Debt by Type .............................................................................................. 151
Computation of Direct and Overlapping Debt ............................................................................. 152
Computation of Legal Bonded Debt Margin ................................................................................ 153
Revenue Bond Coverage .............................................................................................................. 154
Demographic and Economic Information:
Taxable Transactions by Type of Business ................................................................................... 155
Demographic and Economic Statistics ......................................................................................... 156
Principal Employers...................................................................................................................... 157
Operating Information:
Operating Indicators by Function/Program ................................................................................. 158
Capital Asset Statistics by Function/Program .............................................................................. 160
Full‐Time Equivalent City Government Employees by Function .................................................. 162
SINGLE AUDIT SECTION:
Index to the Single Audit Report .................................................................................................. 163
Independent Auditor’s Report on Internal Control Over Financial Reporting and
on Compliance and Other Matters Based on an Audit of Financial Statements
Performed in Accordance With Government Auditing Standards ........................................ 165
Independent Auditor’s Report on Compliance for Each Major Program and
Report on Internal Control Over Compliance Required by Uniform Guidance .................... 167
Schedule of Expenditures of Federal Awards .............................................................................. 169
Notes to the Schedule of Expenditures of Federal Awards ......................................................... 170
Schedule of Findings and Questioned Costs ................................................................................ 171
Schedule of Prior Years Findings and Questioned Costs ............................................................. 172


Introduction
………………………………………………….……………………… City of Palo Alto i
Transmittal Letter…………………………………………………...…
November 2, 2016
THE HONORABLE CITY COUNCIL
Palo Alto, California Attention: Finance Committee
COMPREHENSIVE ANNUAL FINANCIAL REPORT
YEAR ENDED JUNE 30, 2016
Members of the Council and Citizens of Palo Alto: I am pleased to present the Comprehensive Annual Financial Report (CAFR) for the fiscal year ended June 30, 2016 in accordance with Article III, Section 16 and Article IV, Section 13 of the City of Palo Alto Charter. The format and content of this CAFR complies with the principles and standards of accounting and financial reporting adopted by the Governmental Accounting Standards Board (GASB), and contains all information needed for readers to gain a reasonable understanding of City of Palo Alto financial affairs. Management takes sole responsibility for the completeness and reliability of the information contained in this report, based upon a comprehensive framework of internal control that it has established for this purpose. The objective of internal controls is to provide reasonable, rather than absolute, assurance that the financial statements are free of any material misstatements. The City of Palo Alto’s financial statements have been audited by Macias Gini & O’Connell LLP, Certified Public Accountants. The goal of the audit is to obtain reasonable assurance that the financial statements are free of material misstatements and are fairly presented in conformity with generally accepted accounting principles (GAAP). Macias Gini & O’Connell issued an unmodified opinion for the fiscal year ended June 30, 2016 audit. Their report is presented as the first component of the financial section of this report. In addition, Macias Gini & O’Connell conducted the federally mandated “Single Audit” designed to meet the special needs of federal grantor agencies. The standards governing the Single Audit require the independent auditor to report on the fair presentation of the financial statements, government’s internal controls and compliance with legal requirements. These reports are included in the Single Audit section of the CAFR.
City of Palo Alto Office of the City Manager

Introduction
…………………………………….…………………………………. ii City of Palo Alto
An overview of the City’s financial activities for the fiscal year is discussed in detail in the Management’s Discussion and Analysis (MD&A) section of the CAFR. MD&A complements this transmittal letter and should be read in conjunction with it.
CITY OF PALO ALTO PROFILE
Palo Alto was incorporated in 1894 and named after a majestic coastal redwood tree which lives along the San Francisquito Creek where early Spanish explorers settled. Located between the cities of San Francisco and San Jose, Palo Alto is a largely built‐out community of approximately 67,000 residents. Palo Alto delivers a full range of municipal services and public utilities under the Council‐Manager form of government, and offers an outstanding quality of life for its residents. It covers an area of twenty‐six square miles, and has dedicated almost one‐half of the area to open spaces of parks and wildlife preserves. Public facilities include five libraries, four community centers, a cultural arts center, an adult and children’s theater, a junior museum and zoo, and a golf course. The City provides a diverse array of services for seniors and youth, an extensive continuing education program, concerts, exhibits, team sports and special events. The independent Palo Alto Unified School District (PAUSD) has achieved state and national recognition for the excellence of its programs. City Council: Council consists of nine members elected at‐large for four year staggered terms. At the first meeting of each calendar year, Council elects a Mayor and Vice‐Mayor from its membership, with the Mayor having the duty of presiding over Council meetings. Council is the appointing authority for the positions of City Manager and three other officials, the City Attorney, City Clerk, and City Auditor, all of whom report to Council. Effective January 1, 2019, Council will be reduced from nine to seven members. Finance Committee and Policy and Services Committee: While retaining the authority to approve all actions, Council has established two subcommittees to consider and make recommendations on matters relating to finance, budget, audits, capital planning and debt. Each of the subcommittees are comprised of four Council members. Staff provides the subcommittees and Council with reports such as the CAFR, quarterly budget‐versus‐actual results, and investment and performance measure reports, all of which are utilized in their review of the City’s financial position.
FISCAL/ECONOMIC CONDITIONS AND OUTLOOK
Employment Trends: The City of Palo Alto is located in the heart of Silicon Valley and is adjacent to Stanford University, one of the premier institutions of higher education in the nation which has produced much of the talent that founded many successful high‐tech companies in Palo Alto and Silicon Valley. With varied and relatively stable employers such as Stanford University, Stanford Medical Center, Palo Alto Medical Foundation, Palo Alto Unified School District, Stanford Shopping Center and businesses such as Hewlett‐Packard, VMware, Tesla, Palantir and Space Systems Loral, Palo Alto has enjoyed diverse employment and revenue bases. The City’s unemployment rate ended the year at 2.8 percent, 0.1 percent higher than the prior year. This compares to Santa Clara County’s unemployment rate of 4.0 percent, and the state’s unemployment rate of 5.7 percent.
Introduction
………………………………………………….……………………… City of Palo Alto iii
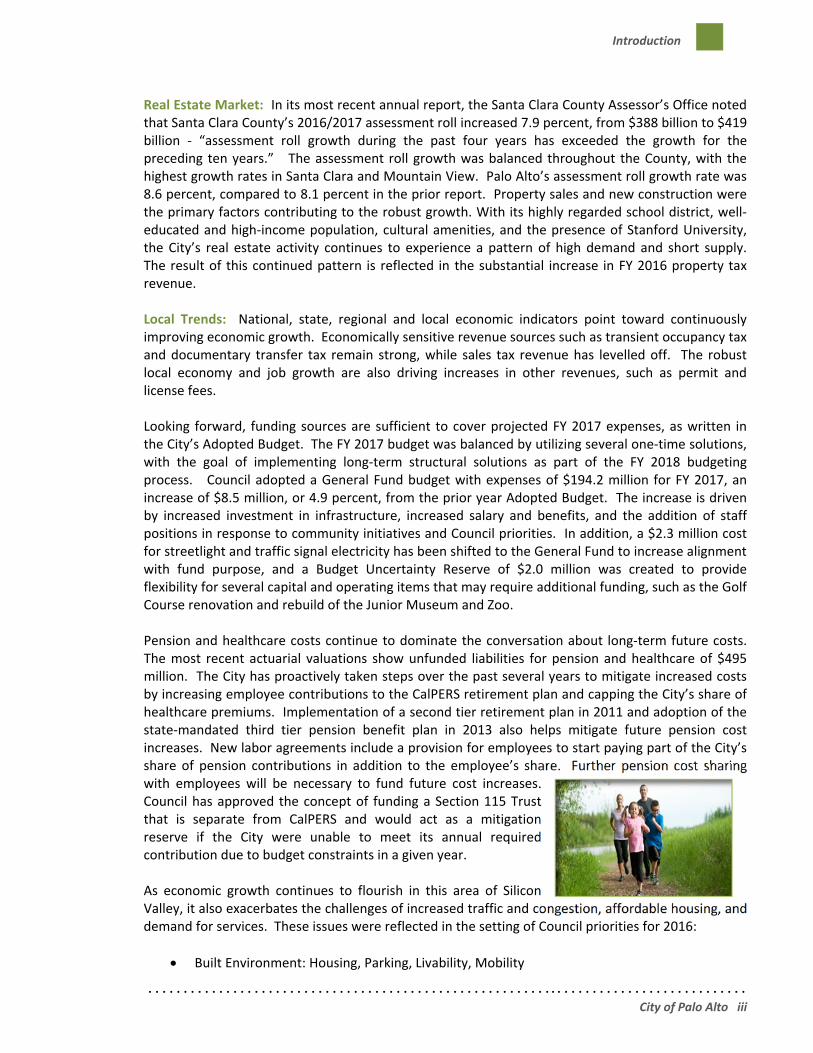
Real Estate Market: In its most recent annual report, the Santa Clara County Assessor’s Office noted that Santa Clara County’s 2016/2017 assessment roll increased 7.9 percent, from $388 billion to $419 billion ‐ “assessment roll growth during the past four years has exceeded the growth for the preceding ten years.” The assessment roll growth was balanced throughout the County, with the highest growth rates in Santa Clara and Mountain View. Palo Alto’s assessment roll growth rate was 8.6 percent, compared to 8.1 percent in the prior report. Property sales and new construction were the primary factors contributing to the robust growth. With its highly regarded school district, well‐educated and high‐income population, cultural amenities, and the presence of Stanford University, the City’s real estate activity continues to experience a pattern of high demand and short supply. The result of this continued pattern is reflected in the substantial increase in FY 2016 property tax revenue. Local Trends: National, state, regional and local economic indicators point toward continuously improving economic growth. Economically sensitive revenue sources such as transient occupancy tax and documentary transfer tax remain strong, while sales tax revenue has levelled off. The robust local economy and job growth are also driving increases in other revenues, such as permit and license fees. Looking forward, funding sources are sufficient to cover projected FY 2017 expenses, as written in the City’s Adopted Budget. The FY 2017 budget was balanced by utilizing several one‐time solutions, with the goal of implementing long‐term structural solutions as part of the FY 2018 budgeting process. Council adopted a General Fund budget with expenses of $194.2 million for FY 2017, an increase of $8.5 million, or 4.9 percent, from the prior year Adopted Budget. The increase is driven by increased investment in infrastructure, increased salary and benefits, and the addition of staff positions in response to community initiatives and Council priorities. In addition, a $2.3 million cost for streetlight and traffic signal electricity has been shifted to the General Fund to increase alignment with fund purpose, and a Budget Uncertainty Reserve of $2.0 million was created to provide flexibility for several capital and operating items that may require additional funding, such as the Golf Course renovation and rebuild of the Junior Museum and Zoo. Pension and healthcare costs continue to dominate the conversation about long‐term future costs. The most recent actuarial valuations show unfunded liabilities for pension and healthcare of $495 million. The City has proactively taken steps over the past several years to mitigate increased costs by increasing employee contributions to the CalPERS retirement plan and capping the City’s share of healthcare premiums. Implementation of a second tier retirement plan in 2011 and adoption of the state‐mandated third tier pension benefit plan in 2013 also helps mitigate future pension cost increases. New labor agreements include a provision for employees to start paying part of the City’s share of pension contributions in addition to the employee’s share. Further pension cost sharing with employees will be necessary to fund future cost increases. Council has approved the concept of funding a Section 115 Trust that is separate from CalPERS and would act as a mitigation reserve if the City were unable to meet its annual required contribution due to budget constraints in a given year. As economic growth continues to flourish in this area of Silicon Valley, it also exacerbates the challenges of increased traffic and congestion, affordable housing, and demand for services. These issues were reflected in the setting of Council priorities for 2016:
Built Environment: Housing, Parking, Livability, Mobility

Introduction
…………………………………….…………………………………. iv City of Palo Alto
Infrastructure
Healthy City, Healthy Community
Completion of the Comprehensive Plan update
In keeping with these priorities, Council has approved implementation of strategies to address traffic congestion in the City: parking management (Residential Preferential Parking program, parking technology enhancements, garage wayfinding signage), transportation demand management (Transportation Management Association, enhanced shuttle services, CalTrain GoPass program for employees), and short and long‐term parking supply strategies (valet parking, construction of new garages). Council approved a $125.8 million Infrastructure Plan, which includes projects such as a new Public Safety Building, replacement of two Fire Stations, a Bike and Pedestrian plan, and two parking garages. These projects will be funded partially by debt to be repaid with an increase in the transient occupancy tax (TOT) rate which went into effect in January 2015, TOT from newly opened hotels, and from other sources such as impact fees and Stanford University Medical Center development agreement monies. The Plan was recently updated for scope increases and cost escalations, and a reserve of $30 million for unanticipated costs and contingencies was added, resulting in a revised Infrastructure Plan of $160 million. As a result of sound fiscal management and reserve policies, General Fund surpluses from FY 2012 through FY 2016 totaling $32.6 million were transferred to the Infrastructure Reserve. An additional $4.3 million from the FY 2016 surplus is proposed for transfer to the Infrastructure Reserve in FY 2017, for a total contribution of surplus funds of $36.9 million over six years. Rate increases will take effect in FY 2017 for electric, gas, water, wastewater, storm drain, and refuse services. Increases are necessary due to increased costs resulting from the prolonged drought and water conservation measures, treatment plant rehabilitation costs, and expanded recycling services. Long Range Financial Forecast: The City produces a 10 year General Fund Long Range Financial Forecast (LRFF) annually. This comprehensive report analyzes local, state, and federal economic conditions, short and long‐term revenue and expense trends, and addresses challenges such as funding long‐term pension and healthcare liabilities and infrastructure needs. The forecast is designed to highlight finance issues which the City can address proactively. Moreover, it is a tool that allows policymakers an opportunity to prioritize funding needs over time. It sets the tone for the annual budget process and is one of the many tools and reports that Council uses for financial planning. The most recent LRFF indicates a financial shift downward for FY 2017 and out years due to rising pension and healthcare costs and increasing costs for Infrastructure Plan projects. The City maintains a General Fund Budget Stabilization Reserve (BSR) level of 15 to 20 percent of the General Fund operating budget, with a targeted goal of 18.5 percent. Council approval is required to set this reserve balance lower than 15 percent. As of June 30, 2016 the BSR balance is $51.6 million, of which $2.1 million has been approved by Council to set aside for establishment of a pension trust fund. Staff will bring forward recommendations for a further $7.9 million of proposed BSR uses as part of the FY 2016 year‐end close process. The remaining balance of $41.6 million represents 21.4 percent of FY 2017 expenditures, and is $5.7 million more than the 18.5 percent target balance for the BSR.

Introduction
………………………………………………….……………………… City of Palo Alto v
Both Moody’s and Standard and Poor’s (S&P) awarded their highest credit rating of Triple A to the City’s general obligation debt. This rating has been awarded to only a few cities in California. SIGNIFICANT EVENTS AND ACCOMPLISHMENTS
The City of Palo Alto is a community dedicated to meeting the social, cultural, recreational, educational, commercial and retail needs of its citizens and businesses. As such, open space, education, recreational facilities, cultural events and safe streets and neighborhoods are important aspects of the community and the City has been recognized for its accomplishments with a wide variety of awards and recognitions over the past year. Following is a sampling of those awards:
Awarded gold level status as a Bicycle Friendly Community by the League of American Bicyclists based on a strong commitment to bicycling evidenced by major streets with bike lanes, high ratio of bike network mileage to road network mileage, and Bike to Work events;
Earned a spot on the national Top 10 utility solar list compiled by the Smart Electric Power Alliance in recognition of third place for “Watts per Customer” installed in 2015; and
Awarded Tree Line USA award by the National Arbor Day Foundation in recognition of the Utilities exceeding the standard criteria for quality tree care, annual worker training, tree planting and public education, a tree‐based energy conservation program, and an Arbor Day celebration.
Awards: During the past year, the City received an award for the prior fiscal year CAFR from the Government Finance Officers Association (GFOA) for “excellence in financial reporting.” The 2016 CAFR will be submitted to the GFOA award program to be considered for this distinguished financial reporting award. Acknowledgments: This CAFR reflects the hard work, talent and commitment of the staff members of the Administrative Services Department. This document could not have been accomplished without their efforts and each contributor deserves sincere appreciation. Management wishes to acknowledge the support of Laura Kuryk, Accounting Manager, and the entire accounting staff for their high level of professionalism and dedication. Management would also like to express its appreciation to Macias Gini & O’Connell, the City’s independent external auditors, who assisted and contributed to the preparation of this Comprehensive Annual Financial Report. Special acknowledgment must be given to City Council and the Finance and Policy and Services Committees for their dedication to directing the financial affairs of the City in a responsible, professional and progressive manner. Respectfully submitted,
LALO PEREZ, JAMES KEENE, Chief Financial Officer City Manager
Introduction
…………………………………….…………………………………. vi City of Palo Alto
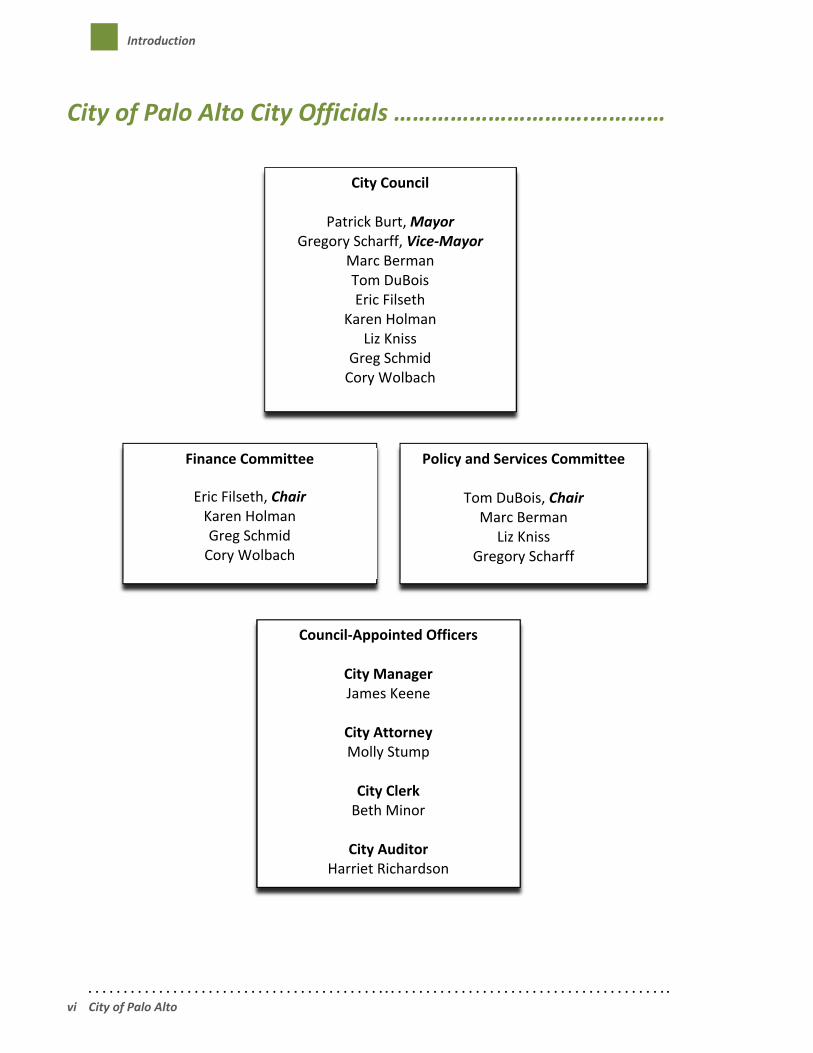
City of Palo Alto City Officials ………………………….…………
Finance Committee
Eric Filseth, Chair Karen Holman Greg Schmid Cory Wolbach
Policy and Services Committee
Tom DuBois, Chair Marc Berman
Liz Kniss Gregory Scharff
Council‐Appointed Officers
City Manager James Keene
City Attorney Molly Stump
City Clerk Beth Minor
City Auditor
Harriet Richardson
City Council
Patrick Burt, Mayor Gregory Scharff, Vice‐Mayor
Marc Berman Tom DuBois Eric Filseth
Karen Holman Liz Kniss
Greg Schmid Cory Wolbach
Introduction
………………………………………………….……………………… City of Palo Alto vii
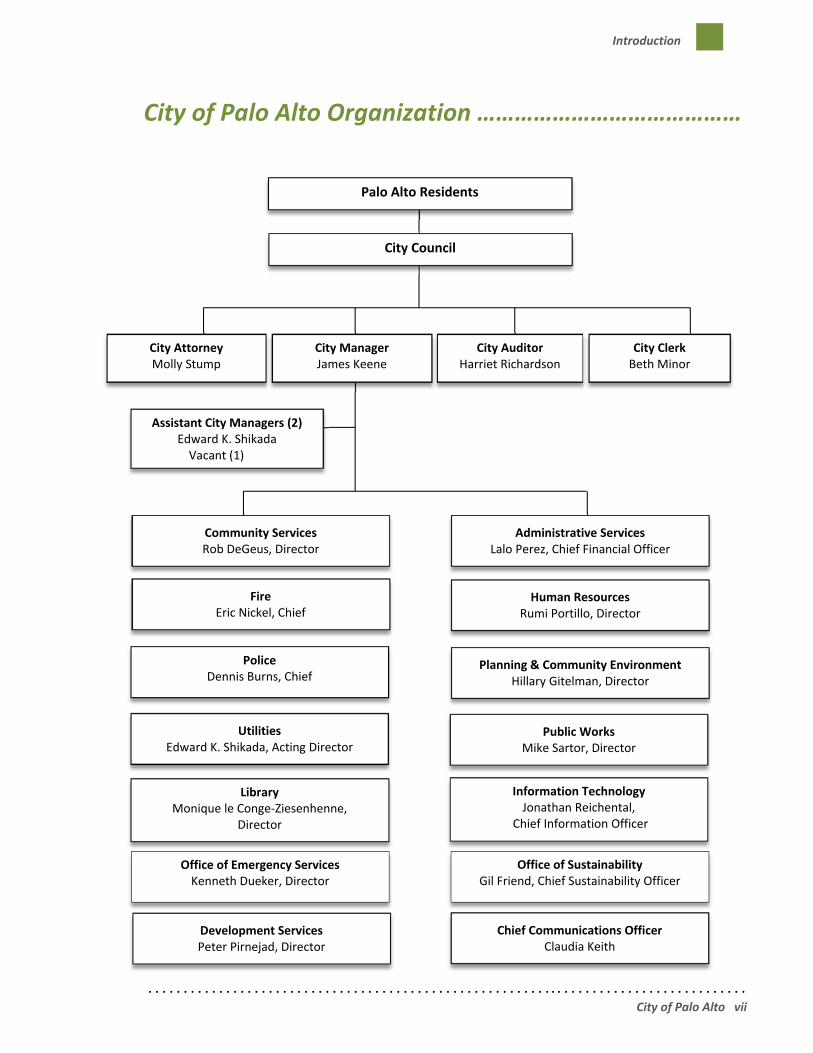
Assistant City Managers (2) Edward K. Shikada Vacant (1)
City Attorney Molly Stump
City ManagerJames Keene
City AuditorHarriet Richardson
City ClerkBeth Minor
City of Palo Alto Organization ……………………………………
Palo Alto Residents
City Council
Community Services Rob DeGeus, Director
Administrative Services Lalo Perez, Chief Financial Officer
Fire Eric Nickel, Chief
Human Resources Rumi Portillo, Director
Police Dennis Burns, Chief
Planning & Community Environment Hillary Gitelman, Director
Utilities Edward K. Shikada, Acting Director
Public Works Mike Sartor, Director
Library Monique le Conge‐Ziesenhenne,
Director
Development Services Peter Pirnejad, Director
Chief Communications Officer Claudia Keith
Office of Emergency ServicesKenneth Dueker, Director
Office of Sustainability Gil Friend, Chief Sustainability Officer
Information Technology Jonathan Reichental,
Chief Information Officer

Introduction
…………………………………….…………………………………. viii City of Palo Alto
Administrative Services Organization ………
Administrative Division Treasury Division
Accounting Division Budget Division
Purchasing Division Real Estate Division
Mission Statement
To provide proactive administrative and technical support to
City departments and decision makers, and to safeguard and
facilitate the optimal use of City resources.
Administrative Services Department
Introduction
………………………………………………….……………………… City of Palo Alto ix
Government Finance Officers Association of the United States and Canada – Award ……


Century City
Los Angeles
Newport Beach
Oakland
Sacramento
San Diego
San Francisco
Walnut Creek
Woodland Hills
www.mgocpa.com Macias Gini & O’Connell LLP 2121 N. California Boulevard, Suite 750 Walnut Creek, CA 94596
1
Independent Auditor’s Report
Honorable Mayor and the Members of the City Council of City of Palo Alto, California
Report on the Financial Statements
We have audited the accompanying financial statements of the governmental activities, the business-type activities, each major fund, and the aggregate remaining fund information of the City of Palo Alto, California (City), as of and for the year ended June 30, 2016, and the related notes to the financial statements, which collectively comprise the City’s basic financial statements as listed in the table of contents.
Management’s Responsibility for the Financial Statements
Management is responsible for the preparation and fair presentation of these financial statements in accordance with accounting principles generally accepted in the United States of America; this includes the design, implementation, and maintenance of internal control relevant to the preparation and fair presentation of financial statements that are free from material misstatement, whether due to fraud or error.
Auditor’s Responsibility
Our responsibility is to express opinions on these financial statements based on our audit. We conducted our audit in accordance with auditing standards generally accepted in the United States of America and the standards applicable to financial audits contained in Government Auditing Standards, issued by the Comptroller General of the United States. Those standards require that we plan and perform the audit to obtain reasonable assurance about whether the financial statements are free from material misstatement.
An audit involves performing procedures to obtain audit evidence about the amounts and disclosures in the financial statements. The procedures selected depend on the auditor’s judgment, including the assessment of the risks of material misstatement of the financial statements, whether due to fraud or error. In making those risk assessments, the auditor considers internal control relevant to the entity’s preparation and fair presentation of the financial statements in order to design audit procedures that are appropriate in the circumstances, but not for the purpose of expressing an opinion on the effectiveness of the entity’s internal control. Accordingly, we express no such opinion. An audit also includes evaluating the appropriateness of accounting policies used and the reasonableness of significant accounting estimates made by management, as well as evaluating the overall presentation of the financial statements.
We believe that the audit evidence we have obtained is sufficient and appropriate to provide a basis for our audit opinions.

2
Opinions
In our opinion, the financial statements referred to above present fairly, in all material respects, the respective financial position of the governmental activities, the business-type activities, each major fund, and the aggregate remaining fund information of the City as of June 30, 2016, and the respective changes in financial position, and, where applicable, cash flows thereof and the respective budgetary comparison for the General Fund for the year then ended in accordance with accounting principles generally accepted in the United States of America.
Other Matters
Required Supplementary Information
Accounting principles generally accepted in the United States of America require that the management’s discussion and analysis, the schedules of changes in the net pension liability and related ratios and the schedules of contributions, as listed in the table of contents, be presented to supplement the basic financial statements. Such information, although not a part of the basic financial statements, is required by the Governmental Accounting Standards Board who considers it to be an essential part of financial reporting for placing the basic financial statements in an appropriate operational, economic, or historical context. We have applied certain limited procedures to the required supplementary information in accordance with auditing standards generally accepted in the United States of America, which consisted of inquiries of management about the methods of preparing the information and comparing the information for consistency with management’s responses to our inquiries, the basic financial statements, and other knowledge we obtained during our audit of the basic financial statements. We do not express an opinion or provide any assurance on the information because the limited procedures do not provide us with sufficient evidence to express an opinion or provide any assurance.
Other Information
Our audit was conducted for the purpose of forming opinions on the financial statements that collectively comprise the City’s basic financial statements. The introductory section, combining and individual nonmajor fund financial statements and schedules, statistical section and the schedule of expenditures of federal awards, as required by Title 2 U.S. Code of Federal Regulations Part 200, Uniform Administrative Requirements, Cost Principles, and Audit Requirements for Federal Awards,, are presented for purposes of additional analysis and are not a required part of the basic financial statements.
The combining and individual nonmajor fund financial statements and schedules and the schedule of expenditures of federal awards are the responsibility of management and were derived from and relate directly to the underlying accounting and other records used to prepare the basic financial statements. Such information has been subjected to the auditing procedures applied in the audit of the basic financial statements and certain additional procedures, including comparing and reconciling such information directly to the underlying accounting and other records used to prepare the basic financial statements or to the basic financial statements themselves, and other additional procedures in accordance with auditing standards generally accepted in the United States of America. In our opinion, the combining and individual nonmajor fund financial statements and schedules and the schedule of expenditures of federal awards are fairly stated, in all material respects, in relation to the basic financial statements as a whole.
The introductory and statistical sections have not been subjected to the auditing procedures applied in the audit of the basic financial statements, and accordingly, we do not express an opinion or provide any assurance on them.

3
Other Reporting Required by Government Auditing Standards
In accordance with Government Auditing Standards, we have also issued our report dated November 2, 2016 on our consideration of the City’s internal control over financial reporting and on our tests of its compliance with certain provisions of laws, regulations, contracts, and grant agreements and other matters. The purpose of that report is to describe the scope of our testing of internal control over financial reporting and compliance and the results of that testing, and not to provide an opinion on internal control over financial reporting or on compliance. That report is an integral part of an audit performed in accordance with Government Auditing Standards in considering the City’s internal control over financial reporting and compliance.
Walnut Creek, California November 2, 2016

4
This page is left intentionally blank.

Management’s Discussion and Analysis
………………………………………………………..……….……………………………………… City of Palo Alto 5
Management’s Discussion and Analysis
Management’s Discussion and Analysis (MD&A) provides an overview of the City of Palo Alto’s financial performance for the fiscal year ended June 30, 2016. To obtain a complete understanding of the City’s financial condition, this document should be read in conjunction with the accompanying Transmittal Letter and Basic Financial Statements.
Financial Highlights
The assets and deferred outflows of resources of the City of Palo Alto (City) exceeded its liabilities anddeferred inflows of resources at the close of Fiscal Year (FY) 2016 by $1,190.8 million. Of this amount,$200.7 million represents unrestricted net position, which may be used to meet the government’songoing obligations to citizens and creditors.
At the close of FY 2016, the City’s governmental funds reported combined fund balances of $245.7million, an increase of $21.1 million from prior year. Approximately 21.0 percent of this amount, or$51.6 million, is unassigned fund balance and available for spending at the government’s discretion.
At the end of the current fiscal year, unrestricted fund balance (the total of the committed, assignedand unassigned components of fund balance) for the General Fund was $59.8 million, or 33.3 percentof total general fund expenditures, including transfers.
The City’s total outstanding long‐term debt decreased by $11.4 million during the current fiscal yeardue to scheduled debt retirement in the amount of $6.3 million and defeased debt of $5.1 million.
OVERVIEW OF THE COMPREHENSIVE ANNUAL FINANCIAL REPORT (CAFR) The CAFR is presented in six sections:
An introductory section that includes the Transmittal Letter and general information
Management’s Discussion and Analysis
The Basic Financial Statements that include the Government‐wide and Fund FinancialStatements, along with the Notes to these statements
Supplemental Information
Statistical Information
Single Audit

Management’s Discussion and Analysis
……….…………………………………………………………………..…………………………… City of Palo Alto 6
Basic Financial Statements The Basic Financial Statements contain the Government‐wide Financial Statements, the Fund Financial Statements and the Notes to these financial statements. This report also includes supplementary information intended to furnish additional detail to support the Basic Financial Statements. For certain entities and funds, the City acts solely as a depository agent. For example, the City has several Assessment Districts for which it produces fiduciary statements detailing the cash balances and activities of these districts. These entities are independent, and their balances are excluded from the City’s government‐wide financial statements.
Government‐wide Financial Statements The Government‐wide Financial Statements provide a longer‐term view of the City’s activities as a whole. They include the Statement of Net Position and the Statement of Activities. The Statement of Net Position includes the City’s capital assets and long‐term liabilities on a full accrual basis of accounting similar to that used by private sector companies. Over time, increases or decreases in net position may serve as a useful indicator of whether the financial position of the City is improving or deteriorating. The Statement of Activities provides information about the City’s revenues and expenses on a full accrual basis, with an emphasis on measuring net revenues or expenses for each of the City’s programs. The Statement of Activities explains in detail the change in net position for the year. All changes in net position are reported as soon as the underlying event giving rise to the change occurs, regardless of the timing of related cash flows. The amounts in the Statement of Net Position and the Statement of Activities are separated into Governmental and Business‐type Activities in order to provide a summary of each type of activity. Governmental Activities ‐ All of the City’s basic services are considered to be governmental activities. Included in basic services are the City Council, City Manager, City Attorney, City Clerk, City Auditor, Administrative Services, Human Resources, Public Works, Planning and Community Environment, Development Services, Public Safety, Community Services, and Library. These services are supported by general City revenues such as taxes, and by specific program revenues such as fees and grants. The City’s governmental activities also include the activities of the Palo Alto Public Improvement Corporation, which is a separate legal entity financially accountable to the City. Business‐type Activities ‐ All of the City’s enterprise activities are reported as business‐type activities, including Water, Electric, Fiber Optics, Gas, Wastewater Collection, Wastewater Treatment, Refuse, Storm Drainage and Airport. Unlike governmental services, these services are intended to recover all or a significant portion of their costs through user fees and charges, except for the Airport which is currently supported by a long‐term advance from the General Fund, as discussed in Note 4. The Government‐wide Financial Statements can be found on pages 29‐31 of this report.

Management’s Discussion and Analysis
……………………………….…………..…………………………………………………………… City of Palo Alto 7
Fund Financial Statements The Fund Financial Statements provide detailed information about each of the City’s most significant funds, called major funds. The concept of major funds, and the determination of which are major funds, was established by Governmental Accounting Standards Board (GASB) Statement No. 34 and replaced the concept of combining like funds and presenting them in total. Therefore, each major fund is presented individually, with all non‐major funds combined in a single column on each fund statement. Subordinate schedules display these non‐major funds in more detail. Major funds present the major activities of the City for the year. The General Fund is always considered a major fund, but other funds may change from year to year as a result of changes in the pattern of City activities. The Fund Financial Statements display the City’s operations in more detail than the Government‐wide Financial Statements. Their focus is primarily on the short‐term activities of the City’s General Fund and other major funds such as Capital Projects, Water Services, Electric Services, Fiber Optics, Gas Services, Wastewater Collection Services, Wastewater Treatment Services, Refuse Services and Storm Drainage Services. Budget and actual financial comparison information is presented only for the General Fund. Fund Financial Statements include Governmental, Enterprise, Internal Service and Agency Funds. Governmental Funds Governmental Fund Financial Statements are prepared on the modified accrual basis of accounting, which means they measure only current financial resources and uses. Capital assets and other long‐lived assets, along with long‐term liabilities, are presented only in the Government‐wide Financial Statements. In FY 2016, the City had two major governmental funds, the General Fund and the Capital Projects Fund. Data from the other governmental funds are combined into a single aggregated presentation. Individual fund data for each of these non‐major governmental funds is provided in the Supplemental section of this report. Because the focus of governmental funds is narrower than that of the Government‐wide Financial Statements, it is useful to compare the information presented for governmental funds with similar information presented for governmental activities in the Government‐wide Financial Statements. By doing so, readers may better understand the long‐term impact of the government’s near‐term financing decisions. Both the Governmental Fund Balance Sheet and the Governmental Fund Statement of Revenues, Expenditures and Changes in Fund Balances provide a reconciliation to facilitate this comparison between governmental funds and governmental activities. The Governmental Fund Financial Statements can be found on pages 33‐37 of this report. Proprietary Funds Enterprise and Internal Service Fund Financial Statements are prepared on the full accrual basis of accounting, similar to that used by private sector companies. These statements include all of their assets, deferred outflows and inflows of resources, and liabilities, both current and long‐term. Since the City’s Internal Service Funds provide goods and services exclusively to the City’s governmental and business‐type activities, their activities are only reported in total at the fund level. Internal Service Funds, such as Technology and General Benefits, cannot be considered major funds because their revenues are derived from other City funds. Revenues between funds are eliminated in the Government‐wide Financial

Management’s Discussion and Analysis
…………………………..……….…………………………………………………………………… City of Palo Alto 8
Statements, and any related profits or losses in Internal Service Funds are returned to the activities in which they were created, along with any residual net assets of the Internal Service Funds.
The Proprietary Fund Financial Statements can be found on pages 38‐43 of this report.
Fiduciary Funds
The City is the fiduciary agent for certain assessment districts such as the University Avenue Area Off‐Street Parking Assessment District. In this role, the City holds money collected from property owners and awaiting transfer to the districts’ bond trustees. The City’s fiduciary activities are reported in the separate Statement of Fiduciary Net Position and the supplemental Agency Funds Statement of Changes in Assets and Liabilities. These activities are excluded from the City’s other financial statements because the City cannot utilize these assets to finance its own operations.
The Fiduciary Fund Financial Statements can be found on page 44 of this report.
Notes to the Financial Statements The Notes provide additional information that is necessary to acquire a full understanding of the data provided in the Government‐wide and Fund Financial Statements. The Notes to the financial statements can be found on pages 47‐103 of this report.
Other Information The Required Supplementary Information related to the City’s pension plans is included after the Notes to the Financial Statements on pages 105‐108. The combining statements referred to earlier in connection with non‐major Governmental Funds and Internal Service Funds are presented immediately following the Required Supplementary Information. Combining statements and individual fund statements and schedules can be found on pages 109‐134 of this report.

Management’s Discussion and Analysis
………………………………….…………………………………………………………………… City of Palo Alto 9
Financial Analysis of Government‐wide Financial Statements This section focuses on the City’s net position and changes in net position of its governmental and business‐type activities for the fiscal year ending June 30, 2016. As noted earlier, the City’s total assets and deferred outflows of resources exceed total liabilities and deferred inflows of resources by $1,190.8 million at the end of the fiscal year, an improvement in net position of $59.1 million.
STATEMENT OF NET POSITION
As of June 30, 2016
(in millions)
2016 2015 2016 2015 2016 2015
Cash and investments 295.0$ 280.9$ 244.7$ 253.7$ 539.7$ 534.6$
Other assets 62.3 57.2 35.3 39.2 97.6 96.4
Capital assets 496.0 485.2 576.8 558.5 1,072.8 1,043.7
Total Assets 853.3 823.3 856.8 851.4 1,710.1 1,674.7
Unamortized loss from refunding ‐ ‐ 0.3 0.4 0.3 0.4
Pension related 21.2 19.2 9.4 8.1 30.6 27.3
Total Deferred Outflows of Resources 21.2 19.2 9.7 8.5 30.9 27.7
Net pension l iabil ities 230.1 208.8 89.5 81.1 319.6 289.9
Long‐term debt 71.5 78.8 68.1 72.2 139.6 151.0
Other l iabilities 48.1 54.3 24.0 24.7 72.1 79.0
Total Liabilities 349.7 341.9 181.6 178.0 531.3 519.9
Pension related 13.7 36.7 5.1 14.1 18.8 50.8
Total Deferred Inflows of Resources 13.7 36.7 5.1 14.1 18.8 50.8
Net Position
Net investment in capital assets 425.2 405.9 512.9 490.9 938.1 896.8
Restricted 47.9 56.0 4.1 4.1 52.0 60.1
Unrestricted 37.9 2.0 162.8 172.8 200.7 174.8
Total Net Position 511.0$ 463.9$ 679.8$ 667.8$ 1,190.8$ 1,131.7$
Governmental
Activities
Business‐type
Activities
Government‐wide
Totals
The largest portion of the City’s net position (78.8 percent) is its investment in capital assets such as land, buildings, infrastructure and vehicles, less any related outstanding debt that was used to acquire those assets. The City uses these capital assets to provide a variety of services to its citizens. Accordingly, these assets are not available for future spending. Although the City’s investment in capital assets is reported net of related debt, it should be noted that the resources used to repay this debt must be provided from other sources, since the capital assets themselves cannot be used to liquidate these liabilities.

Management’s Discussion and Analysis
……….…………………………………………………………………………………..…………… City of Palo Alto 10
The restricted portion of the City’s net position (4.4 percent) represents resources that are subject to external restrictions on how they may be used. The remaining balance of $200.7 million, representing 16.8 percent of the City’s net position, is unrestricted and may be used to meet the government’s ongoing obligations to its citizens and creditors. At the end of the current fiscal year, the City is able to report positive unrestricted net positions both for the government as a whole and for its separate governmental and business‐type activities, except for the following three funds:
Wastewater Treatment Fund $2.1 million deficit due to pension related items; Airport Fund $2.3 million deficit due to cumulative operating losses; and Printing and Mailing Services Fund $0.3 million deficit due to pension related items.
Components of the $59.1 million increase in total net position are discussed in the following sections for governmental activities and business‐type activities.
Governmental Activities – Net Position The following analysis focuses on the net position and changes in net position of the City’s Governmental Activities, presented in the Government‐wide Statement of Net Position and Statement of Activities.
GOVERNMENTAL ACTIVITIES
Net Position at June 30
(in millions)
Increase/
2016 2015 (Decrease)
Cash and investments 295.0$ 280.9$ 14.1$
Other assets 62.3 57.2 5.1
Capital assets 496.0 485.2 10.8
Total Assets 853.3 823.3 30.0
Pension related 21.2 19.2 2.0
Total Deferred Outflows of Resources 21.2 19.2 2.0
Net pension liabilities 230.1 208.8 21.3
Long‐term debt 71.5 78.8 (7.3)
Other liabilities 48.1 54.3 (6.2)
Total Liabilities 349.7 341.9 7.8
Pension related 13.7 36.7 (23.0)
Total Deferred Inflows of Resources 13.7 36.7 (23.0)
Net Position
Net investment in capital assets 425.2 405.9 19.3
Restricted 47.9 56.0 (8.1)
Unrestricted 37.9 2.0 35.9
Total Net Position 511.0$ 463.9$ 47.1$

Management’s Discussion and Analysis
………………………………….…………………………………………………………………… City of Palo Alto 11
The City’s Governmental Activities total net position increased $47.1 million to $511.0 million as of June 30, 2016. This increase was a result of the following:
Cash increased $14.1 million due to a higher cash position in the Capital Projects Fund as a result of higher operating transfers in and lower capital expenditures due to completion of major Library projects in the prior year.
Capital assets net of depreciation increased $10.8 million due to major capital projects such as El Camino Park improvements, and street and sidewalk improvements throughout the City.
Long‐term debt decreased $7.3 million due to scheduled debt repayments of $2.2 million, and defeased payments of $5.1 million on the General Obligation Bonds using funds from bond premium and project savings.
Other liabilities decreased $6.2 million due to lower accounts payable balances because of completion of Library projects, and to current year reduction of deposits held for Transfer Development Rights.
Net investment in capital assets increased $19.3 million to $425.2 million. Restricted net position decreased $8.1 million to $47.9 million due primarily to expenditure of remaining bond proceeds for Library project expenses and defeasance of bonds. Unrestricted net position increased by $35.9 million to $37.9 million as a result of lower capital expenditures in the Capital Projects Fund and increased fund balance of $7.7 million in the Housing‐in‐Lieu Funds. Unrestricted net position represents current net assets available to finance subsequent year operations and other expenditures approved by City Council.
Management’s Discussion and Analysis
………………………………………………………………………………………………………… City of Palo Alto 12
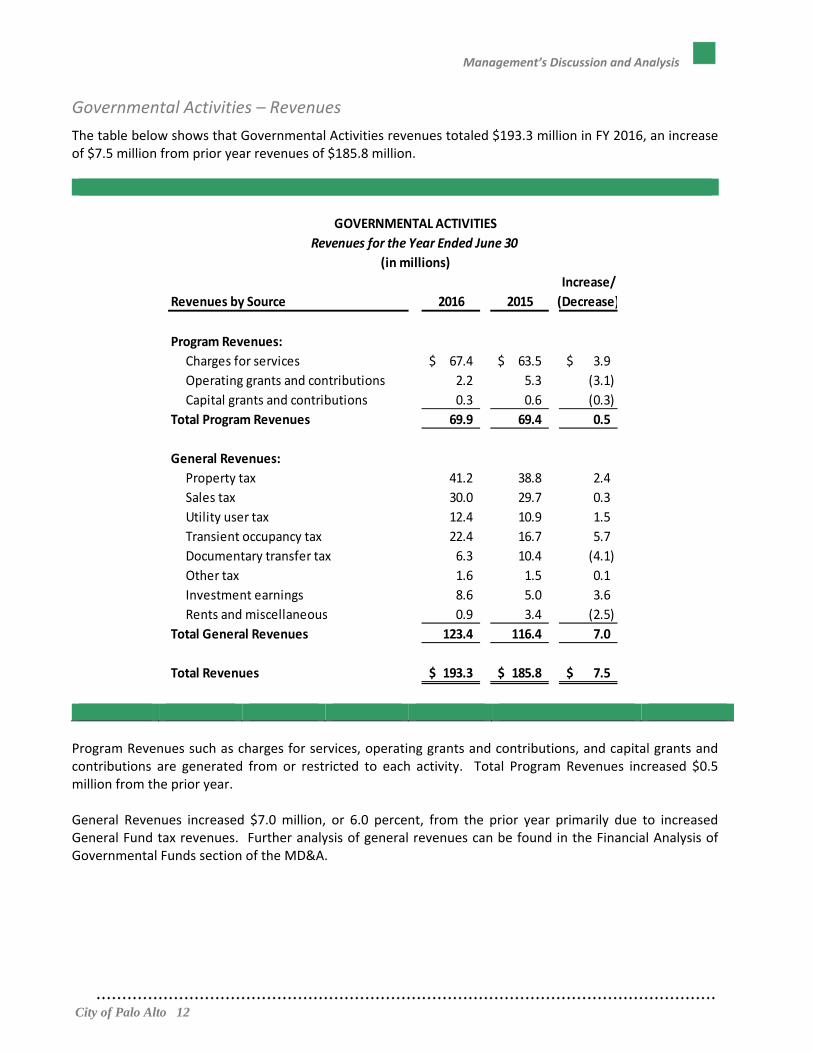
Governmental Activities – Revenues
The table below shows that Governmental Activities revenues totaled $193.3 million in FY 2016, an increase of $7.5 million from prior year revenues of $185.8 million.
GOVERNMENTAL ACTIVITIES
Revenues for the Year Ended June 30
(in millions)
Increase/
Revenues by Source 2016 2015 (Decrease)
Program Revenues:
Charges for services 67.4$ 63.5$ 3.9$
Operating grants and contributions 2.2 5.3 (3.1)
Capital grants and contributions 0.3 0.6 (0.3)
Total Program Revenues 69.9 69.4 0.5
General Revenues:
Property tax 41.2 38.8 2.4
Sales tax 30.0 29.7 0.3
Utility user tax 12.4 10.9 1.5
Transient occupancy tax 22.4 16.7 5.7
Documentary transfer tax 6.3 10.4 (4.1)
Other tax 1.6 1.5 0.1
Investment earnings 8.6 5.0 3.6
Rents and miscellaneous 0.9 3.4 (2.5)
Total General Revenues 123.4 116.4 7.0
Total Revenues 193.3$ 185.8$ 7.5$
Program Revenues such as charges for services, operating grants and contributions, and capital grants and contributions are generated from or restricted to each activity. Total Program Revenues increased $0.5 million from the prior year. General Revenues increased $7.0 million, or 6.0 percent, from the prior year primarily due to increased General Fund tax revenues. Further analysis of general revenues can be found in the Financial Analysis of Governmental Funds section of the MD&A.

Management’s Discussion and Analysis
…………………………………….………………………………………………..………………… City of Palo Alto 13
Governmental Activities – Revenues by Source The chart below presents revenues by source for Governmental Activities. General Revenues are composed of taxes and other revenues not specifically generated by, or restricted to, individual activities. All tax revenues and investment earnings are included in General Revenues.
Program Revenues36%
Property Tax21%
Sales Tax16%
Utility User Tax6%
Transient Occupancy Tax12%
DocumentaryTransfer Tax
3%
Other6%

Management’s Discussion and Analysis
…………………………….………………………………………………………..………………… City of Palo Alto 14
Governmental Activities – Expenses The table below presents a comparison of FY 2016 and FY 2015 expenses by function, along with interest and other expense. Total Governmental Activities functional expense was $164.9 million in FY 2016, an increase of $13.5 million.
GOVERNMENTAL ACTIVITIES
Expenses and Change in Net Position for the Year Ended June 30
(in millions)
Increase/
Activities 2016 2015 (Decrease)
City Council 0.4$ 0.3$ 0.1$
City Manager 2.7 2.2 0.5
City Attorney 2.5 1.8 0.7
City Clerk 0.6 0.7 (0.1)
City Auditor 0.4 0.4 0.0
Administrative Services 10.6 10.0 0.6
Human Resources 2.2 1.4 0.8
Public Safety 56.6 58.7 (2.1)
Planning and Community Environment 10.2 8.4 1.8
Development Services 11.2 10.4 0.8
Public Works 24.6 21.1 3.5
Community Services 28.5 24.7 3.8
Library 10.8 7.7 3.1
Interest and Other Expense 3.6 3.6 0.0
Total Functional Expense 164.9 151.4 13.5
Increase in Net Position
before Transfers 28.4 34.4 (6.0)
Transfers in 18.7 16.4 2.3
Change in Net Position 47.1 50.8 (3.7)
Net Position, Beginning 463.9 413.1 50.8
Net Position, Ending 511.0$ 463.9$ 47.1$

Management’s Discussion and Analysis
……………………………………………………………………..………………………………… City of Palo Alto 15
In addition to the variances at the fund level which are explained in the Financial Analysis of Governmental Funds section of the MD&A, year over year variances in Functional expenses at the government‐wide level are due to the following: Change in pension related adjustments to defer current year contributions and expense prior year
contributions as required by GASB 68 ($0.4 million); Allocation of the Internal Service Funds net position ($1.8 million); Capital asset activities such as depreciation and asset retirements ($0.5 million); and Repayment of excess bond funds to University Avenue Area Off‐Street Parking Assessment District
($1.8 million).
Governmental Activities – Functional Expenses The functional expenses chart below includes only current year expenses. It does not include capital outlays, as those are added to the City’s capital assets. Functions which comprise 1 percent or less of total expenses are combined into the All Other category in the chart below. All Other includes City Council, City Manager, City Attorney, City Clerk, City Auditor and Human Resources.
Administrative Services
7%
Public Works15%
Interest and Other2%
Planning and Community Environment
6%
Development Svcs7%
Public Safety34%
Community Services17%
Library7%
All Other5%

Management’s Discussion and Analysis
………………………………………………………………………………………………………… City of Palo Alto 16
Business‐type Activities – Net Position The following analysis focuses on the net position and changes in net position of the City’s Business‐type Activities presented in the Government‐wide Statement of Net Position and Statement of Activities.
Increase/
2016 2015 (Decrease)
Cash and investments 244.7$ 253.7$ (9.0)$
Other assets 35.3 39.2 (3.9)
Capital assets 576.8 558.5 18.3
Total Assets 856.8 851.4 5.4
Unamortized loss from refunding 0.3 0.4 (0.1)
Deferred pension contribution 9.4 8.1 1.3
Total Deferred Outflows of Resources 9.7 8.5 1.3
Net pension liabilities 89.5 81.1 8.4
Long‐term debt 68.1 72.2 (4.1)
Other liabilities 24.0 24.7 (0.7)
Total Liabilities 181.6 178.0 3.6
Difference between expected and actual
earnings on investments 5.1 14.1 (9.0)
Total Deferred Outflows of Resources 5.1 14.1 (9.0)
Net Position
Net investment in capital assets 512.9 490.9 22.0
Restricted 4.1 4.1 0.0
Unrestricted 162.8 172.8 (10.0)
Total Net Position 679.8$ 667.8$ 12.0$
BUSINESS‐TYPE ACTIVITIES
Net Position at June 30
(in millions)
The City’s Business‐type Activities total net position increased $12.0 million to $679.8 million as of June 30, 2016.
Cash and investments decreased $9.0 million primarily due to Electric Fund decrease in net position of $8.3 million.

Management’s Discussion and Analysis
………………………………………………………………………………………………………… City of Palo Alto 17
Capital assets increased $18.3 million to $576.8 million in FY 2016 primarily due to capital improvements in the Gas Fund. This infrastructure improvement, in addition to the $4.1 million reduction in long‐term debt by Enterprise Funds, created the increase of $22.0 million in the net investment in capital assets to $512.9 million. Unrestricted net position of $162.8 million, a decrease of $10.0 million from the prior year, represents liquid assets available to finance day‐to‐day operations and other expenditures approved by Council. The amount includes rate stabilization reserves (RSR) of $44.7 million and operations reserves of $49.9 million, along with the Electric special projects (Calaveras) reserve of $51.8 million, and the hydro stabilization reserve of $11.4 million. The positive balances in these reserves are offset by the GASB 68 adjustment pension reserve of $85.1 million. Additional detail is included in Note 10. Business‐type Activities – Revenues The table below presents the revenues for each of the City’s Business‐type Activities or Enterprise Funds. The City operates the Water, Electric, Fiber Optics, Gas, Wastewater Collection, Wastewater Treatment, Refuse, Storm Drainage and Airport Funds.
BUSINESS‐TYPE ACTIVITIES
Revenues for the Year Ended June 30
(in millions)
Increase/
Revenues by Source 2016 2015 (Decrease)
Program Revenues:
Charges for services 272.9$ 270.9$ 2.0$
Operating grants and contributions 0.7 0.5 0.2
Capital grants and contributions 1.1 2.1 (1.0)
Total Program Revenues 274.7 273.5 1.2
General Revenues:
Investment earnings 7.3 4.9 2.4
Total General Revenues 7.3 4.9 2.4
Total Revenues 282.0$ 278.4$ 3.6$
Business‐type Activities revenues totaled $282.0 million, an increase of $3.6 million from the prior year. Program revenues increased $1.2 million year over year. Revenues for all funds were relatively flat year over year with the exception of Water Fund which had increased revenue of $1.7 million due to rate increases in July and September. Investment earnings increased due to the unrealized gain which resulted from adjusting investments to market value at year‐end, as required by GASB 31.

Management’s Discussion and Analysis
……….……………………………………………………………………………………………..… City of Palo Alto 18
Business‐type Activities – Expenses The table below presents a comparison of the FY 2016 and FY 2015 expenses for the City’s Business‐type Activities. Encumbrances and reappropriations are not included.
BUSINESS‐TYPE ACTIVITIES
Expenses and Change in Net Position for the Year Ended June 30
(in millions)
Increase/
Business‐type Activities 2016 2015 (Decrease)
Water 35.1$ 33.2$ 1.9$
Electric 120.3 122.4 (2.1)
Fiber Optics 2.1 1.9 0.2
Gas 20.9 23.5 (2.6)
Wastewater Collection 15.2 14.6 0.6
Wastewater Treatment 22.5 21.6 0.9
Refuse 30.4 28.0 2.4
Storm Drainage 3.7 3.7 0.0
Airport 1.0 1.0 0.0
Total Functional Expense 251.2 249.9 1.3
Increase in Net Position
before Transfers 30.7 28.4 2.3
Transfers out (18.7) (16.4) (2.3)
Change in Net Position 12.0 12.0 0.0
Net Position, Beginning 667.8 655.8 12.0
Net Position, Ending 679.8$ 667.8$ 12.0$
Business‐type Activities expenses increased $1.3 million for a total of $251.2 million. Year over year expenses were significantly affected by the following events:
Water Fund expenses increased $1.9 million due to increased wholesale water rates to cover the cost of upgrades and improvements to the water supply distribution system.
Electric Fund expenses decreased $2.1 million due to decreased energy purchase costs. The availability of hydroelectric energy resources is lower than average due to the ongoing drought, which necessitates higher than average electricity purchases at market rates, but lower than expected market rates drove total purchase costs lower.
Gas Fund expenses decreased $2.6 million due to lower commodity prices. Refuse Fund expenses increased $2.4 million due to the cost of providing expanded services for
recycling and composting as a means to accomplish zero waste and reduced greenhouse gas emissions goals.

Management’s Discussion and Analysis
………………………………………………………..……….……………………………………… City of Palo Alto 19
FUND FINANCIAL STATEMENTS
Financial Analysis of Governmental Funds
As noted earlier, the City uses fund accounting to ensure and demonstrate compliance with finance‐related legal requirements. Governmental Funds The focus of the City’s Governmental Funds is to provide information on near‐term inflows, outflows, and balances of spendable resources. Such information is useful in assessing the City’s financing requirements. In particular, the unassigned fund balance may serve as a useful measure of a government’s net resources available for discretionary use as it represents the portion of fund balance not yet limited to use for a particular purpose by either an external party, the City itself, or an entity that has been delegated authority by the City Council to assign resources for use. As of June 30, 2016, the City’s Governmental Funds reported combined fund balances of $245.7 million, an increase of $21.1 million from the prior year. Approximately 21.0 percent, or $51.6 million, constitutes unassigned fund balance, which is available for spending at the government’s discretion. The remainder of the fund balance is either non‐spendable, restricted, committed, or assigned to indicate that it is: 1) not in spendable form ($8.6 million); 2) restricted for particular purposes ($47.1 million); 3) committed for particular purposes ($65.7 million); or 4) assigned for particular purposes ($72.7 million). Governmental Fund revenues increased $7.4 million, or 4.0 percent, from prior year to $191.9 million. Revenues in the General Fund increased $8.3 million and Capital Projects Fund revenue increased $0.8 million. Other Governmental Funds revenue decreased by $1.8 million due to reduced developer impact and housing‐in‐lieu fees. Governmental Fund expenditures were $186.2 million, a decrease of $2.9 million from the prior year. General Fund expenditures increased $6.4 million, Capital Projects Fund expenditures decreased by $15.7 million, and Non‐major Fund expenditures increased by $6.4 million. Details of significant changes are discussed in the following sections. General Fund Balance Sheet The General Fund is the primary operating fund of the City. At the end of the current fiscal year, fund balance of the General Fund was $66.9 million, compared to $62.5 million in the prior year. The fund balance has been classified as $7.1 million non‐spendable, $8.3 million assigned, and $51.6 million unassigned. The unassigned amount of $51.6 million is designated by the Council for budget stabilization. Proposed uses are as follows:
$1.3 million for FY 2017 Budget Amendment Ordinances approved to date; $1.3 million for Council approved reappropriations for various City departments; $2.1 million to fund a Council approved pension trust fund; and $5.3 million for transfer to Capital Projects Fund for deferred projects and reserved uses.
The remaining balance of $41.6 million represents 21.4 percent of FY 2017 expenditures and operating transfers, which is $5.7 million above the target reserve guideline of 18.5 percent set by Council. Staff will bring forward further recommendations as part of the year‐end close process.

Management’s Discussion and Analysis
……….…………………………………..…………………………………………………………… City of Palo Alto 20
Statement of Revenues, Expenditures and Changes in Fund Balance Revenues
The City’s General Fund revenues totaled $165.8 million in FY 2016. This represents an increase of $8.3 million, or 5.3 percent, compared to the prior year. The year over year change in significant revenue sources is noted in the following table.
GENERAL FUND
Revenues for the Year Ended June 30
(in millions)
Increase/
Revenues by Source 2016 2015 (Decrease)
Property tax 36.6$ 34.1$ 2.5$
Sales tax 30.0 29.7 0.3
Utility user tax 12.5 10.9 1.6
Transient occupancy tax 22.4 16.7 5.7
Documentary transfer tax 6.3 10.4 (4.1)
Charges for services 23.9 25.9 (2.0)
Permits and licence 7.9 7.1 0.8
Rental income 15.8 14.9 0.9
All other 10.4 7.8 2.6
Total Revenues 165.8$ 157.5$ 8.3$
Property tax revenue increased by $2.5 million, or 7.3 percent, due to increased property assessment roll growth. Utility user tax revenue increased $1.6 million from prior year due to increased telephone utility user receipts. Transient occupancy tax (TOT) ended the year $5.7 million, or 34.1 percent, higher than prior year due to higher room rates, newly opened hotels that performed better than expected, and a new revenue stream from Airbnb rentals. Also, FY 2016 reflects a full year of the Council approved two percent increase in the TOT rate from 12 percent to 14 percent, compared to FY 2015 which only included six months of the increase that took effect January 1, 2015. Documentary transfer tax decreased $4.1 million to $6.3 million due to the unusually high dollar commercial property transactions that occurred in FY 2015. All other revenue increased from prior year by $2.6 million primarily due to $1.7 million in net proceeds from the sale of the former City Manager’s house.

Management’s Discussion and Analysis
……….……………………………………………………………………………………………… City of Palo Alto 21
Expenditures General Fund expenditures totaled $145.2 million for FY 2016 compared to $138.8 in the prior year. This amount excludes encumbrances and reappropriations. The year over year change for major functions is noted in the following table:
GENERAL FUND
Expenditures for the Year Ended June 30
(in millions)
Increase/
Expenditures by Function 2016 2015 (Decrease)
Administrative Services 3.5$ 3.7$ (0.2)$
Public Works 12.3 11.4 0.9
Planning and Community Environment 9.1 7.4 1.7
Development Services 10.6 11.1 (0.5)
Police 35.2 34.1 1.1
Fire 28.3 27.1 1.2
Community Services 24.3 23.0 1.3
Library 8.0 8.0 0.0
Non‐Departmental 5.7 5.6 0.1
All other 8.2 7.4 0.8
Total Expenditures 145.2$ 138.8$ 6.4$
Planning and Community Environment expenses increased $1.7 million due to the addition of three full‐time equivalent positions ($0.5 million) and increased contract services expense related to initiatives such as Shuttle Service program enhancements, parking management, and Transportation Management Association initialization. Police expenses increased $1.1 million due to $0.4 million increased salaries and benefits, and increased expenditures for training, travel and equipment. Fire expenses increased $1.2 million due to $0.7 million overtime and $0.4 million in allocated charges. Community Services expenses increased $1.3 million due to increased salaries and benefits of $0.4 million, increased expenses for class activities, and increased allocated charges. Statement of Revenues, Expenditures and Changes in Fund Balance ‐ Budget and Actual Original budget compared to final budget Revenues were originally budgeted at $153.4 million and were revised upward by $4.3 million. Revenue categories that were adjusted are shown in the table below.

Management’s Discussion and Analysis
……………………………………………….……………………………………………………..… City of Palo Alto 22
GENERAL FUND
Budgeted Revenues for the Year Ended June 30
(in millions)
Adopted Final Increase/
Budgeted Revenues Budget Budget (Decrease)
Property tax 35.1$ 36.0$ 0.9$
Sales tax 27.6 28.4 0.8
Utility user tax 11.2 10.5 (0.7)
Transient occupancy tax 18.8 22.0 3.2
Documentary transfer tax 6.8 7.0 0.2
All other 53.9 53.8 (0.1)
153.4 157.7 4.3
Charges to other funds 11.9 11.9 ‐
Prior year encumbrances and appropriations ‐ 5.6 5.6
Total Budgeted Revenues 165.3$ 175.2$ 9.9$
Adjustments to the Adopted Budget were based on the following:
Sales tax was increased by $0.8 million due to higher than expected receipts. Property tax was increased by $0.9 million due to receipt of excess funds from the Educational
Revenue Augmentation Fund (ERAF). Transient occupancy tax was increased by $3.2 million due to higher than expected receipts driven by
higher room rates, newly opened hotels performing above expectations, and a new revenue streamfrom Airbnb rentals.
Documentary transfer tax was increased by $0.2 million based on year‐to‐date receipts trackingslightly higher than anticipated.
Actual revenues of $164.4 million were $6.8 million higher than final budgeted revenues of $157.7 million due to the following:
$1.7 million net proceeds from the sale of former City Manager’s house; $0.9 million revenue from Cable Joint Powers Authority budgeted in operating transfers in; $2.0 million higher than expected utility user tax; and $1.6 million higher than anticipated sales tax revenue.
Expenditures were originally budgeted at $162.9 million and were revised upward by $7.9 million, including prior year encumbrances of $5.6 million, for a final budgeted amount of $170.8 million.
Current year budgeted expenditures and operating transfers include a draw of $11.5 million from FY 2015 surplus that was approved in November 2015 as part of the FY 2015 year‐end close City Manager Report #6251, and was incorporated into the FY 2016 mid‐year budget changes.
Management’s Discussion and Analysis
……………………………………………………………………………………………………..… City of Palo Alto 23
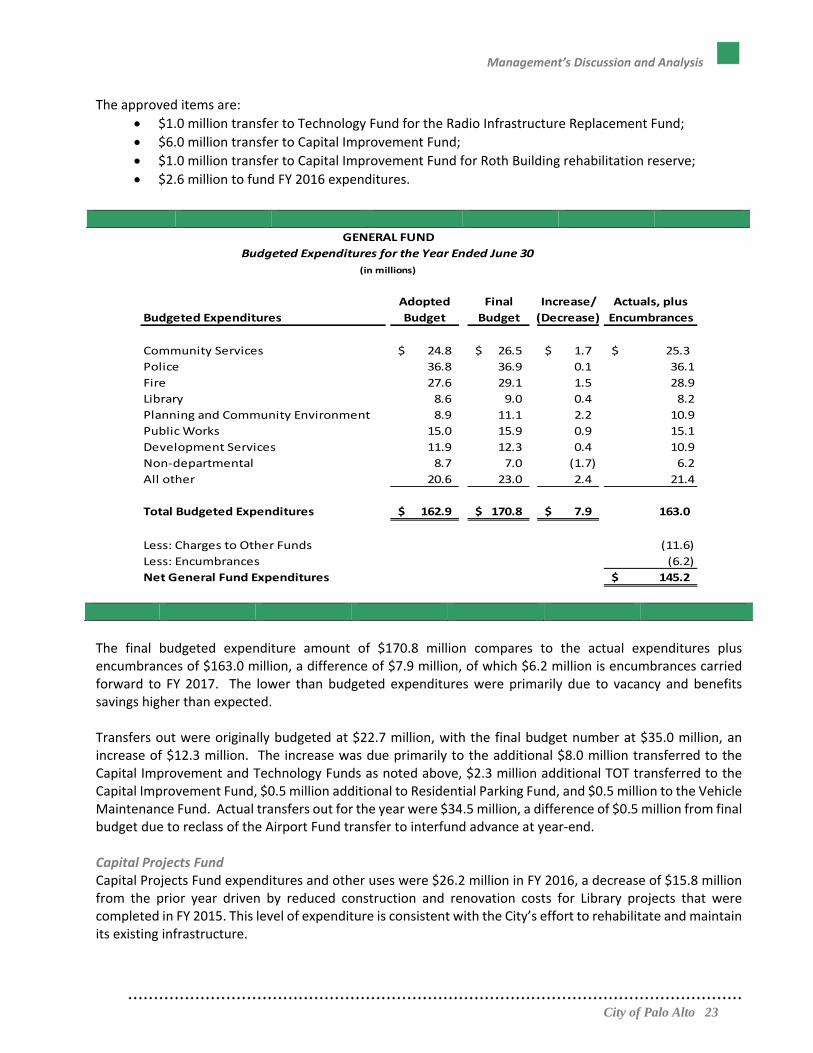
The approved items are:
$1.0 million transfer to Technology Fund for the Radio Infrastructure Replacement Fund;
$6.0 million transfer to Capital Improvement Fund;
$1.0 million transfer to Capital Improvement Fund for Roth Building rehabilitation reserve;
$2.6 million to fund FY 2016 expenditures.
GENERAL FUND
Budgeted Expenditures for the Year Ended June 30
(in millions)
Adopted Final Increase/ Actuals, plus
Budgeted Expenditures Budget Budget (Decrease) Encumbrances
Community Services 24.8$ 26.5$ 1.7$ 25.3$
Police 36.8 36.9 0.1 36.1
Fire 27.6 29.1 1.5 28.9
Library 8.6 9.0 0.4 8.2
Planning and Community Environment 8.9 11.1 2.2 10.9
Public Works 15.0 15.9 0.9 15.1
Development Services 11.9 12.3 0.4 10.9
Non‐departmental 8.7 7.0 (1.7) 6.2
All other 20.6 23.0 2.4 21.4
Total Budgeted Expenditures 162.9$ 170.8$ 7.9$ 163.0
Less: Charges to Other Funds (11.6)
Less: Encumbrances (6.2)
Net General Fund Expenditures 145.2$
The final budgeted expenditure amount of $170.8 million compares to the actual expenditures plus encumbrances of $163.0 million, a difference of $7.9 million, of which $6.2 million is encumbrances carried forward to FY 2017. The lower than budgeted expenditures were primarily due to vacancy and benefits savings higher than expected. Transfers out were originally budgeted at $22.7 million, with the final budget number at $35.0 million, an increase of $12.3 million. The increase was due primarily to the additional $8.0 million transferred to the Capital Improvement and Technology Funds as noted above, $2.3 million additional TOT transferred to the Capital Improvement Fund, $0.5 million additional to Residential Parking Fund, and $0.5 million to the Vehicle Maintenance Fund. Actual transfers out for the year were $34.5 million, a difference of $0.5 million from final budget due to reclass of the Airport Fund transfer to interfund advance at year‐end. Capital Projects Fund Capital Projects Fund expenditures and other uses were $26.2 million in FY 2016, a decrease of $15.8 million from the prior year driven by reduced construction and renovation costs for Library projects that were completed in FY 2015. This level of expenditure is consistent with the City’s effort to rehabilitate and maintain its existing infrastructure.
Management’s Discussion and Analysis
……….…………………………………………………………………………..…………………… City of Palo Alto 24
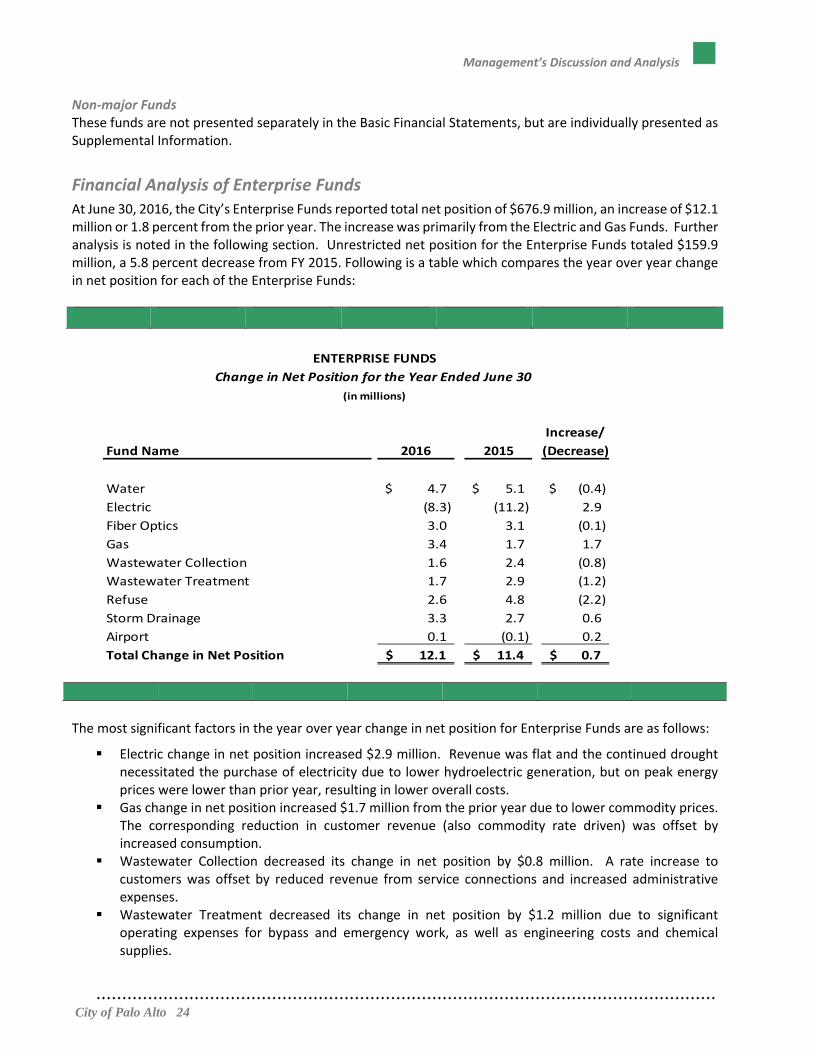
Non‐major Funds These funds are not presented separately in the Basic Financial Statements, but are individually presented as Supplemental Information.
Financial Analysis of Enterprise Funds At June 30, 2016, the City’s Enterprise Funds reported total net position of $676.9 million, an increase of $12.1 million or 1.8 percent from the prior year. The increase was primarily from the Electric and Gas Funds. Further analysis is noted in the following section. Unrestricted net position for the Enterprise Funds totaled $159.9 million, a 5.8 percent decrease from FY 2015. Following is a table which compares the year over year change in net position for each of the Enterprise Funds:
ENTERPRISE FUNDS
Change in Net Position for the Year Ended June 30
(in millions)
Increase/
Fund Name 2016 2015 (Decrease)
Water 4.7$ 5.1$ (0.4)$
Electric (8.3) (11.2) 2.9
Fiber Optics 3.0 3.1 (0.1)
Gas 3.4 1.7 1.7
Wastewater Collection 1.6 2.4 (0.8)
Wastewater Treatment 1.7 2.9 (1.2)
Refuse 2.6 4.8 (2.2)
Storm Drainage 3.3 2.7 0.6
Airport 0.1 (0.1) 0.2
Total Change in Net Position 12.1$ 11.4$ 0.7$
The most significant factors in the year over year change in net position for Enterprise Funds are as follows:
Electric change in net position increased $2.9 million. Revenue was flat and the continued droughtnecessitated the purchase of electricity due to lower hydroelectric generation, but on peak energyprices were lower than prior year, resulting in lower overall costs.
Gas change in net position increased $1.7 million from the prior year due to lower commodity prices.The corresponding reduction in customer revenue (also commodity rate driven) was offset byincreased consumption.
Wastewater Collection decreased its change in net position by $0.8 million. A rate increase tocustomers was offset by reduced revenue from service connections and increased administrativeexpenses.
Wastewater Treatment decreased its change in net position by $1.2 million due to significantoperating expenses for bypass and emergency work, as well as engineering costs and chemicalsupplies.

Management’s Discussion and Analysis
…………………………………………..…………………………………………………………… City of Palo Alto 25
Refuse Fund change in net position decreased $2.2 million from prior year. A residential rate increase was offset by reduced miscellaneous revenues and increased expense for expanded contract services for yard trimmings and food scraps.
CAPITAL ASSETS
GASB 34 requires that the City record all its capital assets, including infrastructure and intangible assets. Infrastructure includes roads, bridges, signals and similar assets used by the entire population. The table below shows capital assets and the amount of accumulated depreciation for these assets for Governmental and Business‐type Activities. Further detail can be found in Note 6 to the financial statements.
Increase/
2016 2015 (Decrease)
Governmental Activities
Capital Assets
Land and improvements 78.5$ 79.0$ (0.5)$
Street trees 15.1 15.1 0.0
Construction in progress 46.5 39.3 7.2
Buildings and improvements 220.9 221.7 (0.8)
Intangible assets 3.8 3.8 0.0
Equipment 12.9 12.3 0.6
Roadway network 308.6 299.2 9.4
Recreation and open space network 33.1 27.6 5.5
Less accumulated depreciation (239.8) (228.2) (11.6)
Internal Service Fund Assets
Construction in progress 1.8 1.4 0.4
Equipment 55.4 53.5 1.9
Less accumulated depreciation (40.8) (39.5) (1.3)
Total Governmental Activities 496.0$ 485.2$ 10.8$
Business‐type Activities
Land 5.0$ 5.0$ ‐$
Construction in progress 93.9 89.9 4.0
Buildings and improvements 56.9 53.5 3.4
Transmission, distribution and treatment systems 746.7 717.6 29.1
Less accumulated depreciation (325.7) (307.5) (18.2)
Total Business‐type Activities 576.8$ 558.5$ 18.3$
CAPITAL ASSETS AT JUNE 30
(in millions)
Governmental Activities’ capital assets net of depreciation increased by $10.8 million from the prior year. The increase was primarily due to El Camino Park improvements, and street and sidewalk improvements throughout the City.

Management’s Discussion and Analysis
…………………………………………………………….………………………………………… City of Palo Alto 26
Council approved a $125.8 million Infrastructure Plan in June 2014, which includes projects such as a new Public Safety Building, replacement of two Fire Stations, a Bike and Pedestrian plan, and two parking garages. Funding for these projects will come from a variety of sources, including TOT revenues, Stanford University Medical Center development agreement, and developer impact fees. The Plan was recently updated for cost escalations, scope increases and a $30 million contingency reserve, resulting in a revised Infrastructure Plan of $160 million. In the past five years, General Fund surpluses totaling $32.6 million have been transferred to the Capital Projects Infrastructure Reserve, with an additional $4.3 million committed from FY 2016 surplus funds. Major Governmental Activities’ capital projects that are currently in progress, including the remaining capital commitment of each, are as follows:
Golf Course reconfiguration and Baylands Athletic Center ‐ $10.2 million Lucie Stern Buildings mechanical and electrical upgrades ‐ $2.8 million Bicycle and pedestrian transportation plan ‐ $2.6 million
Business‐type Activities’ capital assets net of depreciation increased by $18.3 million over FY 2015. The increase is due primarily to Gas infrastructure improvements. Major Business‐type Activities’ capital projects that are currently in progress, including the remaining capital commitment of each, are as follows:
Seismic water system upgrades for Water Fund ‐ $4.4 million Channing Avenue/Lincoln Avenue storm drain improvement ‐ $3.6 million Wastewater Collection Fund rehabilitation/augmentation project ‐ $9.2 million
The City depreciates its capital assets over their estimated useful lives, as required by GASB 34. The purpose of depreciation is to spread the cost of a capital asset over the years of its useful life so that an allocable portion of the cost of the asset is borne by all users. Additional information on capital assets and depreciable lives are in Note 6.

Management’s Discussion and Analysis
………………………………………………………………………………………………………… City of Palo Alto 27
DEBT ADMINISTRATION
Each of the City’s debt issues is discussed in detail in Note 7 to the financial statements. At June 30, 2016, the City’s debt was comprised of the following:
LONG‐TERM DEBT AT JUNE 30
(in millions)
Increase/
2016 2015 (Decrease)
Governmental Activities
General Long‐Term Obligations
Certificates of Participation
2002B Downtown Parking Improvements 1.1$ 1.3$ (0.2)$
General Obligation Bonds
2010 48.1 51.5 (3.4)
2013A 17.1 20.3 (3.2)
2011 Lease Purchase Agreement 1.3 1.6 (0.3)
Add: unamortized premium 3.9 4.1 (0.2)
Total Governmental 71.5$ 78.8$ (7.3)$
Business‐type Activities
Enterprise Long‐Term Obligations
Utility Revenue Bonds
1995 Series A 2.4$ 2.9$ (0.5)
1999 Refunding 9.7 10.3 (0.6)
2009 Series A 29.7 30.7 (1.0)
2011 Refunding 12.3 13.3 (1.0)
Add: unamortized premium 0.8 0.9 (0.1)
Energy Tax Credit Bonds
2007 Series A 0.6 0.7 (0.1)
Less: unamortized discount (0.1) (0.1) ‐
State Water Resources Loan
2007 5.9 6.3 (0.4)
2009 6.8 7.2 (0.4)
Total Business‐type 68.1$ 72.2$ (4.1)$
Long‐term debt decreased a total of $11.4 million due to scheduled debt repayments of $6.3 million, and defeasance payments of $5.1 million on the General Obligation Bonds. As noted in the Statistical Section of the CAFR, the combined direct debt ratio to assessed valuation for the General Fund is 0.25 percent compared to the allowable legal debt margin of 15 percent.

Management’s Discussion and Analysis
………………………………………………………………………………………………………… City of Palo Alto 28
SPECIAL ASSESSMENT DISTRICT DEBT Special assessment districts throughout different parts of the City have also issued debt to finance infrastructure and facilities construction exclusively in their districts. As of June 30, 2016, the City had no special assessment district debt with City commitment outstanding.
ECONOMIC OUTLOOK The economy of the City is discussed in the accompanying Transmittal Letter.
CONTACTING THE CITY’S FINANCIAL MANAGEMENT The CAFR is intended to provide citizens, taxpayers, investors, and creditors with a general overview of the City’s finances. Questions about this report should be directed to the Administrative Services Department, at 250 Hamilton Avenue, 4th Floor, Palo Alto, California. The Department can also be contacted by email at: [email protected]. This report and other financial reports can be viewed on the City of Palo Alto website at: www.cityofpaloalto.org. On the home page, select Departments, select Administrative Services, and select Financial Reporting. Within Financial Reporting, there are links to reports by title and reporting date.

CITY OF PALO ALTOStatement of Net Position
June 30, 2016(Amounts in thousands)
Governmental Business‐Type Activities Activities Total
ASSETS:Cash and investments available for operations (Note 3) 294,051$ 240,570$ 534,621$ Receivables, net:Accounts and intergovernmental 15,985 29,251 45,236 Interest receivable 1,363 1,053 2,416 Notes and loans receivable (Note 5) 19,243 ‐ 19,243
Internal balances (Note 4) (680) 680 ‐Net OPEB asset (Note 12) 21,662 ‐ 21,662 Due from other government agencies ‐ 3,900 3,900 Inventory of materials and supplies, prepaids and deposits 4,732 374 5,106 Restricted cash and investments with fiscal agents (Note 3) 959 4,115 5,074 Capital assets (Note 6):Nondepreciable 145,481 98,943 244,424 Depreciable, net of accumulated depreciation 350,506 477,864 828,370
Total assets 853,302 856,750 1,710,052
DEFERRED OUTFLOWS OF RESOURCES:Unamortized loss from refunding ‐ 324 324Pension related 21,181 9,414 30,595
Total deferred outflows of resources 21,181 9,738 30,919
LIABILITIES:Accounts payable and accruals 7,272 15,348 22,620 Accrued salaries and benefits 4,346 1,986 6,332 Unearned revenue 1,895 ‐ 1,895 Accrued compensated absences (Note 1):Due in one year 4,936 ‐ 4,936 Due in more than one year 6,286 ‐ 6,286
Claims payable (Note 14):Due in one year 5,237 ‐ 5,237 Due in more than one year 18,142 ‐ 18,142
Landfill post‐closure liability (Note 9):Due in more than one year ‐ 6,618 6,618
Net pension liabilities (Note 11): 230,122 89,500 319,622 Long‐term debt (Note 7):Due in one year 2,224 4,198 6,422 Due in more than one year 69,295 63,915 133,210
Total liabilities 349,755 181,565 531,320
DEFERRED INFLOWS OF RESOURCES:Pension related 13,737 5,084 18,821
NET POSITION (Note 10):Net Investment in capital assets 425,179 512,918 938,097 Restricted for:Transportation, infrastructure and other 42,547 ‐ 42,547 Debt service 3,855 4,115 7,970 Nonexpendable ‐ Eyerly Family 1,505 ‐ 1,505
Total restricted net position 47,907 4,115 52,022
Unrestricted 37,905 162,806 200,711
Total net position $ 510,991 $ 679,839 $ 1,190,830
See accompanying notes to the basic financial statements.
29

30
This page is left intentionally blank.
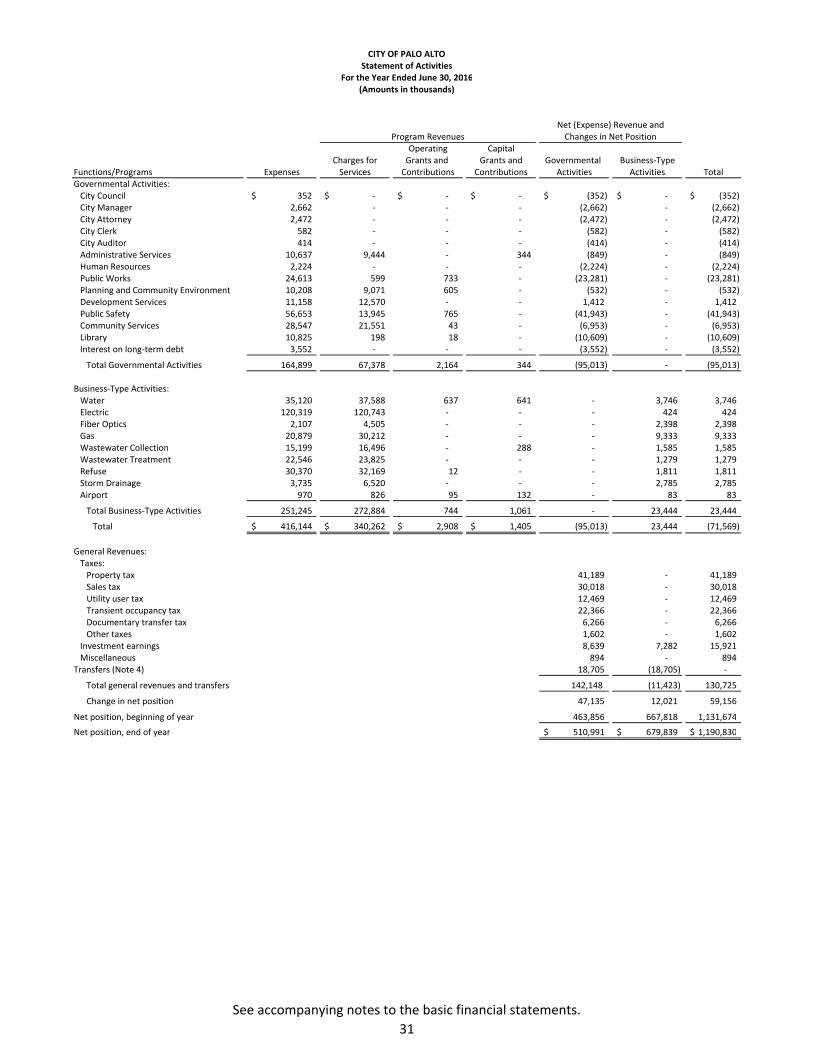
CITY OF PALO ALTOStatement of Activities
For the Year Ended June 30, 2016(Amounts in thousands)
Net (Expense) Revenue andProgram Revenues Changes in Net Position
Operating CapitalCharges for Grants and Grants and Governmental Business‐Type
Functions/Programs Expenses Services Contributions Contributions Activities Activities TotalGovernmental Activities:City Council 352$ ‐$ ‐$ ‐$ (352)$ ‐$ (352)$ City Manager 2,662 ‐ ‐ ‐ (2,662) ‐ (2,662) City Attorney 2,472 ‐ ‐ ‐ (2,472) ‐ (2,472) City Clerk 582 ‐ ‐ ‐ (582) ‐ (582) City Auditor 414 ‐ ‐ ‐ (414) ‐ (414) Administrative Services 10,637 9,444 ‐ 344 (849) ‐ (849) Human Resources 2,224 ‐ ‐ ‐ (2,224) ‐ (2,224) Public Works 24,613 599 733 ‐ (23,281) ‐ (23,281) Planning and Community Environment 10,208 9,071 605 ‐ (532) ‐ (532) Development Services 11,158 12,570 ‐ ‐ 1,412 ‐ 1,412 Public Safety 56,653 13,945 765 ‐ (41,943) ‐ (41,943) Community Services 28,547 21,551 43 ‐ (6,953) ‐ (6,953) Library 10,825 198 18 ‐ (10,609) ‐ (10,609) Interest on long‐term debt 3,552 ‐ ‐ ‐ (3,552) ‐ (3,552)
Total Governmental Activities 164,899 67,378 2,164 344 (95,013) ‐ (95,013)
Business‐Type Activities:Water 35,120 37,588 637 641 ‐ 3,746 3,746 Electric 120,319 120,743 ‐ ‐ ‐ 424 424 Fiber Optics 2,107 4,505 ‐ ‐ ‐ 2,398 2,398 Gas 20,879 30,212 ‐ ‐ ‐ 9,333 9,333 Wastewater Collection 15,199 16,496 ‐ 288 ‐ 1,585 1,585 Wastewater Treatment 22,546 23,825 ‐ ‐ ‐ 1,279 1,279 Refuse 30,370 32,169 12 ‐ ‐ 1,811 1,811 Storm Drainage 3,735 6,520 ‐ ‐ ‐ 2,785 2,785 Airport 970 826 95 132 ‐ 83 83
Total Business‐Type Activities 251,245 272,884 744 1,061 ‐ 23,444 23,444
Total 416,144$ 340,262$ 2,908$ 1,405$ (95,013) 23,444 (71,569)
General Revenues:Taxes:Property tax 41,189 ‐ 41,189 Sales tax 30,018 ‐ 30,018 Utility user tax 12,469 ‐ 12,469 Transient occupancy tax 22,366 ‐ 22,366 Documentary transfer tax 6,266 ‐ 6,266 Other taxes 1,602 ‐ 1,602
Investment earnings 8,639 7,282 15,921 Miscellaneous 894 ‐ 894
Transfers (Note 4) 18,705 (18,705) ‐
Total general revenues and transfers 142,148 (11,423) 130,725
Change in net position 47,135 12,021 59,156
Net position, beginning of year 463,856 667,818 1,131,674
Net position, end of year 510,991$ 679,839$ 1,190,830$
See accompanying notes to the basic financial statements.
31

32
This page is left intentionally blank.

CITY OF PALO ALTO
Governmental Funds
Balance Sheet
June 30, 2016
(Amounts in thousands)
Capital Other Total
General Projects Governmental Governmental
Fund Fund Funds Funds
ASSETS:
Cash and investments available for operations (Note 3) 53,113$ 71,461$ 89,433$ 214,007$
Receivables, net:
Accounts and intergovernmental 15,676 163 31 15,870
Interest receivable 640 ‐ 382 1,022
Notes and loans receivable (Note 5) 513 ‐ 18,730 19,243
Advance to other fund (Note 4) 2,211 ‐ ‐ 2,211
Inventory of materials and supplies 4,364 ‐ ‐ 4,364
Restricted cash and investments with fiscal agents (Note 3) ‐ 711 248 959
Total assets 76,517$ 72,335$ 108,824$ 257,676$
LIABILITIES AND FUND BALANCES:
Liabilities:
Accounts payable and accruals 3,832$ 1,809$ 354$ 5,995$
Accrued salaries and benefits 3,859 176 46 4,081
Unearned revenue 1,895 ‐ ‐ 1,895
Total liabilities 9,586 1,985 400 11,971
Fund balances (Note 10):
Nonspendable:
Notes and loans receivable 513 ‐ ‐ 513
Inventories 4,364 ‐ ‐ 4,364
Advance to other fund 2,211 ‐ ‐ 2,211
Eyerly family ‐ ‐ 1,505 1,505
Restricted for:
Transportation mitigation ‐ ‐ 10,841 10,841
Federal revenue ‐ ‐ 4,569 4,569
Street improvement ‐ ‐ 1,308 1,308
Local law enforcement ‐ ‐ 180 180
Library bond project ‐ 711 ‐ 711
Public benefit ‐ ‐ 25,649 25,649
Debt service ‐ ‐ 3,855 3,855
Committed for:
Roth Building Rehabilitation ‐ 3,953 ‐ 3,953
Cubberley Improvements ‐ 2,634 ‐ 2,634
Developer impact fees ‐ ‐ 14,169 14,169
Housing in‐lieu ‐ ‐ 41,251 41,251
Special districts ‐ ‐ 3,704 3,704
Downtown business ‐ ‐ 34 34
Assigned for:
Unrealized gains on investments 2,066 ‐ 1,358 3,424
Capital projects ‐ 63,052 ‐ 63,052
Other general government purposes 6,195 ‐ 1 6,196
Unassigned for:
Budget Stabilization 51,582 ‐ ‐ 51,582
Total fund balances 66,931 70,350 108,424 245,705
Total liabilities and fund balances 76,517$ 72,335$ 108,824$ 257,676$
See accompanying notes to the basic financial statements.
33

CITY OF PALO ALTO
Reconciliation of the Balance Sheet of Governmental Funds to
the Statement of Net Position ‐ Governmental Activities
June 30, 2016
Total fund balances reported on the governmental funds balance sheet 245,705$
Amounts reported for governmental activities in the statement of net position
are different from those reported in the governmental funds balance sheet because
of the following:
Deferred outflows and inflows of resources in governmental activities are not
financial resources and, therefore, are not reported in the governmental funds.
Deferred outflows of resources 21,181
Deferred inflows of resources (13,737)
Capital assets used in governmental activities are not current assets or financial
resources and therefore are not reported in the governmental funds (Note 6) 495,987
Internal service funds are used by management to charge the costs of activities
such as insurance, equipment acquisition and maintenance, and certain
employee benefits to individual funds. The assets and liabilities of the
internal service funds are therefore included in governmental activities in
the statement of net position (excludes capital assets, deferred outflows
of resources, deferred inflows of resources and net pension liabilities reported herein) 64,766
Some liabilities, including bonds payable, are not due and payable in the
current period and therefore are not reported in the governmental funds:
Interest payable (1,270)
Net pension liabilities (Note 11) (230,122)
Long‐term debt (Note 7) (71,519)
Net position of governmental activities 510,991$
(Amounts in thousands)
See accompanying notes to the basic financial statements.
34

CITY OF PALO ALTOGovernmental Funds
Statement of Revenues, Expenditures and Changes in Fund BalancesFor the Year Ended June 30, 2016
(Amounts in thousands)
Capital Other
General Projects Governmental
Fund Fund Funds Total
REVENUES:
Property tax 36,607$ ‐$ 4,582$ 41,189$
Special assessments ‐ ‐ 100 100
Sales tax 30,018 ‐ ‐ 30,018
Utility user tax 12,469 ‐ ‐ 12,469
Transient occupancy tax 22,366 ‐ ‐ 22,366
Documentary transfer tax 6,266 ‐ ‐ 6,266
Other taxes and fines 2,238 ‐ 1,570 3,808
Charges for services 23,910 ‐ ‐ 23,910
From other agencies 3,190 861 366 4,417
Permits and licenses 7,912 ‐ 3,316 11,228
Investment earnings 2,494 1,102 2,898 6,494
Rental income 15,769 ‐ 6 15,775
Other revenue 2,591 3,596 7,640 13,827
Total revenues 165,830 5,559 20,478 191,867
EXPENDITURES:Current:
City Council 330 ‐ ‐ 330
City Manager 2,567 ‐ ‐ 2,567
City Attorney 2,212 ‐ ‐ 2,212
City Clerk 488 ‐ ‐ 488
City Auditor 313 ‐ ‐ 313
Administrative Services 3,545 ‐ 203 3,748
Human Resources 1,843 ‐ ‐ 1,843
Public Works 12,315 ‐ 797 13,112
Planning and Community Environment 9,059 ‐ 663 9,722
Development Services 10,643 ‐ ‐ 10,643
Police 35,247 ‐ 225 35,472
Fire 28,312 ‐ ‐ 28,312
Community Services 24,280 ‐ 1,231 25,511
Library 7,960 ‐ ‐ 7,960
Non‐Departmental 5,680 1,790 598 8,068
Capital outlay ‐ 24,457 ‐ 24,457
Debt service:
Principal 395 ‐ 6,735 7,130
Interest and fiscal charges 36 ‐ 4,230 4,266
Total expenditures 145,225 26,247 14,682 186,154
EXCESS (DEFICIENCY) OF REVENUES
OVER (UNDER) EXPENDITURES 20,605 (20,688) 5,796 5,713
OTHER FINANCING SOURCES (USES):
Transfers in (Note 4) 18,317 36,702 6,816 61,835
Transfers out (Note 4) (34,461) (3,018) (9,013) (46,492)
Total other financing sources (uses) (16,144) 33,684 (2,197) 15,343
Change in fund balances 4,461 12,996 3,599 21,056
FUND BALANCES, BEGINNING OF YEAR 62,470 57,354 104,825 224,649
FUND BALANCES, END OF YEAR 66,931$ 70,350$ 108,424$ 245,705$
See accompanying notes to the basic financial statements.
35

CITY OF PALO ALTOReconciliation of the Statement of Revenues, Expenditures and Changes in Fund Balances
of Governmental Funds to the Statement of Activities ‐ Governmental ActivitiesFor the Year Ended June 30, 2016
Net change in fund balances ‐ total governmental funds 21,056$
Amounts reported for governmental activities in the statement of activities are different
from those reported in the governmental funds because of the following:
Governmental funds report capital outlays as expenditures. However, in the statement of
activities, the costs of these assets are capitalized and allocated over their estimated useful
lives and reported as depreciation expense. Therefore, the activities associated with
capital assets are as follows:
Capital outlay added back to fund balance for current year additions 24,694
Depreciation expense is deducted from fund balance (depreciation expense is net of
internal service fund depreciation of $2,525 (Note 6), which has already been allocated
through the internal service fund activities below (14,539)
Disposal of capital assets (508)
Pension contribution made subsequent to the measurement date is an expenditure in the
governmental funds, but reported as a deferred outflows of resources in the
government‐wide financial statements 18,516
Pension expenses reported in the statement of activities do not require the use of current
financial resources and, therefore, are not reported as expenditures in governmental funds (15,320)
Principal payments on long‐term liabilities are reported as expenditures in governmental
funds when paid. The governmental activities, however, report principal payments as
a reduction of long‐term debt on the statement of net position. Interest accrued on
long‐term debt and amortization of premiums do not require the use of current financial
resources and therefore are not reported as expenditures in governmental funds. Therefore,
the activities associated with long‐term debt are as follows:
Principal paid during the year 7,130
Change in interest payable 556
Amortization of bond premium 158
Internal service funds are used by management to charge the costs of activities, such
as insurance, equipment acquisition and maintenance, and employees benefits to
individual funds. The portion of the net revenue of these internal service
funds arising out of their transactions with governmental funds is reported with
governmental activities. 5,392
Change in net position of governmental activities 47,135$
(Amounts in thousands)
See accompanying notes to the basic financial statements.
36

Variance withBudgeted Amounts Final Budget
Actual, plus PositiveAdopted Final Encumbrances (Negative)
27,630$ 28,430$ 30,018$ 1,588$ 35,067 35,967 36,607 640 18,791 21,991 22,366 375
Documentary transfer tax 6,852 7,052 6,266 (786) 11,189 10,489 12,469 1,980 2,180 2,180 2,238 58
25,399 24,768 23,910 (858) 8,211 8,211 7,912 (299) 824 824 1,104 280
15,296 15,299 15,769 470 1,659 659 3,190 2,531 323 1,801 2,591 790
153,421 157,671 164,440 6,769 11,930 11,929 11,576 (353)
‐ 5,573 5,606 33
165,351 175,173 181,622 6,449
3,101 3,719 3,186 533 1,175 1,261 1,159 102 1,328 1,373 1,058 315 455 502 451 51
3,431 4,121 4,092 29 7,635 7,957 7,615 342
24,804 26,517 25,262 1,255 Police 36,859 36,924 36,096 828
27,583 29,223 28,909 314 3,555 4,029 3,849 180 8,555 8,971 8,217 754 8,900 11,146 10,912 234
Development Services 11,901 12,281 10,872 1,409 15,017 15,828 15,084 744 8,662 6,955 6,234 721
162,961 170,807 162,996 7,811
2,390 4,366 18,626 14,260
18,589 19,141 18,317 (824) (22,711) (35,057) (34,461) 596
(4,122) (15,916) (16,144) (228)
(1,732)$ (11,550)$ 2,482 14,032$
Unrealized gain/loss on investments 1,390 Current year encumbrances 6,195 Prior year encumbrances (5,606)
4,461
62,470
66,931$
REVENUES:
CITY OF PALO ALTOGeneral Fund
Statement of Revenues, Expenditures and Changes in Fund Balance ‐ Budget and ActualFor the Year Ended June 30, 2016
(Amounts in thousands)
Charges to other funds
Sales taxProperty taxTransient occupancy tax
Utility user taxOther taxes, fines and penaltiesCharges for servicesPermits and licensesInvestment earningsRental incomeFrom other agenciesOther revenues
Fire
Prior year encumbrances
Total revenues
EXPENDITURES:Current:City AttorneyCity AuditorCity ClerkCity CouncilCity ManagerAdministrative ServicesCommunity Services
Total other financing sources (uses)
Human ResourcesLibraryPlanning and Community Environment
Total expenditures
EXCESS (DEFICIENCY) OF REVENUES OVER (UNDER) EXPENDITURES
OTHER FINANCING SOURCES (USES): Transfers inTransfers out
Public WorksNon‐Departmental
FUND BALANCE AT BEGINNING OF YEAR, GAAP BASIS
FUND BALANCE AT END OF YEAR, GAAP BASIS
EXCESS (DEFICIENCY) OF REVENUES OVER (UNDER)EXPENDITURES, BUDGETARY BASIS
Adjustment to Budgetary Basis:
CHANGE IN FUND BALANCE, GAAP BASIS
See accompanying notes to the basic financial statements.
37

Fiber
Water Electric Optics Gas
ASSETS:
Current assets:
Cash and investments available for operations (Note 3) 35,832$ 100,414$ 25,069$ 25,289$
Accounts receivable, net of allowance of $478 5,337 13,008 864 2,105
Interest receivable 159 462 102 105
Due from other government agencies ‐ ‐ ‐ ‐
Inventory of materials and supplies ‐ ‐ ‐ ‐
Restricted cash and investments with fiscal agents (Note 3) 3,299 ‐ ‐ 816
Total current assets 44,627 113,884 26,035 28,315
Noncurrent assets:
Due from other government agencies ‐ ‐ ‐ ‐
Deposit ‐ 49 ‐ ‐
Prepaid expense 108 ‐ ‐ ‐
Capital assets (Note 6):
Nondepreciable 18,832 24,244 1,719 3,066
Depreciable, net 101,398 163,415 6,195 99,469
Net OPEB asset (Note 12) ‐ ‐ ‐ ‐
Total noncurrent assets 120,338 187,708 7,914 102,535
Total assets 164,965 301,592 33,949 130,850
DEFERRED OUTFLOWS OF RESOURCES:
Unamortized loss from refunding 129 ‐ ‐ 168
Pension related 1,218 3,173 201 1,327
Total deferred outflows of resources 1,347 3,173 201 1,495
LIABILITIES:
Current liabilities:
Accounts payable and accruals 5,082 4,242 418 829
Accrued salaries and benefits 265 696 40 279
Accrued compensated absences (Note 1) ‐ ‐ ‐ ‐
Current portion of long term debt (Note 7) 1,510 100 ‐ 575
Accrued claims payable (Note 14) ‐ ‐ ‐ ‐
Total current liabilities 6,857 5,038 458 1,683
Noncurrent liabilities:
Accrued compensated absences (Note 1) ‐ ‐ ‐ ‐
Accrued claims payable (Note 14) ‐ ‐ ‐ ‐
Advance from other fund (Note 4) ‐ ‐ ‐ ‐
Landfill post‐closure liability (Note 9) ‐ ‐ ‐ ‐
Net pension liabilities (Note 11) 12,100 28,893 1,777 12,941
Long term debt, net of
unamortized discounts/premiums (Note 7) 34,780 468 ‐ 6,682
Total noncurrent liabilities 46,880 29,361 1,777 19,623
Total liabilities 53,737 34,399 2,235 21,306
DEFERRED INFLOWS OF RESOURCES:
Pension related 727 1,564 85 752
Total deferred inflows of resources 727 1,564 85 752
NET POSITION (Note 10):
Net Investment in capital assets 84,069 187,091 7,914 95,446
Restricted for debt service 3,299 ‐ ‐ 816
Unrestricted (deficit) 24,480 81,711 23,916 14,025
Total net position 111,848$ 268,802$ 31,830$ 110,287$
Some amounts reported for Business‐type Activities in the statement of net position are different because certain
Internal Service Fund net positions are included with Business‐type Activities
Net position reported in Business‐type Activities
Business‐Type Activities‐Enterprise Funds
CITY OF PALO ALTO
Proprietary Funds
Statement of Net Position
June 30, 2016
(Amounts in thousands)
See accompanying notes to the basic financial statements.
38
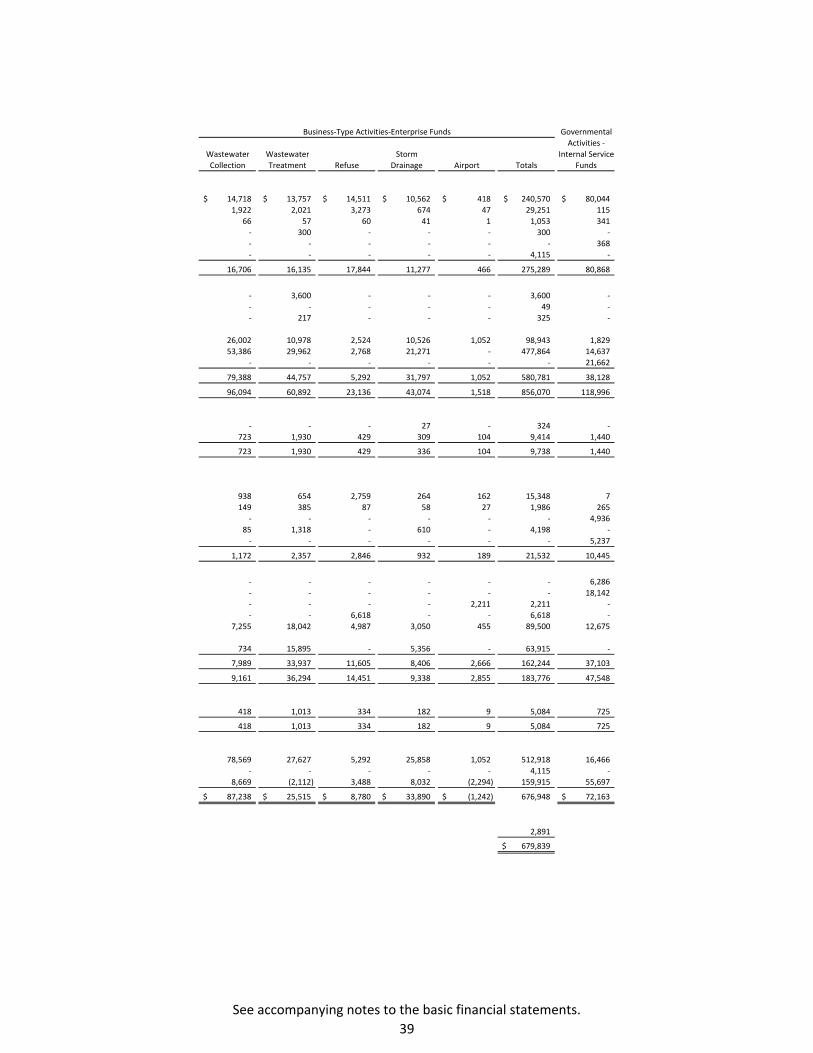
Governmental
Activities ‐
Wastewater Wastewater Storm Internal Service
Collection Treatment Refuse Drainage Airport Totals Funds
14,718$ 13,757$ 14,511$ 10,562$ 418$ 240,570$ 80,044$
1,922 2,021 3,273 674 47 29,251 115
66 57 60 41 1 1,053 341
‐ 300 ‐ ‐ ‐ 300 ‐
‐ ‐ ‐ ‐ ‐ ‐ 368
‐ ‐ ‐ ‐ ‐ 4,115 ‐
16,706 16,135 17,844 11,277 466 275,289 80,868
‐ 3,600 ‐ ‐ ‐ 3,600 ‐
‐ ‐ ‐ ‐ ‐ 49 ‐
‐ 217 ‐ ‐ ‐ 325 ‐
26,002 10,978 2,524 10,526 1,052 98,943 1,829
53,386 29,962 2,768 21,271 ‐ 477,864 14,637
‐ ‐ ‐ ‐ ‐ ‐ 21,662
79,388 44,757 5,292 31,797 1,052 580,781 38,128
96,094 60,892 23,136 43,074 1,518 856,070 118,996
‐ ‐ ‐ 27 ‐ 324 ‐
723 1,930 429 309 104 9,414 1,440
723 1,930 429 336 104 9,738 1,440
938 654 2,759 264 162 15,348 7
149 385 87 58 27 1,986 265
‐ ‐ ‐ ‐ ‐ ‐ 4,936
85 1,318 ‐ 610 ‐ 4,198 ‐
‐ ‐ ‐ ‐ ‐ ‐ 5,237
1,172 2,357 2,846 932 189 21,532 10,445
‐ ‐ ‐ ‐ ‐ ‐ 6,286
‐ ‐ ‐ ‐ ‐ ‐ 18,142
‐ ‐ ‐ ‐ 2,211 2,211 ‐
‐ ‐ 6,618 ‐ ‐ 6,618 ‐
7,255 18,042 4,987 3,050 455 89,500 12,675
734 15,895 ‐ 5,356 ‐ 63,915 ‐
7,989 33,937 11,605 8,406 2,666 162,244 37,103
9,161 36,294 14,451 9,338 2,855 183,776 47,548
418 1,013 334 182 9 5,084 725
418 1,013 334 182 9 5,084 725
78,569 27,627 5,292 25,858 1,052 512,918 16,466
‐ ‐ ‐ ‐ ‐ 4,115 ‐
8,669 (2,112) 3,488 8,032 (2,294) 159,915 55,697
87,238$ 25,515$ 8,780$ 33,890$ (1,242)$ 676,948 72,163$
2,891
679,839$
Business‐Type Activities‐Enterprise Funds
See accompanying notes to the basic financial statements.
39

FiberWater Electric Optics Gas
OPERATING REVENUES:Sales to: Customers 33,967$ 104,458$ 3,532$ 27,555$ City departments 1,602 3,127 855 1,110
Service connection charges and miscellaneous 903 2,756 86 961 Charges for services ‐ ‐ ‐ ‐ Other 1,116 10,402 32 586
Total operating revenues 37,588 120,743 4,505 30,212
OPERATING EXPENSES:Retail purchase of utilities 17,626 73,440 ‐ 8,127 Administrative and general 4,813 6,395 363 3,329 Engineering (operating) 409 1,592 ‐ 426 Resource management and energy efficiency 594 5,765 ‐ 1,037 Operations and maintenance 5,440 11,524 1,360 4,153 Rent 1,677 4,991 71 568 Depreciation and amortization 2,719 7,607 328 2,795 Claims payments and changes inestimated self‐insurance liability ‐ ‐ ‐ ‐
Refund of charges for services ‐ ‐ ‐ ‐ Compensated absences and other benefits ‐ ‐ ‐ ‐
Total operating expenses 33,278 111,314 2,122 20,435
Operating income (loss) 4,310 9,429 2,383 9,777
NONOPERATING REVENUES (EXPENSES):Investment earnings 1,144 3,126 726 712 Interest expense (1,822) (8,889) ‐ (249) Gain on disposal of capital assets ‐ ‐ ‐ ‐ Loss on disposal of capital assets (70) (74) ‐ (187) Other nonoperating revenues 637 ‐ ‐ ‐
Total nonoperating revenues (expenses) (111) (5,837) 726 276
Income (loss) before transfers and capital contributions 4,199 3,592 3,109 10,053
Capital contributions 641 ‐ ‐ ‐ Transfers in (Note 4) 222 259 ‐ ‐ Transfers out (Note 4) (364) (12,110) (121) (6,670)
Change in net position 4,698 (8,259) 2,988 3,383
NET POSITION (DEFICIT), BEGINNING OF YEAR 107,150 277,061 28,842 106,904
NET POSITION (DEFICIT), END OF YEAR 111,848$ 268,802$ 31,830$ 110,287$
Some amounts reported for Business‐type Activities in the statement of activities are different because certain Internal Service Fund activities are included with Business‐type Activities
Change in net position reported in Business‐type Activities
Business‐Type Activities‐Enterprise Funds
CITY OF PALO ALTOProprietary Funds
Statement of Revenues, Expenses and Changes in Fund Net PositionFor the Year Ended June 30, 2016
(Amounts in thousands)
See accompanying notes to the basic financial statements.
40

GovernmentalActivities‐
Wastewater Wastewater Storm Internal ServiceCollection Treatment Refuse Drainage Airport Totals Funds
15,572$ 14,759$ 27,763$ 5,961$ 459$ 234,026$ ‐$ 76 8,818 787 364 ‐ 16,739 ‐
506 ‐ ‐ ‐ ‐ 5,212 ‐ ‐ ‐ ‐ ‐ ‐ ‐ 85,810
342 248 3,619 195 367 16,907 37
16,496 23,825 32,169 6,520 826 272,884 85,847
8,770 ‐ 16,251 ‐ ‐ 124,214 ‐ 1,205 ‐ 1,794 669 705 19,273 12,743 347 2,056 208 407 ‐ 5,445 ‐
‐ ‐ ‐ 290 ‐ 7,686 ‐ 2,635 16,962 8,962 1,212 231 52,479 25,287 293 ‐ 2,452 39 ‐ 10,091 ‐
1,933 2,958 77 743 ‐ 19,160 2,525
‐ ‐ ‐ ‐ ‐ ‐ 3,132 ‐ ‐ ‐ ‐ ‐ ‐ 54 ‐ ‐ ‐ ‐ ‐ ‐ 42,538
15,183 21,976 29,744 3,360 936 238,348 86,279
1,313 1,849 2,425 3,160 (110) 34,536 (432)
475 370 426 293 10 7,282 2,156 (47) (497) (565) (373) (38) (12,480) ‐
‐ ‐ ‐ ‐ ‐ ‐ 185 (5) ‐ ‐ ‐ ‐ (336) ‐ ‐ ‐ 12 ‐ 95 744 40
423 (127) (127) (80) 67 (4,790) 2,381
1,736 1,722 2,298 3,080 (43) 29,746 1,949
288 ‐ ‐ ‐ 132 1,061 ‐ ‐ ‐ 356 234 ‐ 1,071 5,888
(396) (12) (97) (6) ‐ (19,776) (2,526)
1,628 1,710 2,557 3,308 89 12,102 5,311
85,610 23,805 6,223 30,582 (1,331) 66,852 87,238$ 25,515$ 8,780$ 33,890$ (1,242)$ 72,163$
(81)
12,021$
Business‐Type Activities‐Enterprise Funds
See accompanying notes to the basic financial statements.
41
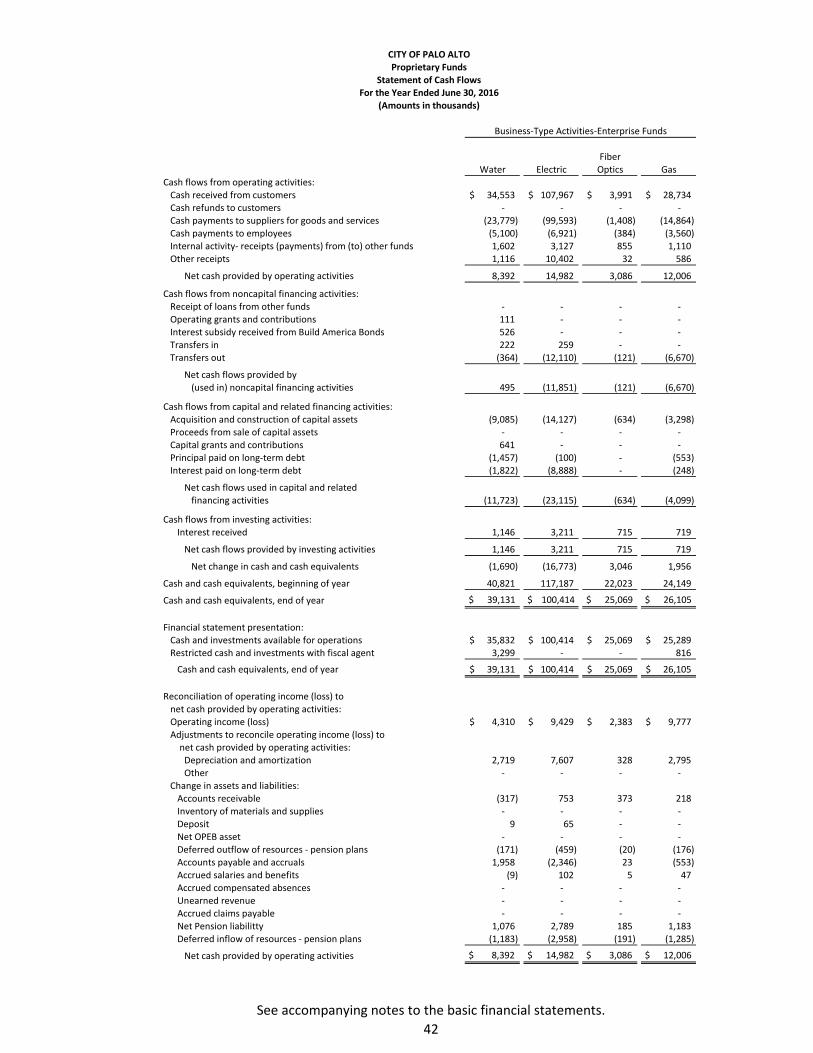
FiberWater Electric Optics Gas
Cash flows from operating activities:Cash received from customers 34,553$ 107,967$ 3,991$ 28,734$ Cash refunds to customers ‐ ‐ ‐ ‐ Cash payments to suppliers for goods and services (23,779) (99,593) (1,408) (14,864) Cash payments to employees (5,100) (6,921) (384) (3,560) Internal activity‐ receipts (payments) from (to) other funds 1,602 3,127 855 1,110 Other receipts 1,116 10,402 32 586
Net cash provided by operating activities 8,392 14,982 3,086 12,006
Cash flows from noncapital financing activities:Receipt of loans from other funds ‐ ‐ ‐ ‐ Operating grants and contributions 111 ‐ ‐ ‐ Interest subsidy received from Build America Bonds 526 ‐ ‐ ‐ Transfers in 222 259 ‐ ‐ Transfers out (364) (12,110) (121) (6,670)
Net cash flows provided by
(used in) noncapital financing activities 495 (11,851) (121) (6,670)
Cash flows from capital and related financing activities:
Acquisition and construction of capital assets (9,085) (14,127) (634) (3,298)
Proceeds from sale of capital assets ‐ ‐ ‐ ‐
Capital grants and contributions 641 ‐ ‐ ‐
Principal paid on long‐term debt (1,457) (100) ‐ (553)
Interest paid on long‐term debt (1,822) (8,888) ‐ (248)
Net cash flows used in capital and related
financing activities (11,723) (23,115) (634) (4,099)
Cash flows from investing activities:
Interest received 1,146 3,211 715 719
Net cash flows provided by investing activities 1,146 3,211 715 719
Net change in cash and cash equivalents (1,690) (16,773) 3,046 1,956
Cash and cash equivalents, beginning of year 40,821 117,187 22,023 24,149
Cash and cash equivalents, end of year $ 39,131 $ 100,414 $ 25,069 $ 26,105
Financial statement presentation:
Cash and investments available for operations 35,832$ 100,414$ 25,069$ 25,289$
Restricted cash and investments with fiscal agent 3,299 ‐ ‐ 816
Cash and cash equivalents, end of year 39,131$ 100,414$ 25,069$ 26,105$
Reconciliation of operating income (loss) to net cash provided by operating activities:
Operating income (loss) 4,310$ 9,429$ 2,383$ 9,777$
Adjustments to reconcile operating income (loss) to net cash provided by operating activities:Depreciation and amortization 2,719 7,607 328 2,795
Other ‐ ‐ ‐ ‐
Change in assets and liabilities:Accounts receivable (317) 753 373 218
Inventory of materials and supplies ‐ ‐ ‐ ‐
Deposit 9 65 ‐ ‐ Net OPEB asset ‐ ‐ ‐ ‐ Deferred outflow of resources ‐ pension plans (171) (459) (20) (176)
Accounts payable and accruals 1,958 (2,346) 23 (553)
Accrued salaries and benefits (9) 102 5 47 Accrued compensated absences ‐ ‐ ‐ ‐ Unearned revenue ‐ ‐ ‐ ‐
Accrued claims payable ‐ ‐ ‐ ‐ Net Pension liabilitty 1,076 2,789 185 1,183 Deferred inflow of resources ‐ pension plans (1,183) (2,958) (191) (1,285)
Net cash provided by operating activities $ 8,392 $ 14,982 $ 3,086 $ 12,006
Business‐Type Activities‐Enterprise Funds
CITY OF PALO ALTOProprietary Funds
Statement of Cash FlowsFor the Year Ended June 30, 2016
(Amounts in thousands)
See accompanying notes to the basic financial statements.
42

GovernmentalActivities‐
Wastewater Wastewater Storm Internal ServiceCollection Treatment Refuse Drainage Airport Totals Funds
16,522$ 15,719$ 27,823$ 5,883$ 838$ 242,030$ 86,230$ ‐ ‐ ‐ ‐ ‐ ‐ (54)
(11,621) (18,988) (27,152) (1,935) (163) (199,503) (25,986) (1,256) (332) (1,881) (732) (737) (20,903) (54,853)
76 8,818 787 364 ‐ 16,739 (3,589) 342 248 3,971 195 462 17,354 40
4,063 5,465 3,548 3,775 400 55,717 1,788
‐ ‐ ‐ ‐ 516 516 ‐ ‐ ‐ ‐ ‐ ‐ 111 ‐ ‐ ‐ ‐ ‐ ‐ 526 ‐ ‐ ‐ 356 234 ‐ 1,071 5,888 (396) (12) (97) (6) ‐ (19,776) (2,526)
(396) (12) 259 228 516 (17,552) 3,362
(5,305) (3,020) (2,139) (1,086) (670) (39,364) (3,713)
‐ ‐ ‐ ‐ ‐ ‐ 221
288 300 12 ‐ 132 1,373 ‐
(82) (1,283) ‐ (575) ‐ (4,050) ‐
(44) (496) (565) (372) (38) (12,473) ‐
(5,143) (4,499) (2,692) (2,033) (576) (54,514) (3,492)
474 373 418 287 9 7,352 2,133
474 373 418 287 9 7,352 2,133
(1,002) 1,327 1,533 2,257 349 (8,997) 3,791
15,720 12,430 12,978 8,305 69 253,682 76,253
$ 14,718 $ 13,757 $ 14,511 $ 10,562 $ 418 $ 244,685 $ 80,044
14,718$ 13,757$ 14,511$ 10,562$ 418$ 240,570$ 80,044$
‐ ‐ ‐ ‐ ‐ 4,115 ‐
14,718$ 13,757$ 14,511$ 10,562$ 418$ 244,685$ 80,044$
1,313$ 1,849$ 2,425$ 3,160$ (110)$ 34,536$ (432)$
1,933 2,958 77 743 ‐ 19,160 2,525 ‐ ‐ ‐ ‐ 95 95 40
444 960 60 (12) 379 2,858 665 ‐ ‐ ‐ ‐ ‐ ‐ 2
‐ 16 ‐ ‐ ‐ 90 ‐
‐ ‐ ‐ ‐ ‐ ‐ 1,209 (73) (280) (40) (43) (42) (1,304) (298) 424 14 1,073 13 68 674 (1,634)
77 72 14 6 5 319 77 ‐ ‐ ‐ ‐ ‐ ‐ 466
‐ ‐ ‐ (66) ‐ (66) ‐ ‐ ‐ ‐ ‐ ‐ ‐ (739) 668 1,695 400 273 64 8,333 1,174
(723) (1,819) (461) (299) (59) (8,978) (1,267)
$ 4,063 $ 5,465 $ 3,548 $ 3,775 $ 400 $ 55,717 $ 1,788
Business‐Type Activities‐Enterprise Funds
See accompanying notes to the basic financial statements.
43

Agency
Funds
ASSETS:
Cash and investments available for operations (Note 3) 2,647$
Restricted cash and investments with fiscal agents (Note 3) 2,550
Account receivable 505
Interest receivable 12
Total assets 5,714$
LIABILITIES:
Due to bondholders 4,565$
Due to other governments 1,149
Total liabilities 5,714$
CITY OF PALO ALTO
Statement of Fiduciary Net Position
June 30, 2016
(Amounts in thousands)
See accompanying notes to the basic financial statements.
44

CITY OF PALO ALTO Index to the Notes to the Basic Financial Statements
For the Year Ended June 30, 2016
45
Page
1. Summary of Significant Accounting Policies ........................................................................... 47
2. Budgets and Budgetary Accounting ........................................................................................ 56
3. Cash and Investments ............................................................................................................. 56
4. Interfund Transactions ............................................................................................................ 62
5. Notes and Loans Receivable .................................................................................................... 64
6. Capital Assets .......................................................................................................................... 70
7. General Long‐Term Obligations .............................................................................................. 75
8. Special Assessment Debt ......................................................................................................... 81
9. Landfill Post‐Closure Maintenance ......................................................................................... 81
10. Net Position and Fund Balances .............................................................................................. 82
11. Pension Plans ........................................................................................................................... 85
12. Retiree Health Benefits ........................................................................................................... 92
13. Deferred Compensation Plan .................................................................................................. 95
14. Risk Management .................................................................................................................... 96
15. Joint Ventures .......................................................................................................................... 97
16. Commitments and Contingencies ......................................................................................... 100
Notes are essential to present fairly the information contained in the overview level of the basic financial statements. Narrative explanations are intended to communicate information that is not readily apparent or cannot be included in the statements themselves, and to provide additional disclosures as required by the Governmental Accounting Standards Board.

46
This page is left intentionally blank.

CITY OF PALO ALTO Notes to the Basic Financial Statements
For the Year Ended June 30, 2016
47
NOTE 1 – SUMMARY OF SIGNIFICANT ACCOUNTING POLICIES
The City of Palo Alto (the City) was incorporated in 1894 and operates as a charter city, having had its first charter granted by the State of California in 1909. The City operates under the Council‐Manager form of government and provides the following services: public safety (police and fire), public works, electric, fiber optics, water, gas, wastewater, storm drain, refuse, airport, golf course, planning and zoning, general administration services, library, open space and science, recreational and human services.
(a) Reporting Entity
The City is governed by a nine‐member council, elected by City residents. The City is legally separate and fiscally independent, which means it can issue debt, set and modify budgets and fees, and sue or be sued. The accompanying basic financial statements present the financial activities of the City, which is the primary government presented, along with the financial activities of its component unit, which is an entity for which the City is financially accountable. Although a separate legal entity, a blended component unit is, in substance, part of the City’s operations and is reported as an integral part of the City’s financial statements. The City’s component unit described below is blended.
The Palo Alto Public Improvement Corporation (the Corporation) provides financing of public capital improvements for the City through the issuance of Certificates of Participation (COPs), a form of debt that allows investors to participate in a stream of future lease payments. Proceeds from the COPs are used to construct projects that are leased to the City. The lease payments are sufficient in timing and amount to meet the debt service requirements of the COPs. The Board of Directors of the Corporation is composed of the same members as the City Council. The Corporation is controlled by the City, which performs all accounting and administrative functions for the Corporation. The financial activities of the Corporation are included in the Downtown Parking Improvement Debt Service Fund.
Financial statements for the Corporation may be obtained from the City of Palo Alto, Administrative Services Department, 4th Floor, 250 Hamilton Avenue, Palo Alto, CA 94301.
(b) Basis of Presentation
The City’s basic financial statements are prepared in conformity with accounting principles generally accepted in the United States of America. The Governmental Accounting Standards Board (GASB) is the acknowledged standard setting body for establishing accounting and financial reporting standards followed by governmental entities in the United States.
These standards require that the financial statements described below be presented:
Government‐wide Statements: The Statement of Net Position and the Statement of Activities display information about the primary government and its component unit. These statements include the financial activities of the overall City government, except for fiduciary activities. Eliminations have been made to minimize the double counting of internal activities. However, interfund goods and services transactions have not been eliminated in the consolidation process. These statements distinguish between the governmental and business‐type activities of the City.

CITY OF PALO ALTO Notes to the Basic Financial Statements
For the Year Ended June 30, 2016
48
NOTE 1 – SUMMARY OF SIGNIFICANT ACCOUNTING POLICIES (Continued)
(b) Basis of Presentation (Continued)
Governmental activities generally are financed through taxes, intergovernmental revenues, and other non‐exchange transactions. Business‐type activities are financed in whole or in part by fees charged to external parties.
The Statement of Activities presents a comparison between direct expenses and program revenues for each segment of the business‐type activities of the City and for each function of the City’s governmental activities. Direct expenses are those that are specifically associated with a program or function and, therefore, are clearly identifiable to a particular function. Program revenues include: (a) charges paid by the recipients for goods and services offered by the programs, (b) grants and contributions that are restricted to meeting the operational needs of a particular program, and (c) fees, grants and contributions that are restricted to financing the acquisition or construction of capital assets. Revenues that are not classified as program revenues, including all taxes, are presented as general revenues.
Fund Financial Statements: The fund financial statements provide information about the City’s funds, including fiduciary funds and its blended component unit. Separate statements for each fund category – governmental, proprietary and fiduciary – are presented. The emphasis of fund financial statements is on major individual governmental and enterprise funds, each of which is displayed in a separate column. All remaining governmental and internal service funds are aggregated and reported as non‐major funds.
Proprietary fund operating revenues, such as utilities sales and charges for services, result from exchange transactions associated with the principal activity of the fund. Exchange transactions are those in which each party receives and gives up essentially equal values. Nonoperating revenues, such as subsidies and investment earnings, result from non‐exchange transactions or ancillary activities.
Operating expenses for enterprise funds and internal service funds include the cost of sales and services, administrative expenses, and depreciation on capital assets. All expenses not meeting this definition are reported as nonoperating expenses.
(c) Major Funds and Other Funds
The City’s major governmental and enterprise funds need to be identified and presented separately in the fund financial statements. All other funds, called non‐major funds, are combined and reported in a single column, regardless of their fund type.
Major funds are defined as funds that have assets and deferred outflows of resources, liabilities and deferred inflows of resources, revenues or expenditures/expenses equal to at least 10 percent of their fund type total and at least 5 percent of the grand total. The General Fund is always a major fund. The City may also select other funds it believes should be presented as major funds on a qualitative basis.

CITY OF PALO ALTO Notes to the Basic Financial Statements
For the Year Ended June 30, 2016
49
NOTE 1 – SUMMARY OF SIGNIFICANT ACCOUNTING POLICIES (Continued)
(c) Major Funds and Other Funds (Continued)
The City reported the following major governmental funds in the accompanying financial statements:
General Fund – This is the City’s primary operating fund. It accounts for all financial resources of the general government, except those required to be accounted for in another fund.
Capital Projects Fund – This fund accounts for resources used for the acquisition and construction of capital facilities by the City, with the exception of those assets financed by proprietary funds.
The City reported the following enterprise funds as major funds in the accompanying financial statements:
Water Services Fund – This fund accounts for all financial transactions relating to the City’s water service. Services are on a user‐charge basis to residents and business owners located in the City.
Electric Services Fund – This fund accounts for all financial transactions relating to the City’s electric service. Services are on a user‐charge basis to residents and business owners located in the City.
Fiber Optics Fund – This fund accounts for all financial transactions relating to the City’s fiber optics service. Services are on a user‐charge basis to licensees located in the City.
Gas Services Fund – This fund accounts for all financial transactions relating to the City’s gas service. Services are on a user‐charge basis to residents and business owners located in the City.
Wastewater Collection Services Fund – This fund accounts for all financial transactions relating to the City’s wastewater collection service. Services are on a user‐charge basis to residents and business owners located in the City.
Wastewater Treatment Services Fund – This fund accounts for all financial transactions relating to the City’s wastewater treatment. Services are on a user‐charge basis to residents and business owners located in the City.
Refuse Services Fund – This fund accounts for all financial transactions relating to the City’s refuse service. Services are on a user‐charge basis to residents and business owners located in the City.
Storm Drainage Services Fund – This fund accounts for all financial transactions relating to the City’s storm drainage service. Services are on a user‐charge basis to residents and business owners located in the City.

CITY OF PALO ALTO Notes to the Basic Financial Statements
For the Year Ended June 30, 2016
50
NOTE 1 – SUMMARY OF SIGNIFICANT ACCOUNTING POLICIES (Continued) (c) Major Funds and Other Funds (Continued)
The City also reports the following funds:
Airport Fund – This non‐major enterprise fund accounts for all financial transactions relating to the Palo Alto Airport (PAO). The City assumed control over operation of PAO from the County of Santa Clara, effective August 11, 2014.
Internal Service Funds – These funds account for fleet replacement and maintenance, technology, central duplicating, printing and mailing services, administration of compensated absences and health benefits, and the City’s self‐insured workers’ compensation and general liability programs, all of which are provided to other departments on a cost‐reimbursement basis. Also included is the Retiree Health Benefits Internal Service Fund, which accounts for benefits to retirees.
Vehicle Replacement and Maintenance – This fund accounts for the maintenance and replacement of vehicles and equipment used by all City departments. The source of revenue is from reimbursement of fleet replacement and maintenance costs allocated to each department by usage of vehicle.
Technology – This fund accounts for replacement and upgrade of technology, and covers four primary areas used by all City departments: desktop, infrastructure, applications, and technology research and development. The source of revenue is from reimbursement of costs for support provided to other departments.
Printing and Mailing Services – This fund accounts for central duplicating, printing and mailing services provided to all City departments. The source of revenue for this fund is from reimbursement of costs for services and supplies purchased by other departments.
General Benefits – This fund accounts for the administration of compensated absences and health benefits.
Workers’ Compensation Insurance Program – This fund accounts for the administration of the City’s self‐insured workers’ compensation program.
General Liability Insurance Program – This fund accounts for the administration of the City’s self‐insured general liability program.
Retiree Health Benefits – This fund accounts for retiree health benefits.
Fiduciary Funds – These funds account for assets held by the City, an agent for assessment districts, and members of the Cable Joint Powers Authority. These funds are custodial in nature and do not involve measurement of results of operations. The City maintains three agency funds. The financial activities of these funds are excluded from the government‐wide financial statements, but are presented in separate fiduciary fund financial statements. Agency funds apply the accrual basis of accounting but do not have a measurement focus.

CITY OF PALO ALTO Notes to the Basic Financial Statements
For the Year Ended June 30, 2016
51
NOTE 1 – SUMMARY OF SIGNIFICANT ACCOUNTING POLICIES (Continued) (c) Major Funds and Other Funds (Continued)
California Avenue Parking Assessment District – This fund accounts for the receipts and disbursements associated with the 1993 Parking District No. 92‐13 Assessment Bonds. Cable Joint Powers Authority – This fund accounts for the activities of the cable television system on behalf of the members. University Avenue Area Off‐Street Parking Assessment District – This fund accounts for the receipts and disbursements associated with the 2012 Limited Obligation Refunding Improvement Bonds.
(d) Basis of Accounting
The government‐wide and proprietary fund financial statements are reported using the economic resources measurement focus and the full accrual basis of accounting. Revenues are recorded when earned and expenses are recorded at the time liabilities are incurred, regardless of when the related cash flows take place. Governmental funds are reported using the current financial resources measurement focus and the modified accrual basis of accounting. Under this method, revenues are recognized when measurable and available. The City considers revenues susceptible to accrual reported in the governmental funds to be available if the revenues are collected within ninety days after year‐end, except for property taxes, which are available if collected within sixty days after year‐end. Expenditures are recorded when the related fund liability is incurred, except for principal and interest on general long‐term debt, claims and judgments, and compensated absences, which are recognized as expenditures to the extent they have matured. General capital asset acquisitions are reported as expenditures in governmental funds. Proceeds of general long‐term debt and acquisitions under capital leases are reported as other financing sources. Revenues susceptible to accrual include taxes, intergovernmental revenues, interest and charges for services. Grant revenues are recognized in the fiscal year in which all eligibility requirements are met. Under the terms of grant agreements, the City may fund certain programs with a combination of cost‐reimbursement grants, categorical block grants, and general revenues. Thus, both restricted and unrestricted net position may be available to finance program expenditures. The City’s policy is to first apply restricted grant resources to such programs, followed by general revenues if necessary. Certain indirect costs are included in program expenses reported for individual functions and activities. Transactions representing the exchange of interfund goods and services have also been included.
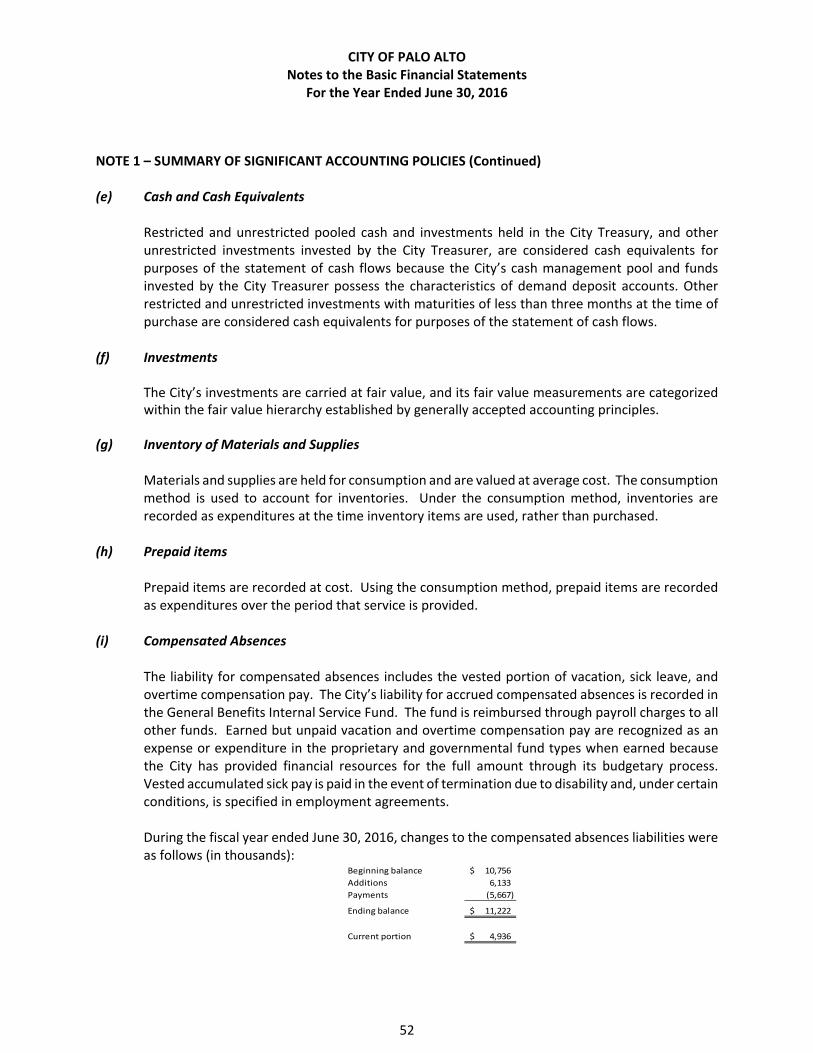
CITY OF PALO ALTO Notes to the Basic Financial Statements
For the Year Ended June 30, 2016
52
NOTE 1 – SUMMARY OF SIGNIFICANT ACCOUNTING POLICIES (Continued)
(e) Cash and Cash Equivalents
Restricted and unrestricted pooled cash and investments held in the City Treasury, and other unrestricted investments invested by the City Treasurer, are considered cash equivalents for purposes of the statement of cash flows because the City’s cash management pool and funds invested by the City Treasurer possess the characteristics of demand deposit accounts. Other restricted and unrestricted investments with maturities of less than three months at the time of purchase are considered cash equivalents for purposes of the statement of cash flows.
(f) Investments
The City’s investments are carried at fair value, and its fair value measurements are categorized within the fair value hierarchy established by generally accepted accounting principles.
(g) Inventory of Materials and Supplies
Materials and supplies are held for consumption and are valued at average cost. The consumption method is used to account for inventories. Under the consumption method, inventories are recorded as expenditures at the time inventory items are used, rather than purchased.
(h) Prepaid items
Prepaid items are recorded at cost. Using the consumption method, prepaid items are recorded as expenditures over the period that service is provided.
(i) Compensated Absences
The liability for compensated absences includes the vested portion of vacation, sick leave, and overtime compensation pay. The City’s liability for accrued compensated absences is recorded in the General Benefits Internal Service Fund. The fund is reimbursed through payroll charges to all other funds. Earned but unpaid vacation and overtime compensation pay are recognized as an expense or expenditure in the proprietary and governmental fund types when earned because the City has provided financial resources for the full amount through its budgetary process. Vested accumulated sick pay is paid in the event of termination due to disability and, under certain conditions, is specified in employment agreements.
During the fiscal year ended June 30, 2016, changes to the compensated absences liabilities were as follows (in thousands):
Beginning balance 10,756$
Additions 6,133
Payments (5,667)
Ending balance 11,222$
Current portion 4,936$

CITY OF PALO ALTO Notes to the Basic Financial Statements
For the Year Ended June 30, 2016
53
NOTE 1 – SUMMARY OF SIGNIFICANT ACCOUNTING POLICIES (Continued) (j) Property Tax
Santa Clara County (the County) assesses properties and bills, collects, and distributes property taxes to the City. The County remits the entire amount levied and handles all delinquencies, retaining interest and penalties. The County assesses property values, levies bills and collects taxes as follows:
Secured Unsecured
Lien Dates January 01 January 01
Levy Dates October 01 July 01
Due Dates 50% on November 01 Upon receipt of billing
50% on February 01
Delinquent after December 10 (for November) August 31
April 10 (for February) The term “unsecured” refers to taxes on personal property other than real estate, land and buildings. These taxes are secured by liens on the property being taxed. Property tax revenues are recognized by the City in the fiscal year they are assessed, provided they become available as defined previously within sixty days after year‐end.
(k) Deferred Outflows of Resources and Deferred Inflows of Resources
A deferred outflow of resources is the consumption of net position that is applicable to a future reporting period. A deferred inflow of resources is defined as an acquisition of net position applicable to a future reporting period.
(l) Pensions
For purposes of measuring the net pension liability and deferred outflows/inflows of resources related to pensions and pension expense, information about the fiduciary net position of the City’s California Public Employees’ Retirement System (CalPERS) Plans and additions to/deductions from the Plans’ fiduciary net position have been determined on the same basis as they are reported by CalPERS. For this purpose, benefit payments (including refunds of employee contributions) are recognized when due and payable in accordance with the benefit terms. Investments are reported at fair value.
(m) Rounding
All amounts included in the basic financial statements and footnotes are presented to the nearest thousand.

CITY OF PALO ALTO Notes to the Basic Financial Statements
For the Year Ended June 30, 2016
54
NOTE 1 – SUMMARY OF SIGNIFICANT ACCOUNTING POLICIES (Continued) (n) Effects of New Pronouncements
As of July 1, 2015, the City implemented the following GASB Statements: In February 2015 GASB issued Statement No. 72, Fair Value Measurement and Application. This Statement provides guidance for determining fair value measurement for financial reporting purposes and for applying fair value to certain investments, and requires disclosures to be made about fair value measurements, the level of fair value hierarchy, and valuation techniques. It also requires additional disclosures regarding investments in certain entities that calculate net asset value per share (or its equivalent). See Note 3 for more information. In June 2015 GASB issued Statement No. 73, Accounting and Financial Reporting for Pensions and Related Assets that are not within the Scope of GASB Statement No. 68 and amendments to certain provisions of GASB Statements No. 67 and 68. This Statement establishes requirements for defined benefit pensions that are not within the scope of Statement No. 68 as well as for the assets accumulated for purposes of providing those pensions. It amends certain provisions of Statement No. 68 for pension plans and pensions that are within its scope. The Statement also clarifies the application of certain provisions of Statement No. 68. This Statement is effective for the City’s fiscal year ending June 30, 2016, except for those provisions that address employers and government nonemployer contribution entities for pensions that are not within the scope of Statement No. 68, which are effective for the City’s fiscal year ending June 30, 2017. The Statement did not have a significant impact on the City’s financial statements. GASB issued Statement No. 76, The Hierarchy of Generally Accepted Accounting Principles for State and Local Governments, which supersedes Statement No. 55. This statement is effective for the City’s fiscal year ending June 30, 2016. The Statement did not have a significant impact on the City’s financial statements. In December 2015, the GASB issued Statement No. 79, Certain External Investment Pools and Pool Participants. The statement addresses accounting and financial reporting for certain external investment pools and pool participants. This statement is effective for the City’s fiscal year ending June 30, 2016. The Statement did not have a significant impact on the City’s financial statements. The City is currently analyzing its accounting practices to determine the potential impact on the financial statements for the following GASB Statements: In June 2015, GASB issued Statement No. 74, Financial Reporting for Postemployment Benefit Plans Other Than Pension Plans. This statement addresses reporting by OPEB plans that administer benefits on behalf of governments. This statement is effective for the City’s fiscal year ending June 30, 2017.

CITY OF PALO ALTO Notes to the Basic Financial Statements
For the Year Ended June 30, 2016
55
NOTE 1 – SUMMARY OF SIGNIFICANT ACCOUNTING POLICIES (Continued) (n) Effects of New Pronouncements (Continued)
In June 2015, GASB issued Statement No. 75, Accounting and Financial Reporting for Postemployment Benefits Other Than Pensions. This statement addresses reporting by governments that provide OPEB to their employees and for governments that finance OPEB for employees of other governments. This statement is effective for the City’s fiscal year ending June 30, 2018. In August 2015 GASB issued Statement No. 77, Tax Abatement Disclosures. The Statement defines tax abatement agreements and requires certain disclosures regarding the tax abatement in its financial statements. This statement is effective for the City’s fiscal year ending June 30, 2017. In December 2015, the GASB issued Statement No. 78, Pensions Provided through Certain Multiple‐Employer Defined Benefit Pension Plans. The objective of this statement is to address a practice issue regarding the scope and applicability of Statement No. 68 associated with pensions provided through certain cost‐sharing multiple‐employer defined benefit pension plans and to state or local governmental employers whose employees are provided with such pensions. Such plans are not considered a state or local government pension plan and are used to provide benefits to both employees of state and local governments and employees of employers that are not state or local governments. This statement is effective for the City’s fiscal year ending June 30, 2017. In January 2016, the GASB issued Statement No. 80, Blending Requirements for Certain Component Units—an amendment of GASB Statement No. 14. The objective of this statement is to improve financial reporting by clarifying the financial statement presentation requirements for certain component units. This statement amends the blending requirements established in GASB Statement No. 14, The Financial Reporting Entity, as amended. This statement is effective for the City’s fiscal year ending June 30, 2017. In March 2016, the GASB issued Statement No. 81, Irrevocable Split‐Interest Agreements. The statement provides recognition and measurement guidance for situations in which a government is a beneficiary of these agreements. This statement is effective for the City’s fiscal year ending June 30, 2018. In March 2016, the GASB issued Statement No. 82, Pension Issues – An Amendment of GASB Statements No. 67, No. 68 and No. 73. The Statement addresses issues raised with respect to GASB Statements No. 67, 68 and 73, regarding: (1) the presentation of payroll‐related measures in required supplementary information; (2) the selection of assumptions and the treatment of deviations from the guidance in an Actuarial Standard of Practice for financial reporting purposes; and (3) the classification of payments made by employers to satisfy employee (plan member) contribution requirements. This is effective for the City’s fiscal year ending June 30, 2017, except for the requirements for selection of assumptions which will be effective during the City’s fiscal year ending June 30, 2018.

CITY OF PALO ALTO Notes to the Basic Financial Statements
For the Year Ended June 30, 2016
56
NOTE 1 – SUMMARY OF SIGNIFICANT ACCOUNTING POLICIES (Continued)
(o) Use of Estimates
The accompanying basic financial statements have been prepared on the modified accrual and accrual basis of accounting in accordance with generally accepted accounting principles. This requires management to make estimates and assumptions that affect the amounts reported in the financial statements and accompanying notes. Actual results could differ from those estimates.
NOTE 2 – BUDGETS AND BUDGETARY ACCOUNTING
1. The City Manager submits proposed operating and capital budgets to the City Council for the fiscalyear commencing the following July 1. The operating budget includes proposed expenditures and themeans of financing them.
2. Public hearings are conducted to obtain comments on the proposed budgets.
3. The Budget is approved with the adoption of a budget ordinance for all funds except Agency Funds.
4. Per the Palo Alto Municipal Code, only the City Manager is authorized to reallocate funds fromcontingency accounts maintained in the General Fund. Additional appropriations to departments inthe General Fund, or to total appropriations for all other budgeted funds, or transfers ofappropriations between funds, require approval by the City Council. Amendments to budgetedrevenue and expenditures are added to or subtracted from the Adopted Budget and the resultingtotals are reflected as Final Budget amounts.
5. As defined in the Palo Alto Municipal Code, expenditures may not exceed budgeted appropriations atthe department level for the General Fund, and at the fund level for Enterprise, Special Revenue andDebt Service Funds.
6. Budgets for governmental funds are adopted on a basis consistent with generally accepted accountingprinciples (GAAP), except that unrealized gains or losses are not recognized as investment earningson a budgetary basis and encumbrances are treated as budgetary expenditures when incurred.
7. Expenditures for the Capital Projects Fund are budgeted and maintained at a project level for the lifeof the project. Budget to actual comparisons for these expenditures have been excluded from theaccompanying financial statements.
NOTE 3 – CASH AND INVESTMENTS
The City pools cash from all sources and all funds, except restricted bond proceeds with fiscal agents, and invests its pooled idle cash according to State of California law and the City’s Investment Policy. The basic principles underlying the City’s investment philosophy are to ensure the safety of public funds, ensure that sufficient funds are available to meet current expenditures, and achieve a reasonable rate of return on investments.

CITY OF PALO ALTO Notes to the Basic Financial Statements
For the Year Ended June 30, 2016
57
NOTE 3 – CASH AND INVESTMENTS (Continued) Policies The City invests in individual investments and in investment pools. Individual investments are evidenced by specific identifiable securities instruments, or by an electronic entry registering the owner in the records of the institution issuing the security, called the book entry system. In order to increase security, the City employs the trust department of a bank as the custodian of certain City managed investments. Classification Cash and investments are classified in the financial statements as shown below, based on whether or not their use is restricted under the terms of City debt instruments or agency agreements (in thousands):
Governmental Business‐Type Fiduciary
Activities Activities Funds Total
Cash and investments:
Available for operations 294,051$ 240,570$ 2,647$ 537,268$
Held with fiscal agents 959 4,115 2,550 7,624
Total cash and investments 295,010$ 244,685$ 5,197$ 544,892$
Investments Authorized by the City’s Investment Policy and Debt Agreements The table below identifies the investment types that are authorized by the California Government Code (Code) and the City’s Investment Policy. The table also identifies certain provisions of the City’s Investment Policy that address interest rate risk, credit risk and concentration of credit risk. The table addresses investment of debt proceeds held by bond trustees that are governed by the provisions of debt agreements of the City, rather than the general provisions of the City’s Investment Policy. The City must maintain required amounts of cash and investments with trustees under the terms of certain debt issues. These funds are unexpended bond proceeds or are pledged as reserves to be used if the City fails to meet its obligations under these debt issues. The Code requires these funds to be invested in accordance with City ordinance, bond indentures or state statute. All of these funds have been invested as permitted under the Code and the investment policy approved by the City Council.

CITY OF PALO ALTO Notes to the Basic Financial Statements
For the Year Ended June 30, 2016
58
NOTE 3 – CASH AND INVESTMENTS (Continued)
Maximum
Maturity
Minimum
Credit Quality
Maximum
Percentage
of Portfolio
Maximum
Investment in
One Issuer
U.S. Government Securities 10 years (*) N/A No Limit No Limit
U.S. Federal Agency Securities (C) 10 years (*) N/A No Limit (A) No Limit
Certificates of Deposit 10 years (*) N/A 20%
10% of the par
value of
portfolio
Bankers Acceptances 180 days (D) N/A (D) 30% $5 million
Commercial Paper 270 days A‐1 15% $3 million (B)
Local Agency Investment Fund N/A N/A No Limit
$50 million per
account
Short‐Term Repurchase Agreements 1 year N/A No Limit No Limit
City of Palo Alto Bonds N/A N/A No Limit No Limit
Money Market Mutual Funds N/A N/A (E) No Limit No Limit
Mutual Funds (F) N/A N/A 20% 10%
Negotiable Certificates of Deposit 10 years (*) N/A 10% $5 million
Medium‐Term Corporate Notes 5 years AA 10% $5 million
10 years (*) AA/AA2 10% No Limit
(A)
(B) The lesser of $3 mill ion or 10% of outstanding commercial paper of any one institution.
Debt Agreements:
(C)
(D)
(E)
(F)
(*) The maximum maturity is based on the Investment Policy that is approved by the City Council and is less
restrictive than the California Government Code.
Utility Revenue Bonds 2011 Refunding, General Obligation Bonds 2010 and 2013A, and University Avenue Parking
Bond 2012 are allowed to invest in the California Asset Management Program.
Authorized Investment Type
Bonds of State of California
Municipal Agencies
Callable and multi‐step securities are l imited to no more than 25% of the par value of the portfolio, provided that:
1) the potential call dates are known at the time of purchase, 2) the interest rates at which they "step‐up" are
known at the time of purchase, 3) the entire face value of the security is redeemable at the call date.
Uti l ity Revenue Bonds 2011 Refunding and 1999 Refunding allow general obligations of states with a minimum
credit quality rating of A2/A by Moody's and Standard & Poor's.
Uti l ity Revenue Bonds 2011 Refunding and 1999 Refunding require a minimum credit quality rating of A‐1/P‐1 by
Moody's and Standard & Poor's and maturing after no more than 360 days. Util ity Revenue Bonds 1995 Series A
l imit the maximum maturity to 365 days.
Water Revenue Bonds 2009 Series A, Utility Revenue Bonds 2011 Refunding and 1999 Refunding require a
minimum credit quality rating of AAAm or AAAm‐G by Standard & Poor's.

CITY OF PALO ALTO Notes to the Basic Financial Statements
For the Year Ended June 30, 2016
59
NOTE 3 – CASH AND INVESTMENTS (Continued)
Fair Value Measurements The City categorizes its fair value measurements within the fair value hierarchy established by generally accepted accounting principles. The hierarchy is based on the valuation inputs used to measure fair value of the assets. Level 1 inputs are quoted prices in an active market for identical assets; Level 2 inputs are significant other observable inputs; and Level 3 inputs are significant unobservable inputs. All of the investments are measured using level 2 inputs, except for investments in money market mutual funds, California Asset Management Program and Local Agency Investment Fund, which are not subject to the fair value hierarchy.
Investment securities classified in Level 2 of the fair value hierarchy are valued using prices determined by the use of matrix pricing techniques maintained by the pricing vendors for these securities. Matrix pricing is used to value securities based on the securities relationship to benchmark quoted prices.
The following is a summary of the fair value measurements of the City as of June 30, 2016:
Type of Investment June 30, 2016 Level 2
Investments by fair value hierarchy
U.S. Federal Agency Securities 382,730$ 382,730$
U.S. Treasury Notes 11,607 11,607
Local Government Bonds 32,408 32,408
Negotiable Certificates of Deposit 34,273 34,273
Corporate Bonds 15,571 15,571
Total investments by fair value hierarchy 476,589 476,589$
Investment not subject to fair value hierarchy
Money Market Mutual Funds 6,754
California Asset Management Program 3,247
Local Agency Investment Fund 57,487
Total investments not subject to fair value hierarchy 67,488
Total investments measured at fair value 544,077$
Local Agency Investment Fund The City is a participant in the Local Agency Investment Fund (LAIF) that is regulated by California Government Code Section 16429 under the oversight of the Treasurer of the State of California. LAIF management calculates the fair value and cost of the entire LAIF pool. The City adjusts its cost basis invested in LAIF to fair value based on this ratio. The fair value of the City’s position in the pool is the same as the value of the pool share. The balance available for withdrawal on demand is based on accounting records maintained by LAIF, which are recorded on an amortized cost basis. At June 30, 2016, LAIF had a weighted average maturity of 167 days.

CITY OF PALO ALTO Notes to the Basic Financial Statements
For the Year Ended June 30, 2016
60
NOTE 3 – CASH AND INVESTMENTS (Continued)
California Asset Management Program The City is a voluntary participant in the California Asset Management Program (CAMP). CAMP is an investment pool offered by the California Asset Management Trust (the Trust). The Trust is a joint powers authority and public agency created by the Declaration of Trust and established under the provisions of the California Joint Exercise of Powers Act (California Government Code Sections 6500 et seq., or the “Act”) for the purpose of exercising the common power of its participants to invest certain proceeds of debt issues and surplus funds. The City’s investments are limited to investments permitted by subdivisions (a) to (n), inclusive, of Section 53601 of the California Government Code. The City reports its investments in CAMP at the fair value amounts provided by CAMP, which is the same as the value of the pool share. At June 30, 2016, the fair value approximated the City’s cost. CAMP had a weighted average maturity of 45 days at June 30, 2016.
Fidelity Institutional Asset Management Money market mutual funds are available for withdrawal on demand and at June 30, 2016, had a weighted average maturity of 34 days.
Interest Rate Risk Interest rate risk is the risk that changes in market interest rates may adversely affect the fair value of an investment. Normally, the longer the maturity of an investment, the greater the sensitivity its fair value is to changes in market interest rates.
Type of Investment
Less Than
One Year
One to
Three Years
Three to
Five Years
Over
Five Years Total
U.S. Federal Agency Securities 66,280$ 116,905$ 77,049$ 122,496$ 382,730$
U.S. Treasury Notes ‐ 8,589 3,018 ‐ 11,607
Local Government Bonds ‐ 263 9,025 23,120 32,408
Corporate Bonds ‐ 2,915 12,656 ‐ 15,571
Money Market Mutual Funds 6,754 ‐ ‐ ‐ 6,754
Negotiable Certificates of Deposit 246 9,751 15,262 9,014 34,273
California Asset Management Program 3,247 ‐ ‐ ‐ 3,247
Local Agency Investment Fund 57,487 ‐ ‐ ‐ 57,487
Total Investments 134,014$ 138,423$ 117,010$ 154,630$ 544,077
Cash in bank and on hand 815
Total Cash and Investments 544,892$
Maturities

CITY OF PALO ALTO Notes to the Basic Financial Statements
For the Year Ended June 30, 2016
61
NOTE 3 – CASH AND INVESTMENTS (Continued)
Investment with Fair Values Highly Sensitive to Interest Rate Fluctuations At June 30, 2016, the City’s investments (including investments held by bond trustees) include U.S. Federal Agency Callable Securities in the amount of $107.4 million that are highly sensitive to interest rate fluctuations (to a greater degree than already indicated in the information provided in the previous page). These securities are subject to early redemption at par in a period of declining interest rates.
Credit Risk Credit risk is the risk that an issuer of an investment will not fulfill its obligation to the holder of the investment. This is measured by the assignment of a rating by a nationally recognized statistical rating organization. Presented below is the actual rating as provided by Standard & Poor’s investment rating system as of June 30, 2016, for each investment type (in thousands):
Type of Investment Rating Total
U.S. Federal Agency Securities AA+ 382,730$
Corporate Bonds AAA 15,571
Local Government Bonds AAA 32,408
Money Market Mutual Funds AAAm 6,754
Total Investments 437,463
Not Applicable:
U.S. Treasury Notes 11,607
Not Rated:
California Asset Management Program 3,247
Local Agency Investment Fund 57,487
Negotiable Certificates of Deposit 34,273
Cash in bank and on hand 815
Total Cash and Investments 544,892$
Concentration of Credit Risk Investments in any one issuer, other than U.S. Treasury securities, mutual funds, and external investment pools, that represent 5 percent or more of total City portfolio investments are as follows at June 30, 2016 (in thousands):
Investments Reporting Type Fair Value at Year‐End
Federal Home Loan Bank U.S. Federal Agency Securities 120,065$
Federal Agricultural Mortgage Corporation U.S. Federal Agency Securities 104,357
Federal National Mortgage Corporation U.S. Federal Agency Securities 44,843
Federal Farm Credit Bank U.S. Federal Agency Securities 72,407
Federal Home Loan Mortgage Corporation U.S. Federal Agency Securities 27,354

CITY OF PALO ALTO Notes to the Basic Financial Statements
For the Year Ended June 30, 2016
62
NOTE 3 – CASH AND INVESTMENTS (Continued)
Custodial Credit Risk California law requires banks and savings and loan institutions to pledge government securities with a market value of 110 percent of the City’s cash on deposit or first trust deed mortgage notes with a value of 150 percent of the deposit as collateral for these deposits. Under California Law, this collateral is considered held in the City’s name and places the City ahead of general creditors of the institution. The City has waived collateral requirements for the portion of deposits covered by federal deposit insurance.
The custodial credit risk for investments is the risk that, in the event of the failure of the counterparty to a transaction, the City will not be able to recover the value of its investment or collateral securities that are in the possession of another party. The City’s Investment Policy limits its exposure to custodial credit risk by requiring that all security transactions entered into by the City be conducted on a delivery‐versus‐payment basis. Securities are to be held by a third‐party custodian.
NOTE 4 – INTERFUND TRANSACTIONS
Transfers Between Funds With Council approval, resources may be transferred from one City fund to another. The purpose of the majority of transfers is to subsidize a fund. Less often, a transfer may be made to open or close a fund. Transfers between City funds during FY 2016 were as follows (in thousands):
Fund Making Transfer
Amount
TransferredGeneral Fund Nonmajor Governmental Funds 422$ A
Electric Services Fund 11,659 AGas Services Fund 6,194 AInternal Service Funds 42 A
Capital Projects Fund General Fund 30,367 BNonmajor Governmental Funds 5,674 BWater Services Fund 113 BElectric Services Fund 273 BFiber Optics Fund 17 BGas Services Fund 101 BWastewater Collection Fund 58 BRefuse Services Fund 69 BInternal Service Funds 30 B
Nonmajor Governmental Funds General Fund 946 ACapital Projects Fund 3,018 F
Nonmajor Governmental Funds 2,816 A
Water Services Fund 5 A
Electric Services Fund 12 A
Fiber Optics Fund 1 A
Gas Services Fund 4 A
Wastewater Collection Fund 2 A
Internal Service Funds 12 ASubtotal 61,835
Fund Receiving Transfer

CITY OF PALO ALTO Notes to the Basic Financial Statements
For the Year Ended June 30, 2016
63
NOTE 4 – INTERFUND TRANSACTIONS (Continued)
Fund Making Transfer
Amount
TransferredWater Services Fund Gas Services Fund 111$ B
Wastewater Collection Fund 111 BElectric Services Fund General Fund 33 D
Fiber Optics Fund 102 DInternal Service Funds 124 C
Refuse Services Fund General Fund 40 DNonmajor Governmental Funds 101 DInternal Service Funds 215 C
Storm Drainage Services Fund General Fund 234 CInternal Service Funds General Fund 2,841 E
Water Services Fund 247 BElectric Services Fund 166 BFiber Optics Fund 1 BGas Services Fund 260 BWastewater Collection Fund 224 BWastewater Treatment Fund 12 BRefuse Services Fund 28 BStorm Drainage Services Fund 6 BInternal Service Funds 2,103 E
Subtotal 6,959
Total 68,794$
The reasons for these transfers are set forth below:(A) Transfer to fund governmental funds for services provided.(B) Allocation of funds to construct, purchase or maintain capital assets.(C) Transfer to refund replacement charges.
(D) Transfer to fund Utility funds for services provided.(E) Transfer to fund Internal Service funds for services provided.(F) Transfer remaining bond proceeds to debt service.
Fund Receiving Transfer
Long‐Term Interfund Advance On December 6, 2010, the City Council accepted an Airport Business Plan of the Palo Alto Airport (PAO) and approved creation of the Airport Enterprise Fund to facilitate the transition of PAO control from County of Santa Clara to the City. Council approved the following General Fund advances to the Airport Fund:
$ 610,000 Due June 2019 325,000 Due July 2023 760,000 Due July 2024 516,000 Due July 2025
All advances bear interest equal to the average return yield on the City’s investment portfolio. As of June 30, 2016, the total outstanding principal amount is $2.2 million.

CITY OF PALO ALTO Notes to the Basic Financial Statements
For the Year Ended June 30, 2016
64
NOTE 4 – INTERFUND TRANSACTIONS (Continued) Internal Balances Internal balances represent the net interfund receivables and payables remaining after the elimination of all such balances within governmental and business‐type activities. NOTE 5 – NOTES AND LOANS RECEIVABLE At June 30, 2016, the City’s notes and loans receivable totaled (in thousands):
Palo Alto Housing Corporation:
Oak Manor Townhouse 68$ Tree House Apartments 5,343 Emerson Street Project 375 Alma Single Room Occupancy Development 2,222 Barker Hotel 2,111 Sheridan Apartments 2,222 Oak Court Apartments, L.P. 7,834
Mid‐Peninsula Housing Coalition:
Palo Alto Gardens Apartments 100 Community Working Group, Inc. 1,280 Opportunity Center Associates, L.P. 750 Home Rehabilitation Loans 52 Executive Relocation Assistance Loans 513 Below Market Rate Assessment Loans 54 Oak Manor Townhouse Water System 114 Lytton Gardens Assisted Living 101 Emergency Housing Consortium 75 Alma Gardens Apartments 1,150 2811‐2825 Alma Street Acquisition 1,890 Palo Alto Family Housing, 801 Alma Street 6,422 Palo Alto Senior Housing Project ‐ Stevenson House, LLC 1,000 Colorado Park Housing Corporation 204
Total Notes and Loans 33,880 Less: Valuation Allowance (14,637)
Total Notes and Loans, Net 19,243$
Housing Loans The City engages in programs designed to encourage construction or improvement in low‐to‐moderate income housing or other projects. Under these programs, grants or loans are provided under favorable terms to homeowners or developers who agree to spend these funds in accordance with the City’s terms. These loans have been offset by restricted or committed fund balances, as they are not expected to be repaid immediately.
CITY OF PALO ALTO Notes to the Basic Financial Statements
For the Year Ended June 30, 2016
65
NOTE 5 – NOTES AND LOANS RECEIVABLE (Continued) Some of these loans contain forgiveness clauses that provide for the amount loaned to be forgiven if the third party maintains compliance with the terms of the loan and associated regulatory agreements. Since some of these loans are secured by trust deeds that are subordinated to other debt on the associated projects or are only repayable from residual cash receipts on the projects, collectability of some of the outstanding balances may not be realized. As a result of the forgiveness clauses and nature of these housing projects and associated cash flows, a portion of the outstanding balances of the loans has been offset by a valuation allowance. Oak Manor Townhouse On January 7, 1991, the City loaned $2.1 million to Palo Alto Housing Corporation Apartments, Inc. to assist in the acquisition of an apartment complex to be used to provide rental housing for low and very low income households. This loan bears interest at 3 percent, is due in annual installments until 2017 and is collateralized by a subordinated deed of trust. Under the terms of the loan agreement, annual loan payments are forgiven if the Corporation meets the objective of this project. During the year ended June 30, 2016, the objective was met and the annual loan payment was forgiven. Tree House Apartments In March 2009, the City agreed to loan $2.8 million to Tree House Apartments, L.P. (THA) for the purchase of the real property located at 488 West Charleston Road. The loan accrues simple interest at the rate of 3 percent per annum. The loan was funded with $1.8 million of Community Development Block Grant (CDBG) funds and $1.0 million of residential housing funds. An additional development loan in the amount of $2.5 million was approved by the City on October 18, 2010. As of June 30, 2016, the outstanding balance for THA in aggregate is $5.3 million. Principal and interest payments will be deferred, however if the borrower has earned extra income, and if it is acceptable to the other entities providing final permanent sources of funds, payment of interest and principal based on the City’s proportionate share of the project’s residual receipts from net operating income shall be made by the borrower. In no event shall full payment be made by the borrower later than concurrently with the expiration or earlier termination of the loan agreement, which is December 31, 2067. Emerson Street Project On November 8, 1994, the City loaned $375,000 to Palo Alto Housing Corporation (PAHC) for expenses necessary to acquire an apartment complex for the preservation of rental housing for low and very low income households in the City. This loan is collateralized by a second deed of trust. The loan bears interest at 3 percent. Alma Single Room Occupancy Development On December 13, 1996, the City loaned $2.2 million to Alma Place Associates, L.P. for development of a 107‐unit single room occupancy development. This loan bears interest at 3 percent and is collateralized by a subordinated deed of trust. The principal balance is due in 2041.

CITY OF PALO ALTO Notes to the Basic Financial Statements
For the Year Ended June 30, 2016
66
NOTE 5 – NOTES AND LOANS RECEIVABLE (Continued) Barker Hotel On April 12, 1994, the City loaned a total of $2.1 million for the preservation, rehabilitation and expansion of a low‐income, single occupancy hotel. This loan was funded by three sources: $400,000 from the Housing In‐Lieu Fund, $1 million from HOME Investment Partnership Program Funds, and $670,000 from CDBG funds. All three notes bear no interest and are collateralized by a deed of trust, which is subordinated to private financing. Loan repayments are deferred until 2035. In July 2004, the City agreed to loan up to $41,000 to PAHC to rehabilitate the interior of the Barker Hotel. The loan was funded with CDBG funds and is collateralized by a deed of trust on the property. Annual loan payments are deferred until certain criteria defined in the loan agreement are reached. The loan will be forgiven if the borrower satisfactorily complies with all terms and conditions of the loan agreement. Sheridan Apartments On December 8, 1998, the City loaned $2.5 million to PAHC for the purchase and rehabilitation of a 57‐unit apartment complex to be used for senior and low‐income housing. The loan was funded with $1.6 million in CDBG funds, and $825,000 of Housing In‐Lieu funds. The note bears interest at 9 percent when available surplus cash from the project equals or exceeds 25 percent of interest calculated using 9 percent. When available surplus cash falls below this level, the note bears interest at 3 percent. The note is collateralized by a second deed of trust and an affordability reserve account held by PAHC. As of June 30, 2016, principal payments totaling $228,000 have been made, and interest has also been paid. The remaining principal balance is due in 2033. Oak Court Apartments, L.P. On August 18, 2003, in connection with the loan to Oak Court Apartments, L.P. discussed in the next section, the City loaned $5.9 million to PAHC for the purchase of land on which Oak Court Apartments, L.P. constructed a 53‐unit rental apartment complex for low and very low income households with children. The note bears interest of 5 percent and is secured by a deed of trust. Note payments are due annually after 55 years, or beginning in 2058, unless PAHC elects to extend the note until 2102, as defined in the regulatory agreement. On August 18, 2003, the City loaned $1.9 million to Oak Court Apartments, L.P. for the construction of a 53‐unit rental apartment complex for low and very low‐income households with children, which was completed in April 2005. The note bears no interest until certain criteria defined in the note are satisfied, at which time the note will bear an interest rate not to exceed 3 percent. The note is secured by a subordinate deed of trust. The principal balance is due in 2060. Palo Alto Gardens Apartments On April 22, 1999, the City loaned $1 million to Mid‐Peninsula Housing Coalition (the Coalition) for the purchase and rehabilitation of a 155‐unit complex for the continuation of low‐income housing. The loan was funded with $659,000 of CDBG funds and $341,000 of Housing In‐Lieu funds. The two notes bear interest at 3 percent and are secured by second deeds of trust and a City Affordability Reserve Account held by the Coalition. Principal and interest payments began in FY 2008. The principal balance of $100,000 is due in 2039.

CITY OF PALO ALTO Notes to the Basic Financial Statements
For the Year Ended June 30, 2016
67
NOTE 5 – NOTES AND LOANS RECEIVABLE (Continued) Community Working Group, Inc. On May 13, 2002, the City loaned $1.3 million to Community Working Group, Inc. for predevelopment, relocation and acquisition of land for development of an 89‐unit complex and homeless service center for very low income households. The loan was funded with $1.3 million of CDBG funds. The note bears no interest and is secured by a first deed of trust. No repayment of the $1.3 million will be required, provided that compliance with the City’s agreement is maintained. After 89 years of compliance with the regulatory agreement, the City’s loan would convert to a grant and its deed of trust would be re‐conveyed.
Opportunity Center Associates, L.P. On July 19, 2004, the City loaned $750,000 for a 55‐year term to Opportunity Center Associates, L.P. for construction of 89 units of rental housing for extremely low‐income and very low‐income households. The loan was funded with $750,000 of residential housing funds. The note bears 3 percent interest and is secured by a deed of trust. The loan remains outstanding and becomes due at the end of the 55‐year term.
Home Rehabilitation Loans The City administers a closed housing rehabilitation loan program initially funded with CDBG funds. Under this program, individuals with incomes below a certain level are eligible to receive low interest loans for rehabilitation work on their homes. These loans are secured by deeds of trust, which may be subordinated to subsequent encumbrances upon said real property with the prior written consent of the City. The loan repayments may be amortized over the life of the loans, deferred, or a combination of both. Executive Relocation Assistance Loans The City Council may authorize a mortgage loan as part of a relocation assistance package to executive staff. The loans are secured by first deeds of trust, and interest is adjusted annually based on the rate of return of invested funds of the City for the year ended June 30 plus one‐quarter of 1 percent. Principal and interest payments are due bi‐weekly. Employees must pay any outstanding balance on their loans within a certain period after ending employment with the City. As of June 30, 2016, the City had one outstanding home loan from the current City Manager.
The original purchase cost for the current City Manager’s home was $1.9 million and the City holds a 75 percent equity share. The loan balance owed as of June 30, 2016 is $403,000. During FY 2011, the Council authorized a capital improvement loan of $125,000. Loans for capital improvements are made on a dollar for dollar matching basis, with an equal equity contribution made by the City Manager. The loan balance owed as of June 30, 2016 was $110,000. Below Market Rate Assessment Loans In December 2002, the City loaned $53,000 to below market rate homeowners with low incomes and/or very limited assets for capital repairs, special assessments and improvements of their properties. The loans bear interest at 3 percent and are secured by a deed of trust on each property. Loan payments are deferred until 2032. In 2016, the City did not receive interest payments.
CITY OF PALO ALTO Notes to the Basic Financial Statements
For the Year Ended June 30, 2016
68
NOTE 5 – NOTES AND LOANS RECEIVABLE (Continued)
Oak Manor Townhouse Water System On May 12, 2003, the City Council approved an allocation of $114,000 to Palo Alto Housing Corporation Apartments, Inc (PAHCA, Inc) to replace the water pipes. Repayment of the loan will not be required unless the property is sold, the program is terminated or purpose of the program is changed without City’s approval prior to July 1, 2033. The loan for this project is subordinated to the existing City loan with PAHCA, Inc dated January 7, 1991 for the acquisition of the project site, which is discussed earlier in this section.
Lytton Gardens Assisted Living In June 2005, the City loaned $101,000 to Community Housing, Inc. to upgrade and modernize the existing kitchens at the senior residential facility known as Lytton Gardens Assisted Living. The loan was funded with CDBG funds, and bears simple interest of 3 percent. Principal and interest payments are deferred until July 1, 2035, as long as the borrower continues to comply with all terms and conditions of the agreement.
Emergency Housing Consortium In November 2005, the City agreed to loan up to $75,000 to Emergency Housing Consortium to cover architectural expenses that will be incurred in rehabilitating and expanding the property. The loan was funded with CDBG funds, and bears simple interest of 3 percent. Principal and interest payments are deferred until July 1, 2035, as long as the borrower continues to comply with all terms and conditions of the agreement.
Alma Garden Apartments In March 2006, the City agreed to loan up to $1.2 million to Community Working Group, Inc. to acquire a 10‐unit multi‐family housing complex known as Alma Garden Apartments. The loan was funded with CDBG funds. Principal and interest payments are deferred until July 1, 2061 as long as the borrower complies with all terms and conditions of the agreement.
2811‐2825 Alma Street Acquisition On October 9, 2011, the City agreed to loan $1.3 million to PAHC Properties Corporation (PAHC) to acquire properties on Alma Street for the purpose of developing an affordable rental housing project. On June 29, 2015, the City loaned PAHC an additional $0.6 million, and entered into an Amended and Restated Acquisition and Development Agreement which combined the two loans for a total loan of $1.9 million. The loan term expires on December 8, 2066 with an option to extend the term for an additional 44 years. The loan bears simple interest of 3 percent, however in the event of default interest will accrue at the lesser of 8 percent or the highest rate permitted by law. Principal and interest payments are payable during the term of the agreement on a “residual receipt” basis as described in the agreement. All principal and interest is due in the event of an unauthorized transfer, a default or the expiration of the term. As of June 30, 2016, the outstanding balance was $1.9 million.
CITY OF PALO ALTO Notes to the Basic Financial Statements
For the Year Ended June 30, 2016
69
NOTE 5 – NOTES AND LOANS RECEIVABLE (Continued)
Palo Alto Family Housing, 801 Alma Street On February 14, 2011, the City agreed to loan Palo Alto Family, LP up to $9.3 million for the purposes of predevelopment expenses and acquiring certain real property for the Alma Street Affordable Multi‐Family Rental Housing Project. The loan bears simple interest of 3 percent. Principal and interest are due and payable during the term of the agreement on a “residual receipt” basis as described in the agreement. Except in the case of default, all remaining principal and interest shall be payable on the Restriction Termination Date as defined in the agreement. As of June 30, 2016, the outstanding amount is $6.4 million.
Palo Alto Senior Housing Project On October 1, 2015, the City entered into an affordable housing fund loan agreement with PASHPI Stevenson House LP, a California limited partnership, in the principal amount of $1 million to assist in the rehabilitation of the Stevenson House. The loan bears simple interest of 3 percent. The loan remains outstanding and is due at the end of the 55‐year term.
Colorado Park Housing Corporation On September 8, 2014, the City entered into an affordable housing fund loan agreement with Colorado Park Housing Corporation (CPHC), a California nonprofit public benefit corporation, in the principal amount of $204,000. The loan bears no interest except in the event of default. The principal and any accrued interest is due and payable on the earlier of (a) expiration of the term, or (b) a default by CPHC which has not been cured as provided for in the agreement.

CITY OF PALO ALTO Notes to the Basic Financial Statements
For the Year Ended June 30, 2016
70
NOTE 6 – CAPITAL ASSETS
Valuation Capital assets are valued at historical cost or estimated historical cost if actual historical cost is not available. Contributed capital assets are valued at their estimated fair value on the date contributed. The City’s policy is to capitalize all assets when costs are equal to or exceed $5,000 and the useful life exceeds one year. Infrastructure assets are capitalized when costs are equal to or exceed $100,000.
Proprietary fund capital assets are recorded at cost including significant interest costs incurred under restricted tax‐exempt borrowings, which finance the construction of capital assets. These interest costs, net of interest earned on investment of proceeds of such borrowings, are capitalized and added to the cost of capital assets during the construction period. Maintenance and repairs are expensed as incurred.
The City has recorded all its public domain capital assets, consisting of roadway and recreation and open space, in its government‐wide financial statements. GASB Statement No. 34 requires that all capital assets with limited useful lives be depreciated over their estimated useful lives. Alternatively, the “modified approach” may be used for certain capital assets. Depreciation is not provided under this approach, but all expenditures on these assets are expensed unless they are additions or improvements. The City has elected to use the depreciation method for its capital assets. The purpose of depreciation is to spread the cost of capital assets equitably among all users over the life of those assets. The amount charged to depreciation expense each year represents that year’s pro rata share of the cost of capital assets.
Depreciation of capital assets is charged as an expense against operations each year and the total amount of depreciation taken over the years, called accumulated depreciation, is reported on the statement of net position as a reduction in the book value of capital assets.
Depreciation is calculated using the straight line method, which means the cost of the asset is divided by its expected useful life in years, and the result is charged to expense each year until the asset is fully depreciated. The City has assigned the useful lives listed below to capital assets.
Governmental Activities Years
Buildings and structures 20 ‐ 30
Equipment:
Computer equipment 3 ‐ 5
Office machinery and equipment 5
Machinery and equipment 5 ‐ 30
Intangible assets ‐ software 5‐20
Roadway network:
5 ‐ 40
Recreation and open space network:
25 ‐ 40
Business‐type Activities
Buildings and structures 25 ‐ 60
Vehicles and heavy equipment 3 ‐ 10
Machinery and equipment 10 ‐ 50
Transmission, distribution and treatment systems 10 ‐ 100
Includes pavement, striping and legends, curbs, gutters and sidewalks, parking lots,
traffic signage, and bridges
Includes major park facilities, park trails, bike paths and medians
CITY OF PALO ALTO Notes to the Basic Financial Statements
For the Year Ended June 30, 2016
71
NOTE 6 – CAPITAL ASSETS (Continued) General Capital Assets Changes in the City’s general capital assets during the year ended June 30, 2016 were (in thousands):
Balance Balance
July 1, 2015 Additions Retirements Transfers June 30, 2016
Governmental activities
Nondepreciable capital assets:
Land and improvements 79,047$ ‐$ (566)$ ‐$ 78,481$
Street trees 15,077 ‐ ‐ ‐ 15,077
Intangible assets ‐ Easement 3,567 ‐ ‐ ‐ 3,567
Construction in progress 39,333 24,361 (349) (16,818) 46,527
Total nondepreciable capital assets 137,024 24,361 (915) (16,818) 143,652
Depreciable capital assets:
Buildings and structures 221,696 25 (1,898) 1,087 220,910
Intangible assets ‐ Software 279 ‐ ‐ ‐ 279
Equipment 12,265 308 ‐ 286 12,859
Roadway network 299,242 ‐ ‐ 9,330 308,572
Recreation and open space network 27,632 ‐ (669) 6,115 33,078
Total depreciable capital assets 561,114 333 (2,567) 16,818 575,698
Less accumulated depreciation:
Buildings and structures (76,179) (6,020) 2,974 ‐ (79,225)
Intangible assets ‐ Software (206) (59) ‐ ‐ (265)
Equipment (7,944) (426) ‐ ‐ (8,370)
Roadway network (134,027) (7,069) ‐ ‐ (141,096)
Recreation and open space network (9,908) (965) ‐ ‐ (10,873)
Total accumulated depreciation (228,264) (14,539) 2,974 ‐ (239,829)
Depreciable capital assets, net 332,850 (14,206) 407 16,818 335,869
Internal service fund capital assets
Construction in progress 1,350 3,704 ‐ (3,225) 1,829
Equipment 53,419 9 (1,241) 3,225 55,412
Less accumulated depreciation (39,454) (2,525) 1,204 ‐ (40,775)
Net internal service fund capital assets 15,315 1,188 (37) ‐ 16,466
Governmental activities capital assets, net 485,189$ 11,343$ (545)$ ‐$ 495,987$

CITY OF PALO ALTO Notes to the Basic Financial Statements
For the Year Ended June 30, 2016
72
NOTE 6 – CAPITAL ASSETS (Continued) Business‐type Capital Assets Changes in the City’s enterprise fund capital assets during the year ended June 30, 2016 were (in thousands):
Balance Balance
July 1, 2015 Additions Retirements Transfers June 30, 2016
Business‐type activities
Nondepreciable capital assets:
Land and improvements 4,973$ ‐$ ‐$ ‐$ 4,973$
Construction in progress 89,909 39,088 (1,566) (33,461) 93,970
Total nondepreciable capital assets 94,882 39,088 (1,566) (33,461) 98,943
Depreciable capital assets:
Buildings and structures 53,505 ‐ ‐ 3,424 56,929
Transmission, distribution and treatment systems 717,669 269 (1,323) 30,037 746,652
Total depreciable capital assets 771,174 269 (1,323) 33,461 803,581
Less accumulated depreciation:
Buildings and structures (10,606) (970) ‐ ‐ (11,576)
Transmission, distribution and treatment systems (296,917) (18,210) 986 ‐ (314,141)
Total accumulated depreciation (307,523) (19,180) 986 ‐ (325,717)
Depreciable capital assets, net 463,651 (18,911) (337) 33,461 477,864
Business‐type activities capital assets, net 558,533$ 20,177$ (1,903)$ ‐$ 576,807$
Capital Asset Contributions Some capital assets may be acquired using federal and state grant funds, or they may be contributed by developers or other governments. Generally accepted accounting principles require that these contributions be accounted for as revenues at the time the capital assets are contributed. Depreciation Allocation Depreciation expense was charged to functions and programs based on their usage of the related assets. The amount allocated to each function or program is as follows (in thousands):
Governmental Activities Business‐type Activities
City Manager 37$ Water 2,743$
City Attorney 3 Electric 7,601
Administrative Services 2 Fiber Optics 328
Community Services 1,814 Gas 2,827
Public Safety 334 Wastewater Collection 1,932
Public Works 9,863 Wastewater Treatment 2,956 Planning and Community Environment 166 Refuse 77
Library 2,320 Storm Drainage 716
Internal Service Funds 2,525 19,180$
17,064$

CITY OF PALO ALTO Notes to the Basic Financial Statements
For the Year Ended June 30, 2016
73
NOTE 6 – CAPITAL ASSETS (Continued) Construction In Progress Construction in progress as of June 30, 2016 is comprised of the following (in thousands):
Governmental Activities
Expended to
June 30, 2016
California Avenue‐Transit Hub Corridor 6,703$
City Hall First Floor Renovation 4,307
Magical Bridge Playground 3,554
Traffic Signal Upgrades 2,529
Furniture/Technology for Library Bond Project 2,324
Highway 101 Pedestrian/Bicycle Overpass 1,918
Telephone Infrastructure and Network 1,582
Transportation and Parking Improvements 1,413
Safe Routes To School 1,148
Bicycle Boulevards Implementation Project 1,127
Golf Reconfig and Baylands Athletic Center 1,119
Curb & Gutter Repairs 1,104
Charleston/Arastradero Corridor 1,023
Park Trails 960
Parks Master Plan 852
Eleanor Pardee Park Imp 739
Newell Road Bridge/SFC Bridge Replacemen 719
Library & Comm Center Temp Facilities 657
Benches/Signage/Fencing/Walkways 596
Interior Finishes Construction 584
Temporary Main Library 536
Other Construction In Progress 12,862
Total Governmental Activities Construction In Progress 48,356$
Business‐type Activities
Expended to
June 30, 2016
Water system extension replacements and improvements 10,928$
Gas system extension replacements and improvements 2,184
Sewer system rehabilitation and extensions 6,765
Electric distribution system improvements 7,753
Water quality control plant equipment replacement and lab facilities 3,612
Storm drainage structural and water quality improvements 3,097
Other electrical improvements projects 1,430
Other construction in progress 58,201
Total Business‐type Activities Construction In Progress 93,970$

CITY OF PALO ALTO Notes to the Basic Financial Statements
For the Year Ended June 30, 2016
74
NOTE 6 – CAPITAL ASSETS (Continued) Construction In Progress Allocations of business‐type activity administration and general expenses of $12.0 million have been capitalized and included in amounts expended to June 30, 2016. Major governmental capital projects that are currently in progress, and the remaining capital commitment of each, are as follows: Golf Course reconfiguration and Baylands Athletic Center ‐ $10.2 million Lucie Stern Buildings mechanical and electrical upgrades ‐ $2.8 million Bicycle and pedestrian transportation plan ‐ $2.6 million
Major business‐type capital projects that are currently in progress, and the remaining capital commitment of each, are as follows: Seismic water system upgrades for Water fund ‐ $4.4 million Channing Avenue/Lincoln Avenue storm drain improvement ‐ $3.6 million Wastewater Collection Fund rehabilitation/augmentation ‐ $9.2 million
Vehicle Registration Fees (VRF) In FY 2016, the City received VRF funds from the Santa Clara Valley Transportation Authority and expended the full amount on capital expenditures for Alma/Middlefield Resurfacing Project (Project PE‐86070).:
Starting VRF balance July 1, 2015 ‐$
VRF revenue 406,022
VRF interest 4,300
VRF expense (410,322)
Ending VRF balance June 30, 2016 ‐$
CITY OF PALO ALTO Notes to the Basic Financial Statements
For the Year Ended June 30, 2016
75
NOTE 7 – GENERAL LONG‐TERM OBLIGATIONS
Long‐Term Obligations Bond premiums and discounts of long‐term debt issues are amortized over the life of the related debt.
The City’s long‐term debt issues and transactions, other than special assessment debt discussed in Note 8, are as follows (in thousands):
Original Balance Balance CurrentIssue Amount July 1, 2015 Additions Retirements June 30, 2016 Portion
Governmental Activities Debt:General Long‐Term Obligations:
2002B Downtown Parking Improvements,
Certificates of Participation,
6.50%, due 03/01/2022
3,555$ 1,285$ ‐$ 150$ 1,135$ 160$
2010 General Obligation Bonds,
3.25% ‐ 5%, due 08/01/204055,305 51,470 ‐ 3,380 48,090 1,110
2011 Lease‐Purchase Agreement 3,222 1,643 ‐ 395 1,248 406 2013A General Obligation Bonds,
2 ‐ 5%, due 08/01/204120,695 20,325 ‐ 3,205 17,120 390
Add: Unamortized Premium ‐ 4,084 ‐ 158 3,926 158 Total Governmental Activities Debt 82,777$ 78,807$ ‐$ 7,288$ 71,519$ 2,224$
Original Issue
Amount
Balance
July 1, 2015 Additions Retirements
Balance
June 30, 2016
Current
Portion
Business‐type Activities Debt:
Enterprise Long‐Term Obligations:
Utility Revenue Bonds
1995 Series A,
5.00‐6.25%, due 06/01/2020
8,640$ 2,860$ ‐$ 505$ 2,355$ 535$
1999 Refunding,
3.25‐5.25%, due 06/01/2024
17,735 10,345 ‐ 665 9,680 700
2009 Series A,
1.80‐5.95%, due 06/01/2035
35,015 30,700 ‐ 955 29,745 990
2011 Refunding,
3‐4%, due 06/01/2035
17,225 13,320 ‐ 1,005 12,315 1,045
Add: Unamortized Premium ‐ 840 ‐ 70 770 ‐
Energy Tax Credit Bonds
2007 Series A, 0%, Due 12/15/2021 1,500 700 ‐ 100 600 100
Less: Unamortized Discount ‐ (38) ‐ (5) (33) ‐
State Water Resources Loans
2007, 1.02%, due 06/30/2029 9,000 6,300 ‐ 450 5,850 450
2009, 2.6%, due 11/30/2030 8,500 7,200 ‐ 369 6,831 378
Total Business‐type Activities Debt 97,615$ 72,227$ ‐$ 4,114$ 68,113$ 4,198$

CITY OF PALO ALTO Notes to the Basic Financial Statements
For the Year Ended June 30, 2016
76
NOTE 7 – GENERAL LONG‐TERM OBLIGATIONS (Continued) Description of Long‐Term Debt Issues 2002B Downtown Parking Improvements Project Certificates of Participation (COPs) – On January 16, 2002, the City issued $3.6 million of COPs to finance the construction of certain improvements to the non‐parking area contained in the City’s Bryant/Florence Garage complex. Principal payments are due annually on March 1 and interest payments semi‐annually at 6.5 percent on March 1 and September 1, and are payable from lease revenues received by the Corporation from the City’s available funds. 2010 General Obligation Bonds (GO bonds) – On June 30, 2010, the City issued $55.3 million of GO bonds to finance costs for constructing a new Mitchell Park Library and Community Center, as well as making substantial improvements to the Rinconada Library and the Downtown Library. Principal payments are due annually on August 1 and interest payments semi‐annually on February 1 and August 1 from 3.25 percent to 5 percent, and are payable from property tax revenues. On June 28, 2016, the City defeased $2.3 million of 2010 GO bonds using funds from bond premiums received at time of issue by depositing the amount in an irrevocable trust account. The trust account assets and the liability for the defeased bonds are not included in the City’s financial statements. The economic gain associated with interest savings is estimated at $0.9 million. The City legally remains the primary obligor on the $2.3 million of defeased bonds until they are paid on August 1, 2020. 2013A General Obligation Bonds (GO bonds) – On June 30, 2013, the City issued $20.7 million of GO bonds to finance costs for constructing a new Mitchell Park Library and Community Center, as well as making substantial improvements to the Rinconada Library and the Downtown Library. Principal payments are due annually on August 1 and interest payments semi‐annually on February 1 and August 1 from 2 percent to 5 percent, and are payable from property tax revenues. On June 28, 2016, the City defeased $2.8 million of 2013A GO bonds using funds remaining at completion of the project by depositing the amount in an irrevocable trust account The trust account assets and the liability for the defeased bonds are not included in the City’s financial statements. The economic gain associated with interest savings is estimated at $0.7 million. The City legally remains the primary obligor on the $2.8 million of defeased bonds until they are paid on August 1, 2023. The City’s 2010 and 2013A GO bonds are payable from pledged ad valorem property taxes until the final maturity dates of the bonds on August 1, 2040 and August 1, 2041 respectively. For the fiscal year ended June 30, 2016, the City received $4.6 million in ad valorem property taxes for principal of $1.4 million and interest of $3.2 million for both 2010 and 2013A GO bonds. 2011 Lease‐Purchase Agreement – On August 2, 2011, the City entered into a master lease‐purchase agreement with JP Morgan Chase Bank, N.A. to finance redemption of the 1998 Golf Course COPs. The lease is secured by a first priority security interest in twenty‐one Fire Department emergency vehicles. Lease proceeds were $3.2 million. Principal payments are due annually on September 1 and interest payments are due semi‐annually on September 1 and March 1 at a rate of 2.49 percent, payable from General Fund revenues.

CITY OF PALO ALTO Notes to the Basic Financial Statements
For the Year Ended June 30, 2016
77
NOTE 7 – GENERAL LONG‐TERM OBLIGATIONS (Continued) 1995 Utility Revenue Bonds, Series A – The City issued $8.6 million of Utility Revenue Bonds on February 1, 1995 to finance certain extensions and improvements to the City’s Storm Drainage and Surface Water System. The Bonds are special obligations of the City payable solely from and secured by a pledge of and lien upon the revenues derived by the City from the funds, services and facilities of all Enterprise Funds except the Refuse Services Fund, Fiber Optics Fund and Airport Fund. Principal payments are payable annually on June 1 and interest payments semi‐annually on June 1 and December 1. A $2.9 million 6.3 percent term bond is due June 1, 2020.
As required by the Indenture, the City established a debt service reserve fund for the Bonds (the “Reserve Account”), with a minimum funding level requirement in the Reserve Account (the “Reserve Requirement”). At the time it issued the Bonds, the City satisfied the Reserve Requirement with a deposit into the Reserve Account of a surety bond (the “Surety Bond”) in the amount of $685,340 issued by Ambac Indemnity Corporation (renamed to Ambac Assurance Corporation in 1997).
The pledge of future Net Revenues for the above bonds ends upon repayment of the $2.4 million principal and $0.4 million interest as the remaining debt service on the bonds, which is scheduled to occur in FY 2020. For FY 2016, Net Revenues, including operating revenues and non‐operating interest earnings, amounted to $241.5 million; operating costs, including operating expenses but not interest, depreciation or amortization, amounted to $186.8 million. Net Revenues available for debt service amounted to $54.7 million, which represented coverage of 80 times over the $0.7 million in debt service. 1999 Utility Revenue and Refunding Bonds – The City issued $17.7 million of Utility Revenue Bonds on June 1, 1999, to refund the 1990 Utility Revenue Refunding Bonds, Series A and the 1992 Utility Revenue Bonds, Series A, and to finance rehabilitation of two Wastewater Treatment sludge incinerators. The 1990 Utility Revenue Refunding Bonds, Series A and the 1992 Utility Revenue Bonds, Series A, were subsequently retired. The 1999 Bonds are special obligations of the City payable solely from and secured by a pledge of and lien upon certain net revenues derived by the City’s sewer system and its storm and surface water system (the “Storm Drain System”). As of June 30, 2001, the 1999 Bonds had been allocated to and were repayable from net revenues of the following enterprise funds: Wastewater Collection (10.2 percent), Wastewater Treatment (64.6 percent) and Storm Drainage (25.2 percent). Principal payments are payable annually on June 1 and interest payments semi‐annually on June 1 and December 1. A $3.1 million 5.3 percent term bond and a $5.1 million 5.3 percent term bond are due June 1, 2021 and 2024, respectively. As required by the Indenture, the City established a debt service reserve fund for the Bonds (the “Reserve Account”), with a minimum funding level requirement in the Reserve Account (the “Reserve Requirement”). At the time it issued the Bonds, the City satisfied the Reserve Requirement with a deposit into the Reserve Account of a surety bond (the “Surety Bond”) in the amount of $1,647,300 issued by Ambac Indemnity Corporation (renamed to Ambac Assurance Corporation in 1997).

CITY OF PALO ALTO Notes to the Basic Financial Statements
For the Year Ended June 30, 2016
78
NOTE 7 – GENERAL LONG‐TERM OBLIGATIONS (Continued) The pledge of future Net Revenues for the above bonds ends upon repayment of the $9.7 million principal and $2.7 million interest as the remaining debt service on the bonds, which is scheduled to occur in FY 2024. For FY 2016, Net Revenues, including operating revenues and non‐operating interest earnings, amounted to $48.0 million; operating costs, including operating expenses but not interest, depreciation or amortization, amounted to $34.9 million. Net Revenues available for debt service amounted to $13.1 million, which represents coverage of 10.8 times over the $1.2 million in debt service. 2007 Electric System Clean Renewable Energy Tax Credit Bonds, Series A – In October 2007, the City issued $1.5 million of Electric Utility Clean Renewable Energy Tax Credit Bonds (CREBs), 2007 Series A, to finance the City’s photovoltaic solar panel project. The CREBs do not bear interest. In lieu of receiving periodic interest payments, bondholders are allowed annual federal income tax credits in an amount equal to a credit rate for such CREBs multiplied by the outstanding principal amount of the CREBs owned by the bondholders. The CREBs are payable solely from and secured solely by a pledge of the Net Revenues of the Electric system and the other funds pledged under the Indenture. The pledge of future Electric Fund Net Revenues ends upon repayment of the $0.6 million remaining debt service on the bonds, which is scheduled to occur in FY 2022. For FY 2016, Net Revenues, including operating revenues and non‐operating interest earnings, amounted to $123.9 million; operating costs, including operating expenses but not interest, depreciation or amortization, amounted to $103.7 million. Net Revenues available for debt service amounted to $20.2 million, which represented coverage of 202 times over the $0.1 million in debt service. 2009 Water Revenue Bonds, Series A – On October 6, 2009, the City issued $35.0 million of Water Revenue Bonds to finance certain improvements to the City’s water utility system. Principal payments are due annually on June 1, and interest payments are due semi‐annually on June 1 and December 1 from 1.80 percent to 5.95 percent. The 2009 Revenue Bonds are secured by net revenues generated by the Water Services Fund. The 2009 Bonds were issued as bonds designated as “Direct Payment Build America Bonds” under the provisions of the American Recovery and Reinvestment Act of 2009 (“Build America Bonds”). The City expects to receive a cash subsidy payment from the United States Treasury equal to 35 percent of the interest payable on the 2009 Bonds. The lien of the 1995 Bonds on the Net Revenues is senior to the lien on Net Revenues securing the 2009 Bonds and the 2011 Bonds. The City received subsidy payments amounting to $526 thousand, which represents 32.6 percent of the interest payments due on December 1 and June 1.
The pledge of future Net Revenues for the above bonds ends upon repayment of the $29.7 million principal and $19.0 million interest as the remaining debt service on the bonds, which is scheduled to occur in FY 2035. For FY 2016, Net Revenues, including operating revenues and non‐operating interest earnings, amounted to $38.7 million; operating costs, including operating expenses but not interest, depreciation or amortization, amounted to $30.6 million. Net Revenues available for debt service amounted to $8.1 million, which represented coverage of 3.19 times over the $2.6 million in debt service.

CITY OF PALO ALTO Notes to the Basic Financial Statements
For the Year Ended June 30, 2016
79
NOTE 7 – GENERAL LONG‐TERM OBLIGATIONS (Continued) 2011 Utility Revenue Refunding Bonds – On September 8, 2011, the City issued $17.2 million in Lease Revenue Bonds (2011 Bonds) to refund the outstanding 2002 Series A Utility Revenue Bonds (2002 Bonds) on a current basis. The 2002 Bonds were issued to finance improvement to the City’s municipal water utility system and the natural gas utility system. Principal of the 2011 Bonds is payable annually on June 1, and interest on the 2011 Bonds is payable semi‐annually on June 1 and December 1. The 2011 Bonds are secured by net revenues generated by the Water Services and Gas Services Funds.
The pledge of future Net Revenues of the above bonds ends upon repayment of the $12.3 million principal and $2.3 million interest as remaining debt service on the bonds, which is scheduled to occur in FY 2035. For FY 2016, Net Revenues, including operating revenues and non‐operating interest earnings, amounted to $69.7 million; operating costs, including operating expenses but not interest, depreciation or amortization, amounted to $48.2 million. Net Revenues available for debt service amounted to $21.5 million, which represented coverage of 14.7 times over the $1.5 million in debt service. 2007 State Water Resources Loan – In October 2007, the City approved a $9 million loan agreement with State Water Resources Control Board (SWRCB) to finance the City’s Mountain View/Moffett Area reclaimed water pipeline project. Under the terms of the contract, the City has agreed to repay $9 million to the State in exchange for receiving $7.5 million in proceeds to be used to fund the Project. The difference of $1.5 million between the repayment obligation and proceeds represents in‐substance interest on the outstanding balance. Principal payments are payable annually on June 30. Concurrently with the loan, the City entered into various other agreements including a cost sharing arrangement with the City of Mountain View. Pursuant to that agreement, City of Mountain View agreed to finance a portion of the project with a $6 million loan repayable to the City. This loan has been recorded as “Due from other government agencies” in the accompanying financial statements.
2009 State Water Resources Loan – In October 2009, the City approved an $8.5 million loan agreement with SWRCB to finance the City’s Ultraviolet Disinfection project. Principal and interest payments are payable annually on November 30. Debt Service Requirements (in thousands): Debt service requirements are shown below for all long‐term debt.
For the Year Ending
June 30 Principal Interest Total Principal Interest Total
2017 2,066$ 3,032$ 5,098$ 4,198$ 2,818$ 7,016$
2018 2,156 2,942 5,098 4,363 2,656 7,019
2019 2,251 2,844 5,095 4,533 2,484 7,017
2020 1,920 2,758 4,678 4,713 2,300 7,013
2021 1,985 2,674 4,659 4,899 2,118 7,017
2022‐2026 10,355 12,045 22,400 23,204 7,704 30,908
2027‐2031 12,775 9,296 22,071 12,569 4,382 16,951
2032‐2036 15,920 6,108 22,028 8,895 1,361 10,256
2037‐2041 17,615 2,050 19,665 ‐ ‐ ‐
2042‐2046 550 11 561 ‐ ‐ ‐
Total 67,593$ 43,760$ 111,353$ 67,374$ 25,823$ 93,197$
Governmental Activities Business‐Type Activities

CITY OF PALO ALTO Notes to the Basic Financial Statements
For the Year Ended June 30, 2016
80
NOTE 7 – GENERAL LONG‐TERM OBLIGATIONS (Continued) Debt Call Provisions Long‐term debt as of June 30, 2016 is callable on the following terms and conditions:
Initial Call Date
Governmental Activities Long‐Term Debt2002B Certificates of Participation 03/01/11 (2)
2010 General Obligation Bonds$6.595 million due 08/01/2032 08/01/31 (3)
$4.890 million due 08/01/2034 08/01/33 (3)
$17.725 million due 08/01/2040 08/01/35 (3)
Business‐Type Activities Long‐Term DebtUtility Revenue Bonds
1999 Refunding 06/01/09 (1)
2011 Refunding 06/01/21 (1)
(1) Callable in inverse numerical order of maturity at par plus a premium of 2 percent beginning on the initial call date. The call price declines subsequent to the initial date.
(2) Callable in any order specified by the City at par plus a premium of 1 percent beginning on the initial
call date. The call price declines subsequent to the initial date. (3) Callable in any order specified by the City at par value plus any accrued interest beginning on the
initial call date. Leasing Arrangements COPs and Capital Leases are issued for the purpose of financing the construction or acquisition of projects defined in each leasing arrangement. Projects are leased to the City for lease payments which, together with unspent proceeds of the leasing arrangement, will be sufficient to meet the debt service obligations of the leasing arrangement. At the termination of the leasing arrangement, title to the project will pass to the City. Leasing arrangements are similar to debt in that they allow investors to participate in a share of guaranteed payments made by the City. Because they are similar to debt, the present value of the total payments to be made by the City is recorded as long‐term debt. The City’s leasing arrangements are included in long‐term obligations discussed above. Conduit Financing On December 15, 1996, the City acted as a financial intermediary in order to assist Lytton Gardens Health Care Center in issuing Insured Revenue Refunding Bonds. The Bonds are payable solely from revenues collected by Lytton Gardens Health Care Center. The City has not included these bonds in its basic financial statements since it is not legally or morally obligated for the repayment of the bonds. At June 30, 2016, the amount of bonds outstanding was $1.2 million.

CITY OF PALO ALTO Notes to the Basic Financial Statements
For the Year Ended June 30, 2016
81
NOTE 8 – SPECIAL ASSESSMENT DEBT
Special Assessment Debt with no City Commitment The California Avenue Parking Assessment District No. 92‐13 issued Assessment Bonds of 1993, but the City has no legal or moral liability with respect to the payment of this debt, which is secured only by assessments on the properties in this District. Therefore, this debt is not included in Governmental Activities long‐term debt of the City. At June 30, 2016, the debt has been fully paid off.
On February 29, 2012, the University Avenue Area Off‐Street Parking Assessment District issued Limited Obligation Refunding Improvement Bonds (2012 Bonds), but the City has no legal or moral liability with respect to the payment of this debt, which is secured only by assessments on properties in this District. Therefore, this debt is not included in Governmental Activities long‐term debt of the City. At June 30, 2016, the District’s outstanding debt amounted to $25.1 million. The proceeds from the 2012 Bonds, combined with available Assessment Funds, were used to redeem the outstanding University Avenue Area Off‐Street Parking Assessment District Series 2001‐A and Series 2002‐A Bonds. On June 28, 2016, the District defeased $1.6 million of the 2012 Bonds using funds remaining from completion of the project. The defeased debt will be paid on September 2, 2022.
NOTE 9 – LANDFILL POST‐CLOSURE MAINTENANCE
The 126 acre Palo Alto Refuse Disposal Site (Palo Alto Landfill) was filled to capacity and stopped accepting waste in July 2011. State and federal laws and regulations require the City to construct a final cover to cap the waste, and to perform certain post‐closure maintenance and monitoring activities at the site for a minimum of thirty years after closure. As of November 2015, the Palo Alto Landfill has been fully capped and subsequently converted to a pastoral park (Byxbee Park) that is open to the public. A final post‐closure maintenance plan and cost estimate for the thirty year post‐closure related activities was approved by state and local regulatory agencies in 2014. This cost estimate is adjusted annually for inflation at a percentage provided by the State. Landfill post‐closure liabilities as of June 30, 2016 are $6.6 million. The City is required by state and federal laws and regulations to fund post‐closure maintenance activities by pledging future revenue received from Refuse customers through rate fees.

CITY OF PALO ALTO Notes to the Basic Financial Statements
For the Year Ended June 30, 2016
82
NOTE 10 – NET POSITION AND FUND BALANCES Net Position Net Position is the excess of the City’s assets and deferred outflows of resources over its liabilities and deferred inflows of resources. Net position is divided into three categories that are described below: Net Investment in Capital Assets describes the portion of net position, which is represented by current net book value of the City’s capital assets, less the outstanding balance of any debt issued to finance these assets. Restricted describes the portion of net position that is reduced by liabilities related to restricted assets. Generally a liability relates to restricted assets if the asset results from a resource flow that also results in the recognition of a liability or if the liability will be liquidated with the restricted assets reported. Unrestricted describes the portion of net position which is not restricted as to use. Fund Balances As prescribed by GASB Statement No. 54, governmental funds report fund balances in classifications based primarily on the extent to which the City is bound to honor constraints on the specific purposes for which amounts in the funds can be spent. Fund balances for governmental funds are made up of the following:
Nonspendable – This category is comprised of amounts that are: (a) not in spendable form, or (b) legally or contractually required to be maintained intact. The “not in spendable form” criterion includes items that are not expected to be converted to cash, for example: prepaid items. The corpus of the permanent fund is contractually required to be maintained intact.
Restricted – This category is comprised of amounts that can be spent only for the specific purposes stipulated by external resource providers, constitutionally or through enabling legislation. Restrictions may effectively be changed or lifted only with the consent of resource providers.
Committed – This category is comprised of amounts that can only be used for the specific purposes determined by the action that constitutes the most binding constraint (i.e. ordinance) of the City’s highest level of decision‐making authority, the City Council. Commitments may be changed or lifted only by the City taking the same formal action that imposed the constraint originally.
Assigned – This category is comprised of amounts intended to be used by the City for specific purposes that are neither restricted nor committed. Intent is expressed by the City Council or the City Manager, to whom the City Council has delegated the authority to assign amounts to be used for specific purposes.
Unassigned –This category is the residual classification for the General Fund and includes all amounts not contained in the other classifications. Unassigned amounts are technically available for any purpose. Other governmental funds may report negative unassigned fund balance, which occurs when a fund has a residual deficit after allocation of fund balance to the nonspendable, restricted or committed categories.
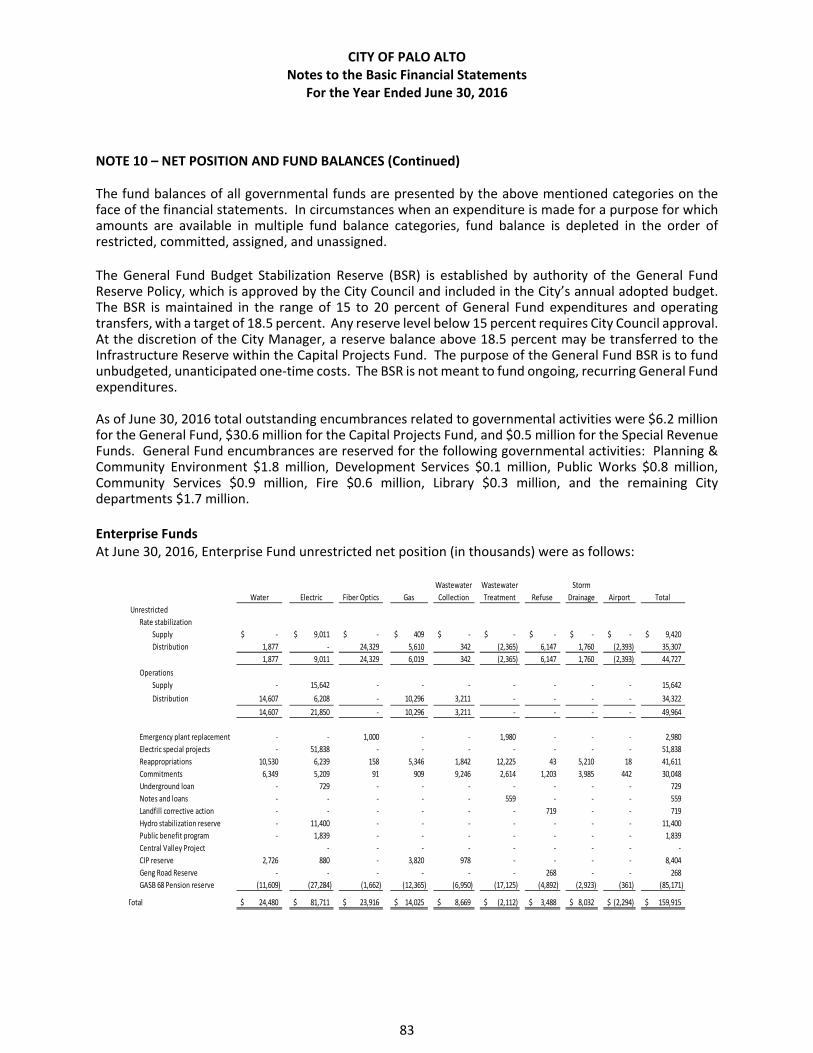
CITY OF PALO ALTO Notes to the Basic Financial Statements
For the Year Ended June 30, 2016
83
NOTE 10 – NET POSITION AND FUND BALANCES (Continued) The fund balances of all governmental funds are presented by the above mentioned categories on the face of the financial statements. In circumstances when an expenditure is made for a purpose for which amounts are available in multiple fund balance categories, fund balance is depleted in the order of restricted, committed, assigned, and unassigned. The General Fund Budget Stabilization Reserve (BSR) is established by authority of the General Fund Reserve Policy, which is approved by the City Council and included in the City’s annual adopted budget. The BSR is maintained in the range of 15 to 20 percent of General Fund expenditures and operating transfers, with a target of 18.5 percent. Any reserve level below 15 percent requires City Council approval. At the discretion of the City Manager, a reserve balance above 18.5 percent may be transferred to the Infrastructure Reserve within the Capital Projects Fund. The purpose of the General Fund BSR is to fund unbudgeted, unanticipated one‐time costs. The BSR is not meant to fund ongoing, recurring General Fund expenditures. As of June 30, 2016 total outstanding encumbrances related to governmental activities were $6.2 million for the General Fund, $30.6 million for the Capital Projects Fund, and $0.5 million for the Special Revenue Funds. General Fund encumbrances are reserved for the following governmental activities: Planning & Community Environment $1.8 million, Development Services $0.1 million, Public Works $0.8 million, Community Services $0.9 million, Fire $0.6 million, Library $0.3 million, and the remaining City departments $1.7 million. Enterprise Funds At June 30, 2016, Enterprise Fund unrestricted net position (in thousands) were as follows:
Water Electric Fiber Optics Gas
Wastewater
Collection
Wastewater
Treatment Refuse
Storm
Drainage Airport Total
Unrestricted
Rate stabilization
Supply ‐$ 9,011$ ‐$ 409$ ‐$ ‐$ ‐$ ‐$ ‐$ 9,420$
Distribution 1,877 ‐ 24,329 5,610 342 (2,365) 6,147 1,760 (2,393) 35,307
1,877 9,011 24,329 6,019 342 (2,365) 6,147 1,760 (2,393) 44,727
Operations
Supply ‐ 15,642 ‐ ‐ ‐ ‐ ‐ ‐ ‐ 15,642
Distribution 14,607 6,208 ‐ 10,296 3,211 ‐ ‐ ‐ ‐ 34,322
14,607 21,850 ‐ 10,296 3,211 ‐ ‐ ‐ ‐ 49,964
Emergency plant replacement ‐ ‐ 1,000 ‐ ‐ 1,980 ‐ ‐ ‐ 2,980
Electric special projects ‐ 51,838 ‐ ‐ ‐ ‐ ‐ ‐ ‐ 51,838
Reappropriations 10,530 6,239 158 5,346 1,842 12,225 43 5,210 18 41,611
Commitments 6,349 5,209 91 909 9,246 2,614 1,203 3,985 442 30,048
Underground loan ‐ 729 ‐ ‐ ‐ ‐ ‐ ‐ ‐ 729
Notes and loans ‐ ‐ ‐ ‐ ‐ 559 ‐ ‐ ‐ 559
Landfill corrective action ‐ ‐ ‐ ‐ ‐ ‐ 719 ‐ ‐ 719
Hydro stabilization reserve ‐ 11,400 ‐ ‐ ‐ ‐ ‐ ‐ ‐ 11,400
Public benefit program ‐ 1,839 ‐ ‐ ‐ ‐ ‐ ‐ ‐ 1,839
Central Valley Project ‐ ‐ ‐ ‐ ‐ ‐ ‐ ‐ ‐
CIP reserve 2,726 880 ‐ 3,820 978 ‐ ‐ ‐ ‐ 8,404
Geng Road Reserve ‐ ‐ ‐ ‐ ‐ ‐ 268 ‐ ‐ 268
GASB 68 Pension reserve (11,609) (27,284) (1,662) (12,365) (6,950) (17,125) (4,892) (2,923) (361) (85,171)
Total 24,480$ 81,711$ 23,916$ 14,025$ 8,669$ (2,112)$ 3,488$ 8,032$ (2,294)$ 159,915$

CITY OF PALO ALTO Notes to the Basic Financial Statements
For the Year Ended June 30, 2016
84
NOTE 10 – NET POSITION AND FUND BALANCES (Continued)
The City Council has set aside unrestricted net position for general contingencies, and future capital and debt service expenditures including operating and capital contingencies for unusual or emergency expenditures.
Internal Service Funds At June 30, 2016, Internal Service Funds unrestricted net position (in thousands) were as follows:
Vehicle
Replacement
and
Maintenance Technology
Printing and
Mailing
Services
General
Benefits
Workers'
Compensation
Insurance
Program
General
Liabilities
Insurance
Program
Retiree Health
Benefits Total
Unrestricted net position:
Commitments 3,088$ 2,317$ 13$ 239$ 7$ 37$ ‐$ 5,701$
Future catastrophic losses ‐ ‐ ‐ ‐ 2,913 3,263 ‐ 6,176
Retiree health care ‐ ‐ ‐ ‐ ‐ ‐ 25,750 25,750
Capital projects 4,849 3,774 ‐ ‐ ‐ ‐ ‐ 8,623
GASB68 pension reserve (2,589) (9,080) (292) ‐ ‐ ‐ ‐ (11,961)
Available 3,573 15,537 9 2,289 ‐ ‐ ‐ 21,408
Total 8,921$ 12,548$ (270)$ 2,528$ 2,920$ 3,300$ 25,750$ 55,697$
Commitments represent the portion of net position set aside for open purchase orders. Future catastrophic losses represent the portion of net position to be used for unforeseen future losses. Retiree health care represents the portion of net position set aside to defer future costs of retiree health care coverage. Capital projects represent the portion of net position set aside for adopted capital projects. GASB68 pension reserve is the portion of net position required to be set aside to meet defined benefit pension obligations.

CITY OF PALO ALTO Notes to the Basic Financial Statements
For the Year Ended June 30, 2016
85
NOTE 11 – PENSION PLANS (a) General Information about the Pension Plans
Plan Descriptions ‐ Substantially all permanent City employees are eligible to participate in the City’s separate Safety (police and fire) and Miscellaneous (all other) Plans, agent multiple‐employer defined benefit pension plans administered by California Public Employees’ Retirement System (CalPERS), which acts as a common investment and administrative agent for its participating member employers. Benefits provisions under the Plans are established by State statute and City resolution. CalPERS issues publicly available reports that include a full description of the pension plans including benefits provisions, assumptions and membership information. The reports can be found on the CalPERS website at: <http://www.calpers.ca.gov/index.jsp?bc=/about/forms‐pubs/calpers‐reports/actuarial‐reports/home.xml> Benefits Provided ‐ CalPERS provides retirement and disability benefits, annual cost of living adjustments and death benefits to Plan members, who must be public employees and beneficiaries. Benefits are based on years of credited service (equal to one year of full‐time employment), age at retirement and final compensation. The death benefit is one of the following: the 1959 Survivor Benefit, or the pre‐retirement option 2W Death Benefit for local fire members only.
The Plans’ provisions and benefits in effect at June 30, 2016, are summarized in the following table. Contribution rates are based on the Actuarial Valuation Report as of June 30, 2013.
Safety Plan
Fire Fighters,
Fire Chief
Association,
Police Officers,
Fire Fighters,
Fire Chief Association
Police Officers,
Police Management
Fire Fighters,
Fire Chief
Association,
Police Officers,
Hire Date Prior to June 8, 2012
On or after June 8,
2012
On or after Dec. 8,
2012
On or after Jan 1,
2013
Benefit formula1
3% at 55 3% at 55 3% at 50 2.7% at 57
Benefit vesting schedule 5 years service 5 years service 5 years service 5 years service
Benefit payment monthly for life monthly for life monthly for life monthly for life
Retirement age 50 551
551
571
Monthly benefit as % of eligible compensatio 3% 3% 3% 2.7%
Actuarially determined contribution rate ‐ EE 9% 9% 9% 11.25%
Actuarially determined contribution rate ‐ ER 41.932% 41.932% 41.932% 41.932%
Hire Date Prior to July 17, 2010
On or after July 17,
2010
On or after Jan 1,
2013
Benefit formula 2.7% at 552
2% at 602
2% at 623
Benefit vesting schedule 5 years service 5 years service 5 years service
Benefit payments monthly for life monthly for life monthly for life
Retirement age 552
602
623
Monthly benefit as % of eligible compensatio 2.70% 2.0% ‐ 2.418% 2%
Actuarially determined contribution rate ‐ EE 8% 7% 6.25%
Actuarially determined contribution rate ‐ ER 27.694% 27.694% 27.694%
1 Employees can retire at age 50 with reduced benefits of 2.4% ‐ 2.88% if hired before Jan 1, 2013, or 2.0% ‐ 2.6% if hired on or
after Jan 1, 2013.2 Employees can retire at age 50 with reduced benefits of 2.0% ‐ 2.56% if hired before July 17, 2010, or 1.092% ‐ 1.874% if hired on or
after July 17, 2010.3 Employees can retire at age 52 with reduced benefits of 1.0% ‐ 1.9%
Miscellaneous Plan

CITY OF PALO ALTO Notes to the Basic Financial Statements
For the Year Ended June 30, 2016
86
NOTE 11 – PENSION PLANS (Continued) Employees Covered – Based on the Actuarial Valuation Report as of June 30, 2015, the following employees were covered by the benefits terms for each Plan:
Miscellaneous Plan Safety Plan
Inactive employees or beneficiaries currently receiving benefits 1,027 414
Inactive employees entitled to but not yet receiving benefits 714 98
Active employees 796 179
Total 2,537 691
Contributions –Section 20814(c) of the California Public Employees’ Retirement Law requires that the employer contribution rates for all public employers be determined on an annual basis by the actuary and shall be effective on the July 1 following notice of a change in the rate. Funding contributions for the Plans are determined annually on an actuarial basis as of June 30 by CalPERS. The actuarially determined rate is the estimated amount necessary to finance the costs of benefits earned by employees during the year, with an additional amount to finance any unfunded accrued liability. The City is required to contribute the difference between the actuarially determined rate and the contribution rate of employees. Further detail can be found in the Required Supplemental Information Schedule of Contributions. (b) Net Pension Liability
The City’s net pension liability for both Plans is measured as the total pension liability, less the plan’s fiduciary net position. Net pension liability is measured as of June 30, 2015 (measurement date), using the Actuarial Valuation Report as of June 30, 2014 rolled forward to June 30, 2015 using standard update procedures. At June 30, 2016, the City reported a net pension liability of $319.6 million for both plans. A summary of principal assumptions and methods used to determine the net pension liability is as follows:

CITY OF PALO ALTO Notes to the Basic Financial Statements
For the Year Ended June 30, 2016
87
NOTE 11 – PENSION PLANS (Continued) Actuarial Assumptions ‐ The total pension liabilities were determined using the following actuarial assumptions in the Accounting Valuation Report:
Miscellaneous Plan Safety Plan
Valuation Date June 30, 2014 June 30, 2014
Measurement Date June 30, 2015 June 30, 2015
Actuarial Cost Method Entry Age Normal Entry Age Normal
Actuarial Assumptions:
Discount Rate 7.65% 7.65%
Inflation 2.75% 2.75%
Payroll Growth 3.00% 3.00%
Investment Rate of Return1 7.50% 7.50%
Retirement Age
Mortality2
1 Net of pension plan investment and administrative expenses, including inflation.
2 Mortality table used was developed based on CalPERS Experience Study for period
1997 to 2007. Pre‐ and post‐retirement mortality rates include 5 years of projected
mortality improvement using Scale AA published by the Society of Actuaries.
Further details of the Experience Study can be found on the CalPERS website.
Derived using CalPERS membership data
for all funds.
Probabilities of retirement are based on
the 2010 CalPERS Experience Study for
the period 1997 to 2007.
Change in Assumptions ‐ GASB 68, paragraph 68 states that the long‐term expected rate of return should be determined net of pension plan investment expense but without reduction for pension plan administrative expense. The discount rate of 7.50 percent used for the June 30, 2014 measurement date was net of administrative expenses. The discount rate of 7.65 percent used for the June 30, 2015
measurement date is without reduction of pension plan administrative expense. Discount Rate – The discount rate used to measure the total pension liability was 7.65 percent for each Plan. To determine whether the municipal bond rate should be used in the calculation of a discount rate for each Plan, CalPERS stress tested plans that would most likely result in a discount rate that would be different from the actuarially assumed discount rate. Based on the testing, none of the tested plans ran out of assets. Therefore, the current 7.65 percent discount rate is appropriate and the use of the municipal bond rate calculation is not deemed necessary. The long term expected discount rate of 7.65 percent is applied to all plans in the Public Employees Retirement Fund for the June 30, 2015 measurement date. The stress test results are presented in a detailed report that can be obtained from the CalPERS website under GASB Statement No. 68 section.

CITY OF PALO ALTO Notes to the Basic Financial Statements
For the Year Ended June 30, 2016
88
NOTE 11 – PENSION PLANS (Continued) The long‐term expected rate of return on pension plan investments was determined using a building‐block method in which best estimate ranges of expected future real rates of return (expected returns, net of pension plan investment expense and inflation) are developed for each major asset class. In determining the long‐term expected rate of return, CalPERS took into account both short‐term and long‐term market return expectations as well as the expected pension fund cash flows. Such cash flows were developed assuming that both members and employers will make their required contributions on time and as scheduled in all future years. Using historical returns of all the funds’ asset classes, expected compound geometric returns were calculated over the short‐term (first ten years) and the long‐term (11‐60 years) using a building‐block approach. Using the expected nominal returns for both short‐term and long‐term, the present value of benefits was calculated for each fund. The expected rate of return was set by calculating the single equivalent expected return that arrived at the same present value of benefits for cash flows as the one calculated using both short‐term and long‐term returns. The expected rate of return was then set equivalent to the single equivalent rate calculated above and rounded down to the nearest one quarter of one percent. The table below reflects the long‐term expected real rate of return by asset class for both Miscellaneous and Safety Plans. The rate of return was calculated using the capital market assumptions applied to determine the discount rate and asset allocation. These rates of return are net of administrative expenses.
Asset Class
New Strategic Allocation
Real Return
Years 1 - 101
Real Return
Years 11+2
Global Equity 51.0% 5.25% 5.71%
Global Fixed Income 19.0 0.99 2.43
Inflation Sensitive 6.0 0.45 3.36
Private Equity 10.0 6.83 6.95
Real Estate 10.0 4.50 5.13
Infrastructure and Forestland 2.0 4.50 5.09
Liquidity 2.0 (0.55) (1.05)
1 An expected inflation of 2.5% used for this period.2 An expected inflation of 3.0% used for this period.

CITY OF PALO ALTO Notes to the Basic Financial Statements
For the Year Ended June 30, 2016
89
NOTE 11 – PENSION PLANS (Continued)
(c) Changes in the Net Pension Liability
The following table is based on the GASB 68 Accounting Valuation Report and shows the changes in the net pension liability for the Miscellaneous Plan (in thousands):
Total Pension
Liability
Plan Net
Position
Net Pension
Liability
Balances calculated at July 1, 2015 663,471$ 476,363$ 187,108$
Changes for the year:
Service cost 12,183 ‐ 12,183
Interest on total pension liability 49,345 ‐ 49,345
Differences between expected and actual
experiences 3,507 ‐ 3,507
Changes in assumptions (11,552) ‐ (11,552)
Contributions from employer ‐ 18,610 (18,610)
Contributions from employees ‐ 5,730 (5,730)
Net investment income ‐ 10,597 (10,597)
Benefit payments, including refunds of
employee contributions (32,980) (32,980) ‐
Administrative expense ‐ (538) 538
Net changes 20,503 1,419 19,084
Balances reported at June 30, 2016 $ 683,974 $ 477,782 $ 206,192
The following table is based on the GASB 68 Accounting Valuation Report and shows the changes in the net pension liability for the Safety Plan (in thousands):
Total Pension
Liability
Plan Net
Position
Net Pension
Liability
Balances calculated at July 1, 2015 367,403$ 264,579$ 102,824$
Changes for the year:
Service cost 5,959 ‐ 5,959
Interest on total pension liability 27,047 ‐ 27,047
Differences between expected and actual
experiences 75 ‐ 75
Changes in assumptions (6,327) ‐ (6,327)
Contributions from employer ‐ 8,617 (8,617)
Contributions from employees ‐ 2,047 (2,047)
Net investment income ‐ 5,774 (5,774)
Benefit payments, including refunds of
employee contributions (21,148) (21,148) ‐
Administrative expense ‐ (290) 290
Net changes 5,606 (5,000) 10,606
Balances reported at June 30, 2016 $ 373,009 $ 259,579 $ 113,430

CITY OF PALO ALTO Notes to the Basic Financial Statements
For the Year Ended June 30, 2016
90
NOTE 11 – PENSION PLANS (Continued)
Sensitivity of the Net Pension Liability to Changes in the Discount Rate ‐ The following table presents the net pension liability of the Plans as of the measurement date, calculated using the discount rate of 7.65 percent, compared to a discount rate that is 1 percentage point lower (6.65 percent) or 1 percentage point higher (8.65 percent). Amounts shown below are in thousands:
Discount Rate ‐ 1%
(6.65%)
Current Discount Rate
(7.65%)
Discount Rate + 1%
(8.65%)
Miscellaneous Plan:
Plan's Net Pension Liability/(Asset) 293,361$ 206,192$ 133,730$
Safety Plan:
Plan's Net Pension Liability/(Asset) 160,809$ 113,430$ 74,244$
Plan Fiduciary Net Position – Detailed information about the Plan’s fiduciary net position is available in the separately issued CalPERS financial report: Schedule of Changes in Fiduciary Net Position by Rate Plan.
(d) Pension Expenses and Deferred Outflows/Inflows of Resources Related to Pensions
For the year ended June 30, 2016, the City recognized a pension expense of $14.7 million and $7.9 million for the Miscellaneous and Safety Plan respectively. At June 30, 2016, the City reported pension related deferred outflows of resources and deferred inflows of resources from the following sources (in thousands):
Deferred
Outflows
of Resources
Deferred
Inflows
of Resources
Pension contributions subsequent to
measurement date 28,203$ ‐$
Change of assumptions ‐ 12,168
Difference between expected and actual experience 2,392 ‐
Net difference between projected and actual earnings
on plan investments ‐ 6,653
Total 30,595$ 18,821$
The $28.2 million reported as deferred outflows of resources relates to contributions paid by the City from July 1, 2015 through June 30, 2016 which is subsequent to the City’s measurement date of June 30, 2015 for both the Miscellaneous and Safety Plans. This amount will be recognized as a reduction of the net pension liability in the year ended June 30, 2017.

CITY OF PALO ALTO Notes to the Basic Financial Statements
For the Year Ended June 30, 2016
91
NOTE 11 – PENSION PLANS (Continued)
The net differences reported as deferred outflows of resources and deferred inflows of resources related to pensions will be recognized in future pension expense as follows (in thousands):
Year Ended June 30,
Miscellaneous
Plan
Safety
Plan Total
2017 (5,732)$ (3,623)$ (9,355)$
2018 (5,732) (3,623) (9,355)
2019 (3,050) (2,519) (5,569)
2020 5,053 2,797 7,850
(9,461)$ (6,968)$ (16,429)$

CITY OF PALO ALTO Notes to the Basic Financial Statements
For the Year Ended June 30, 2016
92
NOTE 12 – RETIREE HEALTH BENEFITS In addition to providing pension benefits, the City participates in the California Public Employees’ Medical and Health Care Act program to provide certain health care benefits for retired employees. Employees who retire directly from the City are eligible for retiree health benefits if they retire on or after age 50 with 5 years of service and are receiving a monthly pension from CalPERS. Details of benefits provided to retirees are noted in the following tables:
Unit
Hired
Before
Retiree
Coverage1
Dependent
Coverage
Retired on
or After
Retiree
Contribution
Management & Professional2
1/1/2004 100% 100% 5/1/2011 Flat rate4
Police Management2
1/1/2004 100% 100% 6/1/2012 Flat rate5
Fire Fighters2
1/1/2004 100% 100% 12/1/2011 10%
Fire Chiefs Association2
1/1/2004 100% 100% 1/1/2013 10%
SEIU 1/1/2005 100% 100% 5/1/2011 Flat rate4
Police Officers3
1/1/2006 100% 100% 4/1/2015 10%
Utilities Managers & Professional2
1/1/2004 100% 100% 5/1/2011 10%
2 Effective 1/1/2007 plan capped at the second highest CalPERS Bay Area Bas ic plan premium.3 Effective 7/1/2014 plan capped at the second highest CalPERS Bay Area Bas ic plan premium.4 Effective 4/1/2014 City pays $688 for employee, $1,375 for employee +1, $1,788 for fami ly. Effective 1/1/2015 City pays
$708 for employee, $1,415 for employee +1, $1,840 for fami ly.5 Effective 1/1/2015 City pays $708 for employee, $1,415 for employee +1, $1,840 for fami ly. Effective 1/1/2016 City pays
$743 for employee, $1,485 for employee +1, $1,931 for fami ly.
Unit
Hired on or
After
Retiree
Coverage1
Dependent
Coverage2
Management & Professional 1/1/2004 50%‐100% Max. 90%
Police Management 1/1/2004 50%‐100% Max. 90%
Fire Fighters 1/1/2004 50%‐100% Max. 90%
Fire Chiefs Association 1/1/2004 50%‐100% Max. 90%
Utilities Managers & Professional 1/1/2004 50%‐100% Max. 90%
SEIU 1/1/2005 50%‐100% Max. 90%
Police Officers 1/1/2006 50%‐100% Max. 90%
speci fied employer contribution, with the City portion increas ing by 5% for each additional year of service credi t. 2 Maximum of 90% once employee completes 20 years of service.
1 100% of benefi ts i f the employee has five years CalPERS service credit and the employee reti red from the City.
1 Employees with ten years of CalPERS service, at leas t five of which are at the City of Palo Alto, receive 50% of the
Retiree contributions for units with the following hire dates are determined by Government Code
Section 22893, 20 year graduated schedule:
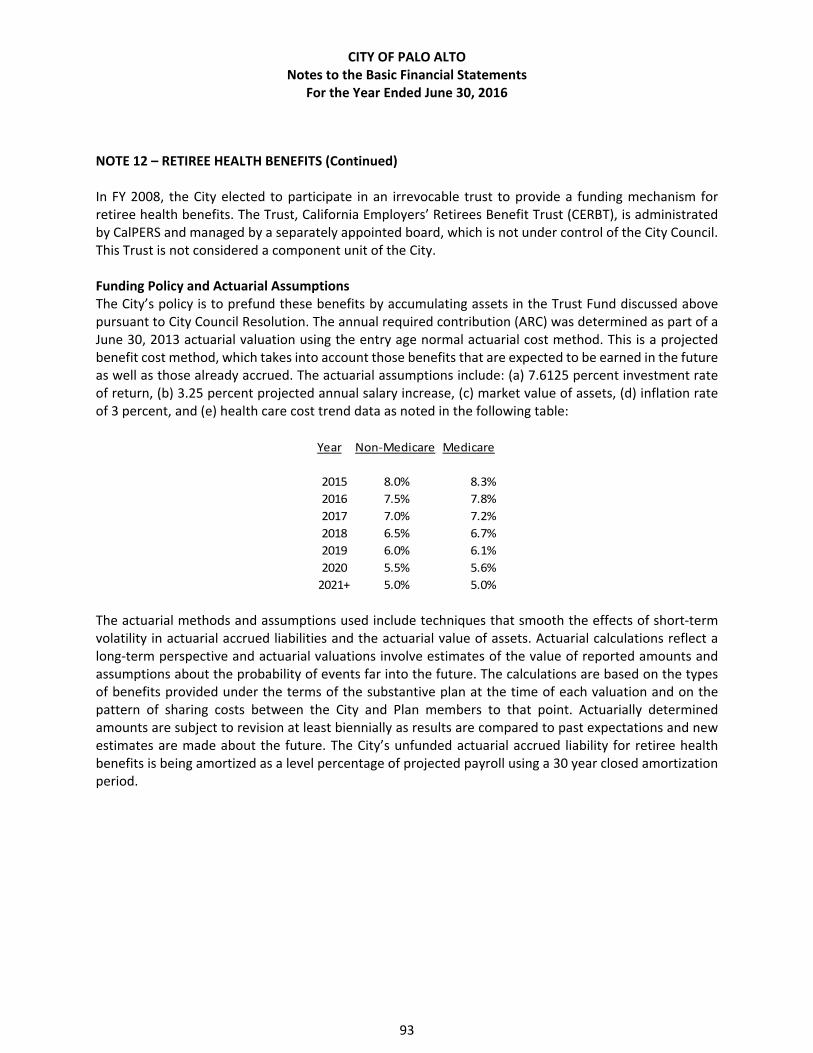
CITY OF PALO ALTO Notes to the Basic Financial Statements
For the Year Ended June 30, 2016
93
NOTE 12 – RETIREE HEALTH BENEFITS (Continued) In FY 2008, the City elected to participate in an irrevocable trust to provide a funding mechanism for retiree health benefits. The Trust, California Employers’ Retirees Benefit Trust (CERBT), is administrated by CalPERS and managed by a separately appointed board, which is not under control of the City Council. This Trust is not considered a component unit of the City. Funding Policy and Actuarial Assumptions The City’s policy is to prefund these benefits by accumulating assets in the Trust Fund discussed above pursuant to City Council Resolution. The annual required contribution (ARC) was determined as part of a June 30, 2013 actuarial valuation using the entry age normal actuarial cost method. This is a projected benefit cost method, which takes into account those benefits that are expected to be earned in the future as well as those already accrued. The actuarial assumptions include: (a) 7.6125 percent investment rate of return, (b) 3.25 percent projected annual salary increase, (c) market value of assets, (d) inflation rate of 3 percent, and (e) health care cost trend data as noted in the following table:
Year Non‐Medicare Medicare
2015 8.0% 8.3%
2016 7.5% 7.8%
2017 7.0% 7.2%
2018 6.5% 6.7%
2019 6.0% 6.1%
2020 5.5% 5.6%
2021+ 5.0% 5.0% The actuarial methods and assumptions used include techniques that smooth the effects of short‐term volatility in actuarial accrued liabilities and the actuarial value of assets. Actuarial calculations reflect a long‐term perspective and actuarial valuations involve estimates of the value of reported amounts and assumptions about the probability of events far into the future. The calculations are based on the types of benefits provided under the terms of the substantive plan at the time of each valuation and on the pattern of sharing costs between the City and Plan members to that point. Actuarially determined amounts are subject to revision at least biennially as results are compared to past expectations and new estimates are made about the future. The City’s unfunded actuarial accrued liability for retiree health benefits is being amortized as a level percentage of projected payroll using a 30 year closed amortization period.

CITY OF PALO ALTO Notes to the Basic Financial Statements
For the Year Ended June 30, 2016
94
NOTE 12 – RETIREE HEALTH BENEFITS (Continued) Generally accepted accounting principles permit assets to be treated as other post employment benefit (OPEB) assets and deducted from the actuarial accrued liability when such assets are placed in an irrevocable trust or equivalent arrangement. During the year ended June 30, 2016, the City made contributions and amortized the Net OPEB asset to fund the current year annual required contribution (ARC). As a result, the City has calculated and recorded the Net OPEB Asset, representing the difference between the ARC, amortization and contributions, as presented below (in thousands):
Annual required contribution 14,767$
Amortization of the Net OPEB Asset 2,183
Interest on the Net OPEB Asset (1,658)
Annual OPEB Cost 15,292
Contributions made:
Contributions to OPEB Trust 2,442
Contributions to Retirees 7,921
Implicit rate subsidy 2,102
City portion of current year premiums paid* 1,618
Total contributions made 14,083
Change in Net OPEB Asset (1,209)
Net OPEB Asset, beginning of year 22,871
Net OPEB Asset, end of year 21,662$
* FY 2016 premiums for 920 retirees.
Shortly after year‐end, the City contributed an additional $2.8 million to the Trust. The Plan’s annual OPEB cost and actual contributions for the past three years ended June 30 are set forth below (in thousands):
Fiscal Year
Annual OPEB
Cost
Actual
Contribution
Percentage
of OPEB Cost
Net OPEB
Obligation
(Asset)
June 30, 2014 13,255$ 14,014$ 106% (22,610)$ June 30, 2015 14,773 15,034 102% (22,871) June 30, 2016 15,292 14,083 92% (21,662)

CITY OF PALO ALTO Notes to the Basic Financial Statements
For the Year Ended June 30, 2016
95
NOTE 12 – RETIREE HEALTH BENEFITS (Continued)
The Schedule of Funding Progress presents multi‐year trend information about whether the actuarial value of plan assets is increasing or decreasing over time relative to the actuarial accrued liability for benefits. Trend data from the actuarial studies is presented below (in thousands):
Valuation Date
Entry Age
Accrued
Liability
Value of
Assets
Unfunded
Liability
Funded
Ratio
Annual
Covered
Payroll
Unfunded
Liability as a
% of Payroll
June 30, 2011 168,053$ 44,774$ 123,279$ 26.6% 80,664$ 152.8%
June 30, 2013 203,642 60,070 143,572 29.5% 81,785 175.5%
June 30, 2015 234,795 78,578 156,217 33.5% 87,586 178.4%
NOTE 13 – DEFERRED COMPENSATION PLAN
City employees may defer a portion of their compensation under City sponsored Deferred Compensation Plans created in accordance with Internal Revenue Code Section 457. Under these Plans, participants are not taxed on the deferred portion of their compensation until distributed to them. Distributions may be made only at termination, retirement, death or in an emergency as defined by the Plans.
The laws governing deferred compensation plan assets require plan assets to be held by a Trust for the exclusive benefit of plan participants and their beneficiaries. Since the assets held under these plans are not the City’s property and are not subject to City control, they have been excluded from these financial statements.

CITY OF PALO ALTO Notes to the Basic Financial Statements
For the Year Ended June 30, 2016
96
NOTE 14 – RISK MANAGEMENT Coverage The City provides dental coverage to employees through a City plan, which is administered by a third party service agent. The City is self‐insured for dental claims. The City has a workers’ compensation insurance policy with coverage up to the statutory limit set by the State of California. The City retains the risk for the first $500,000 in losses for each accident and employee under this policy. The City also has public employee dishonesty insurance with a $5,000 deductible and coverage up to $1.0 million per loss. The Chief Financial Officer and City Manager each have coverage up to $4.0 million per loss. The City’s property, boiler, and machinery insurance policy has various deductibles and coverage based on the type of property. The City is a member of the Authority for California Cities Excess Liability (ACCEL), which provides excess general liability insurance coverage, including auto liability, up to $100 million per occurrence. The City retains the risk for the first $1.0 million in losses for each occurrence under this policy. ACCEL was established for the purpose of creating a risk management pool for central California municipalities. ACCEL is governed by a Board of Directors consisting of representatives of its member cities. The board controls the operations of ACCEL, including selection of claims management, general administration and approval of the annual budget. The City’s deposits with ACCEL equal the ratio of the City’s payroll to the total payroll of all entities. Actual surpluses or losses are shared according to a formula developed from overall loss costs and spread to member entities on a percentage basis after a retrospective rating. During the year ended June 30, 2016, the City paid $0.9 million to ACCEL for current year coverage. Audited financial statements are available from ACCEL at 100 Pine Street, 11th Floor, San Francisco, California 94110. Claims Liability The City provides for the uninsured portion of claims and judgments in the General Liabilities insurance program funds. Claims and judgments, including a provision for claims incurred but not reported, and claim adjustment expenses are recorded when a loss is deemed probable of assertion and the amount of the loss is reasonably determinable. As discussed above, the City has coverage for such claims, but it has retained the risk for the deductible or uninsured portion of these claims.

CITY OF PALO ALTO Notes to the Basic Financial Statements
For the Year Ended June 30, 2016
97
NOTE 14 – RISK MANAGEMENT (Continued)
The City’s liability for uninsured claims is limited to dental, general liability, and workers’ compensation claims, as discussed above. Dental liability is based on a percentage of current year actual expense. General and workers’ compensation liabilities are based on the results of actuarial studies, and include amounts for claims incurred but not reported as follows as of June 30 (in thousands):
2016 2015
Beginning balance 24,118$ 26,753$
Liability for current and prior fiscal years claims
and claims incurred but not reported (IBNR) 2,850 574
Claims paid (3,589) (3,209)
Ending balance 23,379$ 24,118$
Current portion 5,237$ 5,317$
Year Ended June 30
The City has not incurred a claim that has exceeded its insurance coverage limits in any of the last three years, nor have there been any significant reductions in insurance coverage.
NOTE 15 – JOINT VENTURES
General The City participates in joint ventures through Joint Powers Authorities (JPAs) established under the Joint Exercise of Powers Act of the State of California. As separate legal entities, these JPAs exercise full powers and authorities within the scope of the related Joint Powers Agreement, including the preparation of annual budgets, accountability for all funds, the power to make and execute contracts and the right to sue and be sued. Obligations and liabilities of the JPAs, including the long‐term debt in which the City participates in repayment, are not obligations and liabilities of the City, and are not reported on the City’s financial statements.
Each JPA is governed by a board consisting of representatives from each member agency. Each board controls the operations of its respective JPA, including selection of management and approval of operating budgets, independent of any influence by member agencies beyond their representation on the Board.
Northern California Power Agency The City is a member of Northern California Power Agency (NCPA), a joint powers agency which operates under a joint powers agreement among fifteen public agencies. The purpose of NCPA is to use the combined strength of its members to purchase, generate, sell and interchange electric energy and capacity through the acquisition and use of electrical generation and transmission facilities. Each agency member has agreed to fund a pro rata share of certain assessments by NCPA and enter into take‐or‐pay power supply contracts with NCPA. While NCPA is governed by its members, none of its obligations are those of its members unless expressly assumed by them.

CITY OF PALO ALTO Notes to the Basic Financial Statements
For the Year Ended June 30, 2016
98
NOTE 15 – JOINT VENTURES (Continued) During the year ended June 30, 2016, the City incurred expenses totaling $73.4 million for purchased power and assessments earned by NCPA. The City’s interest in NCPA projects and reserves, as computed by NCPA, was $7.8 million at June 30, 2016. This amount represents the City’s portion of funds, which resulted from the settlement with third parties of issues with financial consequences and reconciliations of several prior years’ budgets for programs. It is recognized that all the funds credited to the City are linked to the collection of revenue from the City’s ratepayers, or to the settlement of disputes relating to electric power supply and that the money was collected from the City’s ratepayers to pay power bills. Additionally, the NCPA Commission identified and approved the funding of specific reserves for working capital, accumulated employees’ post‐retirement medical benefits, and billed property taxes for the geothermal project. The Commission also identified a number of contingent liabilities that may or may not be realized, the cost of which in most cases is difficult to estimate at this time. One such contingent liability is the steam field depletion, which will require funding to cover debt service and operational costs in excess of the expected value of the electric power. The General Operating Reserve (GOR) is intended to minimize the number and amount of individual reserves needed for each project, protect NCPA’s financial condition and maintain its credit worthiness. There are no funds on deposit with NCPA as a reserve against these contingencies identified by NCPA. Members of NCPA may participate in an individual project of NCPA without obligation for any other project. Member assessments collected for one project may not be used to finance other projects of NCPA without the member’s permission. Geothermal Projects A purchased power agreement with NCPA obligated the City for 6.2 percent and 6.2 percent, respectively, of the operating costs and debt service of the two NCPA 110‐megawatt geothermal steam‐powered generating plants, Project Number 2 and Project Number 3. The City’s participation in the Geothermal Project was sold to Turlock Irrigation District in October 1984. Accordingly, the City is liable for payment of outstanding geothermal related debt only in the event that Turlock fails to make specified payments. Total outstanding debt of the NCPA Geothermal Project at June 30, 2016 is $78.9 million. The City’s participation in this project was 6.2 percent, or $4.9 million. Calaveras Hydroelectric Project In July 1981, NCPA agreed with Calaveras County Water District to purchase the output of the North Fork Stanislaus River Hydroelectric Development Project and to finance its construction. Debt service payments to NCPA began in February 1990 when the project was declared substantially complete and power was delivered to the participants. Under its power purchase agreement with NCPA, the City is obligated to pay 22.9 percent of this Project’s debt service and operating costs. At June 30, 2016, the book value of this Project’s plant, equipment and other assets was $435 million, while its long‐term debt totaled $356 million and other liabilities totaled $70 million. The City’s share of the Project’s long‐term debt amounted to $81.5 million at that date.

CITY OF PALO ALTO Notes to the Basic Financial Statements
For the Year Ended June 30, 2016
99
NOTE 15 – JOINT VENTURES (Continued) Geothermal Public Power Line In 1983, NCPA, the Sacramento Municipal Utility District, the City of Santa Clara and the Modesto Irrigation District (Joint Owners) initiated studies for a Geothermal Public Power Line (GPPL), which would carry power generated at several existing and planned geothermal plants in The Geysers area to a location where the Joint Owners could receive it for transmission to their load centers. NCPA has an 18.5 percent share of this Project and the City has an 11.1 percent participation in NCPA’s share. In 1989, the development of the proposed Geothermal Public Power Line was discontinued because NCPA was able to contract for sufficient transmission capacity to meet its needs in The Geysers. However, because the project financing provided funding for an ownership interest in a Pacific Gas & Electric (PG&E) transmission line, a central dispatch facility and a performance bond pursuant to the Interconnection Agreement with PG&E, as well as an ownership interest in the proposed GPPL, NCPA issued $16 million in long‐term, fixed‐rate revenue bonds in November 1989 to defease the remaining variable rate refunding bonds used to refinance this project. The City is obligated to pay its 11.1 percent share of the related debt service, but debt service costs are covered through NCPA billing mechanisms that allocate the costs to members based on use of the facilities and services. At June 30, 2016, the book value of this Project’s plant, equipment and other assets was zero, and its long‐term debt totaled zero. NCPA’s financial statements can be obtained from NCPA, 180 Cirby Way, Roseville, CA 95678. Transmission Agency of Northern California (TANC) The City is a member of a joint powers agreement with 14 other entities in Transmission Agency of Northern California (TANC). TANC’s purpose is to provide electrical transmission or other facilities for the use of its members. While governed by its members, none of TANC’s obligations are those of its members unless expressly assumed by them. The City was obligated to pay 4 percent of TANC’s debt‐service and operating costs. However, a Resolution was approved authorizing the execution of a Long‐Term Layoff Agreement (LTLA) between the Cities of Palo Alto and Roseville. These two agencies desired to “layoff” their entitlement rights to the California‐Oregon Transmission Project (COTP) (and Roseville’s South of Tesla entitlement rights) for a period of 15 years to those acquiring members (Sacramento Municipal Utility District, Turlock Irrigation District, and Modesto Irrigation District). The effective date of this Agreement was February 1, 2009. As a result, the City is not obligated to pay TANC’s debt‐service and operating costs starting February 1, 2009, for a period of fifteen years. TANC’s financial statements can be obtained from TANC, P.O. Box 15129, Sacramento, CA 95851.

CITY OF PALO ALTO Notes to the Basic Financial Statements
For the Year Ended June 30, 2016
100
NOTE 15 – JOINT VENTURES (Continued) Bay Area Water Supply and Conservation Agency (BAWSCA) The City is a member of a regional water district with 26 other entities, the Bay Area Water Supply and Conservation Agency (BAWSCA). BAWSCA was created on May 27, 2003 to represent the interests of 24 cities and water districts and two private utilities in Alameda, Santa Clara and San Mateo counties that purchase water on a wholesale basis from the San Francisco regional water system. It has the power to issue debt and plan, finance, construct, and operate water supply, transmission, reclamation, and conservation projects on behalf of its members. In 2013 the City participated in a debt issuance by BAWSCA. The debt was issued to repay certain long‐term costs associated with the San Francisco Public Utilities Commission (SFPUC) water supply contract. During the fiscal year, the City paid its share of the annual debt service of $1.9 million, which will vary based on annual water purchases of the City compared to other BAWSCA agencies. BAWSCA’s financial statements can be obtained from BAWSCA, 155 Bovet Road, Suite 650, San Mateo, California 94402. NOTE 16 – COMMITMENTS AND CONTINGENCIES
Palo Alto Unified School District – The City leases a portion of the former Cubberley School site and twelve extended day care sites from Palo Alto Unified School District (PAUSD). The lease is part of a larger agreement, which includes a mechanism for a joint planning process between the City and PAUSD to develop a long‐term master plan for the Cubberley site. The City will pay $1.86 million annually into a separate fund to be used for repairing, renovating and/or improving the infrastructure at the Cubberley site. The lease term expired on December 31, 2014, and the City exercised its option to extend for 5 years, with a new expiration date of 12/31/2019. The lease provides for one more five‐year option to extend from 1/1/2020 to 12/31/2024. The City’s rent and infrastructure payment for the facilities is $7.3 million per year plus insurance, repairs and maintenance. The rent may vary from year to year depending on the actual number of days used. Should any new law or regulation require the expenditure of work in excess of $250,000, per the terms of the lease, the City and PAUSD may renegotiate the lease. This lease is cancelable upon 90 days’ written notice in the event funds are not appropriated by the City. In addition, the lease is contingent upon authorization by the Palo Alto electorate if it exceeds the City’s Proposition 4 (GANN) appropriations limitation in any fiscal year. Lease expenditures for the year ended June 30, 2016amounted to $7.4 million. Future minimum annual lease and infrastructure payments are as follows (in thousands):
Year EndingJune 30 Payment
2017 7,565$
2018 7,736 2019 7,912 2020 4,001
27,214$

CITY OF PALO ALTO Notes to the Basic Financial Statements
For the Year Ended June 30, 2016
101
NOTE 16 – COMMITMENTS AND CONTINGENCIES (Continued)
GreenWaste of Palo Alto – GreenWaste of Palo Alto is the City’s contractor for waste collection, transportation, and processing services. The agreement expires June 30, 2021. The base compensation for GreenWaste is adjusted annually based on CPI indicators stipulated in the contract. In FY 2016 payments to GreenWaste were $10.5 million. City of Palo Alto Regional Water Quality Control Plant – The cities of Palo Alto, Mountain View and Los Altos (the Partners) participate jointly in the cost of maintaining and operating the City of Palo Alto Regional Water Quality Control Plant and related system (the Plant). The City is the owner and administrator of the Plant, which provides the transmission, treatment and disposal of sewage for the Partners. The cities of Mountain View and Los Altos are entitled to use a portion of the capacity of the Plant for a specified period of time. Each partner has the right to rent unused capacity from/to the other partners. The expenses of operations and maintenance are paid quarterly by each partner based on its pro rata share of treatment costs. Additionally, joint system revenues are shared by the partners in the same ratio as expenses are paid. The amended agreement has a term of fifty years beginning from the original signing in October 1968, but may be terminated by any partner upon ten years’ notice to the other partners. All sewage treatment property, plant and equipment are included in the Wastewater Treatment Enterprise Fund’s capital assets balance. If the City initiates the termination of the contracts, it is required to pay the other partners their unamortized contribution towards the capital assets. Solid Waste Materials Recovery and Transfer Station (SMaRT Station) – On June 9, 1992, the City, along with the City of Mountain View, signed a Memorandum of Understanding (MOU) with the City of Sunnyvale (Sunnyvale) to participate in the construction and operation of the SMaRT station, which recovers recyclable materials from the municipal solid waste delivered from participating cities. Per the MOU, the City has a capacity share of 21.3 percent of this facility and reimburses its proportionate capacity share of design, construction and operation costs to Sunnyvale. On December 1, 1992, the Sunnyvale Financing Authority issued $24.6 million in revenue bonds to finance the design and construction costs of the SMaRT Station. In the fiscal year ended June 30, 2003, the 1992 bonds were refunded by issuing the 2003 Solid Waste Revenue Bonds in the amount of $20.6 million. Even though these bonds are payable from and secured by the net revenues of Sunnyvale’s Utilities Enterprise, the City is obligated to reimburse Sunnyvale 21.3 percent of total debt service payments related to these bonds. The City’s portion of remaining principal balance for SMaRT revenue bonds as of June 30, 2016, is $0.4 million. During the year ended June 30, 2016, the City paid $0.4 million as its portion of current debt service. In FY 2008, the members agreed to finance an Equipment Replacement Project from existing reserves and proceeds from the Solid Waste Revenue Bond, Series 2007. The City has committed to repay 27.8 percent of the remaining debt service on the Bonds. The City’s portion of the Bonds amounts to $0.9 million as of June 30, 2016. During the year ended June 30, 2016, the City paid $0.2 million as its portion of current debt service.

CITY OF PALO ALTO Notes to the Basic Financial Statements
For the Year Ended June 30, 2016
102
NOTE 16 – COMMITMENTS AND CONTINGENCIES (Continued) UTILITIES ENERGY RESOURCE MANAGEMENT Electric Power Supply Purchase Agreements – The City has numerous power purchase agreements with power producers to purchase capacity and energy to supply a portion of its load requirements. As of June 30, 2016, the approximate minimum obligations for the contracts, assuming the energy is delivered over the next five years, are as follows:
Fiscal Year Projected Obligation
2017 $64.7 million
2018 $64.2 million
2019 $64.7 million
2020 $65.3 million
2021 $66.1 million
Contractual Commitments beyond 2021 (Electricity) – Several of the City’s purchase power and transmission contracts extend beyond the five‐year summary presented above. These contracts expire between 2021 and 2051 and provide for power under various terms and conditions. The City estimates that its annual minimum commitments under the contracts, assuming the energy is delivered, ranges between $67.3 million in 2022 and $48.9 million in 2043. The City’s largest single purchase power source is the Western Base Resource contract, whereby the City receives 12.31 percent of the amount of energy made available by Western, after meeting Central Valley Project use requirements, in any given year after 2014 at a 12.31 percent share of their revenue requirement. The Western contract expires on December 31, 2024. The City expects the Western contract to be extended for another 20 years beyond 2024, although likely at a slightly lower percent share of the total energy output. Gas Accord V – The City is a party to the Gas Accord V, a natural gas transportation contract between Pacific Gas and Electric Company (PG&E) and its gas transportation customers. New rates are determined through a proceeding at the California Public Utilities Commission. A final CPUC decision on Pacific Gas and Electric Company’s (PG&E) Gas Transmission and Storage Case was issued June 2016. Although several appeals are underway, Palo Alto’s gas transmission rates increased by 230% and Palo Alto’s local transmission rates increased by $2 million on August 1, 2016.
San Francisco Public Utilities Commission – The City purchases water to deliver to the customers of its water utility from the San Francisco Public Utilities Commission (SFPUC) under a contract terminating in 2034. The City’s wholesale water rate under this contract is determined by a ratemaking process under the authority of the SFPUC, with contractual limitations on the types of costs that may be allocated to wholesale water purchasers like the City. The City is prohibited from purchasing from other water suppliers under this contract, though it is not prohibited from using ground water. The City’s cost of water under this contract is projected to increase by 74% by 2021 as the SFPUC completes an upgrade to its regional water system facilities under its Water System Improvement Program (WSIP).

CITY OF PALO ALTO Notes to the Basic Financial Statements
For the Year Ended June 30, 2016
103
NOTE 16 – COMMITMENTS AND CONTINGENCIES (Continued)
Litigation The City is subject to litigation arising in the normal course of business. In the opinion of the City Attorney, there is no pending litigation, claims or assessments that are likely to have a materially adverse effect on the City’s financial condition.
A class action lawsuit for refund of telephone users tax was filed against the City in August 2015. At this time, the City Attorney is of the opinion that a potential loss is neither probable nor can it be reasonably estimated.
A class action lawsuit for refund of allegedly illegal charges to gas and electrical customers was filed against the City in October 2016. At this time, the City Attorney is of the opinion that a potential loss is neither probable nor can it be reasonably estimated.
Grant Programs The City participates in Federal and State grant programs. These programs have been audited by the City’s independent auditors in accordance with the provisions of the Federal Single Audit Act amendments of 1996 and applicable State requirements. No costs were questioned as a result of these audits; however, these programs are still subject to further examination by the grantors and the amount, if any, of expenditures which may be disallowed by the granting agencies cannot be determined at this time. The City expects such amounts, if any, to be immaterial.

104
This page is intentionally left blank.
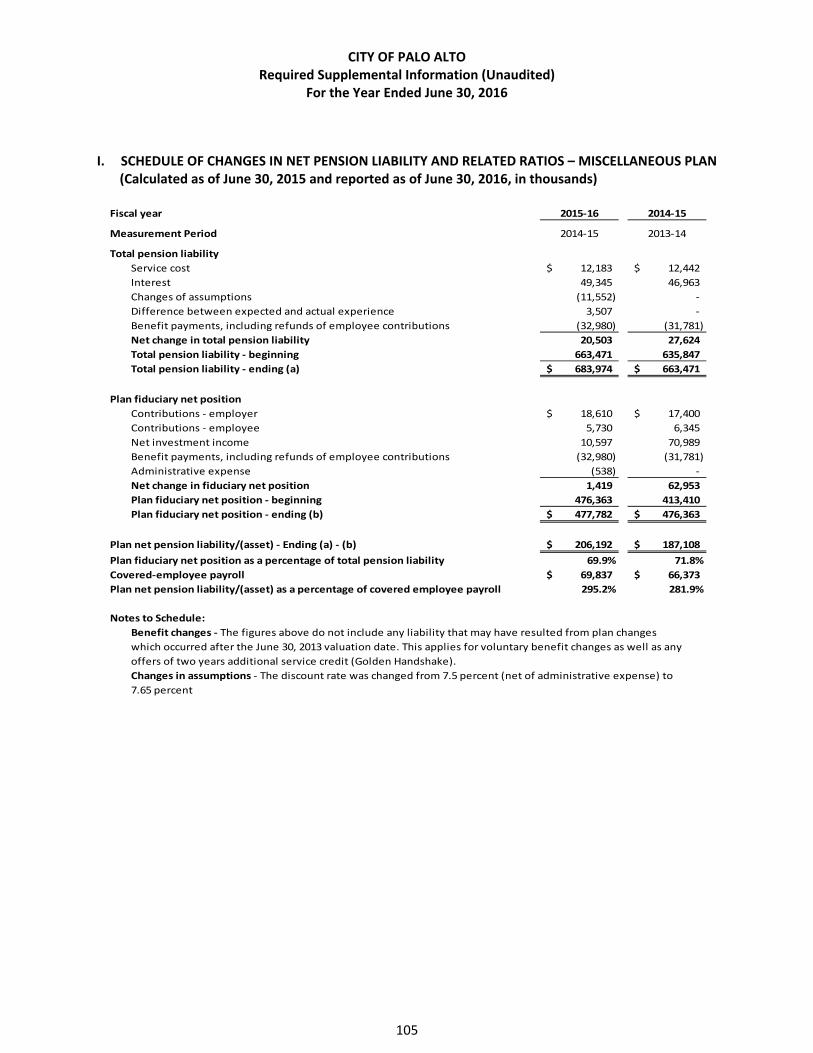
CITY OF PALO ALTO Required Supplemental Information (Unaudited)
For the Year Ended June 30, 2016
105
I. SCHEDULE OF CHANGES IN NET PENSION LIABILITY AND RELATED RATIOS – MISCELLANEOUS PLAN (Calculated as of June 30, 2015 and reported as of June 30, 2016, in thousands)
Fiscal year 2015‐16 2014‐15
Measurement Period 2014‐15 2013‐14
Total pension liability
Service cost 12,183$ 12,442$
Interest 49,345 46,963
Changes of assumptions (11,552) ‐
Difference between expected and actual experience 3,507 ‐
Benefit payments, including refunds of employee contributions (32,980) (31,781)
Net change in total pension liability 20,503 27,624
Total pension liability ‐ beginning 663,471 635,847
Total pension liability ‐ ending (a) 683,974$ 663,471$
Plan fiduciary net position
Contributions ‐ employer 18,610$ 17,400$
Contributions ‐ employee 5,730 6,345
Net investment income 10,597 70,989
Benefit payments, including refunds of employee contributions (32,980) (31,781)
Administrative expense (538) ‐
Net change in fiduciary net position 1,419 62,953
Plan fiduciary net position ‐ beginning 476,363 413,410
Plan fiduciary net position ‐ ending (b) 477,782$ 476,363$
Plan net pension liability/(asset) ‐ Ending (a) ‐ (b) 206,192$ 187,108$
Plan fiduciary net position as a percentage of total pension liability 69.9% 71.8%
Covered‐employee payroll 69,837$ 66,373$
Plan net pension liability/(asset) as a percentage of covered employee payroll 295.2% 281.9%
Notes to Schedule:
Benefit changes ‐ The figures above do not include any liability that may have resulted from plan changes
which occurred after the June 30, 2013 valuation date. This applies for voluntary benefit changes as well as any
offers of two years additional service credit (Golden Handshake).
Changes in assumptions ‐ The discount rate was changed from 7.5 percent (net of administrative expense) to
7.65 percent

CITY OF PALO ALTO Required Supplemental Information (Unaudited)
For the Year Ended June 30, 2016
106
II. SCHEDULE OF CONTRIBUTIONS– MISCELLANEOUS PLAN (Paid as of June 30, 2016 and deferred to June 30, 2017, in thousands)
Fiscal Year 2015‐16 2014‐15 2013‐14
Contractually required contribution (actuarially determined) 18,808$ 17,958$ 16,209$
Actual contribution (18,808) (17,958) (16,209)
Contribution deficiency/(excess) ‐$ ‐$ ‐$
Covered‐employee payroll 70,415$ 68,744$ 65,889$
Contributions as percentage of covered‐employee payroll 26.71% 26.12% 24.60%
Notes to Schedule:
The actuarial methods and assumptions used to set the actuarially determined contributions for
fiscal year 2016 contribution rates are as follows:
Valuation date June 30, 2013
Actuarial cost method Entry age normal
Amortization method/period For details, see June 30, 2013 Actuarial Valuation Report
Asset valuation method Actuarial Value of Assets. For details, see June 30, 2013
Actuarial Valuation Report
Inflation 2.75%
Salary increases Varies by entry age and service
Payroll growth 3.00%
Investment rate of return 7.50% net of pension plan investment and administrative
expense, includes inflation
Retirement age Probabilities of retirement are based on the 2010
CalPERS experience study of the period 1997 to 2007
Mortality Probabilities of mortality are based on the 2010 CalPERS
experience study of the period 1997 to 2007. Pre‐ and
post‐retirement mortality rates include 5 years of
projected mortality improvement using Scale AA
published by the Society of Actuaries.

CITY OF PALO ALTO Required Supplemental Information (Unaudited)
For the Year Ended June 30, 2016
107
III. SCHEDULE OF CHANGES IN NET PENSION LIABILITY AND RELATED RATIOS – SAFETY PLAN (Calculated as of June 30, 2015 and reported as of June 30, 2016, in thousands)
Fiscal Year 2015‐16 2014‐15
Measurement Period 2014‐15 2013‐14
Total pension liability
Service cost 5,959$ 6,221$
Interest 27,047 26,113
Changes of assumptions (6,327) ‐
Difference between expected and actual experience 75 ‐
Benefit payments, including refunds of employee contributions (21,148) (19,985)
Net change in total pension liability 5,606 12,349
Total pension liability ‐ beginning 367,403 355,054
Total pension liability ‐ ending (a) 373,009$ 367,403$
Plan fiduciary net position
Contributions ‐ employer 8,617$ 7,616$
Contributions ‐ employee 2,047 2,762
Net investment income 5,774 40,033
Benefit payments, including refunds of employee contributions (21,148) (19,985)
Administrative expense (290) ‐
Net change in fiduciary net position (5,000) 30,426
Plan fiduciary net position ‐ beginning 264,579 234,153
Plan fiduciary net position ‐ ending (b) 259,579$ 264,579$
Plan net pension liability/(asset) ‐ Ending (a) ‐ (b) 113,430$ 102,824$
Plan fiduciary net position as a percentage of total pension liability 69.59% 72.01%
Covered‐employee payroll 21,912$ 21,896$
Plan net pension liability/(asset) as a percentage of covered employee payroll 517.66% 469.60%
Notes to Schedule:
Benefit changes ‐ The figures above do not include any liability that may have resulted
from plan changes which occurred after the June 30, 2013 valuation date. This applies for voluntary benefit
changes as well as any offers of two years additional service credit (Golden Handshake).
Changes in assumptions ‐ the discount rate was changed from 7.5 percent (net of administrative expense) to
7.65 percent.

CITY OF PALO ALTO Required Supplemental Information (Unaudited)
For the Year Ended June 30, 2016
108
IV. SCHEDULE OF CONTRIBUTIONS – SAFETY PLAN(Paid as of June 30, 2016 and deferred to June 30, 2017, in thousands)
Fiscal Year 2015‐16 2014‐15 2013‐14
Contractually required contribution (actuarially determined) 9,395$ 9,036$ 8,323$
Actual contribution (9,395) (9,036) (8,323)
Contribution deficiency/(excess) ‐$ ‐$ ‐$
Covered‐employee payroll 23,229$ 22,860$ 24,886$
Contributions as percentage of covered‐employee payroll 40.45% 39.53% 33.44%
Notes to Schedule:
The actuarial methods and assumptions used to set the actuarially determined contributions for
fiscal year 2016 contribution rates are as follows:
Valuation Date June 30, 2013
Actuarial cost method Entry age normal
Amortization method/period For details, see June 30, 2013 Actuarial Valuation Report
Asset valuation method Actuarial Value of Assets. For details, see June 30, 2013
Actuarial Valuation Report
Inflation 2.75%
Salary increases Varies by entry age and service
Payroll growth 3.00%
Investment rate of return 7.50% net of pension plan investment and administrative
expense, includes inflation
Retirement age Probabilities of retirement are based on the 2010
CalPERS experience study of the period 1997 to 2007
Mortality Probabilities of mortality are based on the 2010 CalPERS
experience study of the period 1997 to 2007. Pre‐ and
post‐retirement mortality rates include 5 years of
projected mortality improvement using Scale AA
published by the Society of Actuaries.

Special Debt
Revenue Service Permanent
Funds Funds Fund Total
ASSETS:
Cash and investments:
Available for operations 84,373$ 3,561$ 1,499$ 89,433$
Cash and investments with fiscal agents ‐ 248 ‐ 248
Receivables, net:
Accounts 7 24 ‐ 31
Interest 354 22 6 382
Notes 18,730 ‐ ‐ 18,730
Total assets 103,464$ 3,855$ 1,505$ 108,824$
Liabilities:
Accounts payable and accruals 354$ ‐$ ‐$ 354$
Accrued salaries and benefits 46 ‐ ‐ 46
Total liabilities 400 ‐ ‐ 400
Fund balances:
Nonspendable
Eyerly family ‐ ‐ 1,505 1,505
Restricted
Transportation mitigation 10,841 ‐ ‐ 10,841
Federal revenue 4,569 ‐ ‐ 4,569
Street improvement 1,308 ‐ ‐ 1,308
Local law enforcement 180 ‐ ‐ 180
Debt service ‐ 3,855 ‐ 3,855
Public benefit 25,649 ‐ ‐ 25,649
Committed
Developer impact fee 14,169 ‐ ‐ 14,169
Housing In‐Lieu 41,251 ‐ ‐ 41,251
Special districts 3,704 ‐ ‐ 3,704
Downtown business 34 ‐ ‐ 34
Assigned
Unrealized gain on investment 1,358 ‐ ‐ 1,358
Other general government 1 ‐ ‐ 1
Total fund balances 103,064 3,855 1,505 108,424
Total liabilities and fund balances 103,464$ 3,855$ 1,505$ 108,824$
LIABILITIES AND FUND BALANCES:
CITY OF PALO ALTO
Non‐major Governmental Funds
Combining Balance Sheet
June 30, 2016
(Amounts in thousands)
109

110
This page is intentionally left blank.

Special DebtRevenue Service PermanentFunds Funds Fund Total
REVENUES:Property tax ‐$ 4,582$ ‐$ 4,582$ Special assessments 100 ‐ ‐ 100 Other taxes and fines 1,570 ‐ ‐ 1,570 From other agencies:Community Development Block Grants 240 ‐ ‐ 240 State of California 126 ‐ ‐ 126
Permits and licensesUniversity Avenue Parking 2,309 ‐ ‐ 2,309 California Avenue Parking 214 ‐ ‐ 214 Other permits and licenses 793 ‐ ‐ 793
Investment earnings 2,727 127 44 2,898 Rental income 6 ‐ ‐ 6 Other:Housing In‐Lieu ‐ residential 5,554 ‐ ‐ 5,554 Other fees 2,086 ‐ ‐ 2,086
Total revenues 15,725 4,709 44 20,478
EXPENDITURES:Current:Administrative Services 203 ‐ ‐ 203 Public Works 797 ‐ ‐ 797 Planning and Community Environment 663 ‐ ‐ 663 Police 225 ‐ ‐ 225 Community Services 1,231 ‐ ‐ 1,231 Non‐Departmental 559 32 7 598
Debt service:Principal retirement ‐ 6,735 ‐ 6,735 Interest and fiscal charges ‐ 4,230 ‐ 4,230
Total expenditures 3,678 10,997 7 14,682
EXCESS (DEFICIENCY) OF REVENUES OVER (UNDER) EXPENDITURES 12,047 (6,288) 37 5,796
OTHER FINANCING SOURCES (USES):Transfers in 3,564 3,252 ‐ 6,816 Transfers out (9,013) ‐ ‐ (9,013)
Total other financing sources (uses) (5,449) 3,252 ‐ (2,197)
Change in fund balances 6,598 (3,036) 37 3,599
FUND BALANCES, BEGINNING OF YEAR 96,466 6,891 1,468 104,825
FUND BALANCES, END OF YEAR 103,064$ 3,855$ 1,505$ 108,424$
CITY OF PALO ALTONon‐major Governmental Funds
Combining Statement of Revenues, Expenditures and Changes in Fund BalancesFor the Year Ended June 30, 2016
(Amounts in thousands)
111

112
This page is intentionally left blank.

113
NON‐MAJOR GOVERNMENTAL FUNDS
SPECIAL REVENUE FUNDS
Street Improvement This fund accounts for revenues received from state gas tax. Allocations must be spent on the construction and maintenance of the road network system of the City.
Federal Revenue This fund accounts for grant funds received under the Community Development Act of 1974 and HOME Investment Grant Programs, for activities approved and subject to federal regulations.
Housing In‐Lieu This fund accounts for revenues from commercial and residential developers to provide housing under the City’s Below Market Rate program.
Special Districts This fund accounts for revenues from parking permits and for maintenance of various parking lots within the City’s parking districts.
Transportation Mitigation This fund accounts for revenues from fees or contributions required for transportation mitigation issues encountered as a result of City development.
Local Law Enforcement This fund accounts for revenues received in support of City’s law enforcement program.
Asset Seizure This fund accounts for seized property and funds associated with drug trafficking. Under California Assembly Bill No. 4162, the monies are released to the City for specific expenditures related to law enforcement activities.
Developer Impact Fee This fund accounts for fees imposed on new developments to be used for parks, community centers and libraries.
Downtown Business Development District The Downtown Business Development District Fund was established to account for the activities of the Palo Alto Downtown Business Development District, which was established to enhance the viability of the downtown business district.
Public Benefit This fund accounts for the activities of the Stanford University Medical Center (SUMC) Development Agreement (DA) whereby SUMC will enhance and expand their facilities and the City will grant SUMC the right to develop the facilities in accordance with the DA.

Street Federal Housing SpecialImprovement Revenue In‐Lieu Districts
ASSETS:Cash and investments:Available for operations 1,327$ 455$ 27,021$ 3,796$
Receivables:Accounts ‐ ‐ ‐ ‐ Interest 6 ‐ 101 12 Notes ‐ 4,165 14,565 ‐
Total assets 1,333$ 4,620$ 41,687$ 3,808$
Liabilities:Accounts payable and accruals ‐$ 47$ 35$ 76$ Accrued salaries and benefits ‐ 4 ‐ 28
Total liabilities ‐ 51 35 104
Fund balances:RestrictedTransportation mitigation ‐ ‐ ‐ ‐ Federal revenue ‐ 4,569 ‐ ‐ Street improvement 1,308 ‐ ‐ ‐ Local law enforcement ‐ ‐ ‐ ‐ Public benefit ‐ ‐ ‐ ‐
CommittedDeveloper impact fee ‐ ‐ ‐ ‐ Housing In‐Lieu ‐ ‐ 41,251 ‐ Special districts ‐ ‐ ‐ 3,704 Downtown business ‐ ‐ ‐ ‐
AssignedUnrealized gain on investment 25 ‐ 401 ‐ Other general government ‐ ‐ ‐ ‐
Total fund balances 1,333 4,569 41,652 3,704
Total liabilities and fund balances 1,333$ 4,620$ 41,687$ 3,808$
LIABILITIES AND FUND BALANCES:
CITY OF PALO ALTONon‐major Special Revenue Funds
Combining Balance SheetJune 30, 2016
(Amounts in thousands)
114

DowntownBusiness
Transportation Local Law Asset Developer Development Public Mitigation Enforcement Seizure Impact Fee District Benefit Total
11,136$ 173$ 3$ 14,349$ 86$ 26,027$ 84,373$
‐ 7 ‐ ‐ ‐ ‐ 750 1 ‐ 59 ‐ 125 354 ‐ ‐ ‐ ‐ ‐ ‐ 18,730
11,186$ 181$ 3$ 14,408$ 86$ 26,152$ 103,464$
146$ ‐$ ‐$ ‐$ 50$ ‐$ 354$ ‐ ‐ ‐ 6 ‐ 8 46
146 ‐ ‐ 6 50 8 400
10,841 ‐ ‐ ‐ ‐ ‐ 10,841 ‐ ‐ ‐ ‐ ‐ ‐ 4,569 ‐ ‐ ‐ ‐ ‐ ‐ 1,308 ‐ 178 2 ‐ ‐ ‐ 180 ‐ ‐ ‐ ‐ ‐ 25,649 25,649
‐ ‐ ‐ 14,169 ‐ ‐ 14,169 ‐ ‐ ‐ ‐ ‐ ‐ 41,251 ‐ ‐ ‐ ‐ ‐ ‐ 3,704 ‐ ‐ ‐ ‐ 34 ‐ 34
199 3 ‐ 233 2 495 1,358 ‐ ‐ 1 ‐ ‐ ‐ 1
11,040 181 3 14,402 36 26,144 103,064
11,186$ 181$ 3$ 14,408$ 86$ 26,152$ 103,464$
115

Street Federal Housing SpecialImprovement Revenue In‐Lieu Districts
REVENUES:Special assessments ‐$ ‐$ ‐$ ‐$ Other taxes and fines 1,461 ‐ ‐ 109 From other agencies:Community Development Block Grants ‐ 240 ‐ ‐ State of California ‐ ‐ ‐ ‐
Permits and licensesUniversity Avenue Parking ‐ ‐ ‐ 2,309 California Avenue Parking ‐ ‐ ‐ 214 Other permits and licenses ‐ ‐ ‐ 793
Investment earnings 46 ‐ 956 91 Rental income ‐ ‐ 6 ‐ Other:Housing In‐Lieu ‐ ‐ 5,554 ‐ Other fees ‐ 365 ‐ 4
Total revenues 1,507 605 6,516 3,520
EXPENDITURES:Current:Administrative Services ‐ ‐ ‐ 203 Public Works ‐ ‐ ‐ 797 Planning and Community Environment ‐ 444 (449) 668 Police ‐ ‐ 135 ‐ Community Services ‐ ‐ ‐ 22 Non‐Departmental ‐ 34 165 249
Total expenditures ‐ 478 (149) 1,939
EXCESS (DEFICIENCY) OF REVENUES OVER (UNDER) EXPENDITURES 1,507 127 6,665 1,581
OTHER FINANCING SOURCES (USES):Transfers in ‐ ‐ 2,095 642 Transfers out (1,724) ‐ (1,095) (532)
Total other financing sources (uses) (1,724) ‐ 1,000 110
Change in fund balances (217) 127 7,665 1,691
FUND BALANCES, BEGINNING OF YEAR 1,550 4,442 33,987 2,013
FUND BALANCES, END OF YEAR 1,333$ 4,569$ 41,652$ 3,704$
CITY OF PALO ALTONon‐major Special Revenue Funds
Combining Statement of Revenues, Expenditures and Changes in Fund BalancesFor the Year Ended June 30, 2016
(Amounts in thousands)
116

DowntownBusiness
Transportation Local Law Asset Developer Development PublicMitigation Enforcement Seizure Impact Fee District Benefit Total
‐$ ‐$ ‐$ ‐$ 100$ ‐$ 100$ ‐ ‐ ‐ ‐ ‐ ‐ 1,570
‐ ‐ ‐ ‐ ‐ ‐ 240 ‐ 126 ‐ ‐ ‐ ‐ 126
‐ ‐ ‐ ‐ ‐ ‐ 2,309 ‐ ‐ ‐ ‐ ‐ ‐ 214 ‐ ‐ ‐ ‐ ‐ ‐ 793
353 6 1 419 3 852 2,727 ‐ ‐ ‐ ‐ ‐ ‐ 6
‐ ‐ ‐ ‐ ‐ ‐ 5,554 274 ‐ ‐ 1,443 ‐ ‐ 2,086
627 132 1 1,862 103 852 15,725
‐ ‐ ‐ ‐ ‐ ‐ 203 ‐ ‐ ‐ ‐ ‐ ‐ 797 ‐ ‐ ‐ ‐ ‐ ‐ 663 ‐ 90 ‐ ‐ ‐ ‐ 225 ‐ ‐ ‐ 135 ‐ 1,074 1,231 ‐ ‐ ‐ ‐ 111 ‐ 559
‐ 90 ‐ 135 111 1,074 3,678
627 42 1 1,727 (8) (222) 12,047
‐ ‐ ‐ 107 ‐ 720 3,564 (1,550) ‐ ‐ ‐ ‐ (4,112) (9,013)
(1,550) ‐ ‐ 107 ‐ (3,392) (5,449)
(923) 42 1 1,834 (8) (3,614) 6,598
11,963 139 2 12,568 44 29,758 96,466
11,040$ 181$ 3$ 14,402$ 36$ 26,144$ 103,064$
117

Street Improvement Federal Revenue
Variance Variance
Actual, plus Positive Actual, plus Positive
Budget Encumbrances (Negative) Budget Encumbrances (Negative)
REVENUES:
Special assessments ‐$ ‐$ ‐$ ‐$ ‐$ ‐$
Other taxes and fines 1,416 1,461 45 ‐ ‐ ‐
From other agencies:
Community Development Block Grants ‐ ‐ ‐ 442 240 (202)
State of California ‐ ‐ ‐ ‐ ‐ ‐
Permits and licenses
University Avenue Parking ‐ ‐ ‐ ‐ ‐ ‐
California Avenue Parking ‐ ‐ ‐ ‐ ‐ ‐
Other permits and licenses ‐ ‐ ‐ ‐ ‐ ‐
Investment earnings 13 46 33 ‐ ‐ ‐
Rental income ‐ ‐ ‐ ‐ ‐ ‐
Other:
Housing In‐Lieu ‐ residential ‐ ‐ ‐ ‐ ‐ ‐
Other fees ‐ ‐ ‐ 136 365 229
Total revenues 1,429 1,507 78 578 605 27
EXPENDITURES:
Current:
Administrative Services ‐ ‐ ‐ ‐ ‐ ‐
Public Works ‐ ‐ ‐ ‐ ‐ ‐
Planning and Community Environment ‐ ‐ ‐ 625 483 142
Police ‐ ‐ ‐ ‐ ‐ ‐
Community Services ‐ ‐ ‐ ‐ ‐ ‐
Non‐Departmental ‐ ‐ ‐ ‐ 34 (34)
Total expenditures ‐ ‐ ‐ 625 517 108
Excess (deficiency) of revenues
over (under) expenditures 1,429 1,507 78 (47) 88 135
OTHER FINANCING SOURCES (USES):
Transfers in ‐ ‐ ‐ ‐ ‐ ‐
Transfers out (1,724) (1,724) ‐ ‐ ‐ ‐
Total other financing sources (uses) (1,724) (1,724) ‐ ‐ ‐ ‐
Change in fund balances, budgetary basis (295)$ (217) 78$ (47)$ 88 135$
Adjustment to Budgetary Basis:
Current year encumbrances/reappropriations ‐ 39
(217) 127
FUND BALANCES, BEGINNING OF YEAR, GAAP BASIS 1,550 4,442
FUND BALANCES, END OF YEAR, GAAP BASIS 1,333$ 4,569$
CHANGE IN FUND BALANCE, GAAP BASIS
(Amounts in thousands)
CITY OF PALO ALTO
Non‐major Special Revenue Funds
Combining Schedule of Revenues, Expenditures and Changes in Fund Balances ‐
Budget and Actual
For the Year Ended June 30, 2016
118

Housing In‐Lieu Special Districts Transportation Mitigation
Variance Variance Variance
Actual, plus Positive Actual, plus Positive Actual, plus Positive
Budget Encumbrances (Negative) Budget Encumbrances (Negative) Budget Encumbrances (Negative)
‐$ ‐$ ‐$ ‐$ ‐$ ‐$ ‐$ ‐$ ‐$
‐ ‐ ‐ 43 109 66 ‐ ‐ ‐
‐ ‐ ‐ ‐ ‐ ‐ ‐ ‐ ‐
‐ ‐ ‐ ‐ ‐ ‐ ‐ ‐ ‐
‐ ‐ ‐ 1,695 2,309 614 ‐ ‐ ‐
‐ ‐ ‐ 195 214 19 ‐ ‐ ‐
‐ ‐ ‐ 508 793 285 ‐ ‐ ‐
274 956 682 27 91 64 172 353 181
9 6 (3) ‐ ‐ ‐ ‐ ‐ ‐
5,085 5,554 469 ‐ ‐ ‐ ‐ ‐ ‐
‐ ‐ ‐ ‐ 4 4 1,717 274 (1,443)
5,368 6,516 1,148 2,468 3,520 1,052 1,889 627 (1,262)
‐ ‐ ‐ 205 203 2 ‐ ‐ ‐
‐ ‐ ‐ 998 896 102 ‐ ‐ ‐
2,592 (371) 2,963 1,456 878 578 ‐ ‐ ‐
‐ 135 (135) ‐ ‐ ‐ ‐ ‐ ‐
‐ ‐ ‐ 26 22 4 ‐ ‐ ‐
378 165 213 166 249 (83) ‐ ‐ ‐
2,970 (71) 3,041 2,851 2,248 603 ‐ ‐ ‐
2,398 6,587 4,189 (383) 1,272 1,655 1,889 627 (1,262)
‐ 2,095 2,095 642 642 ‐ ‐ ‐ ‐
‐ (1,095) (1,095) (532) (532) ‐ (1,550) (1,550) ‐
‐ 1,000 1,000 110 110 ‐ (1,550) (1,550) ‐
2,398$ 7,587 5,189$ (273)$ 1,382 1,655$ 339$ (923) (1,262)$
78 309 ‐
7,665 1,691 (923)
33,987 2,013 11,963
41,652$ 3,704$ 11,040$
119

Local Law Enforcement Asset Seizure
Variance Variance
Actual, plus Positive Actual, plus Positive
Budget Encumbrances (Negative) Budget Encumbrances (Negative)
REVENUES:
Special assessments ‐$ ‐$ ‐$ ‐$ ‐$ ‐$
Other taxes and fines ‐ ‐ ‐ ‐ ‐ ‐
From other agencies:
Community Development Block Grants ‐ ‐ ‐ ‐ ‐ ‐
State of California 106 126 20 ‐ ‐ ‐
Permits and licenses
University Avenue Parking ‐ ‐ ‐ ‐ ‐ ‐
California Avenue Parking ‐ ‐ ‐ ‐ ‐ ‐
Other permits and licenses ‐ ‐ ‐ ‐ ‐ ‐
Investment earnings ‐ 6 6 ‐ 1 1
Rental income ‐ ‐ ‐ ‐ ‐ ‐
Other:
Housing In‐Lieu ‐ residential ‐ ‐ ‐ ‐ ‐ ‐
Other fees ‐ ‐ ‐ ‐ ‐ ‐
Total revenues 106 132 26 ‐ 1 1
EXPENDITURES:
Current:
Administrative Services ‐ ‐ ‐ ‐ ‐ ‐
Public Works ‐ ‐ ‐ ‐ ‐ ‐
Planning and Community Environment ‐ ‐ ‐ ‐ ‐ ‐
Police 143 156 (13) ‐ ‐ ‐
Community Services ‐ ‐ ‐ ‐ ‐ ‐
Non‐Departmental ‐ ‐ ‐ ‐ ‐ ‐
Total expenditures 143 156 (13) ‐ ‐ ‐
Excess (deficiency) of revenues
over (under) expenditures (37) (24) 13 ‐ 1 1
OTHER FINANCING SOURCES (USES):
Transfers in ‐ ‐ ‐ ‐ ‐ ‐
Transfers out ‐ ‐ ‐ ‐ ‐ ‐
Total other financing sources (uses) ‐ ‐ ‐ ‐ ‐ ‐
Change in fund balances, Budgetary basis (37)$ (24) 13$ ‐$ 1 1$
Adjustment to Budgetary Basis:
Current year encumbrances/reappropriations 66 ‐
42 1
FUND BALANCES, BEGINNING OF YEAR, GAAP BASIS 139 2
FUND BALANCES, END OF YEAR, GAAP BASIS 181$ 3$
CHANGE IN FUND BALANCE, GAAP BASIS
(Amounts in Thousands)
CITY OF PALO ALTO
Non‐major Special Revenue Funds
Combining Schedule of Revenues, Expenditures and Changes in Fund Balances ‐
Budget and Actual
For the Year Ended June 30, 2016
120

Developer Impact Fee Downtown Business Improvement District Public Benefit
Variance Variance Variance
Actual, plus Positive Actual, plus Positive Actual, plus Positive
Budget Encumbrances (Negative) Budget Encumbrances (Negative) Budget Encumbrances (Negative)
‐$ ‐$ ‐$ 100$ 100$ ‐$ ‐$ ‐$ ‐$
‐ ‐ ‐ ‐ ‐ ‐ ‐ ‐ ‐
‐ ‐ ‐ ‐ ‐ ‐ ‐ ‐ ‐
‐ ‐ ‐ ‐ ‐ ‐ ‐ ‐ ‐
‐ ‐ ‐ ‐ ‐ ‐ ‐ ‐ ‐
‐ ‐ ‐ ‐ ‐ ‐ ‐ ‐ ‐
‐ ‐ ‐ ‐ ‐ ‐ ‐ ‐ ‐
215 419 204 2 3 1 663 852 189
‐ ‐ ‐ ‐ ‐ ‐ ‐ ‐ ‐
‐ ‐ ‐ ‐ ‐ ‐ ‐ ‐ ‐
1,569 1,443 (126) ‐ ‐ ‐ ‐ ‐ ‐
1,784 1,862 78 102 103 1 663 852 189
‐ ‐ ‐ ‐ ‐ ‐ ‐ ‐ ‐
‐ ‐ ‐ ‐ ‐ ‐ ‐ ‐ ‐
‐ ‐ ‐ ‐ ‐ ‐ ‐ ‐ ‐
‐ ‐ ‐ ‐ ‐ ‐ ‐ ‐ ‐
136 135 1 ‐ ‐ ‐ 1,318 1,075 243
‐ ‐ ‐ 136 124 12 ‐ ‐ ‐
136 135 1 136 124 12 1,318 1,075 243
1,648 1,727 79 (34) (21) 13 (655) (223) 432
69 107 38 ‐ ‐ ‐ ‐ 720 720
‐ ‐ ‐ ‐ ‐ ‐ (2,392) (4,112) (1,720)
69 107 38 ‐ ‐ ‐ (2,392) (3,392) (1,000)
1,717$ 1,834 117$ (34)$ (21) 13$ (3,047)$ (3,615) (568)$
‐ 13 1
1,834 (8) (3,614)
12,568 44 29,758
14,402$ 36$ 26,144$
121

122
This page is left intentionally blank.

123
NON‐MAJOR GOVERNMENTAL FUNDS
DEBT SERVICE FUNDS
Downtown Parking Improvement This fund accounts for revenues received from the General Fund to provide payment of principal and interest associated with the 2002B Downtown Parking Improvement Certificates of Participation as they become due.
Library Projects This fund accounts for revenues received from property taxes to provide payment of principal and interest associated with the 2010 and 2013A General Obligation Bonds as they become due.
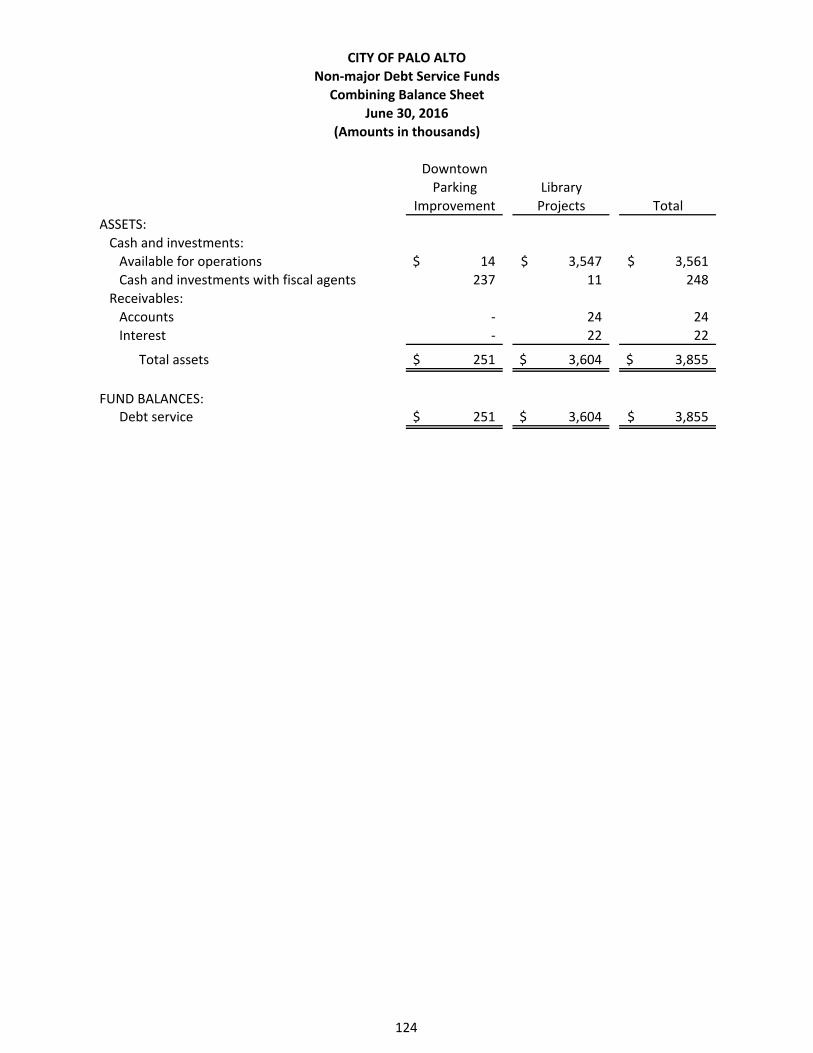
CITY OF PALO ALTO
Non‐major Debt Service Funds
Combining Balance Sheet
June 30, 2016
(Amounts in thousands)
Downtown
Parking Library
Improvement Projects Total
ASSETS:
Cash and investments:
Available for operations 14$ 3,547$ 3,561$
Cash and investments with fiscal agents 237 11 248
Receivables:
Accounts ‐ 24 24
Interest ‐ 22 22
Total assets 251$ 3,604$ 3,855$
FUND BALANCES:Debt service 251$ 3,604$ 3,855$
124

CITY OF PALO ALTO
Non‐major Debt Service Funds
Combining Statement of Revenues, Expenditures and Changes in Fund Balances
For the Year Ended June 30, 2016
(Amounts in thousands)
Downtown
Parking Library
Improvement Projects Total
REVENUES:
Property tax ‐$ 4,582$ 4,582$
Investment earnings ‐ 127 127
Total revenues ‐ 4,709 4,709
EXPENDITURES:
Current:
Non‐Departmental ‐ 32 32
Debt service:
Principal retirement 150 6,585 6,735
Interest and fiscal charges 84 4,146 4,230
Total expenditures 234 10,763 10,997
(DEFICIENCY) OF REVENUES
(UNDER) EXPENDITURES (234) (6,054) (6,288)
OTHER FINANCING SOURCES (USES):
Transfers in 234 3,018 3,252
Total other financing sources (uses) 234 3,018 3,252
Change in fund balances ‐ (3,036) (3,036)
FUND BALANCES, BEGINNING OF YEAR 251 6,640 6,891
FUND BALANCES, END OF YEAR 251$ 3,604$ 3,855$
125

Downtown Parking Improvement Library Projects
Variance Variance
Actual, plus Positive Actual, plus Positive
Budget Encumbrances (Negative) Budget Encumbrances (Negative)
REVENUES:
Special assessments ‐$ ‐$ ‐$ 4,655$ 4,582$ (73)$
Investment earnings ‐ ‐ ‐ ‐ 127 127
Total revenues ‐ ‐ ‐ 4,655 4,709 54
EXPENDITURES:
Current:
Non‐Departmental ‐ ‐ ‐ ‐ 32 (32)
Debt service:
Principal retirement 150 150 ‐ 1,445 6,585 (5,140)
Interest and fiscal charges 93 84 9 3,210 4,146 (936)
Total expenditures 243 234 9 4,655 10,763 (6,108)
Excess (deficiency) of revenues
over (under) expenditures (243) (234) 9 ‐ (6,054) (6,054)
OTHER FINANCING SOURCES (USES):
Transfers in 243 234 (9) ‐ 3,018 3,018
Total other financing sources (uses) 243 234 (9) ‐ 3,018 3,018
Change in fund balances, Budgetary basis ‐$ ‐ ‐$ ‐$ (3,036) (3,036)$
‐ (3,036)
FUND BALANCES, BEGINNING OF YEAR 251 6,640
FUND BALANCES, END OF YEAR 251$ 3,604$
CHANGE IN FUND BALANCE, GAAP BASIS
(Amounts in thousands)
CITY OF PALO ALTO
Non‐major Debt Service Funds
Combining Schedule of Revenues, Expenditures and Changes in Fund Balances ‐
Budget and Actual
For the Year Ended June 30, 2016
126

127
NON‐MAJOR GOVERNMENTAL FUNDS
PERMANENT FUND
Eyerly Family This fund accounts for the revenues received from assets donated by Mr. and Mrs. Fred Eyerly for the City and or its citizenry.

Eyerly Family Permanent Fund
Variance
Actual, plus Positive
Budget Encumbrances (Negative)
REVENUES:
Investment earnings 27$ 44$ 17$
Total revenues 27 44 17
EXPENDITURES:
Current:
Non‐Departmental ‐ 7 (7)
Total expenditures ‐ 7 (7)
Excess (deficiency) of revenues
over (under) expenditures 27 37 10
Change in fund balance 27$ 37 10$
37
FUND BALANCE, BEGINNING OF YEAR 1,468
FUND BALANCE, END OF YEAR 1,505$
CHANGE IN FUND BALANCE, GAAP BASIS
(Amounts in thousands)
CITY OF PALO ALTO
Non‐major Permanent Fund
Schedule of Revenues, Expenditures and Changes in Fund Balance ‐
Budget and Actual
For the Year Ended June 30, 2016
128
129
INTERNAL SERVICE FUNDS
INTRODUCTION Internal Service Funds are used to finance and account for special activities and services performed by a designated department for other departments in the City on a cost reimbursement basis.
Vehicle Replacement and Maintenance This fund accounts for the maintenance and replacement of vehicles and equipment used by all City departments. The source of revenue is from reimbursement of fleet replacement and maintenance costs allocated to each department by usage of vehicle.
Technology This fund accounts for replacement and upgrade of technology, and covers four primary areas used by all City departments: desktop, infrastructure, applications, and technology research and development. The source of revenue is from reimbursement of costs for support provided to other departments.
Printing and Mailing Services This fund accounts for central duplicating, printing and mailing services provided to all City departments. Source of revenue for this fund is from reimbursement of costs for services and supplies purchased by other departments.
General Benefits This fund accounts for the administration of compensated absences and health benefits.
Workers’ Compensation Insurance Program This fund accounts for the administration of the City’s self‐insured workers’ compensation programs.
General Liabilities Insurance Program This fund accounts for the administration of the City’s self‐insured general liability programs.
Retiree Health Benefits This fund accounts for the retiree health benefits.

Vehicle Printing Workers' GeneralReplacement and Compensation Liabilities Retiree
and Mailing General Insurance Insurance HealthMaintenance Technology Services Benefits Program Program Benefits Total
ASSETS:Current Assets:Cash and investments:Available for operations 11,134$ 22,403$ 24$ 12,977$ 21,231$ 8,203$ 4,072$ 80,044$
Accounts receivable, net 34 ‐ ‐ 33 48 ‐ ‐ 115 Interest receivable 46 91 ‐ 62 92 34 16 341 Inventory of materials and supplies 368 ‐ ‐ ‐ ‐ ‐ ‐ 368
Total current assets 11,582 22,494 24 13,072 21,371 8,237 4,088 80,868
Noncurrent Assets:Capital assets:Nondepreciable 247 1,582 ‐ ‐ ‐ ‐ ‐ 1,829 Depreciable, net 13,006 1,631 ‐ ‐ ‐ ‐ ‐ 14,637
Net OPEB asset ‐ ‐ ‐ ‐ ‐ ‐ 21,662 21,662
Total noncurrent assets 13,253 3,213 ‐ ‐ ‐ ‐ 21,662 38,128
Total assets 24,835 25,707 24 13,072 21,371 8,237 25,750 118,996
DEFERRED OUTFLOWS OF RESOURCES:
Deferred pension contribution 357 1,053 30 ‐ ‐ ‐ ‐ 1,440
Total deferred outflows of resources 357 1,053 30 ‐ ‐ ‐ ‐ 1,440
LIABILITIES:Current Liabilities:Accounts payable and accruals ‐ 644 ‐ (792) 155 ‐ ‐ 7Accrued salaries and benefits 64 196 3 2 ‐ ‐ ‐ 265 Accrued compensated absences 8 26 ‐ 4,902 ‐ ‐ ‐ 4,936 Accrued claims payable ‐ current ‐ ‐ ‐ 146 3,181 1,910 ‐ 5,237
Total current liabilities 72 866 3 4,258 3,336 1,910 ‐ 10,445
Noncurrent liabilities:Accrued compensated absences ‐ ‐ ‐ 6,286 ‐ ‐ ‐ 6,286 Accrued claims payable ‐ ‐ ‐ ‐ 15,115 3,027 ‐ 18,142 Net pension liabilities 2,807 9,565 303 ‐ ‐ ‐ ‐ 12,675
Total noncurrent liabilities 2,807 9,565 303 6,286 15,115 3,027 ‐ 37,103
Total liabilities 2,879 10,431 306 10,544 18,451 4,937 ‐ 47,548
DEFERRED INFLOWS OF RESOURCES:Pension Related 139 568 18 ‐ ‐ ‐ ‐ 725
Total deferred inflows of resources 139 568 18 ‐ ‐ ‐ ‐ 725
NET POSITION:Net Investment in capital assets 13,253 3,213 ‐ ‐ ‐ ‐ ‐ 16,466 Unrestricted 8,921 12,548 (270) 2,528 2,920 3,300 25,750 55,697
Total net position 22,174$ 15,761$ (270)$ 2,528$ 2,920$ 3,300$ 25,750$ 72,163$
CITY OF PALO ALTOInternal Service Funds
Combining Statement of Fund Net PositionJune 30, 2016
(Amounts in thousands)
130
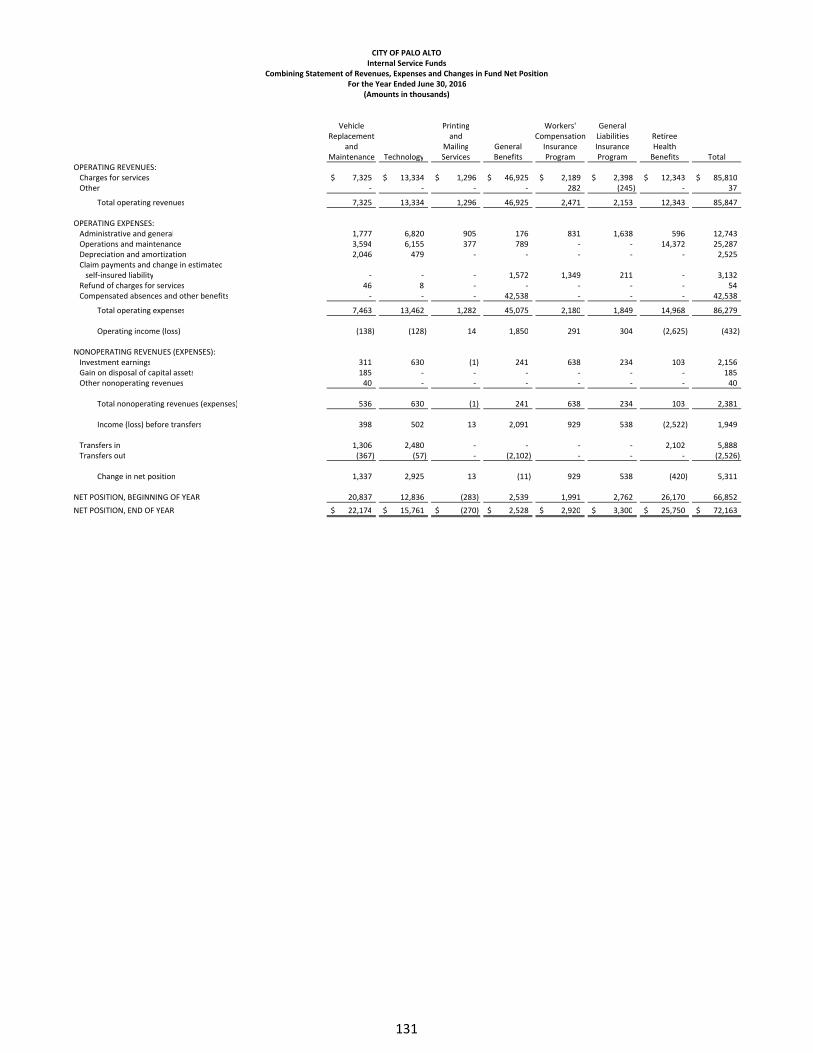
Vehicle Printing Workers' GeneralReplacement and Compensation Liabilities Retiree
and Mailing General Insurance Insurance HealthMaintenance Technology Services Benefits Program Program Benefits Total
OPERATING REVENUES:Charges for services 7,325$ 13,334$ 1,296$ 46,925$ 2,189$ 2,398$ 12,343$ 85,810$ Other ‐ ‐ ‐ ‐ 282 (245) ‐ 37
Total operating revenues 7,325 13,334 1,296 46,925 2,471 2,153 12,343 85,847
OPERATING EXPENSES:Administrative and general 1,777 6,820 905 176 831 1,638 596 12,743 Operations and maintenance 3,594 6,155 377 789 ‐ ‐ 14,372 25,287 Depreciation and amortization 2,046 479 ‐ ‐ ‐ ‐ ‐ 2,525 Claim payments and change in estimatedself‐insured liability ‐ ‐ ‐ 1,572 1,349 211 ‐ 3,132
Refund of charges for services 46 8 ‐ ‐ ‐ ‐ ‐ 54 Compensated absences and other benefits ‐ ‐ ‐ 42,538 ‐ ‐ ‐ 42,538
Total operating expenses 7,463 13,462 1,282 45,075 2,180 1,849 14,968 86,279
Operating income (loss) (138) (128) 14 1,850 291 304 (2,625) (432)
NONOPERATING REVENUES (EXPENSES):Investment earnings 311 630 (1) 241 638 234 103 2,156 Gain on disposal of capital assets 185 ‐ ‐ ‐ ‐ ‐ ‐ 185 Other nonoperating revenues 40 ‐ ‐ ‐ ‐ ‐ ‐ 40
Total nonoperating revenues (expenses) 536 630 (1) 241 638 234 103 2,381
Income (loss) before transfers 398 502 13 2,091 929 538 (2,522) 1,949
Transfers in 1,306 2,480 ‐ ‐ ‐ ‐ 2,102 5,888 Transfers out (367) (57) ‐ (2,102) ‐ ‐ ‐ (2,526)
Change in net position 1,337 2,925 13 (11) 929 538 (420) 5,311
NET POSITION, BEGINNING OF YEAR 20,837 12,836 (283) 2,539 1,991 2,762 26,170 66,852
NET POSITION, END OF YEAR 22,174$ 15,761$ (270)$ 2,528$ 2,920$ 3,300$ 25,750$ 72,163$
CITY OF PALO ALTOInternal Service Funds
Combining Statement of Revenues, Expenses and Changes in Fund Net PositionFor the Year Ended June 30, 2016
(Amounts in thousands)
131

Vehicle Printing Workers' General
Replacement and Compensation Liabilities Retiree
and Mailing General Insurance Insurance Health
Maintenance Technology Services Benefits Program Program Benefits Total
Cash flows from operating activities:
Cash received from customers 7,629$ 13,334$ 1,296$ 46,937$ 2,288$ 2,403$ 12,343$ 86,230$
Cash refunds to customers (46) (8) ‐ ‐ ‐ ‐ ‐ (54)
Cash payments to suppliers for goods and services (3,304) (7,049) (142) (2,328) ‐ ‐ (13,163) (25,986)
Cash payments to employees (2,132) (5,702) (1,150) (42,877) (758) (1,638) (596) (54,853)
Cash payments for judgments and claims ‐ ‐ ‐ (1,572) (1,904) (113) ‐ (3,589)
Other cash receipts 40 ‐ ‐ ‐ ‐ ‐ ‐ 40
Net cash flows provided by (used in)
operating activities 2,187 575 4 160 (374) 652 (1,416) 1,788
Cash flows from noncapital financing activities:
Transfers in 1,306 2,480 ‐ ‐ ‐ ‐ 2,102 5,888
Transfers out (367) (57) ‐ (2,102) ‐ ‐ ‐ (2,526)
Net cash flows provided by (used in)
noncapital financing activities 939 2,423 ‐ (2,102) ‐ ‐ 2,102 3,362
Cash flows from capital and related financing activities:
Acquisition of capital assets (2,709) (1,004) ‐ ‐ ‐ ‐ ‐ (3,713)
Proceeds from sale of capital assets 221 ‐ ‐ ‐ ‐ ‐ ‐ 221
Net cash flows (used in)
capital and related financing activities (2,488) (1,004) ‐ ‐ ‐ ‐ ‐ (3,492)
Cash flows from investing activities:
Interest received 313 624 (1) 229 630 229 109 2,133
Net cash flows provided by investing activities 313 624 (1) 229 630 229 109 2,133
Net change in cash and cash equivalents 951 2,618 3 (1,713) 256 881 795 3,791
Cash and cash equivalents, beginning of year 10,183 19,785 21 14,690 20,975 7,322 3,277 76,253
Cash and cash equivalents, end of year $ 11,134 $ 22,403 $ 24 $ 12,977 $ 21,231 $ 8,203 $ 4,072 $ 80,044
Reconciliation of operating income (loss) to net cash
flows provided by (used in) operating activities:
Operating income (loss) (138)$ (128)$ 14$ 1,850$ 291$ 304$ (2,625)$ (432)$
Adjustments to reconcile operating income (loss)
to net cash provided by (used in) operating activities:
Depreciation 2,046 479 ‐ ‐ ‐ ‐ ‐ 2,525
Other 40 ‐ ‐ ‐ ‐ ‐ ‐ 40
Change in assets and liabilities:
Accounts receivable 304 ‐ ‐ 12 99 250 ‐ 665
Inventory of materials and supplies 2 ‐ ‐ ‐ ‐ ‐ ‐ 2
Net OPEB asset ‐ ‐ ‐ ‐ ‐ ‐ 1,209 1,209
Deferred outflows of resources ‐ pension plans (77) (217) (4) ‐ ‐ ‐ ‐ (298)
Accounts payable and accruals ‐ 448 ‐ (2,155) 73 ‐ ‐ (1,634)
Accrued salaries and benefits 19 69 (2) (9) ‐ ‐ ‐ 77
Accrued compensated absences ‐ 5 (1) 462 ‐ ‐ ‐ 466
Accrued claims payable ‐ ‐ ‐ ‐ (837) 98 ‐ (739)
Net pension liability 288 859 27 ‐ ‐ ‐ ‐ 1,174
Deferred inflows of resources ‐ pension plans (297) (940) (30) ‐ ‐ ‐ ‐ (1,267)
Net cash flows provided by (used in) operating activities 2,187$ 575$ 4$ 160$ (374)$ 652$ (1,416)$ 1,788$
CITY OF PALO ALTO
Internal Service Funds
Combining Statement of Cash Flows
For the Year Ended June 30, 2016
(Amounts in thousands)
132

133
FIDUCIARY FUNDS
INTRODUCTION Fiduciary Funds are used to account for assets held by the City acting in a fiduciary capacity for other entities and individuals. The funds are operated to carry out the specific actions required by the trust agreements, ordinances and other governing regulations.
Fiduciary Funds are presented separately from the Citywide and Fund financial statements.
Agency Funds are custodial in nature and do not involve measurement of results of operations. The City maintains three agency funds, as follows:
California Avenue Parking Assessment District This fund accounts for receipts and disbursements associated with the 1993 Parking District No. 92‐13 Assessment Bonds.
Cable Joint Powers Authority The fund was established to account for the activities of the cable television system on behalf of the members.
University Avenue Area Off‐Street Parking Assessment District The fund accounts for the receipts and disbursements associated with the Series 2012 Limited Obligation Refunding Improvement Bonds.

CITY OF PALO ALTO
All Agency Funds
Statement of Changes in Assets and Liabilities
For the Year Ended June 30, 2016
Balance Balance
California Avenue Parking Assessment District June 30, 2015 Additions Deletions June 30, 2016
ASSETS:Cash and investments available for operations 175$ ‐$ 175$ ‐$
LIABILITIES:Due to bondholders 175$ ‐$ 175$ ‐$
Cable Joint Powers Authority
ASSETS:
Cash and investments available for operations 660$ ‐$ 9$ 651$
Accounts receivable 503 ‐ 8 495
Interest receivable 3 ‐ ‐ 3 Total assets 1,166$ ‐$ 17$ 1,149$
LIABILITIES:Due to other governments 1,166$ ‐$ 17$ 1,149$
ASSETS:
Cash and investments available for operations 2,192$ ‐$ 196$ 1,996$
Cash and investments with fiscal agents 2,543 7 ‐ 2,550
Accounts receivable 9 1 ‐ 10
Interest receivable 9 ‐ ‐ 9 Total assets 4,753$ 8$ 196$ 4,565$
LIABILITIES:Due to bondholders 4,753$ ‐$ 188$ 4,565$
Total Agency Funds
ASSETS:
Cash and investments available for operations 3,027$ ‐$ 380$ 2,647$
Cash and investments with fiscal agents 2,543 7 ‐ 2,550
Accounts receivable 512 1 8 505
Interest receivable 12 ‐ ‐ 12 Total assets 6,094$ 8$ 388$ 5,714$
LIABILITIES:
Due to bondholders 4,928$ ‐$ 363$ 4,565$
Due to other governments 1,166 ‐ 17 1,149 Total liabilities 6,094$ ‐$ 380$ 5,714$
(Amounts in thousands)
University Avenue Area
Off‐Street Parking Assessment District
134

135
STATISTICAL SECTION
The statistical section contains comprehensive statistical data, which relates to physical, economic, social and political characteristics of the City. It is intended to provide users with a broader and more complete understanding of the City and its financial affairs than is possible from the financial statements and supporting schedules included in the financial section.
In this section, readers will find comparative information related to the City’s revenue sources, expenditures, property tax valuations, levies and collections, general obligation bonded debt, utility revenue debt service, and demographics. Where available, the comparative information is presented for the last ten fiscal years.
In addition, this section presents information related to the City’s legal debt margin computation, principal taxpayers, notary and security bond coverages, and other miscellaneous statistics pertaining to services provided by the City.
In contrast to the financial section, the statistical section information is not usually subject to independent audit.
Financial Trends These schedules contain trend information to help the reader understand how the City’s financial performance and well‐being have changed over time: Net Position by Component Changes in Net Position Fund Balances of Governmental Funds Changes in Fund Balances of Governmental Funds
Revenue Capacity These schedules contain information to help the reader assess the City’s most significant local revenue sources, property tax and electric charges: Electric Operating Revenue by Source Supplemental Disclosure for Water Utilities Assessed Value of Taxable Property Property Tax Rates, All Overlapping Governments Property Tax Levies and Collections Principal Property Taxpayers Assessed Valuation and Parcels by Land Use Per Parcel Assessed Valuation of Single Family Residential
Debt Capacity These schedules present information to help the reader assess the affordability of the City’s current levels of outstanding debt and the City’s ability to issue additional debt in the future: Ratio of Outstanding Debt by Type Computation of Direct and Overlapping Debt Computation of Legal Bonded Debt Margin Revenue Bond Coverage

136
STATISTICAL SECTION Demographic and Economic Information These schedules offer demographic and economic indicators to help the reader understand the environment within which the City’s financial activities take place: Taxable Transactions by Type of Business Demographic and Economic Statistics Principal Employers
Operating Information These schedules contain service and infrastructure data to help the reader understand how the information in the City’s financial report relates to the services the City provides and the activities it performs: Operating Indicators by Function/Program Capital Asset Statistics by Function/Program Full‐Time Equivalent City Government Employees by Function
Sources Unless otherwise noted, the information in these schedules is derived from the Comprehensive Annual Financial Reports for the relevant year.

2007 2008 2009 2010 2011 2012 2013 2014 2015 2016
Governmental Activities
Investment in capital assets 326,411$ 343,537$ 356,657$ 369,499$ 364,747$ 370,111$ 378,047$ 386,696$ 405,921$ 425,179$
Restricted 32,576 27,428 36,632 34,323 16,437 52,934 71,717 68,331 55,963 47,907
Unrestricted 127,190 130,460 118,133 102,199 134,722 142,102 165,810 187,386 1,972 37,905
Total Governmental Activities Net Position 486,177$ 501,425$ 511,422$ 506,021$ 515,906$ 565,147$ 615,574$ 642,413$ 463,856$ 510,991$
Business‐type Activities
Investment in capital assets 342,922$ 370,303$ 384,313$ 399,317$ 416,418$ 437,151$ 446,597$ 473,795$ 490,874$ 512,918$
Restricted 1,732 1,732 1,732 4,300 ‐ ‐ 4,060 4,166 4,142 4,115
Unrestricted 230,912 226,539 208,025 232,420 253,740 262,602 269,926 266,794 172,802 162,806
Total Business‐type Activities Net Position 575,566$ 598,574$ 594,070$ 636,037$ 670,158$ 699,753$ 720,583$ 744,755$ 667,818$ 679,839$
Primary Government
Investment in capital assets 669,333$ 713,840$ 740,970$ 768,816$ 781,165$ 807,262$ 824,644$ 860,491$ 896,795$ 938,097$
Restricted 34,308 29,160 38,364 38,623 16,437 52,934 75,777 72,497 60,105 52,022
Unrestricted 358,102 356,999 326,158 334,619 388,462 404,704 435,736 454,180 174,774 200,711
Total Primary Government Net Position 1,061,743$ 1,099,999$ 1,105,492$ 1,142,058$ 1,186,064$ 1,264,900$ 1,336,157$ 1,387,168$ 1,131,674$ 1,190,830$
Source: Annual Financial Statements, Statement of Net Position
Fiscal Year Ended June 30
CITY OF PALO ALTO
Net Position by Component
Last Ten Fiscal Years
(Amounts in thousands)
(Accrual basis of accounting)
$0
$100,000
$200,000
$300,000
$400,000
$500,000
$600,000
$700,000
$800,000
$900,000
$1,000,000
2007 2008 2009 2010 2011 2012 2013 2014 2015 2016
$ Th
ousands
Primary Government
Investment in capital assets Restricted Unrestricted
137

PROGRAM REVENUES 2007 2008 2009 2010 2011 2012 2013 2014 2015 2016
Governmental ActivitiesCharges for services
City Attorney 13$ 16$ 12$ 53$ ‐$ ‐$ ‐$ ‐$ ‐$ ‐$
City Clerk ‐ ‐ ‐ ‐ ‐ ‐ ‐ ‐ ‐ ‐
City Auditor ‐ ‐ ‐ ‐ ‐ ‐ ‐ ‐ ‐ ‐
Administrative Services 835 870 726 984 2,889 1,647 15,629 4,055 5,460 9,444
Human Resources 11 ‐ ‐ ‐ ‐ ‐ ‐ ‐ ‐ ‐
Public Works 968 1,310 1,169 1,258 2,419 1,008 1,314 1,093 1,209 599
Planning & Community Environment 6,267 5,498 4,704 4,813 7,237 31,491 28,768 12,896 8,090 9,071
Development Services3
‐ ‐ ‐ ‐ ‐ ‐ ‐ ‐ 12,019 12,570
Public Safety 13,789 13,692 14,670 14,337 15,274 15,658 16,139 14,902 15,726 13,945
Community Services 9,128 10,314 8,522 8,729 7,724 11,365 13,808 20,882 20,912 21,551
Library 146 176 177 199 480 1,600 187 166 137 198
Operating grants and contributions 5,642 4,029 3,599 4,829 2,884 3,441 5,038 5,360 5,300 2,164
Capital grants and contributions 1,756 1,930 3,810 1,280 1,903 1,064 515 917 619 344
Total Governmental Activities
Program Revenues 38,555 37,835 37,389 36,482 40,810 67,274 81,398 60,271 69,472 69,886
Business‐type ActivitiesCharges for services
Water 23,495 26,510 27,120 26,259 26,624 31,467 37,746 40,291 35,847 37,588
Electric 102,549 103,833 119,320 121,900 122,109 118,886 121,805 121,916 120,842 120,743
Fiber Optics1
‐ ‐ 3,336 3,105 3,322 3,662 4,382 4,485 4,627 4,505
Gas 42,221 49,021 47,838 44,450 43,584 41,774 34,633 35,737 30,751 30,212
Wastewater Collection 14,848 15,102 14,486 15,136 15,094 14,942 16,077 15,599 16,182 16,496
Wastewater Treatment 16,957 22,889 28,425 16,915 18,830 22,200 21,528 18,460 24,120 23,825
Refuse 25,532 28,805 29,101 28,568 30,469 30,645 30,583 30,297 31,576 32,169
Storm Drainage 5,181 5,450 5,505 5,647 5,796 5,892 6,053 6,183 6,281 6,520
Airport ‐ ‐ ‐ ‐ ‐ ‐ ‐ ‐ 683 826
External Services 789 112 ‐ ‐ ‐ ‐ ‐ ‐ ‐ ‐
Operating grants and contributions ‐ ‐ ‐ 361 610 605 572 549 534 744
Capital grants and contributions 756 1,594 639 475 3,004 1,526 2,224 2,005 2,080 1,061
Total Business‐type Activities
Program Revenues 232,328 253,316 275,770 262,816 269,442 271,599 275,603 275,522 273,523 274,689
Total Primary Government
Program Revenues 270,883$ 291,151$ 313,159$ 299,298$ 310,252$ 338,873$ 357,001$ 335,793$ 342,995$ 344,575$
EXPENSES
Governmental ActivitiesCity Council 180$ 323$ 394$ 455$ 15$ 345$ 94$ 387$ 271$ 352$
City Manager 1,760 2,273 2,085 2,399 1,842 1,960 1,237 2,180 2,155 2,662
City Attorney 2,390 2,653 2,575 2,621 953 1,656 1,642 1,797 1,759 2,472
City Clerk 900 1,241 1,098 1,369 803 908 330 641 680 582
City Auditor 838 1,379 2,053 2,601 138 235 464 489 362 414
Administrative Services2
6,419 15,477 17,784 17,893 9,888 10,100 7,614 11,388 9,980 10,637
Human Resources 2,472 2,806 3,448 3,707 1,346 1,071 1,420 1,346 1,464 2,224
Public Works 16,645 18,565 21,270 18,658 19,357 14,568 20,816 24,577 21,075 24,613
Planning & Community Environment 12,929 16,388 12,940 12,114 15,031 12,074 13,549 14,926 8,423 10,208
Development Services3
‐ ‐ ‐ ‐ ‐ ‐ ‐ ‐ 10,449 11,158
Public Safety 43,391 50,126 52,487 55,799 58,996 62,817 59,452 62,883 58,660 56,653
Community Services 15,729 17,736 19,862 17,171 22,845 21,915 22,705 23,822 24,688 28,547
Library 5,347 6,321 6,244 6,143 6,920 7,323 7,319 7,758 7,721 10,825
Non‐departmental2
12,133 ‐ ‐ ‐ ‐ ‐ ‐ ‐ ‐ ‐
Interest on long term debt 477 438 404 370 2,742 2,575 2,562 3,367 3,658 3,552
Total Governmental
Activities Expenses 121,610 135,726 142,644 141,300 140,876 137,547 139,204 155,561 151,345 164,899
Business‐type ActivitiesWater 16,794 18,842 20,271 21,037 24,268 29,093 30,707 31,593 33,205 35,120
Electric 99,294 108,032 122,268 107,910 100,130 102,030 106,438 113,004 122,499 120,319
Fiber Optics1
‐ ‐ 1,284 1,407 1,561 1,489 1,437 1,661 1,891 2,107
Gas 30,690 37,211 34,603 32,498 32,051 28,878 26,749 26,869 23,525 20,879
Wastewater Collection 10,085 12,023 14,875 10,696 12,275 14,825 14,313 13,235 14,595 15,199
Wastewater Treatment 15,901 18,902 36,896 13,466 19,731 20,712 20,635 21,018 21,553 22,546
Refuse 25,372 28,827 37,217 28,119 30,684 31,900 28,542 28,413 27,974 30,370
Storm Drainage 2,517 3,202 2,943 2,491 3,229 3,103 3,703 3,644 3,721 3,735
Airport ‐ ‐ ‐ ‐ 31 153 246 466 1,004 970
External Services 767 984 ‐ ‐ ‐ ‐ ‐ ‐ ‐ ‐
Total Business‐type
Activities Expenses 201,420 228,023 270,357 217,624 223,960 232,183 232,770 239,903 249,967 251,245
Total Primary
Government Expenses 323,030$ 363,749$ 413,001$ 358,924$ 364,836$ 369,730$ 371,974$ 395,464$ 401,312$ 416,144$
CITY OF PALO ALTOChanges in Net PositionLast Ten Fiscal Years
(Accrual basis of accounting)(Amounts in thousands)
Fiscal Year Ended June 30
138

2007 2008 2009 2010 2011 2012 2013 2014 2015 2016
NET (EXPENSE)/REVENUE
Governmental Activities (83,055)$ (97,891)$ (105,255)$ (104,818)$ (100,066)$ (70,273)$ (57,806)$ (95,290)$ (81,873)$ (95,013)$
Business‐type Activities 30,908 25,293 5,413 45,192 45,482 39,416 42,833 35,619 23,556 23,444
Total Primary Government
Net (Expense)/Revenue (52,147)$ (72,598)$ (99,842)$ (59,626)$ (54,584)$ (30,857)$ (14,973)$ (59,671)$ (58,317)$ (71,569)$
GENERAL REVENUES AND OTHER CHANGES IN NET ASSETS
Governmental ActivitiesTaxes
Property tax 21,466$ 23,084$ 25,432$ 25,981$ 29,156$ 30,104$ 31,929$ 35,299$ 38,750$ 41,189$
Sales tax 22,194 22,623 20,089 17,991 20,746 22,132 25,606 29,424 29,675 30,018
Utility user tax 9,356 10,285 11,030 11,295 10,851 10,834 10,861 11,008 10,861 12,469
Transient occupancy tax 6,709 7,976 7,111 6,858 8,082 9,664 10,794 12,255 16,699 22,366
Other taxes 6,293 6,261 3,364 4,055 8,156 8,173 10,504 9,660 11,867 7,868
Investment earnings 8,747 12,313 8,525 6,514 3,500 6,238 (1,228) 5,859 5,010 8,639
Rents and miscellaneous 13,670 11,896 15,682 12,729 12,377 14,943 518 2,575 3,428 894
Transfers 15,754 18,701 24,020 13,994 17,083 17,426 19,249 17,103 16,405 18,705
Total Governmental Activities 104,189 113,139 115,253 99,417 109,951 119,514 108,233 123,183 132,695 142,148
Business‐type ActivitiesInvestment earnings 11,910 16,416 14,103 10,769 5,722 7,605 (2,754) 6,379 4,857 7,282
Transfers (15,754) (18,701) (24,020) (13,994) (17,083) (17,426) (19,249) (17,103) (16,405) (18,705)
Total Business‐type Activities (3,844) (2,285) (9,917) (3,225) (11,361) (9,821) (22,003) (10,724) (11,548) (11,423)
Total Primary Government 100,345$ 110,854$ 105,336$ 96,192$ 98,590$ 109,693$ 86,230$ 112,459$ 121,147$ 130,725$
CHANGE IN NET POSITIONGovernmental Activities 21,134$ 15,248$ 9,998$ (5,401)$ 9,885$ 49,241$ 50,427$ 27,893$ 50,822$ 47,135$
Business‐type Activities 27,064 23,008 (4,504) 41,967 34,121 29,595 20,830 24,895 12,008 12,021
Total Primary Government
Change in Net Position 48,198$ 38,256$ 5,494$ 36,566$ 44,006$ 78,836$ 71,257$ 52,788$ 62,830$ 59,156$
Notes:1Prior to 2009, Fiber Optics was included in Electric.2Beginning in 2008, includes Non‐departmental expenses.3The Development Services Department was formed in FY15.
Source: Annual Financial Statements, Statement of Activities
Fiscal Year Ended June 30
139

2007 2008 2009 2010 2011 2012 2013 2014 2015 2016
General Fund
Nonspendable 5,002$ 7,286$ 6,476$ 6,581$ 6,085$ 6,007$ 5,749$ 6,188$ 6,296$ 7,088$
Assigned 6,855 4,851 6,100 7,295 6,235 6,400 5,415 5,432 7,976 8,261
Unassigned 27,551 30,278 30,648 27,581 31,859 29,616 30,913 36,690 48,198 51,582
Total General Fund 39,408$ 42,415$ 43,224$ 41,457$ 44,179$ 42,023$ 42,077$ 48,310$ 62,470$ 66,931$
Source: Annual Financial Statements, Balance Sheet
Fiscal Year Ended June 30
CITY OF PALO ALTO
Fund Balances of Governmental Funds (General Fund)
Last Ten Fiscal Years
(Modified accrual basis of accounting)
(Amounts in thousands)
$0
$10,000
$20,000
$30,000
$40,000
$50,000
$60,000
$70,000
2007 2008 2009 2010 2011 2012 2013 2014 2015 2016
$ Thousands
Nonspendable Assigned Unassigned
140

2007 2008 2009 2010 2011 2012 2013 2014 2015 2016
All Other Governmental Funds
Nonspendable ‐$ 731$ 1,308$ 1,402$ 1,422$ 11,112$ 18,189$ 14,869$ 1,468$ 1,505$
Restricted 1,540 1,406 1,412 55,400 50,646 61,324 84,688 68,468 59,650 47,113
Committed 22,883 15,207 22,043 16,962 24,775 14,284 20,400 27,145 48,434 65,745
Assigned 41,684 44,116 36,629 38,538 20,114 33,264 45,514 55,211 52,627 64,411
Total All Other
Governmental Funds 66,107$ 61,460$ 61,392$ 112,302$ 96,957$ 119,984$ 168,791$ 165,693$ 162,179$ 178,774$
Source: Annual Financial Statements, Balance Sheet
Fiscal Year Ended June 30
CITY OF PALO ALTO
Fund Balances of Governmental Funds (All Other Governmental Funds)
Last Ten Fiscal Years
(Modified accrual basis of accounting)
(Amounts in thousands)
$0
$20,000
$40,000
$60,000
$80,000
$100,000
$120,000
$140,000
$160,000
$180,000
2007 2008 2009 2010 2011 2012 2013 2014 2015 2016
$ Thousands
Nonspendable Restricted Committed Assigned
141

2007 2008 2009 2010 2011 2012 2013 2014 2015 2016
Revenues
Property tax 21,466$ 23,084$ 25,432$ 25,981$ 29,248$ 30,216$ 32,040$ 35,393$ 38,836$ 41,289$
Sales tax 22,194 22,623 20,089 17,991 20,746 22,132 25,606 29,424 29,675 30,018
Other taxes and fines 26,215 27,385 24,843 25,063 27,890 29,231 32,141 35,305 41,576 44,909
Charges for services 19,929 19,610 19,837 19,775 22,311 46,273 38,976 23,962 25,973 23,910
From other agencies 3,448 4,300 5,984 3,035 1,614 1,116 4,109 5,700 7,727 4,417
Permits and licenses 4,711 4,761 4,033 4,408 5,433 7,136 8,218 8,990 9,179 11,228
Interest and rentals 17,750 20,507 19,183 19,045 16,553 18,583 12,136 18,445 18,658 22,269
Other revenue 7,503 4,713 6,223 4,724 8,624 12,739 17,570 7,471 12,837 13,827
Total Revenues 123,216 126,983 125,624 120,022 132,419 167,426 170,796 164,690 184,461 191,867
Expenditures
Administration1 14,399 16,250 16,002 17,353 8,351 9,412 8,291 9,961 10,806 11,501
Public Works 9,256 10,072 10,064 9,787 11,317 11,304 11,489 12,439 12,276 13,112
Planning and Community Environment 11,874 9,861 10,462 9,480 10,309 11,966 13,474 14,761 8,628 9,722
Development Services3 ‐ ‐ ‐ ‐ ‐ ‐ ‐ ‐ 11,152 10,643
Public Safety 42,451 48,650 48,957 51,022 58,874 62,418 59,537 62,028 61,447 63,784
Community Services2 16,533 17,138 17,451 16,451 20,029 20,860 21,661 22,644 23,553 25,511
Library2 5,260 6,219 5,985 5,900 6,509 7,072 6,902 7,340 7,980 7,960
Non‐departmental 12,122 14,089 10,765 10,149 7,352 6,819 4,567 8,135 6,180 8,068
Special revenue and capital projects 17,478 21,626 21,485 22,006 35,486 29,154 29,542 37,035 41,754 24,457
Debt service ‐ principal payments 850 885 800 840 870 1,743 1,489 1,524 1,948 7,130
Debt service ‐interest and fiscal fees 489 451 416 382 1,815 2,757 2,659 3,196 3,404 4,266
Payment to bond refunding escrow ‐ ‐ ‐ ‐ ‐ 586 540 ‐ ‐ ‐
Total Expenditures 130,712 145,241 142,387 143,370 160,912 164,091 160,151 179,063 189,128 186,154
Excess (Deficiency) of Revenues
Over (Under) Expenditures (7,496) (18,258) (16,763) (23,348) (28,493) 3,335 10,645 (14,373) (4,667) 5,713
Other Financing Sources (Uses)
Transfers in 27,701 33,437 39,903 34,835 30,323 47,200 50,343 41,683 45,137 61,835
Transfers out (15,882) (16,819) (22,399) (21,415) (14,352) (29,782) (33,833) (24,175) (29,824) (46,492)
Other ‐ ‐ ‐ ‐ (101) ‐ ‐ ‐ ‐ ‐
Proceeds from long term debt ‐ ‐ ‐ 59,071 ‐ 3,222 21,706 ‐ ‐ ‐
Payments to refund bond escrow ‐ ‐ ‐ ‐ ‐ (3,104) ‐ ‐ ‐ ‐
Total Other Financing Sources (Uses) 11,819 16,618 17,504 72,491 15,870 17,536 38,216 17,508 15,313 15,343
Net Change in Fund Balances 4,323$ (1,640)$ 741$ 49,143$ (12,623)$ 20,871$ 48,861$ 3,135$ 10,646$ 21,056$
Debt Service as a Percentage of
Non‐Capital Expenditures 1.2% 1.1% 1.0% 1.0% 2.2% 3.5% 3.2% 3.3% 3.7% 7.1%
Notes:
2Prior to 2005, Library was included in Community Services.3The Development Services Department was formed in FY15.
Source: Annual Financial Statements, Governmental Funds, Statement of Revenues, Expenditures and Changes in Fund Balances
1Comprised of the following departments: City Council, City Manager, City Attorney, City Clerk, City Auditor, Administrative Services and Human Resources.
Fiscal Year Ended June 30
CITY OF PALO ALTOChanges in Fund Balances of Governmental Funds
Last Ten Fiscal Years(Modified accrual basis of accounting)
(Amounts in thousands)
142

Fiscal Commercial & City of
Year Residential Industrial Palo Alto Total
2007 15,150$ 68,214$ 2,466$ 85,830$
2008 16,109 72,632 2,571 91,312
2009 17,939 83,710 2,823 104,472
2010 19,898 89,315 2,890 112,103
2011 19,848 88,076 2,991 110,915
2012 20,328 85,895 3,352 109,575
2013 19,951 86,998 3,265 110,214
2014 18,744 88,419 3,225 110,388
2015 17,404 88,257 3,234 108,895
2016 18,191 86,715 3,127 108,033
529 Bryant Street LLC Technology
City of Palo Alto Municipal
Communications & Power Industries (CPI) Research
Hewlett‐Packard Company Computer
Hewlett‐Packard Enterprise Computer
Space Systems/Loral Satellite & Satellite Systems
Stanford Hospital & Clinics Hospital
Varian Medical Systems, Inc. Manufacturing
Veterans Admin Hospital Hospital
VMware, Inc. Computer
Number Kilowatt‐hour
of Customers Sales (kWh) Revenue2
Residential 25,372 150,111,759 18,191$
Commercial 3,715 589,091,303 68,953
Industrial 91 168,141,493 17,762
CPA 126 29,812,407 3,127
Total 29,304 937,156,962 108,033$
City of Palo Alto Power Purchase Western Area Power Administration Hydroelectric 27%
Forward Market Purchases 29%
Wind Energy 11%
Landfill Gas Energy 10%
Solar Energy 9%
Northern California Power Agency Hydroelectric 11%
Short‐Term Market 3%
Source: City of Palo Alto, Utilities and Accounting Departments
Customer (alphabetical order) Type of Business
1The top ten customers accounted for approximately 37.5% of total kWh consumption (351,514,504 kWh)
and 33.7% of revenue ($38,108,715). The largest customer accounted for 8.7% of total kWh consumption
and 7.7% of revenue. The smallest customer accounted for 1.8% of total kWh consumption and 1.5% of
revenue. Revenue used to determine top ten electric customers includes metered and non‐metered
charges, adjustments, surcharges, and discounts. Revenue does not include Utility Users Tax (UUT) and
deposits.
2Revenue includes metered and non‐metered charges and revenue adjustments. Revenue does not
include California Energy Commission (CEC) surcharges, Utility Users Tax (UUT), Primary Voltage and Rate
Assistance (RAP) discounts and deposits. Parts of this schedule are provided as required by the Continuing
Disclosure Agreement for the City's Utility Revenue Bond and are not required by Governmental
Accounting Standards Board (GASB).
CITY OF PALO ALTO
Electric Operating Revenue by Source
Last Ten Fiscal Years
(Amounts in thousands)
Top Ten Electric Customers by Revenue1
143

The top ten customers total consumption is 747,045 CCF with revenue of $6,347,933.
This amount accounts for approximately 19.6% of total consumption and 17.2% of total
revenue. The largest customer (other than the City of Palo Alto) accounted for 4.5% of
consumption and 3.3% of revenue. The smallest customer accounted for 0.7% of
consumption and 0.7% of revenue. Revenue used to determine top ten water utility
customers includes metered and non‐metered charges, adjustments, surcharges
and discounts. Revenue does not include Utility Users Tax (UUT) and deposits.
Note:
Source: City of Palo Alto, Utilities Department
CITY OF PALO ALTO
Supplemental Disclosure for Water Utilities
Fiscal Year 2016
Top Ten Largest Water Utility Customers (alphabetical order)
City of Palo Alto
Hewlett‐Packard Company
VMware Inc.
This schedule is provided as required by the Continuing Disclosure Agreement for the City's Utility Revenue
Bond and is not required by Governmental Accounting Standards Board (GASB).
Palo Alto Hills Golf & Country Club
Palo Alto Unified School District
Oak Creek Apartments
Stanford Hospital & Clinics
Stanford West Management
Veterans Admin Hospital
Space Systems/Loral, Inc.
144
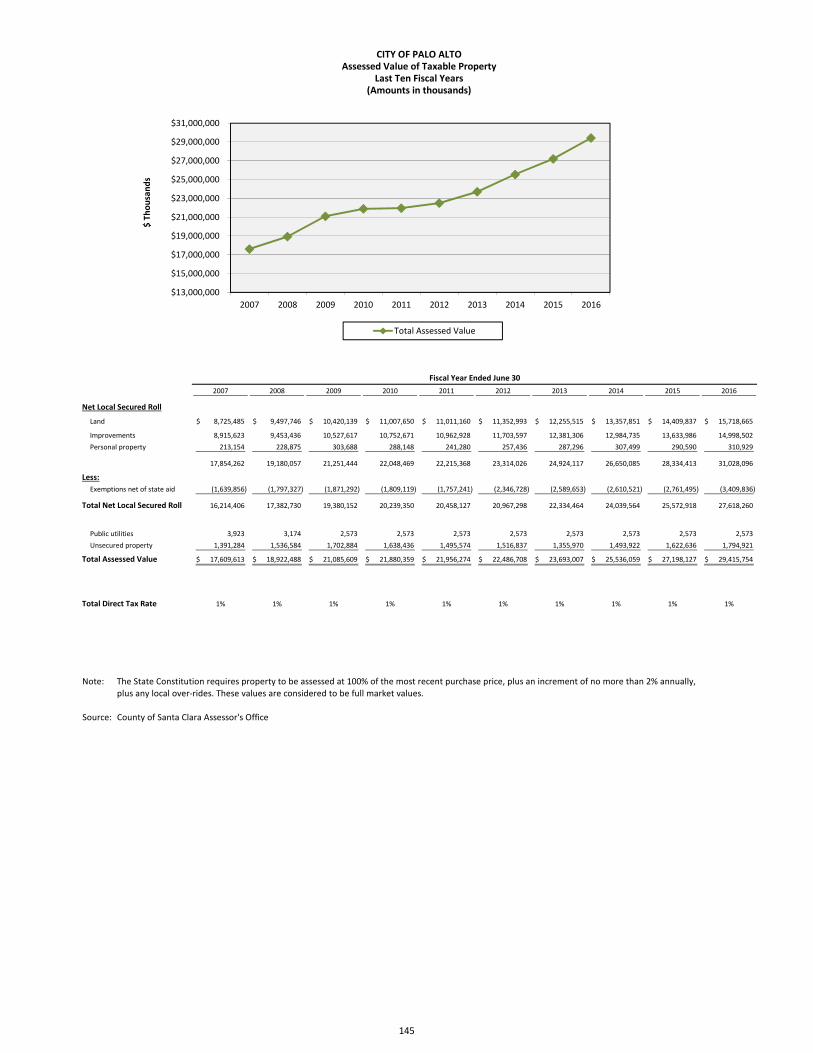
2007 2008 2009 2010 2011 2012 2013 2014 2015 2016
Net Local Secured Roll
Land 8,725,485$ 9,497,746$ 10,420,139$ 11,007,650$ 11,011,160$ 11,352,993$ 12,255,515$ 13,357,851$ 14,409,837$ 15,718,665$
Improvements 8,915,623 9,453,436 10,527,617 10,752,671 10,962,928 11,703,597 12,381,306 12,984,735 13,633,986 14,998,502
Personal property 213,154 228,875 303,688 288,148 241,280 257,436 287,296 307,499 290,590 310,929
17,854,262 19,180,057 21,251,444 22,048,469 22,215,368 23,314,026 24,924,117 26,650,085 28,334,413 31,028,096
Less:
Exemptions net of state aid (1,639,856) (1,797,327) (1,871,292) (1,809,119) (1,757,241) (2,346,728) (2,589,653) (2,610,521) (2,761,495) (3,409,836)
Total Net Local Secured Roll 16,214,406 17,382,730 19,380,152 20,239,350 20,458,127 20,967,298 22,334,464 24,039,564 25,572,918 27,618,260
Public utilities 3,923 3,174 2,573 2,573 2,573 2,573 2,573 2,573 2,573 2,573
Unsecured property 1,391,284 1,536,584 1,702,884 1,638,436 1,495,574 1,516,837 1,355,970 1,493,922 1,622,636 1,794,921
Total Assessed Value 17,609,613$ 18,922,488$ 21,085,609$ 21,880,359$ 21,956,274$ 22,486,708$ 23,693,007$ 25,536,059$ 27,198,127$ 29,415,754$
Total Direct Tax Rate 1% 1% 1% 1% 1% 1% 1% 1% 1% 1%
Note: The State Constitution requires property to be assessed at 100% of the most recent purchase price, plus an increment of no more than 2% annually, plus any local over‐rides. These values are considered to be full market values.
Source: County of Santa Clara Assessor's Office
CITY OF PALO ALTOAssessed Value of Taxable Property
Last Ten Fiscal Years(Amounts in thousands)
Fiscal Year Ended June 30
$13,000,000
$15,000,000
$17,000,000
$19,000,000
$21,000,000
$23,000,000
$25,000,000
$27,000,000
$29,000,000
$31,000,000
2007 2008 2009 2010 2011 2012 2013 2014 2015 2016
$ Th
ousands
Total Assessed Value
145

Basic County Total
County County Hospital City Library Santa Clara Direct and
Fiscal Wide Retirement G.O. Bond G.O. Bond Valley Water School Community Midpeninsula Overlapping
Year Levy Levy (Measure A)1
(Measure N)2
District District College Open Space3
Rates
2007 1.00 0.0388 ‐ ‐ 0.0072 0.0720 0.0346 1.15
2008 1.00 0.0388 ‐ ‐ 0.0071 0.0702 0.0113 1.13
2009 1.00 0.0388 ‐ ‐ 0.0061 0.0674 0.0123 1.12
2010 1.00 0.0388 0.0122 ‐ 0.0074 0.0686 0.0322 1.16
2011 1.00 0.0388 0.0095 0.0171 0.0072 0.0751 0.0326 1.18
2012 1.00 0.0388 0.0047 0.0155 0.0064 0.0742 0.0297 1.17
2013 1.00 0.0388 0.0051 0.0129 0.0069 0.0718 0.0287 1.16
2014 1.00 0.0388 0.0035 0.0177 0.0070 0.0655 0.0290 1.16
2015 1.00 0.0388 0.0091 0.0159 0.0065 0.0657 0.0276 1.16
2016 1.00 0.0388 0.0088 0.0148 0.0057 0.0604 0.0240 0.0008 1.15
Notes: 1The County General Obligation Bond (Measure A) was passed in 2008 to fund the seismic upgrade of the
Santa Clara Valley Medical Center. Rates were first levied for the 2009‐10 fiscal year.
2The City of Palo Alto General Obligation Bond (Measure N) was passed in 2008 to fund the construction and
renovation of three of the City's libraries. Rates were first levied for the 2010‐11 fiscal year.
3The Midpeninsula Regional Open Space District Bond Issue and Property Tax, Measure AA, passed in 2014.
Source: County of Santa Clara, Tax Rates and Information
CITY OF PALO ALTO
Property Tax Rates
All Overlapping Governments
Last Ten Fiscal Years
$1.10
$1.12
$1.14
$1.16
$1.18
$1.20
2007 2008 2009 2010 2011 2012 2013 2014 2015 2016
Rate per $100 of Assessed Value
146

Fiscal Year Total Tax Percentage Collections in Percentage of
Ended June 30 Levy1 for FY Amount of Levy Subsequent Years
2Amount Levy
2007 21,466 21,466 100% ‐ 21,466 100%
2008 23,084 23,084 100% ‐ 23,084 100%
2009 25,432 25,432 100% ‐ 25,432 100%
2010 25,981 25,981 100% ‐ 25,981 100%
2011 25,688 25,688 100% ‐ 25,688 100%
2012 26,494 26,494 100% ‐ 26,494 100%
2013 28,742 28,742 100% ‐ 28,742 100%
2014 30,587 30,587 100% ‐ 30,587 100%
2015 34,117 34,117 100% ‐ 34,117 100%
2016 36,607 36,607 100% ‐ 36,607 100%
Notes:
Source: Annual Financial Statements, Government Funds, Statement of Revenues, Expenditures and
Changes in Fund Balances.
1During fiscal year 1995, the County of Santa Clara began providing the City 100% of its tax levy
under an agreement which allows the county to keep all interest and delinquency charges
collected.2Effective fiscal year 1994, the City is on the Teeter Plan, under which the County of Santa Clara
pays the full tax levy due. All prior delinquent taxes were also received in that fiscal year.
CITY OF PALO ALTO
Property Tax Levies and Collections
Last Ten Fiscal Years
(Amounts in thousands)
Collected within the
Fiscal Year of the Levy Total Collections to Date
147

Taxable Assessed
Value Rank
Percentage of
Total Taxable
Assessed Value
Taxable
Assessed
Value Rank
Percentage of
Total Taxable
Assessed Value
Leland Stanford Jr. University 3,952,158$ 1 13.4% 2,632,853$ 1 15.0%
Loral Space & Communications 215,180 2 0.7% 180,779 2 1.0%
Google Inc. 158,245 3 0.5%
PPF OFF 3301 Hillview Avenue LP 130,150 4 0.4%
EOSII Palo Alto Technology Center LLC 121,692 5 0.4%
Whisman Ventures, LLC 112,001 6 0.4%
SI 43 LLC 76,823 7 0.3%
BVK Hamilton Ave LLC 69,290 8 0.2%
Ronald & Ann Williams Charitable Foundation 62,685 9 0.2%
PPC Forest Towers LLC 56,610 10 0.2%
Agilent Technologies 81,285 3 0.5%
Harbor Investment Partners 52,165 4 0.3%
EOP‐Embarcadero Place, LLC 40,000 5 0.2%
Hamilton Associates 38,843 6 0.2%
California Pacific Commercial Corp. 37,339 7 0.2%
Palo Alto Town & Country Village Inc. 36,306 8 0.2%
Pacific Hotel Dev Venture LP 32,796 9 0.2%
Thoits Bros Inc. 29,751 10 0.2%
Total 4,954,834$ 16.7% 3,162,117$ 18.0%
Total City Taxable Assessed Value:
FY 2016 29,415,754$
FY 2007 17,609,613$
Source: California Municipal Statistics, Inc.
Fiscal Year 2016 Fiscal Year 2007
Taxpayer
CITY OF PALO ALTO
Principal Property Taxpayers
Current Year and Nine Years Ago
(Amounts in thousands)
148

2015‐16 No. of
Assessed % of No. of % of Taxable % of
Valuation1
Total Parcels Total Parcels Total
Non‐Residential:
Agricultural/forest 32,729,878$ 0.12 % 49 0.24 % 31 0.16 %
Commercial 1,532,265,585 5.55 454 2.20 450 2.34
Professional/office 3,344,356,151 12.11 536 2.60 519 2.70
Industrial/research & development 1,863,968,386 6.75 179 0.87 175 0.91
Recreational 34,692,318 0.13 14 0.07 12 0.06
Government/social/institutional 149,945,877 0.54 115 0.56 46 0.24
Miscellaneous 7,121,330 0.03 18 0.09 17 0.09
Subtotal Non‐Residential 6,965,079,525$ 25.22 % 1,365 6.62 % 1,250 6.50 %
Residential:
Single family residence 16,457,914,524$ 59.59 % 14,968 72.57 % 14,922 77.55 %
Condominium/townhouse 2,117,116,117 7.67 3,033 14.71 2,027 10.53
Mobile Home 71,060 0.00 7 0.03 7 0.04
2‐4 Residential units 423,208,249 1.53 506 2.45 506 2.63
5+ Residential units 1,434,539,561 5.19 336 1.63 321 1.67
Subtotal Residential 20,432,849,511$ 73.98 % 18,850 91.39 % 17,783 92.41 %
Vacant Parcels 220,331,113$ 0.80 % 410 1.99 % 210 1.09 %
Total 27,618,260,149$ 100 % 20,625 100 % 19,243 100 %
Notes: This schedule is provided as required by the Continuing Disclosure Agreement for the City's General Obligation2010 and 2013A Bonds and is not required by Governmental Accounting Standards Board (GASB). Therefore,ten years of comparison data is not presented.
1Local secured assessed valuation, excluding tax‐exempt property.
Source: California Municipal Statistics, Inc.
CITY OF PALO ALTO
Assessed Valuation and Parcels by Land UseAs of June 30, 2016
149

No. of
Taxable Average
Parcels1 Assessed Valuation
Single Family Residential 14,922 $1,102,930
No. of % of Cumulative % of Cumulative
Taxable Total % of Total Total Total % of Total
Parcels1
Parcels Parcels Valuation Valuation Valuation
1,334 8.94 8.94 105,594,792$ 0.64 0.64
1,802 12.08 21.02 249,254,241 1.51 2.16
854 5.72 26.74 212,390,602 1.29 3.45
738 4.95 31.68 256,832,299 1.56 5.01
673 4.51 36.19 303,279,249 1.84 6.85
745 4.99 41.19 409,892,140 2.49 9.34
660 4.42 45.61 427,407,181 2.60 11.94
583 3.91 49.52 435,859,453 2.65 14.59
597 4.00 53.52 509,043,262 3.09 17.68
640 4.29 57.81 607,105,607 3.69 21.37
605 4.05 61.86 635,783,858 3.86 25.23
507 3.40 65.26 582,031,906 3.54 28.77
465 3.12 68.38 582,887,097 3.54 32.31
438 2.94 71.31 590,918,861 3.59 35.90
444 2.98 74.29 642,860,649 3.91 39.81
395 2.65 76.93 612,251,107 3.72 43.53
364 2.44 79.37 599,972,971 3.65 47.17
327 2.19 81.56 572,303,695 3.48 50.65
301 2.02 83.58 556,091,276 3.38 54.03
241 1.62 85.20 470,501,131 2.86 56.89 2,209 14.80 100.00 7,095,653,147 43.11 100.00
14,922 100.00 16,457,914,524$ 100.00
Notes:
Source: California Municipal Statistics, Inc.
This schedule is provided as required by the Continuing Disclosure Agreement for the City's General
Obligation 2010 and 2013A Bonds and is not required by Governmental Accounting Standards Board
(GASB). Therefore, ten years of comparison data is not presented.
1Improved single family residential parcels. Excludes condominiums and parcels with multiple family
units.
$1,900,000‐1,999,999$2,000,000 and greater
Total
$1,800,000‐1,899,999
$700,000‐799,999
$800,000‐899,999
$900,000‐999,999
$1,000,000‐1,099,999
$1,100,000‐1,199,999
$1,200,000‐1,299,999
$1,300,000‐1,399,999
$1,400,000‐1,499,999
$1,500,000‐1,599,999
$1,600,000‐1,699,999
$1,700,000‐1,799,999
$600,000‐699,999
$16,457,914,524 $815,747
2015‐2016
Assessed Valuation
$0‐99,999
$100,000‐199,999
$200,000‐299,999
$300,000‐399,999
$400,000‐499,999
$500,000‐599,999
Assessed Valuation Assessed Valuation
CITY OF PALO ALTO
Per Parcel Assessed Valuation of Single Family Residential
As of June 30, 2016
2015‐2016 Median
150

2007 2008 2009 2010 2011 2012 2013 2014 2015 2016
9,175$ 8,405$ 7,605$ 6,765$ 5,895$ 1,685$ 1,560$ 1,430$ 1,285$ 1,135$
‐ ‐ ‐ 55,305 55,305 54,540 74,235 73,215 71,795 65,210
115 ‐ ‐ ‐ ‐ ‐ ‐ ‐ ‐ ‐
2011 Lease‐Purchase Agreement ‐ ‐ ‐ ‐ ‐ 2,764 2,400 2,026 1,643 1,248
Add: unamortized premium ‐ ‐ ‐ 3,766 3,640 3,514 4,400 4,242 4,084 3,926
‐ ‐ ‐ (571) ‐ ‐ ‐ ‐ ‐ ‐
9,290 8,405 7,605 65,265 64,840 62,503 82,595 80,913 78,807 71,519
41,859 40,334 38,744 72,104 69,551 65,879 63,104 60,224 57,224 54,095
Energy Tax Credits ‐ 1,400 1,300 1,200 1,100 1,000 900 800 700 600
State Water Resources Loan ‐ 5,629 9,000 13,080 16,696 15,900 15,109 14,309 13,500 12,681
(972) (1,053) (2,479) (2,737) (229) 580 543 867 803 737
40,887 46,310 46,565 83,647 87,118 83,359 79,656 76,200 72,227 68,113
Outstanding Debt 50,177$ 54,715$ 54,170$ 148,912$ 151,958$ 145,862$ 162,251$ 157,113$ 151,034$ 139,632$
1.51% 1.53% 1.50% 4.48% 4.10% 3.61% 3.80% 3.39% 3.09% 2.67%
Population 62,615 63,367 64,484 65,408 64,417 65,544 66,368 66,861 66,029 66,968
0.80$ 0.86$ 0.84$ 2.28$ 2.36$ 2.23$ 2.44$ 2.35$ 2.29$ 2.09$
Notes:
Sources:
2016 Official City Data Set (population)
California Department of Transportation Long‐Term Socio‐Economic Forecasts (personal income)
Annual Financial Statements, Note 7 General Long‐Term Obligations and Note 8 Special Assessment Debt
Debt Per Capita
1See the schedule of Demographic and Economic Statistics for personal income data. Per capita personal income is only available for Santa Clara
County, therefore personal income is the product of the countywide per capita amount and the City's population.
County of Santa Clara (assessed valuation)
Percentage of Personal Income1
Certificates of Participation
General Obligation Bonds
Special Assessment Debt
Less: unamortized discount/
issuance costs
Total Governmental Activities
Business‐type Activities
Utility Revenue Bonds
Less: unamortized discount/
issuance costs
Total Business‐type Activities
Total Primary Government
Governmental Activities
CITY OF PALO ALTORatio of Outstanding Debt by Type
Last Ten Fiscal Years(Amounts in thousands)
Fiscal Year Ended June 30
$0
$20,000
$40,000
$60,000
$80,000
$100,000
$120,000
$140,000
$160,000
$180,000
2007 2008 2009 2010 2011 2012 2013 2014 2015 2016
$ Thousands
Total Governmental Activities Total Business‐type Activities
151

2015‐2016 Assessed Valuation 29,415,753,627$
Percentage Amount
Applicable Applicable
Total Debt to City of to City of
Outstanding Palo Alto1 Palo Alto
Santa Clara County 792,585,000$ 7.58% 60,085,869$
Foothill‐DeAnza Community College District 584,782,455 22.09% 129,155,053
Palo Alto Unified School District 306,673,766 87.20% 267,431,791
Fremont Union High School District 365,975,088 0.01% 40,257
Los Gatos‐Saratoga Joint Union High School District 70,320,000 0.01% 9,142
Mountain View‐Los Altos Union High School District 59,156,005 1.12% 661,956
Cupertino Union School District 292,848,688 0.02% 55,641
Los Altos School District 73,555,000 1.33% 976,810
Mountain View‐Whisman School District 189,475,000 0.92% 1,748,854
Saratoga Union School District 33,775,241 0.03% 9,457
Whisman School District 19,357,334 2.50% 483,933
City of Palo Alto 70,345,000 100% 70,345,000 El Camino Hospital District 136,280,000 0.09% 118,564Midpeninsula Regional Open Space District 45,000,000 13.05% 5,870,250City of Palo Alto Special Assessment Bonds 25,130,000 100% 25,130,000 Santa Clara Valley Water District Benefit Assessment District 99,060,000 7.58% 7,509,739
Total Direct and Overlapping Tax and Assessment Debt 569,632,316
683,441,121 7.58% 51,811,671
367,118,349 7.58% 27,831,242
6,380,000 7.58% 483,668
9,723,341 22.09% 2,147,497
6,260,000 0.01% 814
2,415,000 1.12% 27,024
4,600,000 0.03% 1,288
City of Palo Alto General Fund Obligations 2,383,453 100% 2,383,453
2,890,000 7.58% 219,091 Midpeninsula Regional Open Space Park District General Fund Obligations 122,305,886 13.05% 15,954,803
$ 100,860,551
27,766,974
$ 73,093,577
$ 642,725,893
Ratio to
Assessed Valuation
Total Direct Debt 0.25% 72,728,453$
Total Overlapping Debt 1.94% 569,997,440
Total Direct and Overlapping Debt 2.18% 642,725,893$ 2
Notes:
1Percentage of overlapping agency's assessed valuation located within boundaries of the city.2Excludes tax and revenue anticipation notes, enterprise revenue, mortgage revenue and tax allocation bonds and non‐bonded capital lease obligations.
Source: California Municipal Statistics, Inc.
Santa Clara County Pension Obligations
Santa Clara County Board of Education Certificates of Participation
Foothill‐DeAnza Community College District Certificates of Participation
Los Gatos‐Saratoga Joint Union High School District Certificates of Participation
Santa Clara County General Fund Obligations
CITY OF PALO ALTO
Computation of Direct and Overlapping Debt
As of June 30, 2016
Direct and Overlapping Tax and Assessment Debt
Direct and Overlapping General Fund Debt
Mountain View‐Los Altos Union High School District Certificates of Participation
Saratoga Union High School District Certificates of Participation
Less: Santa Clara County supported obligations
Total Net Direct and Overlapping General Fund Debt
Overlapping debt is the financial obligations of one political jurisdiction that also falls partly on a nearby jurisdiction. The amount of debt of each
unit applicable to the reporting unit is arrived at by 1) determining what percentage of the total assessed value of the overlapping jurisdiction
lies within the limits of the reporting unit, and 2) applying this percentage to the total debt of the overlapping jurisdiction.
Santa Clara County Vector Control District Certificates of Participation
Total Gross Direct and Overlapping General Fund Debt
Total Combined Debt
152

Assessed Valuation:Secured property assessed value,net of exempt real property 29,415,754$
Bonded Debt Limit (3.75% of Assessed Value) 1
1,103,091
Direct Debt:Certificates of Participation 1,135Lease Purchase Agreement 1,248General Obligation bonds 65,210
Total Direct Debt 67,593
Less: Amount of Debt Not Subject to Limit 2 2,383
Total Net Debt Applicable to Limit 65,210
Legal Bonded Debt Margin 1,037,881$
Total Bonded Total Net Debt Legal Total Net Debt Ratio of Net GeneralFiscal Assessed Debt Limit Applicable to Bonded Debt Applicable to the Debt to Bonded DebtYear Value (AV) (3.75% of AV) Limit Margin Population Debt as a % Assessed Value Per Capita
2007 17,609,613 660,360 ‐ 660,360 62,615 0.00% ‐ 0.002008 18,922,488 709,593 ‐ 709,593 63,367 0.00% ‐ 0.002009 21,085,609 790,710 ‐ 790,710 64,484 0.00% ‐ 0.002010 21,880,359 820,513 55,305 765,208 65,408 6.74% 0.0025 0.852011 21,956,274 823,360 55,305 768,055 64,417 6.72% 0.0025 0.862012 22,486,708 843,252 54,540 788,712 65,544 6.47% 0.0024 0.832013 23,693,007 888,488 74,235 814,253 66,368 8.36% 0.0031 1.122014 25,536,058 957,602 73,215 884,387 66,861 7.65% 0.0029 1.102015 27,198,127 1,019,930 71,795 948,135 66,029 7.04% 0.0026 1.092016 29,415,754 1,103,091 65,210 1,037,881 66,968 5.91% 0.0022 0.97
Notes:
Source:
CITY OF PALO ALTOComputation of Legal Bonded Debt Margin
As of June 30, 2016(Amounts in thousands)
1California Government Code, Section 43605 sets the debt limit at 15% of the assessed value of all real and personal property of the City. Because this
Code section was enacted when assessed value was 25% of market value, the limit is calculated at one‐fourth, or 3.75%. This legal debt margin applies
to General Obligation debt. Prior year limits have been adjusted to conform to the current year methodology.
2In accordance with California Government Code Section 43605, only the City's General Obligation bonds are subject to the legal debt limit of 15%.
Annual Financial Statements, Assessed Value of Taxable Property and Note 7 General Long‐Term Obligations
153
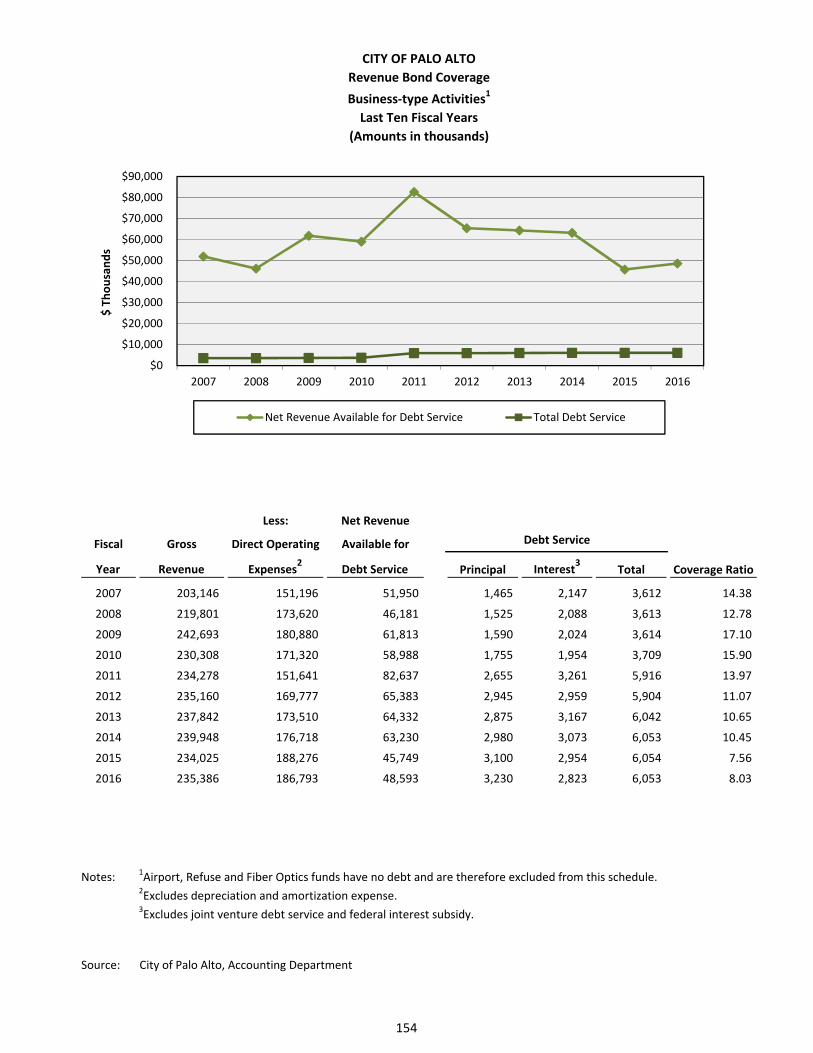
Less: Net Revenue
Fiscal Gross Direct Operating Available for
Year Revenue Expenses2
Debt Service Principal Interest3
Total Coverage Ratio
2007 203,146 151,196 51,950 1,465 2,147 3,612 14.38
2008 219,801 173,620 46,181 1,525 2,088 3,613 12.78
2009 242,693 180,880 61,813 1,590 2,024 3,614 17.10
2010 230,308 171,320 58,988 1,755 1,954 3,709 15.90
2011 234,278 151,641 82,637 2,655 3,261 5,916 13.97
2012 235,160 169,777 65,383 2,945 2,959 5,904 11.07
2013 237,842 173,510 64,332 2,875 3,167 6,042 10.65
2014 239,948 176,718 63,230 2,980 3,073 6,053 10.45
2015 234,025 188,276 45,749 3,100 2,954 6,054 7.56
2016 235,386 186,793 48,593 3,230 2,823 6,053 8.03
Notes:1Airport, Refuse and Fiber Optics funds have no debt and are therefore excluded from this schedule.
2Excludes depreciation and amortization expense.
3Excludes joint venture debt service and federal interest subsidy.
Source: City of Palo Alto, Accounting Department
Debt Service
CITY OF PALO ALTO
Revenue Bond Coverage
Business‐type Activities1
Last Ten Fiscal Years
(Amounts in thousands)
$0
$10,000
$20,000
$30,000
$40,000
$50,000
$60,000
$70,000
$80,000
$90,000
2007 2008 2009 2010 2011 2012 2013 2014 2015 2016
$ Thousands
Net Revenue Available for Debt Service Total Debt Service
154

Fiscal
Year
2007 2,751 2,486 1,109 1,485 374 602 203 5,075 7,139 21,224
2008 2,685 2,566 1,685 1,497 349 622 405 4,682 6,797 21,288
2009 2,251 2,443 1,431 1,258 315 493 214 4,284 6,635 19,324
2010 2,215 2,418 1,402 1,254 343 549 219 4,458 5,556 18,414
2011 2,374 2,621 1,564 1,292 381 630 242 4,873 6,322 20,299
2012 2,445 2,937 1,590 1,492 387 722 257 5,049 7,034 21,913
2013 2,478 3,160 1,465 1,656 424 765 259 4,056 13,729 27,992
2014 2,097 3,541 1,555 2,041 392 772 444 4,845 9,890 25,577
2015 2,398 3,894 1,672 1,708 435 699 265 3,674 11,253 25,998
2016 2,250 4,134 1,410 1,694 448 582 257 4,949 12,423 28,147
Source: California State Board of Equalization, compiled by MuniServices LLC
Sales Tax Rates for the Fiscal Year ended June 30, 2016
State Rate: 7.50%
Special District Tax Rates:
Santa Clara County Transit District (SCCT) 0.50%
Santa Clara County Valley Transportation Authority (SCVT) 0.50%
Santa Clara VTA BART Operating and Maintenance Transactions and Use Tax (SVTB) 0.125%
Santa Clara Retail Transactions and Use Tax (SCCR) 0.125%
Total Sales and Use Tax Rate: 8.750%
Source: California State Board of Equalization
Food
Markets
Service
Stations
Drug
Stores Other Retail All Other
Apparel
Stores
CITY OF PALO ALTO
Taxable Transactions by Type of Business
Last Ten Fiscal Years
(Amounts in thousands)
Total
ECONOMIC SEGMENT
Department
Stores Restaurants
Furniture/
Appliance
Department Stores8%
Restaurants15%
Furniture/ Appliance5%
Apparel Stores6%
Food Markets2%
Service Stations2%Drug Stores
1%
Other Retail17%
All Other44%
Fiscal Year 2016
155

Santa Clara Santa Clara
City of Palo Alto City of Palo Alto Santa Clara City Population County Total County Per Capita
Fiscal City of Palo Alto Unemployment School County as a Percentage of Personal Income Personal IncomeYear Population Rate Enrollment Population County Population (in thousands) (in thousands)
2007 62,615 2.6% 11,056 1,808,056 3.46% 95,200,000 * 52,653 *
2008 63,367 3.5% 11,329 1,837,075 3.45% 102,300,000 * 55,686 *
2009 64,484 6.5% 11,329 1,857,621 3.47% 101,800,000 * 54,801 *
2010 65,408 6.2% 11,565 1,880,876 3.48% 95,000,000 * 50,508 *
2011 64,417 5.3% 12,024 1,781,427 3.62% 101,700,000 * 57,089 *
2012 65,544 4.7% 12,286 1,816,486 3.61% 112,800,000 * 62,098 *
2013 66,368 3.6% 12,396 1,842,254 3.60% 124,800,000 * 67,743 *
2014 66,861 2.8% 12,483 1,868,558 3.58% 130,600,000 * 69,893 *
2015 66,029 2.7% 12,532 1,889,638 3.49% 139,800,000 * 73,982 *
2016 66,968 2.9% 12,488 1,927,888 3.47% 150,600,000 * 78,117 *
Note: Data on personal income and per capita personal income is only available for Santa Clara County.
Source: Beginning in 2015 population is sourced from the US Census Bureau Community Survey (via the City of Palo Alto's Official City Data Set).
State Employment Development Office (unemployment rate)
Palo Alto Unified School District (school enrollment)
* California Department of Transportation Long‐Term Socio‐Economic Forecasts (personal income). Forecasts from prior years are updated annually.
CITY OF PALO ALTO
Demographic and Economic Statistics
Last Ten Fiscal Years
60,000
61,000
62,000
63,000
64,000
65,000
66,000
67,000
68,000City Population
10,000
10,500
11,000
11,500
12,000
12,500
13,000School Enrollment
0.0%
1.0%
2.0%
3.0%
4.0%
5.0%
6.0%
7.0%City Unemployment Rate
156

Number of
Employees Rank
Percentage of Total
City Employment
Number of
Employees Rank
Percentage of Total
City Employment
Stanford University3
11,500 1 9.0% 9,821 1 7.0%
Stanford Health Care3
5,000 2 3.9% 5,025 2 3.6%
Lucile Packard Children's Hospital3
4,700 3 3.7% 3,326 4 2.4%
Veteran's Affairs Palo Alto Health Care System 3,900 4 3.0% 3,500 3 2.5%
VMware Inc. 3,500 5 2.7%
SAP 3,500 6 2.7%
Space Systems/Loral 2,800 7 2.2% 1,700 7 1.2%
Hewlett‐Packard Company 2,500 8 1.9% 2,001 5 1.4%
Palo Alto Medical Foundation 2,200 9 1.7% 2,000 6 1.4%
Varian Medical Systems 1,400 10 1.1%
Wilson Sonsini Goodrich & Rosati 1,500 8 1.1%
Palo Alto Unified School District 1,304 9 0.9%
City of Palo Alto 1,074 10 0.8%
Total 41,000 31.9% 31,251 22.3%
Estimated Total City Day Population:
FY 2016 128,282
FY 2008 140,000
Notes:
Source:
1Comparable data was not available until FY 2008.
2016 Official City Data Set (total City day population); AtoZ databases; Stanford website.
CITY OF PALO ALTO
Principal Employers
Current Year and Eight Years Ago
FY 20162
FY 20081
Employer
2Available data sources are limited and may be unreliable. The City does not affirm the validity of this data. 2016 numbers are
rounded.3Includes employees not located within City limits.
157

2006 2007 2008 2009
Governmental activities
Community Services
Number of theater performances 183 171 166 159
Total hours of athletic field usage265,791 70,769 63,212 45,762
Number of rounds of golf 76,000 76,241 74,630 72,170
Enrollment in recreation classes (includes summer camps) 14,768 14,460 13,851 13,091
Planning and Community Environment
Planning applications completed 408 299 257 273
Building permits issued 3,081 3,136 3,046 2,543
Caltrain average weekday boarding33,876 4,132 4,589 4,407
Police
Calls for service 56,211 60,079 58,742 53,275
Total arrests 2,530 3,059 3,253 2,612
Parking citations issued 56,502 57,222 50,706 49,996
Animal Services
Number of service calls 2,861 2,990 3,059 2,873
Number of animals handled 3,839 3,578 3,532 3,422
Fire
Calls for service 6,897 7,236 7,723 7,549
Number of fire incidents 211 221 192 239
Number of fire inspections 899 1,021 1,277 1,028
Library
Total number of cardholders 55,909 53,099 53,740 54,878
Total number of items in collection 260,468 270,755 279,403 293,735
Total checkouts 1,280,547 1,414,509 1,542,116 1,633,955
Public Works
Street resurfacing (lane miles) 20 32 27 23
Number of potholes repaired 1,049 1,188 1,977 3,727
Sq. ft. of sidewalk replaced or permanently repaired 126,574 94,620 83,827 56,909
Number of trees planted 263 164 188 250
Total tons of waste landfilled 59,276 59,938 61,866 68,228
Tons of materials recycled or composted 56,013 56,837 52,196 49,911
Business‐type activities
Electric
Number of customer accounts 28,653 28,684 29,024 28,527
Residential MWH consumed 161,202 162,405 162,680 159,899
Gas
Number of customer accounts 23,353 23,357 23,502 23,090
Residential therms consumed 11,745,883 11,759,842 11,969,151 11,003,088
Water
Number of customer accounts 19,645 19,726 19,942 19,422
Residential water consumption (CCF) 2,647,758 2,807,477 2,746,980 2,566,962
Wastewater collection
Number of customer accounts 21,784 21,789 21,970 21,210
Millions of gallons processed 8,972 8,853 8,510 7,958
Notes:2According to the department, this measure was not accurately tracked during FY13 or FY14.
Source:
FUNCTIONS/PROGRAMS
CITY OF PALO ALTO
Operating Indicators by Function/Program
Last Ten Fiscal Years1
City of Palo Alto Performance Report (formerly the Service Efforts and Accomplishments Report); 2015 Official City Data Set
(Caltrain)
3Prior‐year data has been updated based on annual counts revised by Caltrain. Beginning 2015, data source is Official City Data
Set.
1Ten most recent years available.
Fiscal Year Ended June 30
158

2010 2011 2012 2013 2014 2015
174 175 175 184 108 172
41,705 42,687 44,226 ‐ ‐ 47,504
69,791 67,381 65,653 60,153 46,527 42,048
12,880 12,310 11,703 11,598 11,997 12,586
226 238 204 307 310 335
2,847 3,559 3,320 3,682 3,624 3,844
4,359 4,923 5,730 6,763 7,564 8,294
55,860 52,159 51,086 54,628 58,559 59,795
2,451 2,288 2,212 2,274 2,589 3,273
42,591 40,426 41,875 43,877 36,551 41,412
2,692 2,804 3,051 2,909 2,398 2,013
3,147 3,323 3,379 2,675 2,480 2,143
7,468 7,555 7,796 7,904 7,829 8,548
182 165 186 150 150 135
1,526 1,807 1,654 2,069 1,741 1,964
51,969 53,246 60,283 51,007 46,950 51,792
298,667 314,101 306,160 277,749 361,103 429,460
1,624,785 1,476,648 1,559,932 1,512,975 1,364,872 1,499,406
32 29 40 36 36 31
3,149 2,986 3,047 2,726 3,418 2,487
54,602 71,174 72,787 82,118 74,051 120,776
201 150 143 245 148 305
48,955 38,524 43,947 45,411 47,088 43,730
48,811 56,586 51,725 47,941 49,594 50,546
29,430 29,708 29,545 29,299 29,338 29,065
163,098 160,318 160,604 156,411 153,190 145,284
23,724 23,816 23,915 23,659 23,592 23,461
11,394,712 11,476,609 11,522,999 10,834,793 10,253,776 8,537,754
20,134 20,248 20,317 20,043 20,037 20,061
2,415,467 2,442,415 2,513,595 2,521,930 2,496,549 2,052,176
22,231 22,320 22,421 22,152 22,105 21,990
8,184 8,652 8,130 7,546 7,186 6,512
Fiscal Year Ended June 30
159

2007 2008 2009 2010 2011
FUNCTION/PROGRAM
Public SafetyFire:Fire Stations Operated 8 8 8 8 8
Police:
Police Stations 1 1 1 1 1
Police Patrol Vehicles 30 30 30 30 30
Community Services
Acres ‐ Downtown/Urban Parks2 157 157 157 157 157
Acres ‐ Open Space2 3,744 3,744 3,744 3,744 3,744
Acres ‐ Parks and Preserves2 ‐ ‐ ‐ ‐ ‐
Acres ‐ Open Space2 ‐ ‐ ‐ ‐ ‐
Parks and Preserves 36 36 36 36 36
Golf Course 1 1 1 1 1
Tennis Courts 51 51 51 51 51
Athletic Center 4 4 4 4 4
Community Centers 4 4 4 4 4
Theaters 3 3 3 3 3
Cultural Center/Art Center 1 1 1 1 1
Junior Museum and Zoo 1 1 1 1 1
Swimming Pools 1 1 1 1 1
Nature Center 3 3 3 3 3
Libraries
Libraries 5 5 5 5 5
Public Works:
Number of Trees Maintained 34,556 35,058 34,991 35,025 34,977
Electric Utility1
Miles of Overhead Lines 194 193 193 193 193
Miles of Underground Lines 252 253 253 253 253
Water Utility
Miles of Water Mains 217 217 214 214 214
Gas Utility
Miles of Gas Mains 207 207 207 205 205
Waste Water
Miles of Sanitary Sewer Lines 202 202 207 207 207
Note:
Source: City of Palo Alto
CITY OF PALO ALTO
Capital Asset Statistics by Function/Program
Last Ten Fiscal Years
2Beginning in 2016 park acreage is sourced from the Official City Data Set.
1The City of Palo Alto Utilities Department recently completed the conversion of its electric system maps
to a GIS mapping system database. Therefore, the distances reported for FY 11/12 and forward are more
accurate than the distances reported in previous years.
Fiscal Year Ended June 30
160

2012 2013 2014 2015 2016
7 7 7 7 7
1 1 1 1 1
30 30 30 30 30
157 157 157 157 ‐
3,744 3,744 3,744 3,752 ‐
‐ ‐ ‐ ‐ 3,921
‐ ‐ ‐ ‐ 4,489
36 36 36 36 36
1 1 1 1 1
51 51 51 51 51
4 4 4 4 4
4 4 4 4 4
3 3 3 3 3
1 1 1 1 1
1 1 1 1 1
1 1 1 1 1
3 3 3 3 3
5 5 5 5 5
34,874 34,907 34,741 34,636 34,683
223 222 223 223 222
245 246 249 262 268
234 233 236 236 235
210 210 214 211 209
217 217 217 217 216
Fiscal Year Ended June 30
161

2007 2008 2009 2010 2011 2012 2013 2014 2015 2016
Governmental Funds
General Fund:
Administrative 99 98 98 89 83 83 85 83 84 86
Community Services 97 96 97 94 74 74 74 74 76 77
Development Services6 ‐ ‐ ‐ ‐ ‐ ‐ ‐ ‐ 38 38
Fire 127 127 127 123 121 122 119 116 107 107
Library 44 44 44 42 41 41 41 42 44 48
Office of Emergency Services5 ‐ ‐ ‐ ‐ ‐ ‐ ‐ 3 3 3
Planning and Community Environment6 53 53 53 49 44 43 48 49 28 31
Police 163 163 164 161 157 157 154 155 155 155
Public Works1 68 68 69 64 59 56 57 56 53 54
Subtotal General Fund 651 649 652 622 579 576 578 578 588 599
All Other Funds:
Capital Projects Fund 20 20 21 24 24 24 26 27 27 28
Special Revenue Fund 1 1 1 1 2 2 2 9 10 9
Total Governmental Funds 672 670 674 647 605 602 606 614 625 636
Enterprise Funds
Public Works2 113 113 113 115 115 115 104 99 100 95
Utilities3 235 235 238 242 251 251 254 255 258 256
External Services4 6 6 ‐ ‐ ‐ ‐ ‐ ‐ ‐ ‐
Total Enterprise Funds 354 354 351 357 366 366 358 354 358 351
Internal Service Funds
Printing and Mailing 4 4 4 4 2 2 2 2 2 2
Technology 30 30 31 31 30 30 31 32 32 34
Vehicle Replacement 16 16 16 16 16 16 17 17 17 17
Total Internal Service Funds 50 50 51 51 48 48 50 51 51 53
Total 1,076 1,074 1,076 1,055 1,019 1,016 1,014 1,019 1,034 1,040
Notes: 1Fleet and Facilities Management2Refuse, Storm Drainage, Wastewater Treatment
Numbers adjusted for rounding purposes.
Source: City of Palo Alto ‐ Fiscal Year 2016 Adopted Operating Budget
6ln FY15, staff was moved from Planning and Community Environment (PC&E), Public Works and Fire to create
Development Services.
5In 2014, emergency services and disaster preparation activities have been removed from the Fire Department and are now
shown in newly created Office of Emergency Services.
4In 2009, External Services was dissolved. 5 FTEs were eliminated and 1 FTE was transferred to the Technology Fund.
CITY OF PALO ALTO
Full‐Time Equivalent City Government Employees by Function
Last Ten Fiscal Years
Full Time Equivalent Employees as of June 30
3Electric, Gas, Wastewater Collection, Water
0
200
400
600
800
1,000
1,200
2007 2008 2009 2010 2011 2012 2013 2014 2015 2016
Full Time Equivalents
Governmental Funds Enterprise Funds Internal Service Funds
162
CITY OF PALO ALTO Index to the Single Audit Report For the Year Ended June 30, 2016
163
Page Independent Auditor’s Report on Internal Control Over Financial Reporting and on Compliance and Other Matters Based on an Audit of Financial Statements Performed in Accordance With Government Auditing Standards ..................................... 165
Independent Auditor’s Report on Compliance for Each Major Federal Program and Report on Internal Control Over Compliance Required by Uniform Guidance ..................................... 167
Schedule of Expenditures of Federal Awards ........................................................................................... 169
Notes to the Schedule of Expenditures of Federal Awards ...................................................................... 170
Schedule of Findings and Questioned Costs ............................................................................................. 171
Schedule of Prior Years Findings and Questioned Costs ........................................................................... 172

164
This page is intentionally left blank.

Century City
Los Angeles
Newport Beach
Oakland
Sacramento
San Diego
San Francisco
Walnut Creek
Woodland Hills
www.mgocpa.com Macias Gini & O’Connell LLP 2121 N. California Boulevard, Suite 750 Walnut Creek, CA 94596
165
Independent Auditor’s Report on Internal Control Over Financial Reporting and on Compliance and Other Matters Based on an Audit of Financial
Statements Performed in Accordance With Government Auditing Standards
Honorable Mayor and the Members of the City Council of the City of Palo Alto Palo Alto, California
We have audited, in accordance with the auditing standards generally accepted in the United States of America and the standards applicable to financial audits contained in Government Auditing Standards, issued by the Comptroller General of the United States, the financial statements of the governmental activities, the business-type activities, each major fund, and the aggregate remaining fund information of the City of Palo Alto, California (City), as of and for the year ended June 30, 2016, and the related notes to the financial statements, which collectively comprise the City’s basic financial statements, and have issued our report thereon dated November 2, 2016.
Internal Control Over Financial Reporting
In planning and performing our audit of the financial statements, we considered the City’s internal control over financial reporting (internal control) to determine the audit procedures that are appropriate in the circumstances for the purpose of expressing our opinions on the financial statements, but not for the purpose of expressing an opinion on the effectiveness of the City’s internal control. Accordingly, we do not express an opinion on the effectiveness of the City’s internal control.
A deficiency in internal control exists when the design or operation of a control does not allow management or employees, in the normal course of performing their assigned functions, to prevent, or detect and correct, misstatements on a timely basis. A material weakness is a deficiency, or a combination of deficiencies, in internal control, such that there is a reasonable possibility that a material misstatement of the entity’s financial statements will not be prevented, or detected and corrected on a timely basis. A significant deficiency is a deficiency, or a combination of deficiencies, in internal control that is less severe than a material weakness, yet important enough to merit attention by those charged with governance.
Our consideration of internal control was for the limited purpose described in the first paragraph of this section and was not designed to identify all deficiencies in internal control that might be material weaknesses or significant deficiencies. Given these limitations, during our audit we did not identify any deficiencies in internal control that we consider to be material weaknesses. However, material weaknesses may exist that have not been identified.

166
Compliance and Other Matters
As part of obtaining reasonable assurance about whether the City’s financial statements are free from material misstatement, we performed tests of its compliance with certain provisions of laws, regulations, contracts, and grant agreements, noncompliance with which could have a direct and material effect on the determination of financial statement amounts. However, providing an opinion on compliance with those provisions was not an objective of our audit, and accordingly, we do not express such an opinion. The results of our tests disclosed no instances of noncompliance or other matters that are required to be reported under Government Auditing Standards.
Purpose of this Report
The purpose of this report is solely to describe the scope of our testing of internal control and compliance and the results of that testing, and not to provide an opinion on the effectiveness of the entity’s internal control or on compliance. This report is an integral part of an audit performed in accordance with Government Auditing Standards in considering the entity’s internal control and compliance. Accordingly, this communication is not suitable for any other purpose.
Walnut Creek, California November 2, 2016
Century City
Los Angeles
Newport Beach
Oakland
Sacramento
San Diego
San Francisco
Walnut Creek
Woodland Hills
www.mgocpa.com Macias Gini & O’Connell LLP 2121 N. California Boulevard, Suite 750 Walnut Creek, CA 94596
167
Independent Auditor’s Report on Compliance for Each Major Federal Program and Report on Internal Control Over Compliance Required by Uniform Guidance
Honorable Mayor and the Members of the City Council of the City of Palo Alto Palo Alto, California
Report on Compliance for Each Major Federal Program
We have audited the City of Palo Alto’s, California (City) compliance with the types of compliance requirements described in the OMB Compliance Supplement that could have a direct and material effect on the City’s major federal program for the year ended June 30, 2016. The City’s major federal program is identified in the summary of auditor’s results section of the accompanying schedule of findings and questioned costs.
Management’s Responsibility
Management is responsible for compliance with federal statutes, regulations, and terms and conditions of its federal awards applicable to its federal programs.
Auditor’s Responsibility
Our responsibility is to express an opinion on compliance for the City’s major federal program based on our audit of the types of compliance requirements referred to above. We conducted our audit of compliance in accordance with auditing standards generally accepted in the United States of America; the standards applicable to financial audits contained in Government Auditing Standards, issued by the Comptroller General of the United States; and the audit requirements of Title 2 U.S. Code of Federal Regulations Part 200, Uniform Administrative Requirements, Cost Principles, and Audit Requirements for Federal Awards (Uniform Guidance). Those standards and the Uniform Guidance require that we plan and perform the audit to obtain reasonable assurance about whether noncompliance with the types of compliance requirements referred to above that could have a direct and material effect on a major federal program occurred. An audit includes examining, on a test basis, evidence about the City’s compliance with those requirements and performing such other procedures as we considered necessary in the circumstances.
We believe that our audit provides a reasonable basis for our opinion on compliance for the major federal program. However, our audit does not provide a legal determination of the City’s compliance.
Opinion on the Major Federal Program
In our opinion, the City complied, in all material respects, with the types of compliance requirements referred to above that could have a direct and material effect on its major federal program for the year ended June 30, 2016.

168
Report on Internal Control Over Compliance
Management of the City is responsible for establishing and maintaining effective internal control over compliance with the types of compliance requirements referred to above. In planning and performing our audit of compliance, we considered the City’s internal control over compliance with the types of requirements that could have a direct and material effect on the major federal program to determine the auditing procedures that are appropriate in the circumstances for the purpose of expressing an opinion on compliance for the major federal program and to test and report on internal control over compliance in accordance with the Uniform Guidance, but not for the purpose of expressing an opinion on the effectiveness of internal control over compliance. Accordingly, we do not express an opinion on the effectiveness of the City’s internal control over compliance.
A deficiency in internal control over compliance exists when the design or operation of a control over compliance does not allow management or employees, in the normal course of performing their assigned functions, to prevent, or detect and correct, noncompliance with a type of compliance requirement of a federal program on a timely basis. A material weakness in internal control over compliance is a deficiency, or combination of deficiencies, in internal control over compliance, such that there is a reasonable possibility that material noncompliance with a type of compliance requirement of a federal program will not be prevented, or detected and corrected, on a timely basis. A significant deficiency in internal control over compliance is a deficiency, or a combination of deficiencies, in internal control over compliance with a type of compliance requirement of a federal program that is less severe than a material weakness in internal control over compliance, yet important enough to merit attention by those charged with governance.
Our consideration of internal control over compliance was for the limited purpose described in the first paragraph of this section and was not designed to identify all deficiencies in internal control over compliance that might be material weaknesses or significant deficiencies. We did not identify any deficiencies in internal control over compliance that we consider to be material weaknesses. However, material weaknesses may exist that were not identified.
The purpose of this report on internal control over compliance is solely to describe the scope of our testing of internal control over compliance and the results of that testing based on the requirements of Uniform Guidance. Accordingly, this report is not suitable for any other purpose.
Walnut Creek, California November 2, 2016

Grantor Federal
Identifying CFDA Passed Through
Grantor/Pass‐Through Grantor/Program Title Number Number Expenditures to Subrecipients
U.S Department of Housing and Urban Development
Direct B‐13‐MC‐06‐0020
CDBG ‐ Entitlement Grants Cluster B‐14‐MC‐06‐0020
Community Development Block Grants/Entitlement Grants B‐15‐MC‐06‐0020 14.218 478,193$ 411,453$
U.S Department of Interior
Direct
ARRA ‐ Water Reclamation and Reuse Program R10AP20003 15.504 111,014 ‐
U.S. Department of Justice
Direct
Bulletproof Vest Partnership BA‐3A00S‐SM01 16.607 9,286 ‐
U.S. Department of Transportation
Direct 3‐06‐0182‐009‐2014
Airport Improvement Program 3‐06‐0182‐010‐2015 20.106 244,070 ‐
Pass‐through from State of California Office of the Traffic Safety
Minimum Penalties for Repeat Offenders for Driving While Intoxicated PT16113 20.608 15,487 ‐
Highway Safety Cluster
State and Community Highway Safety PT16113 20.600 4,835 ‐
National Priority Safety Program PT1618 20.616 14,813 ‐
Subtotal Highway Safety Cluster 19,648 ‐
Subtotal 35,135 ‐
Pass‐through from State of California Department of Transportation
Highway Planning and Construction BRLS‐5100(017) 132,457
Highway Planning and Construction CML‐5100(018) 20.205 148,978 ‐
Subtotal 281,435 ‐
Pass‐through from Dept of Resources Recycling & Recovery (CalRecycle)
Highway Planning and Construction TRPS‐14‐0073 20.205 63,000 ‐
Pass‐through from State of California Department of Water Resources
Highway Planning and Construction 4600010471 20.205 44,330 ‐
Total Highway Planning and Construction 388,765 ‐
Total U.S. Department of Transportation 667,970 ‐
Institute of Museum and Library Services
Pass‐through from California State Library MA‐10‐14‐0431‐14
Museums for America MA‐11‐15‐02014‐15 45.301 51,858 ‐
TOTAL FEDERAL FINANCIAL AWARDS 1,318,321$ 411,453$
CITY OF PALO ALTO
Schedule of Expenditures of Federal Awards
For the Year Ended June 30, 2016
169

CITY OF PALO ALTO Notes to the Schedule of Expenditures of Federal Awards
For the Year Ended June 30, 2016
170
NOTE 1 – REPORTING ENTITY
The schedule of expenditures of federal awards (the Schedule) includes expenditures of federal awards for the City of Palo Alto, California (City), and its component unit as disclosed in the notes to the basic financial statements.
NOTE 2 – BASIS OF ACCOUNTING
Basis of accounting refers to when revenues and expenditures or expenses are recognized in the accounts and reported in the financial statements, regardless of measurement focus applied. All governmental funds are accounted for using the modified accrual basis of accounting. All proprietary funds are accounted for using the accrual basis of accounting. Expenditures of federal awards reported in the Schedule are recognized when incurred and all eligibility requirements have been met. Such expenditures are recognized following the cost principles contained in 2 CFR 200, Subpart E (Cost Principles), wherein certain types of expenditures are not allowable or are limited as to reimbursement. The City did not elect to use the 10% de minimis cost rate as covered in 2 CFR 200.414(F&A) costs.
NOTE 3 – DIRECT AND INDIRECT (PASS‐THROUGH) FEDERAL AWARDS
Federal awards may be granted directly to the City by a federal granting agency or may be granted to other government agencies which pass‐through federal awards to the City. The Schedule includes both of these types of federal award programs when they occur.
NOTE 4 – RELATIONSHIP TO FEDERAL FINANCIAL REPORTS
Amounts reported in the Schedule agree to or can be reconciled with the amounts reported in the related federal financial reports.
NOTE 5 – RELATIONSHIP TO BASIC FINANCIAL STATEMENTS
Federal awards and expenditures agree to or can be reconciled with the amounts reported in the City’s basic financial statements.

CITY OF PALO ALTO Schedule of Findings and Questioned Costs
For the Year Ended June 30, 2016
171
Section I ‐ Summary of Auditor’s Results
Financial Statements
Type of auditor’s report issued on the basic financial statements of the City: Unmodified
Internal control over financial reporting:
Material weakness(es) identified? No
Significant deficiency(ies) identified? None reported
Noncompliance material to the financial statements noted? No
Federal Awards
Internal control over major programs:
Material weakness(es) identified? No
Significant deficiency(ies) identified? None reported
Type of auditor’s report issued on compliance for major programs: Unmodified
Any audit findings disclosed that are required to be reported in accordance with Uniform Guidance? No
Identification of Major Programs: CFDA No. 14.218 Community Development Block Grant
Dollar threshold used to distinguish between type A and type B programs:
$750,000
Auditee qualified as a low‐risk auditee? Yes
Section II – Financial Statements Findings
No findings reported.
Section III ‐ Federal Award Findings and Questioned Costs
No findings reported.

CITY OF PALO ALTO Schedule of Prior Years Findings and Questioned Costs
For the Year Ended June 30, 2016
172
Financial Statement and Federal Award Findings
No financial statement nor federal award findings were reported for the year ended June 30, 2015.
……….…………………………...……………………………………. City of Palo Alto 173
AMERICANS WITH DISABILITIES ACT STATEMENT In compliance with Americans with Disabilities Act (ADA) of 1990,
this document may be provided in other accessible formats.
For information contact: ADA Coordinator
250 Hamilton Avenue (650) 329-2550

Spanish explorers named the area for the tall, twin-
trunked redwood tree they camped beneath in 1769. Palo
Alto incorporated in 1894 and the State of California
granted its first charter in 1909. The City has long been
known for its innovative people and its exploration of
ideas that have changed the world. In Palo Alto, our
history has always been about the future.
City of Palo Alto 250 Hamilton Avenue, Palo Alto, CA 94301 P 650.329.2100 W cityofpaloalto.org