2015-2016 preliminary budget february 2, 2015. mission statement the mission of the kennett...
TRANSCRIPT

2015-2016 Preliminary Budget
February 2, 2015

Mission Statement
The Mission of the Kennett Consolidated School District is to provide a quality education that increases the achievement of every student in order for all to become successful and
thoughtful contributors to society.

Expenditures

Expenditures
$29,725
,454
$17,298,133
$6,418,
233
$1,703,
047
$13,083
,711
$2,652,
293
$8,181,196 SalariesBenefitsProf. Svcs.Property Svcs.Contracted Svcs.Supplies/EquipmentDebt Service
Total Expenses - $79,062,067

Expenditures
38%
22%
8%
2%
17%
3%
10%
SalariesBenefitsProf. Svcs.Property Svcs.Contracted Svcs.Supplies/EquipmentDebt Service
Total Expenses - $79,062,067

Budget Development Foundation
– Salaries▪ Collective Bargaining Agreement▪ Act 93 Agreement▪ All Other Employees – Act 1 Index to 3% Maximum▪ New Teaching Positions– High School S.T.E.M. – Special Education - 2 Positions– Middle School Social Studies
▪ Biology Remediation Program▪ Ready to Learn Summer Tutoring Program▪ No Retirements▪ No Furloughs/Outsourcing

Budget Development Foundation
– Benefits▪ Medical/Prescription/Dental Insurance – First Look Projections
▪ Pennsylvania School Employees Retirement Contribution Rate– Certified by PSERS
▪ Vision, Life, and Disability Insurance– Trend Analysis
▪ Worker’s Compensation– SDIC Estimate

Budget Development Foundation
– Allocations ▪ Instructional Buildings
– 1.9% Increase
▪ Department Allocations– No Increase
▪ Special Education– CCIU Projection
▪ Student Transportation– Krapf Bus Company Agreement
▪ Annual Consumer Price Index or Minimum 2%
▪ Occupational Education – CCIU Tuition Formula
▪ Paraprofessionals– CCRES Agreement
▪ Act 1 Index
▪ Charter School Tuition – Current Enrollment x (Tuition Rates x Act 1 Index)
▪ Debt Service– No Increase

Expenditures
DESCRIPTION 2014-2015
BUDGET
2015-2016 PRELIMINARY
BUDGET $ INC (DEC) % INC(DEC)
Salaries $ 28,886,644 $ 29,725,454 $ 838,810 2.90%
Employee Benefits 15,832,667 17,298,133 1,465,466
9.26%
Purchased Prof. Svcs. 5,893,175 6,418,233 525,058
8.91%
Purchased Property Svcs. 1,870,288 1,703,047 (167,241)
-8.94%
Other Contracted Svcs. 12,585,090 13,083,711 498,621
3.96%
Supplies 2,246,872 2,202,820 (44,052)
-1.96%
Equipment 438,190 449,473 11,283
2.57%
Other Objects 2,448,364 2,296,196 (152,168)
-6.22%
Other Financing Uses 5,695,500 5,885,000 189,500
3.33%
TOTAL ALL OBJECTS $ 75,896,790 $ 79,062,067 $ 3,165,277 4.17%

Expenditure Drivers
▪ Salaries– Existing Salaries
▪ Impact - $676,200– 2.3% Increase
– Three New Teaching Positions▪ Impact - $162,610– 0.6% Increase– Includes $10,000 for a Biology Remediation Program
▪ Benefits– Pennsylvania School Employees Retirement
System▪ Impact - $1,351,861 (Net Impact After State Subsidy-
$619,375)
– Prescription Insurance▪ Impact - $167,758

Benefits
DESCRIPTION 2014-2015
BUDGET 2015-2016
PRELIMINARY BUDGET $ INC (DEC) % INC(DEC)
Life Insurance $ 25,753 $ 26,479 $ 726 2.82%
Income Protection 54,651 55,725 1,074 1.97%
Vision 74,838 88,817 13,979 18.68%
Social Security 2,221,182 2,253,623 32,441 1.46%
Retirement 6,213,503 7,565,364 1,351,861 21.76%
Tuition 320,000 245,000 (75,000) -23.44%
Unemployment Comp. 45,781 40,000 (5,781) -12.63%
Workers Compensation 162,810 166,648 3,838 2.36%
Medical 4,726,502 4,709,316 (17,186) -0.36%
Dental 483,669 475,425 (8,244) -1.70%
Prescription 1,423,978 1,591,736 167,758 11.78%
Other Benefits 80,000 80,000 - 0.00%
TOTAL ALL BENEFITS $ 15,832,667 $ 17,298,133 $ 1,465,466 9.26%

PSERS History/Projections Employer Contribution Rates
1998-99
1999-00
2000-01
2001-02
2002-03
2003-04
2004-05
2005-06
2006-07
2007-08
2008-09
2009-10
2010-11
2011-12
2012-13
2013-14
2014-15
2015-16
2016-17
2017-18
2018-19
2019-20
2020-21
2021-22
0%
5%
10%
15%
20%
25%
30%
35%
1.09%
12.36%
16.93%
21.40%
25.84%
29.27%
32.22%

Act 110 of 2010PSERS Rate “Collars”
▪ The rate caps limit the amount the pension component of the employer contribution rate can increase over the prior year’s rate as follows:– FY 2011-12 – not more than 3.0%– FY 2012-13 – not more than 3.5%
– FY 2013-14 – not more than 4.5%– Thereafter – not more than 4.5%
The estimate for 2015-2016 prior to the rate caps being established was 33.49% which would have translated to an additional net
budgetary increase of $1.1 million.

Expenditure Drivers
▪ Purchased Professional Services– Home and Community Services
▪ Impact – $322,035▪ Personal Care Assistants
– CCIU Market Place Services/Other▪ Impact - $141,456▪ Special Education Services
– Security and Safety Services▪ Impact - $61,000▪ Middle School Security Guard

Expenditure Drivers
▪ Purchased Property Services– Electricity Savings
▪ Impact - ($167,700)
▪ Other Contracted Services– Occupational Education Tuition
▪ Impact - $180,666
– CCRES Paraprofessionals▪ Impact - $208,445– Affordable Care Act - $100,000 - Core Services -
$20,456– Extended School Year - $36,000 - Substitutes - $16,620– High School Study Hall Monitor - $35,050
– Charter School Tuition▪ Impact - $114,000

Charter School Tuition
▪ Fast Facts– Regular Education Tuition Rate -
$10,345– Special Education Tuition Rate -
$24,175– Traditional and Cyber Charter
Schools▪ Tuition Rates are Identical
– Current Enrollment▪ Regular Education – 157▪ Special Education – 49
– Avon Grove Charter School
– Total 2015-16 Budgeted Expense - $2,750,000
74%
26%
AGCS En-rollment
Regular Ed.Special Ed.

Revenues

Revenues
$61,798
,324
$3,839,
237
$11,683
,186 $1,026,990 $714,330
LocalState - PSERSState - OtherFederal Fund Balance
Total Revenues - $79,062,067

Revenues
78%
5%
15%
1% 1%
LocalState - PSERSState - OtherFederal Fund Balance
Total Revenues - $79,062,067

Revenues – State
2014-2015 2015-16
DESCRIPTION BUDGET PRELIMINARY $ INC (DEC) % INC (DEC)
BASIC ED SUBSIDY $5,135,000 $5,135,000 $0 0.00%
SPECIAL ED SUBSIDY 1,641,323 1,641,323 -
0.00%
TRANSPORTATION SUBSIDY 1,440,000 1,440,000 -
0.00%
RENTAL & SINKING FUND 362,000 560,408
198,408 54.81%
HEALTH SERVICES 86,000 86,000 -
0.00%
PROPERTY TAX REDUCTION ALLOCATION 1,379,058 1,379,058 -
0.00%
PA ACCOUNTABILITY GRANT 128,446 -
(128,446) -100.00%
READY TO LEARN BLOCK GRANT - 304,781
304,781
SOCIAL SECURITY 1,110,591 1,136,616
26,025 2.34%
RETIREMENT 3,106,752 3,839,237
732,485 23.58%TOTAL REVENUE FROM STATE SOURCES $14,389,170 $15,522,423 $1,133,253 7.88%
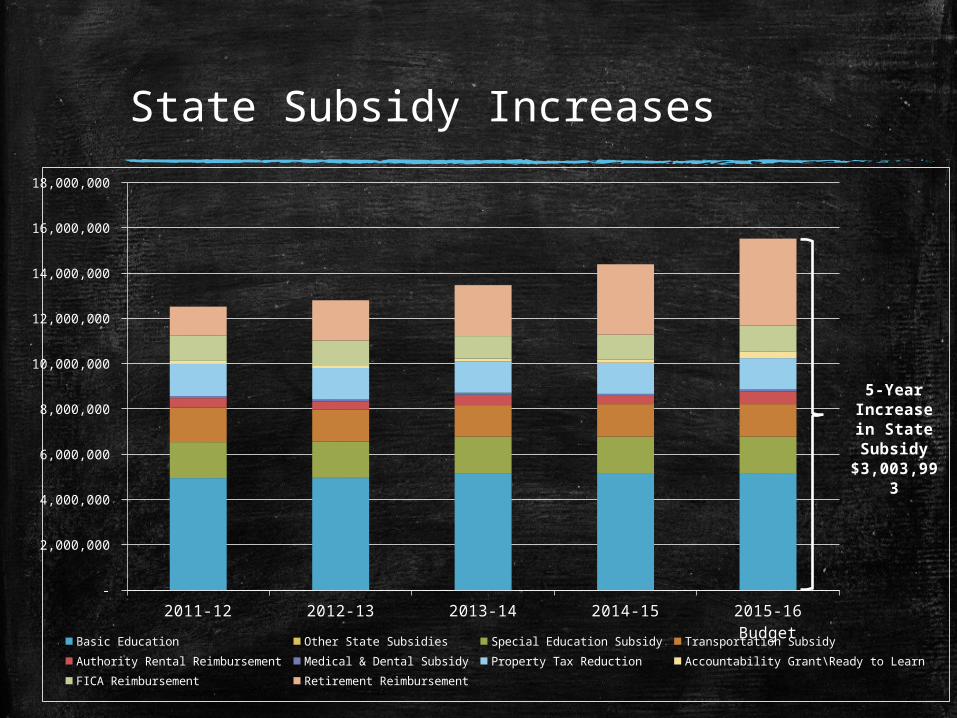
State Subsidy Increases
2011-12 2012-13 2013-14 2014-15 2015-16 Budget -
2,000,000
4,000,000
6,000,000
8,000,000
10,000,000
12,000,000
14,000,000
16,000,000
18,000,000
Basic Education Other State Subsidies Special Education Subsidy Transportation Subsidy
Authority Rental Reimbursement Medical & Dental Subsidy Property Tax Reduction Accountability Grant\Ready to Learn
FICA Reimbursement Retirement Reimbursement
5-Year In-crease in
State Subsidy$3,003,993

State Subsidy Increases
2011-12 2012-13 2013-14 2014-15 2015-16 Budget -
2,000,000
4,000,000
6,000,000
8,000,000
10,000,000
12,000,000
14,000,000
16,000,000
18,000,000
Basic Education Other State Subsidies Special Education Subsidy Transportation Subsidy
Authority Rental Reimbursement Medical & Dental Subsidy Property Tax Reduction Accountability Grant\Ready to Learn
FICA Reimbursement Retirement Reimbursement
5-Year In-crease in All Other State Subsidies$432,336
5-Year In-crease in
PSERS Subsidy
$2,571,567

State Revenue Drivers
▪ Rental and Sinking Fund– State’s Share of Debt Service Obligation
▪ Impact - $148,000– PDE’s Moratorium on Plan Con Projects Removed– Bancroft Elementary School Debt Service Issues are Eligible for Reimbursement
– CCIU’s Debt Service for TCHS▪ Impact - $48,000▪ Pass-Through Funding
▪ Ready To Learn Grant– Combined with Accountability Block Grant
▪ Impact - $176,335
▪ Pennsylvania School Employees Retirement System– State’s Obligation to Reimburse 50% of the Certified
Contribution Rate▪ Impact - $732,485 (Net Impact After Mandatory Contribution is an Expense
of $619,375)

Revenues – Local
2014-2015 2015-16DESCRIPTION BUDGET PRELIMINARY $ INC (DEC) % INC (DEC)
CURRENT REAL ESTATE $52,677,984 $54,210,008 $1,532,024 2.91%
INTERIM REAL ESTATE
400,000 400,000 - 0.00%
PUBLIC UTILITY TAX
73,000 73,000 - 0.00%
EARNED INCOME
3,650,000 3,900,000 250,000 6.85%
TRANSFER TAX
700,000 700,000 - 0.00%
DELINQUENT TAX
1,450,000 1,700,000 250,000 17.24%
EARNINGS ON INVESTMENTS
50,000 50,000 - 0.00%
IDEA
565,257 565,257 - 0.00%
RENTALS/FEES/MISCELLANEOUS
150,000 150,000 - 0.00%
FACILITY USAGE/CONTRIBUTIONS
50,059 50,059 - 0.00%
FUND BALANCE APPROPRIATION
714,330 714,330 - 0.00%TOTAL REVENUE FROM LOCAL SOURCES $60,480,630 $62,512,654 $2,032,024 3.36%

Local Revenue Drivers
▪ Real Estate Tax – Imposition of Increased Millage Rate
▪ Impact - $1,398,343
– Growth of Assessment Base▪ Impact - $133,681
▪ Delinquent Real Estate Tax– Liens Filed with Chester County Tax Claim
Bureau▪ Impact - $250,000
▪ Earned Income Tax– Collections Through Keystone Collection Group
▪ Impact - $250,000

Interim Real Estate Taxes
2008 2009 2010 2011 2012 2013 2014 2014-15
Budget
2015-2016
0
100,000
200,000
300,000
400,000
500,000
600,000
700,000
800,000
900,000
1,000,000
$893,284
$691,571
$417,250
$245,391$198,738
$405,286
$176,233
$400,000$400,000

Transfer Taxes
2008 2009 2010 2011 2012 2013 2014 2014-15
Budget
2015-16
Budget
0
200,000
400,000
600,000
800,000
1,000,000
1,200,000
$997,550
$701,374 $683,944$653,733
$623,290
$710,079
$788,695
$700,000 $700,000

Earned Income Taxes
2008 2009 2010 2011 2012 2013 2014 2014-15 Budget
2015-16 Budget
0
500,000
1,000,000
1,500,000
2,000,000
2,500,000
3,000,000
3,500,000
4,000,000
4,500,000
$3,446,846$3,492,318$3,393,938$3,451,401
$3,144,285
$3,860,952$4,077,297
$3,650,000
$3,900,000

Delinquent Taxes
2008 2009 2010 2011 2012 2013 2014 2014-15 Budget
2015-16 Budget
0
500,000
1,000,000
1,500,000
2,000,000
2,500,000
$1,083,191$1,031,744
$2,053,482
$1,346,243
$1,453,960$1,498,661
$1,786,340
$1,450,000
$1,700,000

Earnings from Investments
2008 2009 2010 2011 2012 2013 2014 2014-15
Budget
2015-16
Budget
0
200,000
400,000
600,000
800,000
1,000,000
1,200,000$1,133,042
$579,652
$154,298$101,328
$47,642 $42,296 $54,727 $50,000 $50,000

Summary

Preliminary Budget
▪ Proposed Real Estate Tax Increase– 2.67% Increase– 28.6871 Mills
▪ Apply for Act 1 Exceptions– PSERS Contributions
▪ Appropriation of Fund Balance– $714,320
▪ Begin Process of Budget Deliberations– Finance Committee Meetings
▪ First Monday of Every Month▪ Next Meeting – March 2, 2015▪ Open to the Public
▪ Governor Wolf’s Budget– Proposed Budget Release in March

Historical Millage Rates
2007-08 2008-09 2009-10 2010-11 2011-12 2012-13 2013-14 2014-15 2015-16 Budget
0
5
10
15
20
25
30
35
21.950023.1400 23.9537
24.778125.7293
26.730327.4520 27.9406 28.6871

Historical Millage Percentage Increase
2007-08 2008-09 2009-10 2010-11 2011-12 2012-13 2013-14 2014-15 2015-16 Budget
0.00%
1.00%
2.00%
3.00%
4.00%
5.00%
6.00%
1.8%
5.4%
3.5% 3.4%
3.8% 3.9%
2.7%
1.7%
2.6%

Average Real Estate Tax
2007-08 2008-09 2009-10 2010-11 2011-12 2012-13 2013-14 2014-15 2015-16 Budget
0
1,000
2,000
3,000
4,000
5,000
6,000
7,000
4,3904,628 4,791
4,9565,146
5,3465,490 5,588 5,737

Average Real Estate Tax Increase
2007-08 2008-09 2009-10 2010-11 2011-12 2012-13 2013-14 2014-15 2015-16 Budget
0
50
100
150
200
250
76
238
163 165
190200
144
98
149

Real Estate Tax Rate History
2009-10 2010-11 2011-12 2012-13 2013-14 2014-15 2015-16 Budget
-2.0%
-1.0%
0.0%
1.0%
2.0%
3.0%
4.0%
5.0%
6.0%
7.0%
8.0%
4.1%
2.9%
1.4%1.7% 1.7%
2.1%1.9%
3.50% 3.40%
3.80% 3.89%
2.70%
1.78%
2.67%
6.86%
2.33%
-0.91%
1.85%
2.38%2.71%
4.17%
Act 1 Index Millage Increase Budget Increase

Questions?