2015 annual global climate and catastrophe report
TRANSCRIPT

Risk. Reinsurance. Human Resources.
2015 Annual Global Climate and Catastrophe ReportImpact Forecasting
Aon Benfield

Executive Summary . . . . . . . . . . . . . . . . . . . . . . . . . . . . . . . . . . . . .1
2015’s Natural Disaster Events . . . . . . . . . . . . . . . . . . . . . . . . . . . .2
Global Economic Losses . . . . . . . . . . . . . . . . . . . . . . . . . . . . . . . . . . . . . . . 2
Global Insured Losses . . . . . . . . . . . . . . . . . . . . . . . . . . . . . . . . . . . . . . . . . 4
Global Fatalities . . . . . . . . . . . . . . . . . . . . . . . . . . . . . . . . . . . . . . . . . . . . . . 6
Natural Disasters Defined and Total Events . . . . . . . . . . . . . . . . . . . . . . . . 7
An Analysis: Do ENSO Phases Lead to Differences in Weather Catastrophe Losses? . . . . . . . . . . . . . . . . . . . . . . . . . . . . .8
2015 Climate Review . . . . . . . . . . . . . . . . . . . . . . . . . . . . . . . . . .10
2015 Atlantic Ocean Hurricane Season Review . . . . . . . . . . . . . . . . . . . . 12
2015 Eastern and Central Pacific Ocean Hurricane Season Review . . . . . 13
2015 Western North Pacific Ocean Typhoon Season Review . . . . . . . . . 14
2015 North Indian Ocean Cyclone Season Review . . . . . . . . . . . . . . . . . 15
2015 Southern Hemisphere Ocean Cyclone Season Review . . . . . . . . . . 16
2015 United States Tornado Season Review . . . . . . . . . . . . . . . . . . . . . . 17
2015 United States Wildfire Season Review . . . . . . . . . . . . . . . . . . . . . . . 18
2015 Global Earthquake Review . . . . . . . . . . . . . . . . . . . . . . . . . . . . . . . . 19
El Niño/Southern Oscillation Background . . . . . . . . . . . . . . . . . .20
Atlantic Hurricane Season Forecasts . . . . . . . . . . . . . . . . . . . . . . .21
Historical Predictions . . . . . . . . . . . . . . . . . . . . . . . . . . . . . . . . . . . . . . . . . 21
2016 Atlantic Hurricane Season Outlook . . . . . . . . . . . . . . . . . . . . . . . . . 22
2015 Global Catastrophe Review . . . . . . . . . . . . . . . . . . . . . . . . .23
United States . . . . . . . . . . . . . . . . . . . . . . . . . . . . . . . . . . . . . . . . . . . . . . . 23
Americas (Non-U .S .) . . . . . . . . . . . . . . . . . . . . . . . . . . . . . . . . . . . . . . . . . 27
EMEA (Europe, Middle East, and Africa) . . . . . . . . . . . . . . . . . . . . . . . . . . 31
APAC (Asia and Oceania) . . . . . . . . . . . . . . . . . . . . . . . . . . . . . . . . . . . . . 35
Appendix A: 2015 Global Disasters . . . . . . . . . . . . . . . . . . . . . . .39
Appendix B: Historical Natural Disaster Events . . . . . . . . . . . . . .49
Appendix C: Tropical Cyclone Frequency Comparisons . . . . . . .51
Appendix D: Tropical Cyclone Landfall Data by Basin . . . . . . . . .55
Appendix E: United States Tornado Frequency Data . . . . . . . . . .58
Appendix F: United States Wildfire Frequency Data . . . . . . . . . .61
About Impact Forecasting . . . . . . . . . . . . . . . . . . . . . . . . . . . . . .63
About Aon Benfield . . . . . . . . . . . . . . . . . . . . . . . . . . . . . . . . . . . .63
Contacts . . . . . . . . . . . . . . . . . . . . . . . . . . . . . . . . . . . . . . . . . . . .64
Table of Contents
Aon Benfield 1
Executive Summary
Global Catastrophe Losses Remain Below Average in 2015 Despite Uptick in Disaster EventsGlobal natural disasters in 2015 combined to cause economic losses of USD123 billion, an amount 30
percent below the 15-year average of USD175 billion . However, the losses were just eight percent lower on
a median basis (USD134 billion) . The economic losses were attributed to 300 separate events, compared
to an average of 269 . The disasters caused insured losses of USD35 billion, or 31 percent below the 15-year
mean of USD51 billion and 14 percent lower than the median (USD40 billion) . It comprised the lowest total
since 2009 . This was the fourth consecutive year with declining catastrophe losses since the record-setting
year in 2011 . Notable events during the year included winter storms in the United States; extensive flooding
in parts of India, the US, UK, and China; a major earthquake in Nepal; record-setting tropical cyclones in the
Pacific Ocean; European windstorms; and massive forest fires in Indonesia . The top three perils, flooding,
severe thunderstorm, and wildfire, combined for 59 percent of all economic losses in 2015 . Despite 32
percent of catastrophe losses occurring inside of the United States, it still accounted for 60 percent of global
insured losses . This speaks to a higher rate of insurance penetration in the country .
The deadliest event of 2015 was the magnitude-7 .8 earthquake
and subsequent aftershock that struck Nepal in April and May
and left more than 9,100 people dead . A total of 21 tropical
cyclones (Category 1+) made landfall globally in 2015; above the
1980-2014 average of 15 . Fourteen of the landfalls occurred in
the Northern Hemisphere, including 13 in Asia . The United States
extended its record to 10 consecutive years without a major
hurricane landfall . 2015 was also documented as the warmest
year since 1880 when global land and ocean temperature
records began .
The Indonesian forest fires were the costliest single economic
loss event of the year and were triggered by local slash-and-burn
tactics that quickly spread out of control . The World Bank estimated
that the fires had left an economic cost of USD16 .1 billion . The
costliest non-weather event was the Nepal earthquake that
was expected to cost the nation and surrounding countries an
estimated USD8 .0 billion in damage and reconstruction . From
an insurance industry perspective, the costliest event was a
February winter storm that impacted much of the Eastern United
States, affecting both public and private insurers which paid out
more than USD2 .1 billion .
No region of the world sustained aggregate insured losses above
their 15-year averages in 2015; though EMEA, Asia Pacific and the
Americas (non-US) were above their respective medians . The top
10 insured loss events in 2015 comprised of five United States
severe thunderstorm outbreaks, one United States winter storm,
one European windstorm, one Indonesian forest fires, and one
United States drought .
The percentage of global economic losses that were covered
by public or private insurance entities was 28 percent . This was
equal to the 15-year average . However, if you remove the United
States the percentage drops to 16 percent . This clearly highlights
how the United States continues to annually drive insured natural
disasters around the world .
Along with this report, refer to Impact Forecasting’s
Catastrophe Insight website to access current and
historical natural catastrophe data and event analysis at:
www .aonbenfield .com/catastropheinsight
1 An event must meet at least one of the following criteria to be classified as a natural disaster: economic loss of USD50M, insured loss of USD25M, 10 fatalities, 50 injured or 2,000 homes or structures damaged.

2 2015 Annual Global Climate and Catastrophe Report
Global Economic Losses
Exhibit 1: Top 10 Global Economic Loss Events
Date(s) Event Location Deaths Economic Loss (USD)
Insured Loss (USD)
Yearlong Forest Fire Indonesia 19 16 .1 billion 250 million
April 25 & May 12 Earthquake(s) Nepal 9,120 8 .0 billion 200 million
October 1 – 11 Flooding United States 21 5 .0 billion 700 million
October 2 – 4 Tropical Cyclone China, Philippines 22 4 .2 billion 100 million
Nov . – Dec . Flooding India, Sri Lanka 386 4 .0 billion 380 million
May 23 – 28 Severe Weather United States 32 3 .8 billion 1 .4 billion
February 16 – 22 Winter Weather United States 30 3 .3 billion 2 .1 billion
August 2 – 9 Tropical Cyclone China, Taiwan 34 3 .2 billion 100 million
December 26 – 30 Severe Weather United States 46 3 .0 billion 1 .4 billion
December 22 – 31 Flooding United Kingdom N/A 2 .5 billion 1 .3 billion
All Other Events 73 billion 27 billion
Totals 123 billion1 35 billion1,2
Exhibit 2: Global Economic Losses
USD
Bill
ion
s (2
01
5)
0
100
200
300
400
500
2015201020052000
Annual Average (2000-2014)
8265
105 108
177
289
76
102
250
89
262
465
217205
134123
Economic losses in 2015 were driven by flood, severe weather
(thunderstorm), tropical cyclone, and wildfire perils, which
accounted for 70 percent of global natural disaster losses .
Flooding was the costliest peril overall at USD27 billion, or 22
percent of the aggregated tally . See Exhibit 3 for more details .
The most significant flood event was an early October event in
the United States that left an estimated USD5 .0 billion in damage,
primarily in the state of South Carolina . Another multi-billion-
dollar flood event occurred in southern India in November and
December . The costliest singular event of 2015 was a nearly
yearlong outbreak of forest fires across Indonesia’s Sumatra and
Kalimantan regions . The World Bank estimated the economic cost
at USD16 .1 billion, or 1 .9 percent of the country’s GDP . The
majority of economic losses–82 percent—were registered in Asia
Pacific with 50 percent and the United States with 32 percent .
Total economic losses were 30 percent below the 2000 to 2014
mean (175 billion) on an inflation-adjusted basis . On a median
basis (134 billion), economic losses were only eight percent
lower . The USD123 billion economic total in 2015 represents the
lowest tally resulting from global natural disasters since 2009 .
Economic losses have trended upwards by 4 .0 percent above
inflation on an annual basis, or positively trended upwards by 7 .0
percent nominally since 1980 .
2015 Natural Disaster Events and Loss Trends
1 Subject to change as loss estimates are further developed2 Includes losses sustained by private insurers and government-sponsored programs

Aon Benfield 3
The costliest peril of 2015 was flood, which was closely followed by severe weather (thunderstorm), and wildfire . The year marked the
first time since 2009 that no individual peril recorded economic losses beyond USD40 billion . The only perils to cross their recent
10-year averages were severe weather and wildfire . The wildfire peril at USD19 billion marked a significant increase over the recent mean
of USD4 billion . These losses were driven by events in Indonesia and in the United States (California) . Every other major peril incurred
below normal levels of economic losses
Exhibit 3: Global Economic Losses by Peril
There were 31 individual billion-dollar natural disaster events in 2015, above the average of 26 since 2000 . It was three above the total
registered in 2014 (27) . The United States led with 11 billion-dollar events with Asia Pacific close behind at 10 . EMEA was third with
seven and the Americas had three . For weather-only events, there were 29 billion-dollar disasters, which was above the 2000 to 2014
average of 24 . The tally in 2015 was five above 2014 with 25 . The United States led with 11 events, followed by Asia Pacific at nine, seven
in EMEA, and two in the Americas .
Exhibit 4: Global Billion-Dollar Economic Loss Events (Inflated)
Note: Exhibit 4 includes events which reached the billion-dollar-plus (USD) threshold after being adjusted for inflation based on the 2015 US Consumer Price Index..
0
10
20
30
40
50
60
OtherDroughtEU WindstormWildfireWinter WeatherEarthquakeFloodingSevere WeatherTropical Cyclone
USD
bill
ion
s (2
01
5)
10 Year Average2015
15
55
2624
27
48 48
107
10
19
4 4 5
14 14
0.7 1.5
0
5
10
15
20
25
30
35
40
45
50
2015201420132012201120102009200820072006200520042003200220012000
Even
ts
Billion-Dollar Events (Weather)Billion-Dollar Events (All)
13 1311
8
20 19
22
19 1917
25 2422 21
2321 22 21
2523
47
4139
35
28 27
4341
2725
3129

4 2015 Annual Global Climate and Catastrophe Report
Global Insured Losses
Exhibit 5: Top 10 Global Insured Loss Events
Date(s) Event Location Deaths Economic Loss (USD)
Insured Loss (USD)
February 16 – 22 Winter Weather United States 30 3 .3 billion 2 .1 billion
May 23 – 28 Severe Weather United States 32 3 .8 billion 1 .4 billion
December 26 – 30 Severe Weather United States 46 3 .0 billion 1 .4 billion
December 22 – 31 Flooding United Kingdom N/A 2 .5 billion 1 .3 billion
April 7 – 10 Severe Weather United States 3 1 .7 billion 1 .2 billion
March 29 – April 1 WS Mike & Niklas Western & Central Europe 9 1 .4 billion 1 .0 billion
Yearlong Drought United States N/A 4 .5 billion 1 .0 billion
August 15 – 26 Typhoon Goni Japan 70 1 .8 billion 980 million
September 12 – 25 Wildfire (Valley) United States 4 1 .5 billion 975 million
April 18 – 21 Severe Weather United States N/A 1 .4 billion 925 million
All Other Events 100 billion 23 billion
Totals 123 billion1 35 billion1,2
Exhibit 6: Global Insured Losses
USD
Bill
ion
s (2
01
5)
0
20
40
60
80
100
120
140
2015201020052000
Annual Average (2000-2014)
17 19
28 29
60
124
19
32
56
29
51
132
73
50
4035
Severe weather (thunderstorm), flood, and winter weather perils
accounted for 73 percent of 2015 global insured losses . Severe
weather was the costliest peril overall at USD14 billion, or 41
percent of the aggregated tally . See Exhibit 5 for more details .
The costliest individual insured loss event was a prolonged
stretch of heavy snow, freezing rain, ice, and frigid cold that
impacted much of the eastern United States in February . That
event prompted an estimated USD2 .1 billion insured loss .
Additional notable insured loss events were December severe
thunderstorms and flooding in the United States, windstorms
Mike and Niklas that impacted Europe in March and April, December
flooding in the UK, and August’s Typhoon Goni that struck
Japan . Seven of the top ten insured loss events occurred in the
United States . The United States incurred 60 percent of all global
insured losses .
Total insured losses were 31 percent below the 2000 to 2014
mean (USD51 billion) on an inflation-adjusted basis . On a median
basis insured losses were 14 percent lower (USD40 billion) . The
USD32 billion insured total in 2015 represents the lowest tally
resulting from global natural disasters since 2009 . Insured losses
have trended upwards by 7 .2 percent above inflation on an
annual basis, or positively trended upwards by 10 percent
nominally since 1980 .
1 Subject to change as loss estimates are further developed2 Includes losses sustained by private insurers and government-sponsored programs

Aon Benfield 5
The costliest peril of 2015 was severe weather (thunderstorm) at USD14 billion, which far outpaced the next closest perils – flooding at
USD7 billion and winter weather at USD4 billion . The year marked the first time since 2009 that no individual peril recorded insured
losses beyond USD15 billion . The only two perils to cross their recent 10-year averages were winter weather and wildfire, though
European Windstorm tied . Losses from those perils were driven by events in the United States and Asia Pacific . Every other major peril
incurred below normal levels of insured losses by at least 15 percent .
Exhibit 7: Global Insured Losses by Peril
There were seven individual billion-dollar insured loss natural disaster events in 2015, which is below the average of eight since 2000 .
It marked the fewest number of such events since 2007 . The United States recorded the greatest number with five events and EMEA
incurred the other two . All of the events were weather-related and also lower than the average of eight . The last non-weather billion-
dollar insured loss event came in 2012 with Italy’s May earthquake events . The five events in the United States were equal to the 2000
to 2014 average . The all-time record of 17 billion-dollar weather events was set in 2011 .
Exhibit 8: Global Billion-Dollar Insured Loss Events
Note: Exhibit 8 includes events which reached the billion-dollar-plus (USD) threshold after being adjusted for inflation based on the 2015 US Consumer Price Index.
0
5
10
15
20
OtherDroughtEU WindstormWildfireWinter WeatherEarthquakeFloodingSevere WeatherTropical Cyclone
USD
Bill
ion
s (2
01
5)
10 Year Average2015
2.2
19
1415
7.0
9.1
0.8
7.2
3.82.9
1.70.7
2.6 2.61.9
4.3
0.0 0.3
0
5
10
15
20
25
2015201420132012201120102009200820072006200520042003200220012000
Even
ts
Billion-Dollar Events (Weather)Billion-Dollar Events (All)
3 32 2
4 4
9 98
7 7 7
5 5
7 7
10 10
8 8
11
9
20
17
87
13 13
11 11
7 7

6 2015 Annual Global Climate and Catastrophe Report
Global Fatalities
Exhibit 9: Top 10 Human Fatality Events
Date(s) Event Location Deaths Economic Loss (USD)
April 25 & May 12 Earthquake Nepal 9,120 8 .0 billion
April/May Heatwave India 2,500 N/A
June 20 – 30 Heatwave Pakistan 1,233 N/A
June/August Heatwave Europe 1,000 N/A
October 1 Landslide Guatemala 570 N/A
October 26 Earthquake Afghanistan, Pakistan 403 100 million
Nov . – Dec . Flooding India 386 3 .0 billion
January Flooding Malawi, Mozambique, Madagascar 307 550 million
July – August Flooding India, Bangladesh, Pakistan 303 500 million
February 15 – 28 Winter Weather Afghanistan 247 Millions
All Other Events ~3,450 110 billion
Totals ~19,500 123 billion
Exhibit 10: Global Human Fatalities
Fata
litie
s
0
50,000
100,000
150,000
200,000
250,000
300,000
350,000
201020052000 2015
Total Facilities Average (2000-2014)
13,3
21 31,1
38
14,6
90
121,
618
243,
048
104,
228
22,9
89
22,5
64
9,58
5 25,4
49
8,78
1
295,
807
236,
898
21,1
35
8,01
1
19,5
00
The number of human fatalities caused by natural disasters in
2015 was approximately 19,500 . Seven of the top ten events
occurred in Asia, with the deadliest being a duo of earthquakes
that struck Nepal in April and May, killing more than 9,100
people . The effects of the tremors also led to casualties in India,
China, and Bangladesh . Unsurprisingly, earthquake was the
deadliest peril of the year, comprising 53 percent of human
fatalities . The second deadliest peril of 2015 was heatwave: more
than 3,850 people died as the result of extremely hot weather
conditions in India, Pakistan, Egypt, and Japan . Other events in
the top 10 include a major summer European heatwave, a
landslide in Guatemala, an earthquake that struck Afghanistan
and Pakistan, flood events in southern Africa and South Asia, and
a winter weather event in Afghanistan .
2015 saw an increase in natural disaster-related fatalities from
those sustained in 2014 with roughly 8,000, but was still a
substantial 75 percent lower than the average since 2000 with
roughly 79,000 . However, the tally was just 15 percent lower on
a median basis with approximately 23,000 .

Aon Benfield 7
Natural Disasters Defined and Total EventsAn event must meet at least one of the following criteria to be
classified as a natural disaster:
§ Economic Loss: USD50 million
§ Insured Loss: USD25 million
§ Fatalities: 10
§ Injured: 50
§ Homes/Structures Damaged: 2,000
Based on these criteria, there were at least 300 separate natural
disaster events in 2015, which was 12 percent above the 2000-2014
average of 269 . The second and third quarters are typically the most
active during the year, and 2015 was no exception with 79 and 84
events occurring, respectively . Asia Pacific sustained the highest
number of events, which is to be expected given Asia’s large size
and susceptibility to natural disaster events . EMEA was the second-
most active region of the globe .
Exhibit 11: Total Natural Disaster Events
Exhibit 12: Total Natural Disaster Events by Region
0
50
100
150
200
250
300
350
400
2015201420132012201120102009200820072006200520042003200220012000
Even
ts
Total Events Average (2000-2014)
338326 328
193175
232
277
253235
248
326
258
298 291
257
300
0
30
60
90
120
150
AmericasAPACEMEAUnited States
Even
ts
10 Year Average2015
59 63 64
55
136
111
41 38
8 2015 Annual Global Climate and Catastrophe Report
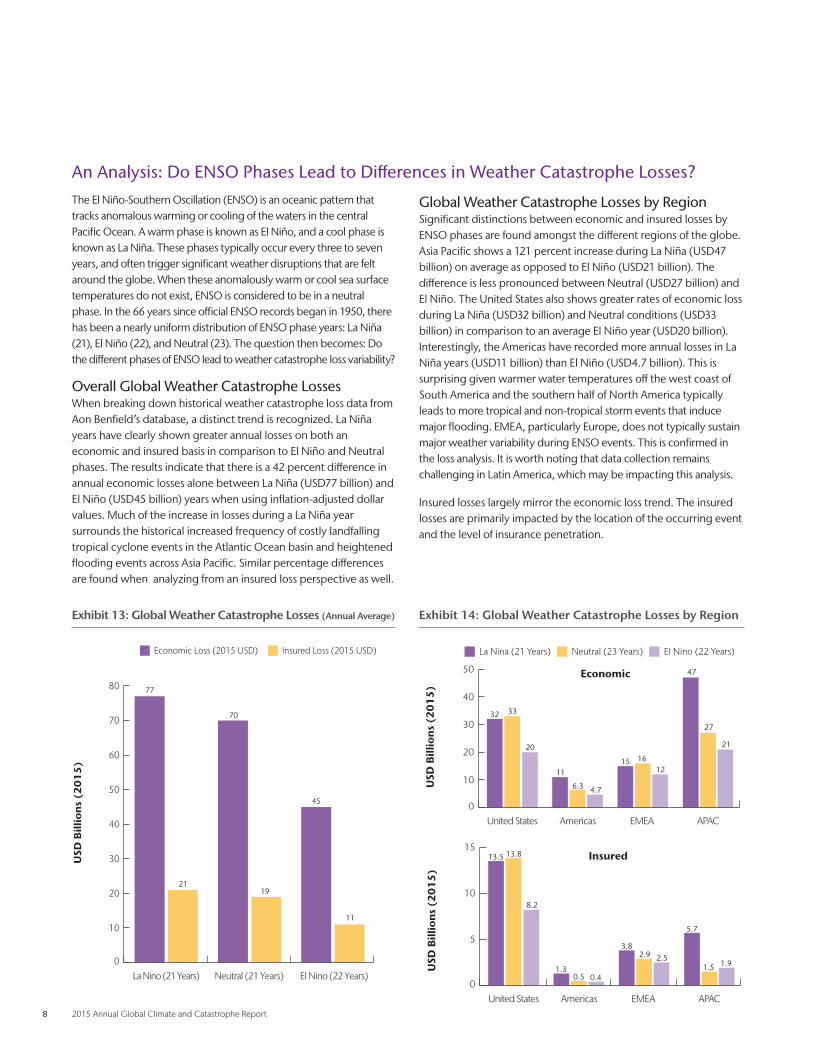
An Analysis: Do ENSO Phases Lead to Differences in Weather Catastrophe Losses?The El Niño-Southern Oscillation (ENSO) is an oceanic pattern that tracks anomalous warming or cooling of the waters in the central Pacific Ocean . A warm phase is known as El Niño, and a cool phase is known as La Niña . These phases typically occur every three to seven years, and often trigger significant weather disruptions that are felt around the globe . When these anomalously warm or cool sea surface temperatures do not exist, ENSO is considered to be in a neutral phase . In the 66 years since official ENSO records began in 1950, there has been a nearly uniform distribution of ENSO phase years: La Niña (21), El Niño (22), and Neutral (23) . The question then becomes: Do the different phases of ENSO lead to weather catastrophe loss variability?
Overall Global Weather Catastrophe LossesWhen breaking down historical weather catastrophe loss data from Aon Benfield’s database, a distinct trend is recognized . La Niña years have clearly shown greater annual losses on both an economic and insured basis in comparison to El Niño and Neutral phases . The results indicate that there is a 42 percent difference in annual economic losses alone between La Niña (USD77 billion) and El Niño (USD45 billion) years when using inflation-adjusted dollar values . Much of the increase in losses during a La Niña year surrounds the historical increased frequency of costly landfalling tropical cyclone events in the Atlantic Ocean basin and heightened flooding events across Asia Pacific . Similar percentage differences are found when analyzing from an insured loss perspective as well .
Global Weather Catastrophe Losses by RegionSignificant distinctions between economic and insured losses by ENSO phases are found amongst the different regions of the globe . Asia Pacific shows a 121 percent increase during La Niña (USD47 billion) on average as opposed to El Niño (USD21 billion) . The difference is less pronounced between Neutral (USD27 billion) and El Niño . The United States also shows greater rates of economic loss during La Niña (USD32 billion) and Neutral conditions (USD33 billion) in comparison to an average El Niño year (USD20 billion) . Interestingly, the Americas have recorded more annual losses in La Niña years (USD11 billion) than El Niño (USD4 .7 billion) . This is surprising given warmer water temperatures off the west coast of South America and the southern half of North America typically leads to more tropical and non-tropical storm events that induce major flooding . EMEA, particularly Europe, does not typically sustain major weather variability during ENSO events . This is confirmed in the loss analysis . It is worth noting that data collection remains challenging in Latin America, which may be impacting this analysis .
Insured losses largely mirror the economic loss trend . The insured losses are primarily impacted by the location of the occurring event and the level of insurance penetration .
Exhibit 14: Global Weather Catastrophe Losses by Region
USD
Bill
ion
s (2
01
5)
0
5
10
15
United States Americas EMEA APAC
13.5 13.8
8.2
1.30.5 0.4
3.82.9 2.5
5.7
1.5 1.9
El Nino (22 Years)La Nina (21 Years) Neutral (23 Years)
InsuredUSD
Bil
lio
ns
(20
15
)
0
10
20
30
40
50
60
70
80
La Nino (21 Years) Neutral (21 Years) El Nino (22 Years)
Economic Loss (2015 USD) Insured Loss (2015 USD)
77
21
70
19
45
11
Exhibit 13: Global Weather Catastrophe Losses (Annual Average)
USD
Bill
ion
s (2
01
5)
0
10
20
30
40
50
United States Americas EMEA APAC
32 33
20
11
6.3 4.7
15 1612
47
27
21
El Nino (22 Years)La Nina (21 Years) Neutral (23 Years)
Economic
Aon Benfield 9
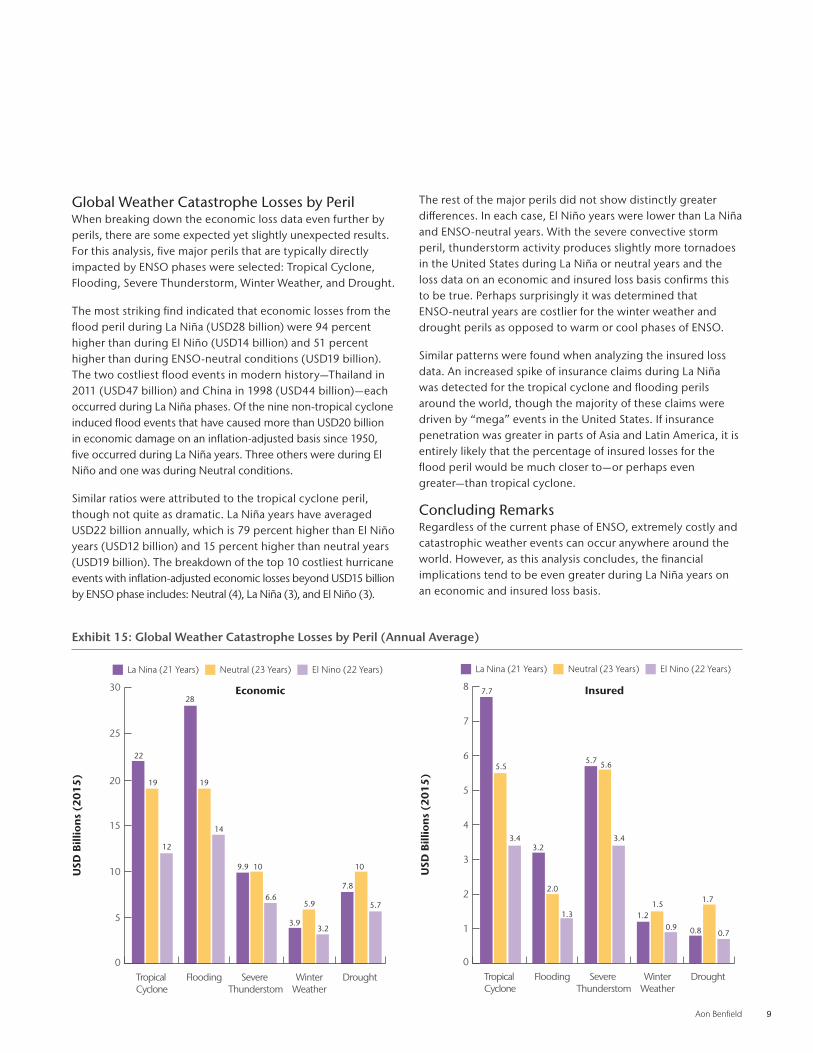
Global Weather Catastrophe Losses by PerilWhen breaking down the economic loss data even further by perils, there are some expected yet slightly unexpected results . For this analysis, five major perils that are typically directly impacted by ENSO phases were selected: Tropical Cyclone, Flooding, Severe Thunderstorm, Winter Weather, and Drought .
The most striking find indicated that economic losses from the flood peril during La Niña (USD28 billion) were 94 percent higher than during El Niño (USD14 billion) and 51 percent higher than during ENSO-neutral conditions (USD19 billion) . The two costliest flood events in modern history—Thailand in 2011 (USD47 billion) and China in 1998 (USD44 billion)—each occurred during La Niña phases . Of the nine non-tropical cyclone induced flood events that have caused more than USD20 billion in economic damage on an inflation-adjusted basis since 1950, five occurred during La Niña years . Three others were during El Niño and one was during Neutral conditions .
Similar ratios were attributed to the tropical cyclone peril, though not quite as dramatic . La Niña years have averaged USD22 billion annually, which is 79 percent higher than El Niño years (USD12 billion) and 15 percent higher than neutral years (USD19 billion) . The breakdown of the top 10 costliest hurricane events with inflation-adjusted economic losses beyond USD15 billion by ENSO phase includes: Neutral (4), La Niña (3), and El Niño (3) .
The rest of the major perils did not show distinctly greater differences . In each case, El Niño years were lower than La Niña and ENSO-neutral years . With the severe convective storm peril, thunderstorm activity produces slightly more tornadoes in the United States during La Niña or neutral years and the loss data on an economic and insured loss basis confirms this to be true . Perhaps surprisingly it was determined that ENSO-neutral years are costlier for the winter weather and drought perils as opposed to warm or cool phases of ENSO .
Similar patterns were found when analyzing the insured loss data . An increased spike of insurance claims during La Niña was detected for the tropical cyclone and flooding perils around the world, though the majority of these claims were driven by “mega” events in the United States . If insurance penetration was greater in parts of Asia and Latin America, it is entirely likely that the percentage of insured losses for the flood peril would be much closer to—or perhaps even greater—than tropical cyclone .
Concluding RemarksRegardless of the current phase of ENSO, extremely costly and catastrophic weather events can occur anywhere around the world . However, as this analysis concludes, the financial implications tend to be even greater during La Niña years on an economic and insured loss basis .
USD
Bill
ion
s (2
01
5)
0
5
10
15
20
25
30
Tropical Cyclone
Flooding Severe Thunderstom
DroughtWinterWeather
22
19
12
28
19
14
9.9 10
6.6
3.9
5.9
3.2
7.8
10
5.7
El Nino (22 Years)La Nina (21 Years) Neutral (23 Years)
Economic
USD
Bill
ion
s (2
01
5)
0
1
2
3
4
5
6
7
8
Tropical Cyclone
Flooding Severe Thunderstom
DroughtWinterWeather
7.7
5.5
3.43.2
2.0
1.3
5.7 5.6
3.4
1.21.5
0.9 0.8
1.7
0.7
El Nino (22 Years)La Nina (21 Years) Neutral (23 Years)
Insured
Exhibit 15: Global Weather Catastrophe Losses by Peril (Annual Average)
10 2015 Annual Global Climate and Catastrophe Report
2015 Climate Review
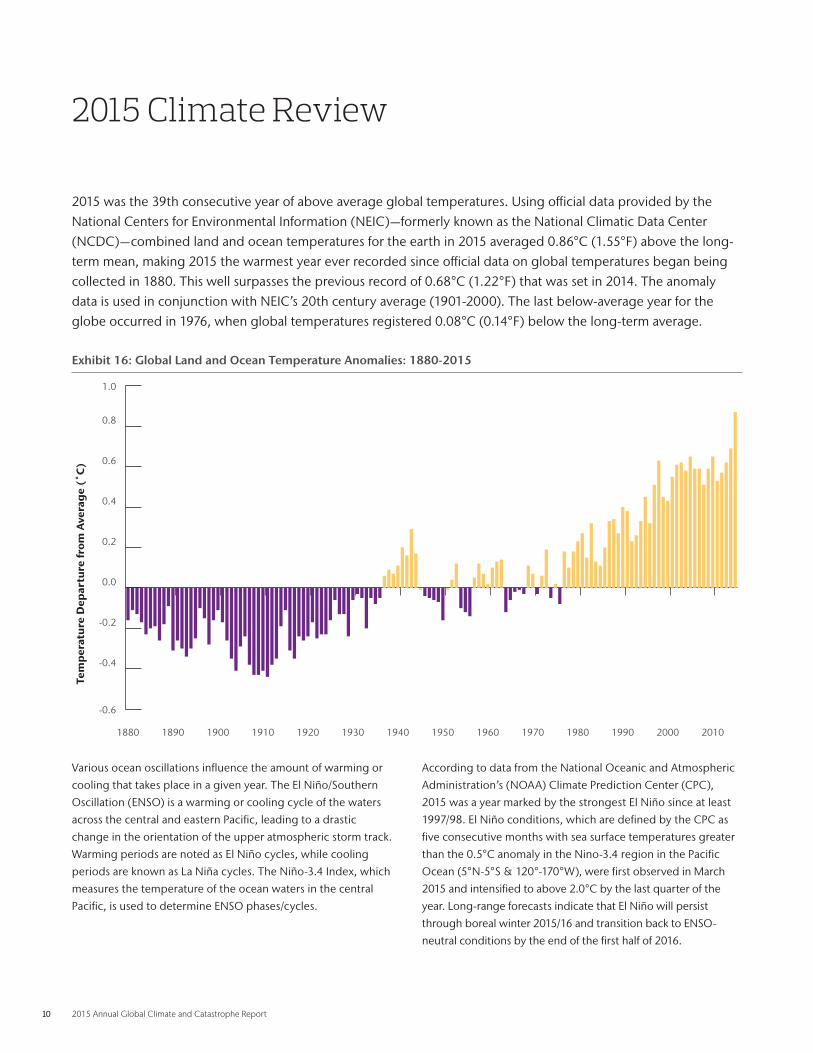
2015 was the 39th consecutive year of above average global temperatures . Using official data provided by the National Centers for Environmental Information (NEIC)—formerly known as the National Climatic Data Center (NCDC)—combined land and ocean temperatures for the earth in 2015 averaged 0 .86°C (1 .55°F) above the long-term mean, making 2015 the warmest year ever recorded since official data on global temperatures began being collected in 1880 . This well surpasses the previous record of 0 .68°C (1 .22°F) that was set in 2014 . The anomaly data is used in conjunction with NEIC’s 20th century average (1901-2000) . The last below-average year for the globe occurred in 1976, when global temperatures registered 0 .08°C (0 .14°F) below the long-term average .
Exhibit 16: Global Land and Ocean Temperature Anomalies: 1880-2015
Various ocean oscillations influence the amount of warming or
cooling that takes place in a given year . The El Niño/Southern
Oscillation (ENSO) is a warming or cooling cycle of the waters
across the central and eastern Pacific, leading to a drastic
change in the orientation of the upper atmospheric storm track .
Warming periods are noted as El Niño cycles, while cooling
periods are known as La Niña cycles . The Niño-3 .4 Index, which
measures the temperature of the ocean waters in the central
Pacific, is used to determine ENSO phases/cycles .
According to data from the National Oceanic and Atmospheric
Administration’s (NOAA) Climate Prediction Center (CPC),
2015 was a year marked by the strongest El Niño since at least
1997/98 . El Niño conditions, which are defined by the CPC as
five consecutive months with sea surface temperatures greater
than the 0 .5°C anomaly in the Nino-3 .4 region in the Pacific
Ocean (5°N-5°S & 120°-170°W), were first observed in March
2015 and intensified to above 2 .0°C by the last quarter of the
year . Long-range forecasts indicate that El Niño will persist
through boreal winter 2015/16 and transition back to ENSO-
neutral conditions by the end of the first half of 2016 .
Tem
per
atu
re D
epar
ture
from
Ave
rag
e (˚
C)
-0.6
-0.4
-0.2
0.0
0.2
0.4
0.6
0.8
1.0
20102000199019801970196019501940193019201910190018901880
Aon Benfield 11
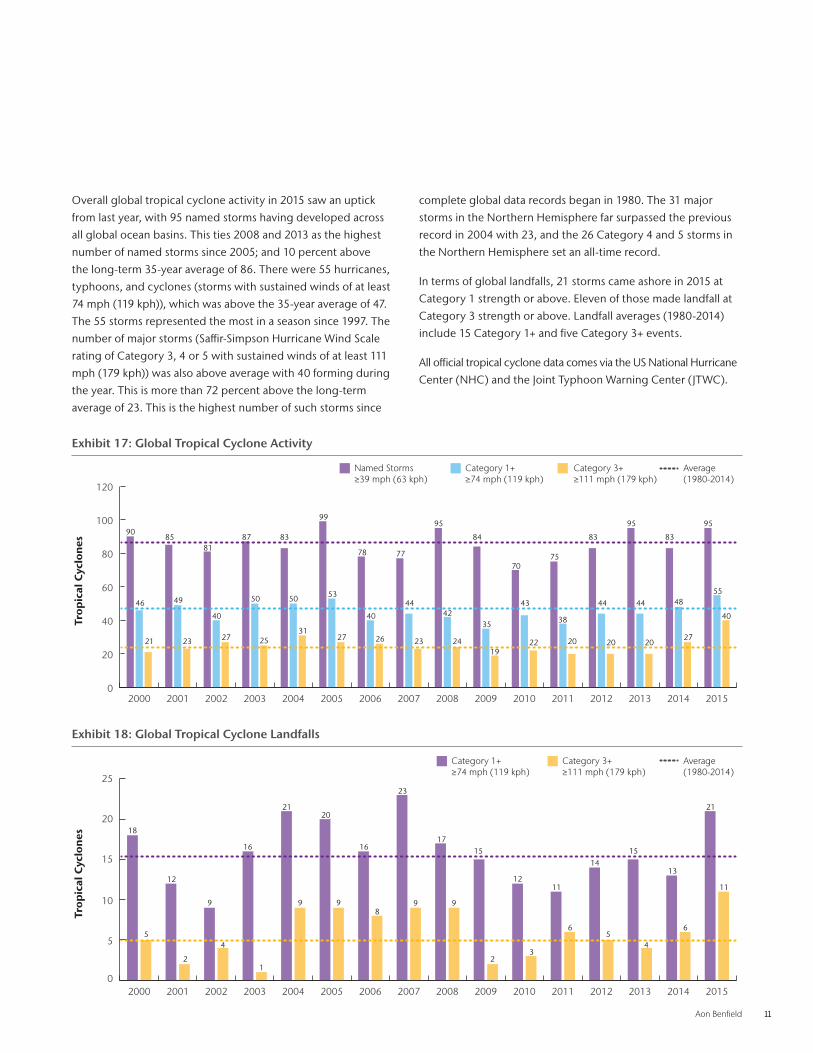
Overall global tropical cyclone activity in 2015 saw an uptick
from last year, with 95 named storms having developed across
all global ocean basins . This ties 2008 and 2013 as the highest
number of named storms since 2005; and 10 percent above
the long-term 35-year average of 86 . There were 55 hurricanes,
typhoons, and cyclones (storms with sustained winds of at least
74 mph (119 kph)), which was above the 35-year average of 47 .
The 55 storms represented the most in a season since 1997 . The
number of major storms (Saffir-Simpson Hurricane Wind Scale
rating of Category 3, 4 or 5 with sustained winds of at least 111
mph (179 kph)) was also above average with 40 forming during
the year . This is more than 72 percent above the long-term
average of 23 . This is the highest number of such storms since
complete global data records began in 1980 . The 31 major
storms in the Northern Hemisphere far surpassed the previous
record in 2004 with 23, and the 26 Category 4 and 5 storms in
the Northern Hemisphere set an all-time record .
In terms of global landfalls, 21 storms came ashore in 2015 at
Category 1 strength or above . Eleven of those made landfall at
Category 3 strength or above . Landfall averages (1980-2014)
include 15 Category 1+ and five Category 3+ events .
All official tropical cyclone data comes via the US National Hurricane
Center (NHC) and the Joint Typhoon Warning Center (JTWC) .
Exhibit 17: Global Tropical Cyclone Activity
Exhibit 18: Global Tropical Cyclone Landfalls
0
20
40
60
80
100
120
2015201420132012201120102009200820072006200520042003200220012000
Trop
ical
Cyc
lon
es
Category 3+≥111 mph (179 kph)
Category 1+≥74 mph (119 kph)
Named Storms≥39 mph (63 kph)
Average(1980-2014)
90
46
21
85
49
23
81
40
27
87
50
25
83
50
31
99
53
27
78
40
26
77
44
23
42
24
35
19
70
43
22
75
38
20
83
44
20 20
44
95
83
48
27
95
55
40
84
95
Trop
ical
Cyc
lon
es
Category 3+≥111 mph (179 kph)
Category 1+≥74 mph (119 kph)
0
5
10
15
20
25
2015201420132012201120102009200820072006200520042003200220012000
Average(1980-2014)
9
18
5
12
2
9
4
16
1
21
9
20
16
8
23
9
17
9
15
2
12
3
11
6
14
5
15
4
13
6
21
11

12 2015 Annual Global Climate and Catastrophe Report
2015 Atlantic Ocean Hurricane Season ReviewThe 2015 Atlantic Hurricane Season was another relatively quiet
year, as it marked a record tenth consecutive season in which
the United States did not sustain a major hurricane (Category
3+) landfall . In terms of overall basin activity, it was a slightly
below average year as only 11 named storms developed . The
average of 12 . Four hurricanes (Category 1+) were recorded,
of which two strengthened into major hurricanes (Category
3+) . The 1980 to 2014 average number of hurricanes (Category
1+) is seven, and the long-term average for major hurricanes
(Category 3+) is three . The 2005 season continues to hold the
record for most hurricanes in a year when 15 formed .
The lack of activity in the Atlantic Basin was heavily influenced
by El Niño conditions in the Pacific Ocean . The El Niño
conditions brought stronger than normal vertical wind shear
to the Atlantic Ocean’s main development region and the
Caribbean Sea . Most of the season was also marked by below-
average sea surface temperatures in the Atlantic Ocean .
The 2015 Atlantic Hurricane Season began with Tropical Storm
Ana which developed nearly a month before the official start
of the season in early May . Ana made landfall near the North
Carolina-South Carolina border and became the earliest tropical
system on record to make landfall in the United States . Tropical
Storm Bill followed in mid-June, with the remnants bringing
periods of heavy rain to the Midwest and Plains .
One of the most notable storms of the season was August’s
Tropical Storm Erika, which went down as the deadliest and
costliest storm in the basin . Erika claimed 36 lives in Dominica
and left an economic damage bill of USD512 million in the
Caribbean . Major Hurricane Joaquin formed in September
and was the strongest and longest-lived hurricane of the
season . Joaquin caused major damage in the some of the lesser
populated Bahamian Islands where it lingered for nearly 48
hours as a Category 4 storm . It claimed 35 lives and prompted
an estimated USD50 million insured loss in the Bahamas and
Bermuda . Of note, moisture from Joaquin would feed into South
Carolina as part of a larger system that left historic flooding .
The Atlantic Hurricane Season officially runs from June 1 to
November 30 . For additional Atlantic Ocean Basin landfalling
tropical cyclone data (including US-specific information), see
Appendix D .
Exhibit 19: Atlantic Basin Tropical Cyclone Activity
Hu
rric
anes
Category 3+≥111 mph (179 kph)
Category 1+≥74 mph (119 kph)
Named Storms≥39 mph (63 kph)
0
5
10
15
20
25
30
2015201420132012201120102009200820072006200520042003200220012000
Average(1980-2014)
15 15 15 15 15
10
28
16 16
19 19 19
12
10
14
8
3
9 9 9
6 68 8
6
0
4 42 2 2 2 2 2 2
4
11
23 33
12
7 7
5 55
7
Aon Benfield 13
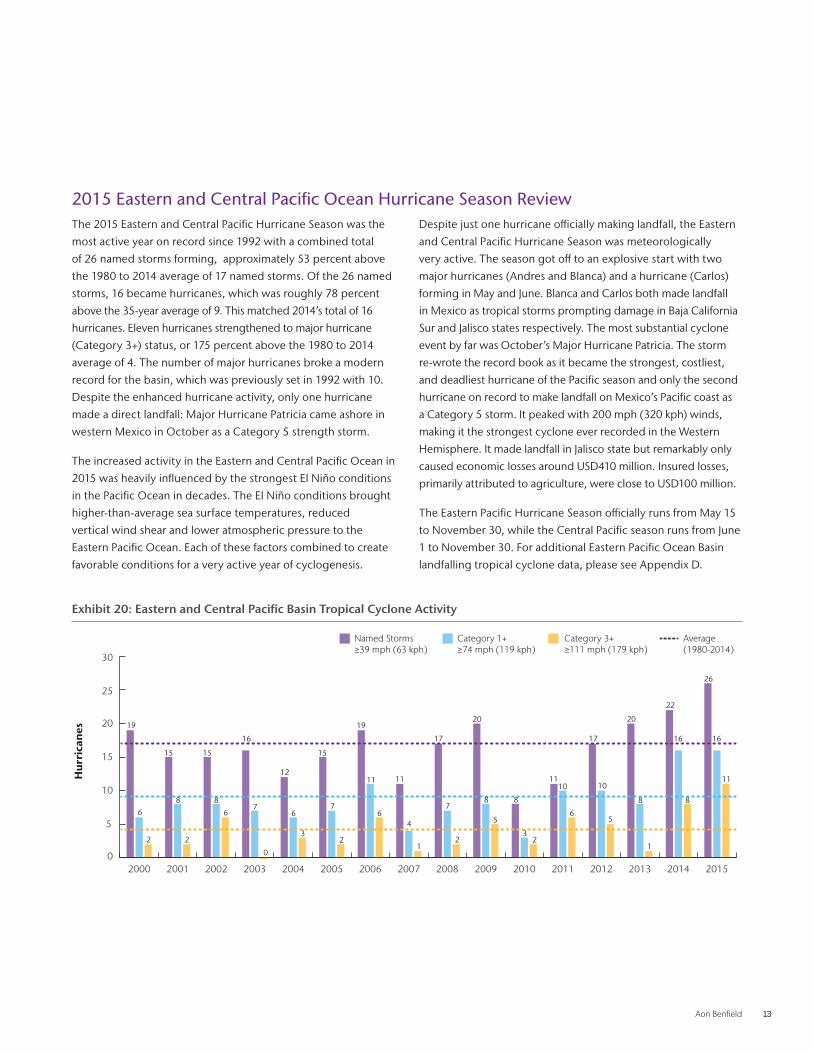
2015 Eastern and Central Pacific Ocean Hurricane Season ReviewThe 2015 Eastern and Central Pacific Hurricane Season was the
most active year on record since 1992 with a combined total
of 26 named storms forming, approximately 53 percent above
the 1980 to 2014 average of 17 named storms . Of the 26 named
storms, 16 became hurricanes, which was roughly 78 percent
above the 35-year average of 9 . This matched 2014’s total of 16
hurricanes . Eleven hurricanes strengthened to major hurricane
(Category 3+) status, or 175 percent above the 1980 to 2014
average of 4 . The number of major hurricanes broke a modern
record for the basin, which was previously set in 1992 with 10 .
Despite the enhanced hurricane activity, only one hurricane
made a direct landfall: Major Hurricane Patricia came ashore in
western Mexico in October as a Category 5 strength storm .
The increased activity in the Eastern and Central Pacific Ocean in
2015 was heavily influenced by the strongest El Niño conditions
in the Pacific Ocean in decades . The El Niño conditions brought
higher-than-average sea surface temperatures, reduced
vertical wind shear and lower atmospheric pressure to the
Eastern Pacific Ocean . Each of these factors combined to create
favorable conditions for a very active year of cyclogenesis .
Despite just one hurricane officially making landfall, the Eastern
and Central Pacific Hurricane Season was meteorologically
very active . The season got off to an explosive start with two
major hurricanes (Andres and Blanca) and a hurricane (Carlos)
forming in May and June . Blanca and Carlos both made landfall
in Mexico as tropical storms prompting damage in Baja California
Sur and Jalisco states respectively . The most substantial cyclone
event by far was October’s Major Hurricane Patricia . The storm
re-wrote the record book as it became the strongest, costliest,
and deadliest hurricane of the Pacific season and only the second
hurricane on record to make landfall on Mexico’s Pacific coast as
a Category 5 storm . It peaked with 200 mph (320 kph) winds,
making it the strongest cyclone ever recorded in the Western
Hemisphere . It made landfall in Jalisco state but remarkably only
caused economic losses around USD410 million . Insured losses,
primarily attributed to agriculture, were close to USD100 million .
The Eastern Pacific Hurricane Season officially runs from May 15
to November 30, while the Central Pacific season runs from June
1 to November 30 . For additional Eastern Pacific Ocean Basin
landfalling tropical cyclone data, please see Appendix D .
Exhibit 20: Eastern and Central Pacific Basin Tropical Cyclone Activity
Hu
rric
anes
0
5
10
15
20
25
30
2015201420132012201120102009200820072006200520042003200220012000
Category 3+≥111 mph (179 kph)
Category 1+≥74 mph (119 kph)
Named Storms≥39 mph (63 kph)
Average(1980-2014)
19
6
2
15
8
2
15
8
6
16
7
0
12
6
3
15
7
2
19
11
6
11
4
1
17
7
2
20
8
5
8
32
1110
6
17
10
5
20
8
1
22
26
1616
11
8
14 2015 Annual Global Climate and Catastrophe Report
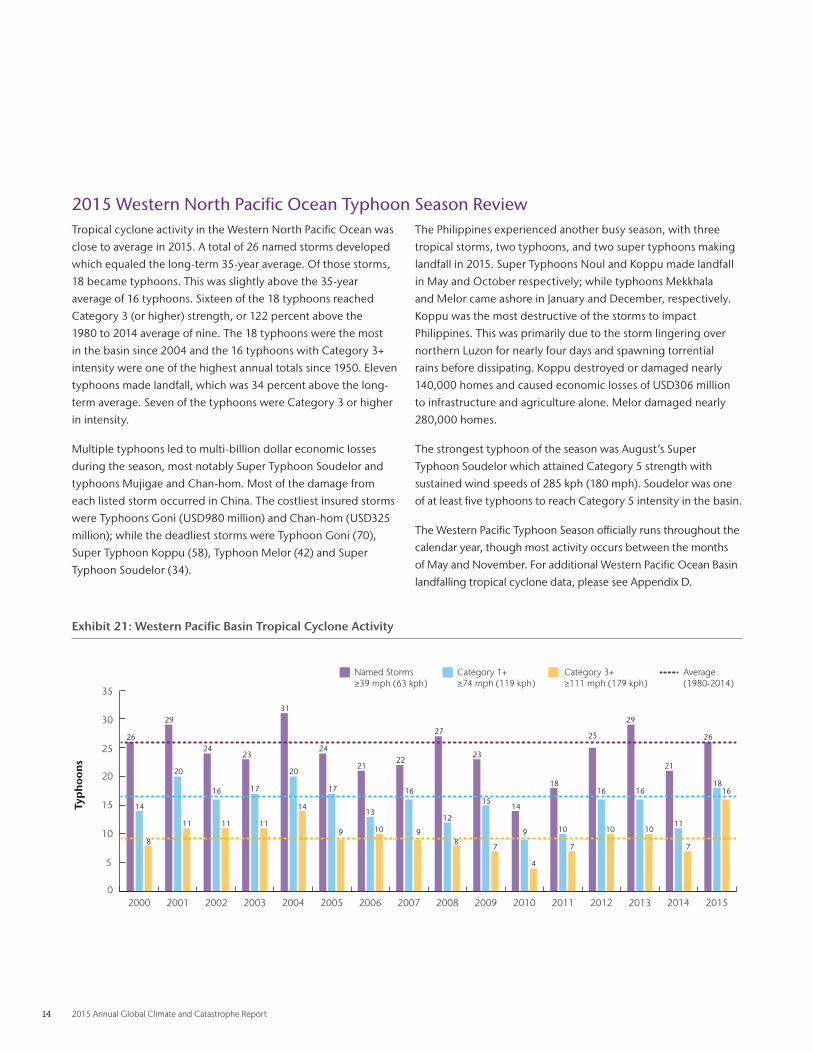
2015 Western North Pacific Ocean Typhoon Season ReviewTropical cyclone activity in the Western North Pacific Ocean was
close to average in 2015 . A total of 26 named storms developed
which equaled the long-term 35-year average . Of those storms,
18 became typhoons . This was slightly above the 35-year
average of 16 typhoons . Sixteen of the 18 typhoons reached
Category 3 (or higher) strength, or 122 percent above the
1980 to 2014 average of nine . The 18 typhoons were the most
in the basin since 2004 and the 16 typhoons with Category 3+
intensity were one of the highest annual totals since 1950 . Eleven
typhoons made landfall, which was 34 percent above the long-
term average . Seven of the typhoons were Category 3 or higher
in intensity .
Multiple typhoons led to multi-billion dollar economic losses
during the season, most notably Super Typhoon Soudelor and
typhoons Mujigae and Chan-hom . Most of the damage from
each listed storm occurred in China . The costliest insured storms
were Typhoons Goni (USD980 million) and Chan-hom (USD325
million); while the deadliest storms were Typhoon Goni (70),
Super Typhoon Koppu (58), Typhoon Melor (42) and Super
Typhoon Soudelor (34) .
The Philippines experienced another busy season, with three
tropical storms, two typhoons, and two super typhoons making
landfall in 2015 . Super Typhoons Noul and Koppu made landfall
in May and October respectively; while typhoons Mekkhala
and Melor came ashore in January and December, respectively .
Koppu was the most destructive of the storms to impact
Philippines . This was primarily due to the storm lingering over
northern Luzon for nearly four days and spawning torrential
rains before dissipating . Koppu destroyed or damaged nearly
140,000 homes and caused economic losses of USD306 million
to infrastructure and agriculture alone . Melor damaged nearly
280,000 homes .
The strongest typhoon of the season was August’s Super
Typhoon Soudelor which attained Category 5 strength with
sustained wind speeds of 285 kph (180 mph) . Soudelor was one
of at least five typhoons to reach Category 5 intensity in the basin .
The Western Pacific Typhoon Season officially runs throughout the
calendar year, though most activity occurs between the months
of May and November . For additional Western Pacific Ocean Basin
landfalling tropical cyclone data, please see Appendix D .
Exhibit 21: Western Pacific Basin Tropical Cyclone Activity
Typ
hoo
ns
0
5
10
15
20
25
30
35
2015201420132012201120102009200820072006200520042003200220012000
Category 3+≥111 mph (179 kph)
Category 1+≥74 mph (119 kph)
Named Storms≥39 mph (63 kph)
Average(1980-2014)
26
14
8
29
20
11
24
16
11
23
17
11
31
20
14
24
17
21
13
10
22
16
9
27
12
8
23
15
7
14
9
4
18
10
25
16
10
29
16
10
21
11
7
26
1816
7
9

Aon Benfield 15
2015 North Indian Ocean Cyclone Season ReviewThe North Indian Ocean Basin saw average tropical cyclone
activity in 2015 . Five named storms developed in the region
which matches the 1980 to 2014 average . Of those storms, two
cyclones formed, both of which strengthened to Category 3+
intensity . Based on the 35-year average, approximately two
cyclones (Category 1+) develop per year and one cyclone
strengthens to Category 3+ intensity . Two cyclones made landfall,
which is one more than the longer-term average of one .
The season was highlighted by Cyclones Chapala and Megh
which both made landfall in Yemen at the start of November . This
was unprecedented in the modern era—never before have two
tropical systems made landfall in the country in the same season .
Chapala formed first, attaining Category 4 hurricane strength
before weakening and coming ashore at Category 1 intensity . Megh
followed one week later, becoming a Category 3 strength storm
as it crossed Socotra Island . It weakened to tropical storm strength
before striking mainland Yemen . The storms wrought havoc on
Socotra and in Yemeni city of Mukalla, damaging a combined total
of almost 15,000 homes and claiming dozens of lives .
Two more named storms formed during the season: Cyclone
Ashobaa in June and Cyclone Komen in July . Both storms reached
tropical storm strength along with an un-named system that
formed in the Arabian Sea in October . Ashobaa triggered torrential
rainfall and flooding in eastern Oman while Komen enhanced
the southwest monsoonal system over portions of Myanmar and
Bangladesh prompting widespread flooding and damage .
The North Indian Ocean Cyclone Season officially runs
throughout the calendar year, though most activity occurs
between the months of April and December . For additional North
Indian Ocean Basin landfalling tropical cyclone data, please see
Appendix D .
Exhibit 22: North Indian Basin Tropical Cyclone Activity
Cyc
lon
es
0
1
2
3
4
5
6
7
8
2015201420132012201120102009200820072006200520042003200220012000
Category 3+≥111 mph (179 kph)
Category 1+≥74 mph (119 kph)
Named Storms≥39 mph (63 kph)
Average(1980-2014)
4
2
5 5
0
1 1
0 0
4 4
6
5
6
5 5
6
4 4
3
2 2 2
5 5
1 1
77
3
2 2
11 1 1 1 1
0 0 0 0
11
2
00 0

16 2015 Annual Global Climate and Catastrophe Report
2015 Southern Hemisphere Cyclone Season ReviewThe Southern Hemisphere saw slightly above average tropical
cyclone activity . A total of 27 named storms developed in the
region, which is just above the average of 26 since 1980 . Fifteen
cyclones (Category 1+) formed which was also just above the
1980-2014 average of 14 . Additionally, nine cyclones reached
Category 3+ strength, which is approximately 29 percent above
the 35-year average of seven, and three reached Category 5
strength . Out of the 15 Category 1+ cyclones, six made landfall:
three of which came ashore at Category 3 strength or higher .
Both of these figures were above the 1980-2014 averages of
three and one respectively .
Five tropical cyclones (Category 1+) made landfall in Australia:
Cyclone Lam was the strongest cyclone to make landfall in
Northern Territory in nine years when it came ashore in February
with 185 kph (115 mph) winds (Category 3); Cyclone Marcia
intensified rapidly prior to making landfall over Queensland as a
Category 4 storm, also in February . Cyclones Olwyn, Nathan, and
Quang would all eventually make separate landfalls in the country
at Category 1 intensity . Cyclone Marcia was the costliest of the
Australian cyclones prompting economic losses of USD650 million
and insured losses of USD402 million as it caused widespread wind
and flood damage over parts of southeastern Queensland .
Outside of Australia, the most significant cyclonic activity
occurred in Vanuatu where Cyclone Pam made landfall as a
Category 5-strength system in March . Pam was the most intense
Southern Hemisphere cyclone of the season and was one of the
strongest ever to form in the South Pacific Ocean . Pam’s wind
speeds peaked at 270 kph (165 mph) as it made its way through
the Vanuatu archipelago crippling the nation’s infrastructure
and damaging an estimated 90 percent of the properties . The
USD450 million economic cost equaled 64 percent of Vanuatu’s
GDP . The damaging storm surge and torrential rainfall generated
by the storm also impacted portions of Tuvalu, Solomon Islands,
Fiji, New Caledonia, and New Zealand .
The Southern Hemisphere Cyclone Season officially runs from
July 1 to June 30 . (The 2015 season ran from July 1, 2014 to
June 30, 2015 .) For additional Southern Hemisphere landfalling
tropical cyclone data, please see Appendix D
Exhibit 23: Southern Hemisphere Tropical Cyclone Activity
Cyc
lon
es
0
5
10
15
20
25
30
2015201420132012201120102009200820072006200520042003200220012000
Category 3+≥111 mph (179 kph)
Category 1+≥74 mph (119 kph)
Named Storms≥39 mph (63 kph)
Average(1980-2014)
26
16
8
21
11
5
12
8
25
28
17
11
21
14
8
26
13
9
23
10
7
23
15
9
2827
14
8 8
5
24
15
9
21
10
43
8
18
25
15
8
27
13
9
27
15
9

Aon Benfield 17
2015 United States Tornado Season ReviewTornado activity saw a slight uptick following three consecutive
years of declining touchdowns as more than 1,000 tornadoes
were recorded in the United States . The final tally in 2015
marked the first time since 2011 that tornadic activity surpassed
the 1,000 threshold . However, the years 2012 to 2015 were
markedly lower than 2011, which was one of the most active
years in history . A preliminary count from the Storm Prediction
Center (SPC) tallied 1,186 tornadoes in 2015, which was 34
percent above the 888 touchdowns in 2014 and a 31 percent
increase from the 907 in 2013 . 2015’s tally was three percent
below the Doppler Radar-era (1990-2014) average of 1,223 .
The use of Doppler radar, beginning in the early 1990s, has
led to markedly improved tornado detection . Because of this
improved detection, the observed annual average number of
tornadoes has risen, particularly with weaker tornadoes (EF0) .
There were 21 tornadoes rated EF3 or greater in 2015, with no
EF5 tornadoes touching down for the second consecutive year .
This compares to the 27 EF3 or greater tornadoes (0 EF5) that
struck the US in 2014 .
A total of 13 killer tornadoes (tornadoes that caused fatalities)
occurred across the United States in 2015 . This is one below
the 14 sustained in 2014 . The killer tornadoes of 2015 left 34
people dead, which was 51 percent below the 35-year average
of 69 . This marked the fewest number of US tornado fatalities
since 2009 . Tornado-related fatalities tallied 47 in 2014 . The vast
majority of the tornado fatalities in 2015 occurred during the
month of December with 24 . Additional fatalities were recorded
in May, March, and April .
The deadliest twister of the year occurred on December 23
as a powerful EF4 tornado ravaged portions of Mississippi
and Tennessee and left nine people dead . Another deadly
tornado on December 26 left eight people dead in the greater
Dallas, TX metro region . The 2015 fatality by state breakdown
includes: Texas (15), Mississippi (11), Tennessee (2), Arkansas (2),
Oklahoma (2), Illinois (2) .
For additional United States tornado data, including a look at a
breakdown of tornado frequencies by month and during ENSO
cycles, please see Appendix E .
Exhibit 24: United States Tornado Activity
Tota
l Tor
nad
os
0
200
400
600
800
1,000
1,200
1,400
1,600
1,800
2,000
2015201420132012201120102009200820072006200520042003200220012000
1,0751,215
934
1,374
1,817
1,265
1,103 1,096
1,692
1,156
1,282
1,691
938 907 888
1,186
U.S. Tornados Average Tornados(1980-2014)
18 2015 Annual Global Climate and Catastrophe Report
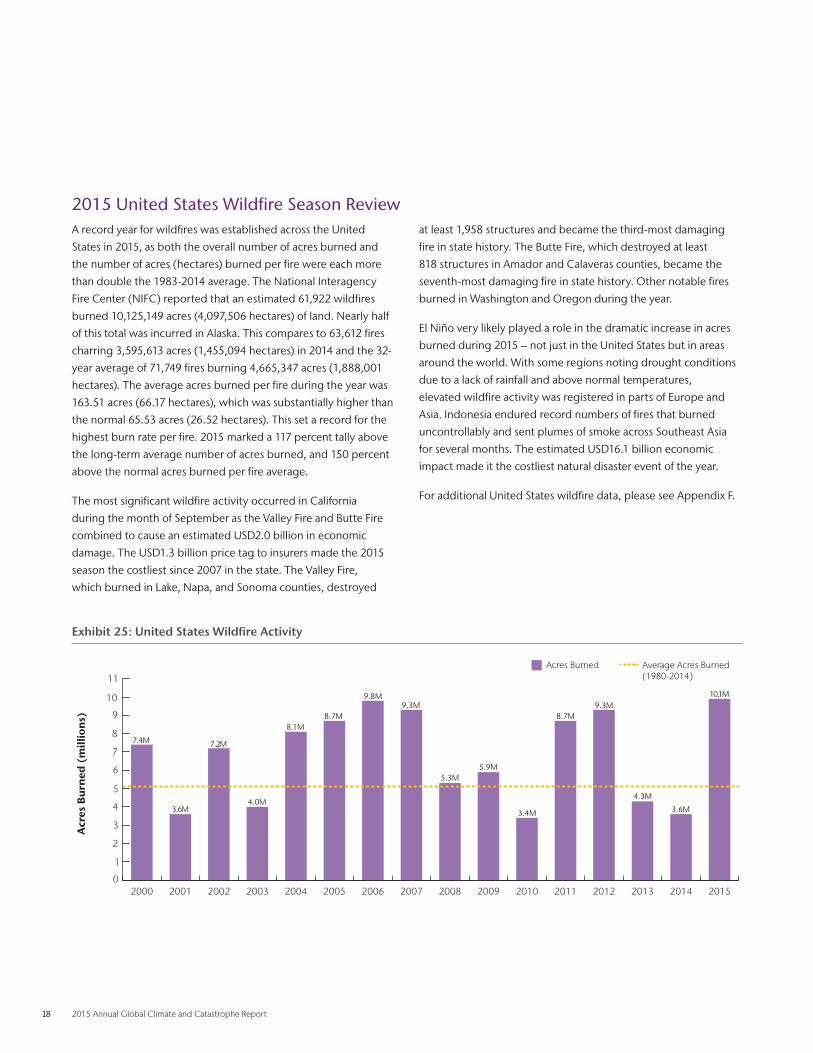
2015 United States Wildfire Season ReviewA record year for wildfires was established across the United
States in 2015, as both the overall number of acres burned and
the number of acres (hectares) burned per fire were each more
than double the 1983-2014 average . The National Interagency
Fire Center (NIFC) reported that an estimated 61,922 wildfires
burned 10,125,149 acres (4,097,506 hectares) of land . Nearly half
of this total was incurred in Alaska . This compares to 63,612 fires
charring 3,595,613 acres (1,455,094 hectares) in 2014 and the 32-
year average of 71,749 fires burning 4,665,347 acres (1,888,001
hectares) . The average acres burned per fire during the year was
163 .51 acres (66 .17 hectares), which was substantially higher than
the normal 65 .53 acres (26 .52 hectares) . This set a record for the
highest burn rate per fire . 2015 marked a 117 percent tally above
the long-term average number of acres burned, and 150 percent
above the normal acres burned per fire average .
The most significant wildfire activity occurred in California
during the month of September as the Valley Fire and Butte Fire
combined to cause an estimated USD2 .0 billion in economic
damage . The USD1 .3 billion price tag to insurers made the 2015
season the costliest since 2007 in the state . The Valley Fire,
which burned in Lake, Napa, and Sonoma counties, destroyed
at least 1,958 structures and became the third-most damaging
fire in state history . The Butte Fire, which destroyed at least
818 structures in Amador and Calaveras counties, became the
seventh-most damaging fire in state history . Other notable fires
burned in Washington and Oregon during the year .
El Niño very likely played a role in the dramatic increase in acres
burned during 2015 – not just in the United States but in areas
around the world . With some regions noting drought conditions
due to a lack of rainfall and above normal temperatures,
elevated wildfire activity was registered in parts of Europe and
Asia . Indonesia endured record numbers of fires that burned
uncontrollably and sent plumes of smoke across Southeast Asia
for several months . The estimated USD16 .1 billion economic
impact made it the costliest natural disaster event of the year .
For additional United States wildfire data, please see Appendix F .
Exhibit 25: United States Wildfire Activity
Acr
es B
urn
ed (
mill
ion
s)
0
1
2
3
4
5
6
7
8
9
10
11
2015201420132012201120102009200820072006200520042003200220012000
7.4M
3.6M
7.2M
4.0M
8.1M8.7M
9.8M9.3M
5.3M5.9M
3.4M
8.7M9.3M
4.3M
3.6M
10.1M
Acres Burned Average Acres Burned(1980-2014)

Aon Benfield 19
2015 Global Earthquake ReviewThe number of recorded global earthquakes (≥M6 .0) was
slightly above average in 2015 . Based on data from the United
States Geological Survey’s (USGS) National Earthquake
Information Center (NEIC) and the Advanced National Seismic
System (ANSS), there were 144 earthquakes with magnitudes
greater than 6 .0, 20 earthquakes with magnitudes greater than
7 .0 and 1 earthquake with a magnitude greater than 8 .0 . This
compares to the 155 (≥M6 .0), 12 (≥M7 .0) and one (≥M8 .0)
seen in 2014, and the 1980-2014 averages of 142 (≥M6 .0), 14
(≥M7 .0) and one (≥M8 .0) .
The strongest earthquake of the year was a magnitude-8 .3
tremor that struck just offshore from Chile’s Coquimbo Region
on September 16 . Despite the megathrust event being felt
throughout numerous South American countries, damage was
much less that initially anticipated given outstanding building
codes and the structural integrity of homes and businesses in Chile .
Small tsunami waves were observed along the coasts of Chile,
Peru, Ecuador, and elsewhere across parts of the Pacific Ocean .
The deadliest earthquakes of the year struck Nepal on April 25
and May 12 . The magnitude-7 .8 and magnitude-7 .3 temblors
left a combined total of 9,120 individuals dead throughout
Nepal, India, China, and Bangladesh . More than 850,000
residences and other buildings, including irreplaceable
world heritage sites, were damaged or destroyed . This pair
of earthquakes was also the year’s economically costliest
(USD8 .0 billion) for the peril . The highest insured loss from an
earthquake was the USD600 million tally accumulated following
the magnitude-8 .3 quake that struck Chile in September .
As shown during the past 10 years in Exhibit 26, overall
earthquake activity does not tend to show large fluctuations
on an annual basis . The USGS cites that a substantial increase
in seismograph stations and continued improvements in global
technology and communication has greatly strengthened the
quality of earthquake data collection . It should also be noted
that despite fluctuations in the number of total earthquakes
since the early 1900s, the number of recorded major earthquakes
(≥M7 .0) have remained fairly consistent on a year-to-year basis .
Exhibit 26: Global Earthquake Activity ≥M6.0
Eart
hq
uak
es
Magnitude 8.0+Magnitude 6.0+
0
50
100
150
200
250
2015201420132012201120102009200820072006200520042003200220012000
Average(1980-2014)
Magnitude 7.0+
161
137 140155 157 151 153
196
180
161174
205
133 143155
144
20 2015 Annual Global Climate and Catastrophe Report
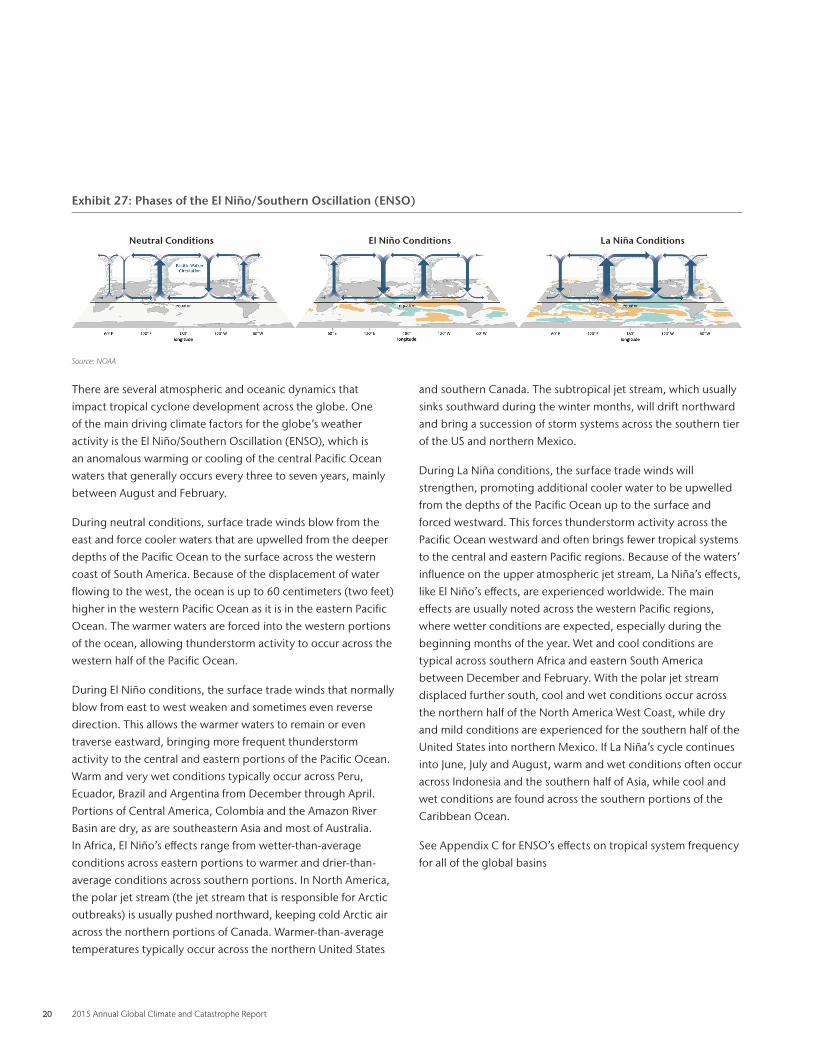
Exhibit 27: Phases of the El Niño/Southern Oscillation (ENSO)
Source: NOAA
There are several atmospheric and oceanic dynamics that
impact tropical cyclone development across the globe . One
of the main driving climate factors for the globe’s weather
activity is the El Niño/Southern Oscillation (ENSO), which is
an anomalous warming or cooling of the central Pacific Ocean
waters that generally occurs every three to seven years, mainly
between August and February .
During neutral conditions, surface trade winds blow from the
east and force cooler waters that are upwelled from the deeper
depths of the Pacific Ocean to the surface across the western
coast of South America . Because of the displacement of water
flowing to the west, the ocean is up to 60 centimeters (two feet)
higher in the western Pacific Ocean as it is in the eastern Pacific
Ocean . The warmer waters are forced into the western portions
of the ocean, allowing thunderstorm activity to occur across the
western half of the Pacific Ocean .
During El Niño conditions, the surface trade winds that normally
blow from east to west weaken and sometimes even reverse
direction . This allows the warmer waters to remain or even
traverse eastward, bringing more frequent thunderstorm
activity to the central and eastern portions of the Pacific Ocean .
Warm and very wet conditions typically occur across Peru,
Ecuador, Brazil and Argentina from December through April .
Portions of Central America, Colombia and the Amazon River
Basin are dry, as are southeastern Asia and most of Australia .
In Africa, El Niño’s effects range from wetter-than-average
conditions across eastern portions to warmer and drier-than-
average conditions across southern portions . In North America,
the polar jet stream (the jet stream that is responsible for Arctic
outbreaks) is usually pushed northward, keeping cold Arctic air
across the northern portions of Canada . Warmer-than-average
temperatures typically occur across the northern United States
and southern Canada . The subtropical jet stream, which usually
sinks southward during the winter months, will drift northward
and bring a succession of storm systems across the southern tier
of the US and northern Mexico .
During La Niña conditions, the surface trade winds will
strengthen, promoting additional cooler water to be upwelled
from the depths of the Pacific Ocean up to the surface and
forced westward . This forces thunderstorm activity across the
Pacific Ocean westward and often brings fewer tropical systems
to the central and eastern Pacific regions . Because of the waters’
influence on the upper atmospheric jet stream, La Niña’s effects,
like El Niño’s effects, are experienced worldwide . The main
effects are usually noted across the western Pacific regions,
where wetter conditions are expected, especially during the
beginning months of the year . Wet and cool conditions are
typical across southern Africa and eastern South America
between December and February . With the polar jet stream
displaced further south, cool and wet conditions occur across
the northern half of the North America West Coast, while dry
and mild conditions are experienced for the southern half of the
United States into northern Mexico . If La Niña’s cycle continues
into June, July and August, warm and wet conditions often occur
across Indonesia and the southern half of Asia, while cool and
wet conditions are found across the southern portions of the
Caribbean Ocean .
See Appendix C for ENSO’s effects on tropical system frequency
for all of the global basins
Neutral Conditions El Niño Conditions La Niña Conditions

Aon Benfield 21
Atlantic Hurricane Season ForecastsHistorical PredictionsAbundant media coverage is given to various organizations
across the world that issue hurricane season predictions for the
Atlantic Ocean Basin . These organizations utilize meteorological
and climatic data obtained, in some instances, up to six months
in advance to determine how active or inactive the Atlantic
Hurricane Season will be in the upcoming year . Several different
professional entities issue these forecasts, ranging from
governmental agencies to universities to private companies .
Three organizations which consistently make their forecasts
available to the public are:
§ Colorado State University (CSU), a forecast group sponsored
by Colorado State University and private companies that is
led by Dr . Philip Klotzbach and Dr . William Gray
§ The National Oceanic and Atmospheric Administration
(NOAA), the United States’ official governmental
climatological and meteorological office
§ Tropical Storm Risk (TSR), an Aon Benfield-sponsored forecast
group based in London, England led by Professor Mark
Saunders and Dr . Adam Lea
Some of these entities disclose in detail the parameters being
used to derive these forecasts, while others cite general factors
for the reasoning of their predictions . CSU and TSR provide
specific numbers for each year’s forecasts, while NOAA provides
a range of values .
The forecasts for the last five years made between the period of
in late May and early June, along with the actual total number
of named storms, hurricanes and major hurricanes are shown in
the following tables . The May/June forecast was chosen due to
the availability of forecasts from each organization . Additionally,
a five-year cumulative forecast is shown to emphasize that
long-term forecasting may yield more information on general
frequency shifts than short-term forecasting
Exhibit 28: 2015 Forecasts
May/June Atlantic Hurricane Season Forecast
Forecast Parameter 1980-2015 Average CSU NOAA TSR 2015 Season Total
Named Storms 12 8 6 – 10 10 11
Hurricanes 7 3 1 – 4 4 4
Major Hurricanes 3 1 0 – 1 1 2
Exhibit 29: Five-Year Average Forecasts
May/June Atlantic Hurricane Season Forecast
Forecast Parameter 1980-2015 Average CSU NOAA TSR 5-Year Season
Avg .
Named Storms 12 13 10 – 15 13 14
Hurricanes 7 6 4 – 8 6 6
Major Hurricanes 3 3 2 – 4 3 2
22 2015 Annual Global Climate and Catastrophe Report
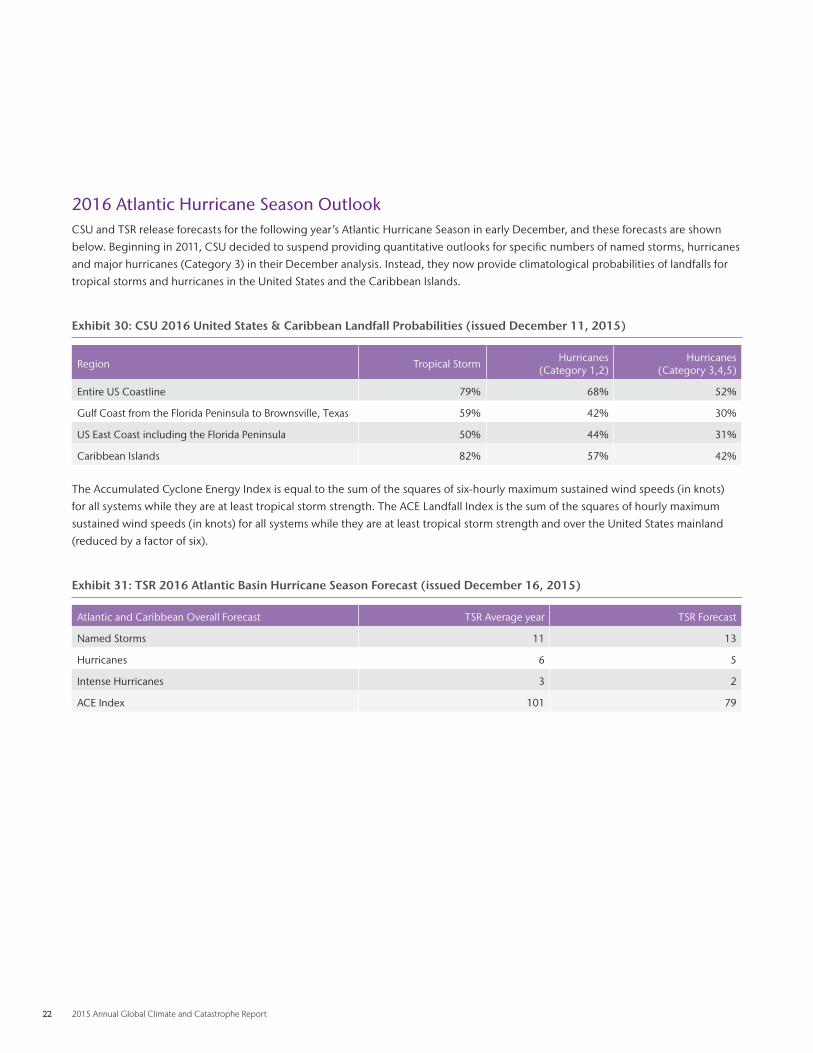
2016 Atlantic Hurricane Season OutlookCSU and TSR release forecasts for the following year’s Atlantic Hurricane Season in early December, and these forecasts are shown
below . Beginning in 2011, CSU decided to suspend providing quantitative outlooks for specific numbers of named storms, hurricanes
and major hurricanes (Category 3) in their December analysis . Instead, they now provide climatological probabilities of landfalls for
tropical storms and hurricanes in the United States and the Caribbean Islands .
Exhibit 30: CSU 2016 United States & Caribbean Landfall Probabilities (issued December 11, 2015)
Region Tropical Storm Hurricanes (Category 1,2)
Hurricanes (Category 3,4,5)
Entire US Coastline 79% 68% 52%
Gulf Coast from the Florida Peninsula to Brownsville, Texas 59% 42% 30%
US East Coast including the Florida Peninsula 50% 44% 31%
Caribbean Islands 82% 57% 42%
The Accumulated Cyclone Energy Index is equal to the sum of the squares of six-hourly maximum sustained wind speeds (in knots)
for all systems while they are at least tropical storm strength . The ACE Landfall Index is the sum of the squares of hourly maximum
sustained wind speeds (in knots) for all systems while they are at least tropical storm strength and over the United States mainland
(reduced by a factor of six) .
Exhibit 31: TSR 2016 Atlantic Basin Hurricane Season Forecast (issued December 16, 2015)
Atlantic and Caribbean Overall Forecast TSR Average year TSR Forecast
Named Storms 11 13
Hurricanes 6 5
Intense Hurricanes 3 2
ACE Index 101 79
Aon Benfield 23
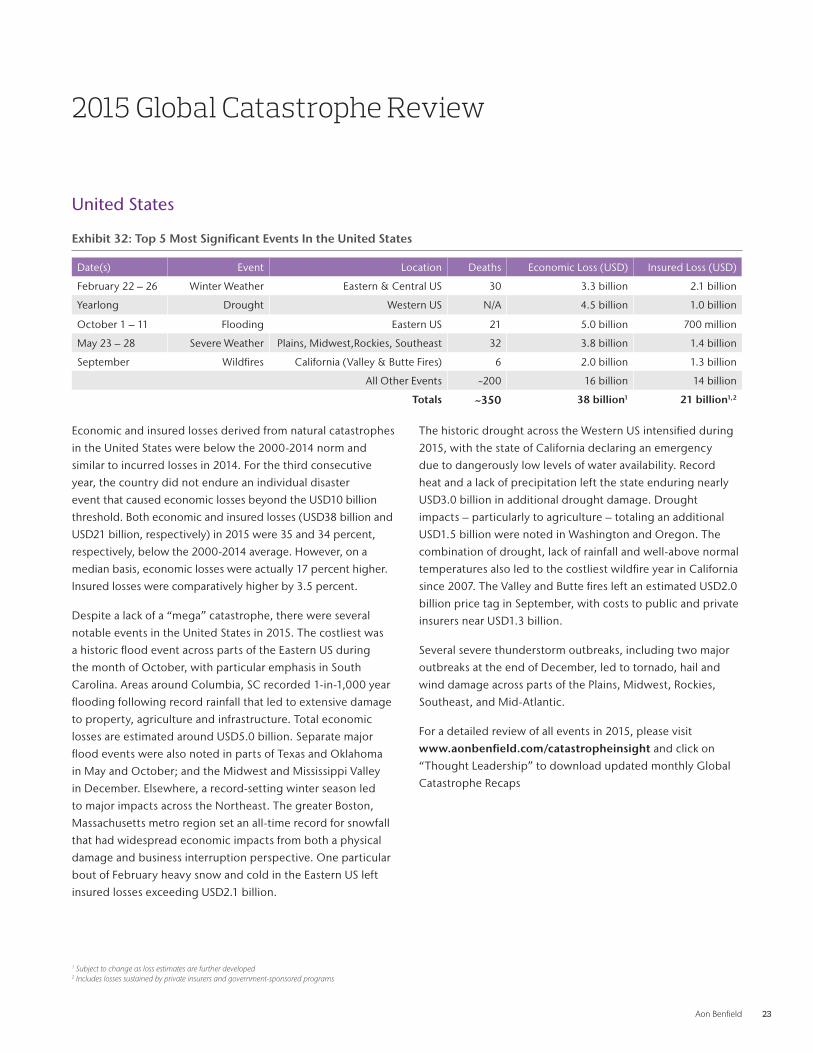
United States
Exhibit 32: Top 5 Most Significant Events In the United States
Date(s) Event Location Deaths Economic Loss (USD) Insured Loss (USD)
February 22 – 26 Winter Weather Eastern & Central US 30 3 .3 billion 2 .1 billion
Yearlong Drought Western US N/A 4 .5 billion 1 .0 billion
October 1 – 11 Flooding Eastern US 21 5 .0 billion 700 million
May 23 – 28 Severe Weather Plains, Midwest,Rockies, Southeast 32 3 .8 billion 1 .4 billion
September Wildfires California (Valley & Butte Fires) 6 2 .0 billion 1 .3 billion
All Other Events ~200 16 billion 14 billion
Totals ~350 38 billion1 21 billion1,2
Economic and insured losses derived from natural catastrophes
in the United States were below the 2000-2014 norm and
similar to incurred losses in 2014 . For the third consecutive
year, the country did not endure an individual disaster
event that caused economic losses beyond the USD10 billion
threshold . Both economic and insured losses (USD38 billion and
USD21 billion, respectively) in 2015 were 35 and 34 percent,
respectively, below the 2000-2014 average . However, on a
median basis, economic losses were actually 17 percent higher .
Insured losses were comparatively higher by 3 .5 percent .
Despite a lack of a “mega” catastrophe, there were several
notable events in the United States in 2015 . The costliest was
a historic flood event across parts of the Eastern US during
the month of October, with particular emphasis in South
Carolina . Areas around Columbia, SC recorded 1-in-1,000 year
flooding following record rainfall that led to extensive damage
to property, agriculture and infrastructure . Total economic
losses are estimated around USD5 .0 billion . Separate major
flood events were also noted in parts of Texas and Oklahoma
in May and October; and the Midwest and Mississippi Valley
in December . Elsewhere, a record-setting winter season led
to major impacts across the Northeast . The greater Boston,
Massachusetts metro region set an all-time record for snowfall
that had widespread economic impacts from both a physical
damage and business interruption perspective . One particular
bout of February heavy snow and cold in the Eastern US left
insured losses exceeding USD2 .1 billion .
The historic drought across the Western US intensified during
2015, with the state of California declaring an emergency
due to dangerously low levels of water availability . Record
heat and a lack of precipitation left the state enduring nearly
USD3 .0 billion in additional drought damage . Drought
impacts – particularly to agriculture – totaling an additional
USD1 .5 billion were noted in Washington and Oregon . The
combination of drought, lack of rainfall and well-above normal
temperatures also led to the costliest wildfire year in California
since 2007 . The Valley and Butte fires left an estimated USD2 .0
billion price tag in September, with costs to public and private
insurers near USD1 .3 billion .
Several severe thunderstorm outbreaks, including two major
outbreaks at the end of December, led to tornado, hail and
wind damage across parts of the Plains, Midwest, Rockies,
Southeast, and Mid-Atlantic .
For a detailed review of all events in 2015, please visit
www.aonbenfield.com/catastropheinsight and click on
“Thought Leadership” to download updated monthly Global
Catastrophe Recaps
2015 Global Catastrophe Review
1 Subject to change as loss estimates are further developed2 Includes losses sustained by private insurers and government-sponsored programs

24 2015 Annual Global Climate and Catastrophe Report
Exhibit 33: United States Economic and Insured Losses
Since 1980, economic losses have increased 3 .2 percent annually on an inflation-adjusted basis in the United States . Insured losses have
increased at a slightly higher rate of 6 .3 percent . These upward trending losses can be attributed to inflation, increasing population
and risk exposure, and higher levels of insurance penetration . However, when analyzing loss data since 2000, US economic and insured
losses from natural disasters still show a positive trend but at a less pronounced rate (2 .2 and 4 .0 percent, respectively) . Much of the
decrease can be attributed to the recent decline in hurricane landfalls and the lack of a significant earthquake event .
Exhibit 34: United States Economic and Insured Losses as Percentage of GDP
When analyzing natural disaster losses as a percentage of US GDP (World Bank), the rate of growth since 1980 has increased annually
by 0 .9 percent for economic losses and 3 .9 percent for insured losses . However, during the past 15 years, there has been a slight
positive trend on both an economic (0 .7 percent) and insured (2 .5 percent) basis .
USD
Bill
ion
s (2
01
5)
Insured LossEconomic Loss
0
50
100
150
200
250
2015201420132012201120102009200820072006200520042003200220012000
219
33
1530
13
41
21
70
40
210
110
30
1522
12
82
48
2516
3020
79
49
137
64
40
2432
20
38
21
% o
f GD
P
Insured LossEconomic Loss
0%
0.30%
0.60%
0.90%
1.20%
1.50%
2015201420132012201120102009200820072006200520042003200220012000
.1%.1%
.2%
.1%
.2%
.1%
.3%
.1%
.5%
.3%
1.3%
.7%
.2%
.1% .1%.1%
.5%
.3%
.2%
.1%
.2%
.1%
.5%
.3%
.8%
.4%
.2%
.1%
.2%
.1%
.2%
.1%

Aon Benfield 25
Exhibit 35: United States Economic Losses by Peril
The severe weather peril dominated economic losses in the United States in 2015, and was slightly above the peril’s 10-year average . It
was by far the costliest peril of the year . The other perils to endure above recent average levels of losses were winter weather, flooding
and wildfire . Tropical cyclone losses were largely minimal despite two tropical storm landfalls . During the past 10 years, losses associated
with tropical cyclones have been the predominant driver of damage costs in the US (especially in 2005, 2008, and 2012) .
Exhibit 36: United States Insured Losses by Peril
Losses from severe weather again accounted for the majority of insured losses in the United States in 2015 . The nearly USD12 billion
in insured losses was easily the costliest peril, though it only equaled the peril’s 10-year average . Insured winter weather losses were
above their recent average and at their highest levels in more than a decade . Wildfire and flood were above average, but the rest of
the major perils were below normal .
Please note that insured losses include those sustained by private insurers and government-sponsored programs such as the National
Flood Insurance Program and the Federal Crop Insurance Corporation (run by the USDA’s Risk Management Agency) .
0
5
10
15
20
25
30
35
OtherDroughtWildfireWinter WeatherEarthquakeFloodingSevere WeatherTropical Cyclone
USD
Bill
ion
s (2
01
5)
10 Year Average2015
0.1
32
20
18
5.9
3.95.8
0.20.0
3.52.3
1.0
4.5
9.2
0.1 0.5
0
5
10
15
20
OtherDroughtWildfireWinter WeatherEarthquakeFloodingSevere WeatherTropical Cyclone
USD
Bill
ion
s (2
01
5)
10 Year Average2015
16
0.0
12 12
3.1 2.8
0.0 0.0
3.7
1.81.3
0.51.0
4.1
0.0 0.3

26 2015 Annual Global Climate and Catastrophe Report
Exhibit 37: United States Billion-Dollar Economic Loss Events
There were 11 events that caused at least USD1 .0 billion in economic losses in 2015, which was above the 15-year average (9) .
An equal number of weather-related billion-dollar events occurred as well, which was one above the longer-term average . The
breakdown of billion-dollar events by peril included severe weather (7), winter weather (1), drought (1), wildfire (1), and flood (1) .
Exhibit 38: United States Billion-Dollar Insured Loss Events
There were five events that triggered insured losses beyond USD1 .0 billion in 2015, which was equal to the 2000-2014 average of five
and one less than 2014 . The same number of weather-related events was registered as well . The breakdown of billion-dollar events
included severe weather (3), winter weather (1), and drought (1) .
0
5
10
15
20
2015201420132012201120102009200820072006200520042003200220012000
Even
ts
Billion-Dollar Events (Weather)Billion-Dollar Events (All)
88
1010
66
45
44
66
99
44
1111
88
1111
1717
1111
99 910
1111
0
2
4
6
8
10
12
14
2015201420132012201120102009200820072006200520042003200220012000
Even
ts
Billion-Dollar Events (Weather)Billion-Dollar Events (All)
4 4 4 4 4 4
3 3
7 7
5 5 5 5
12 12
7 7
5 5
6 6
5 5
7 7
2 22 2
1 1

Aon Benfield 27
Americas (Non-U .S .)
Exhibit 39: Top 5 Most Significant Events in the Americas (Non-U.S.)
Date(s) Event Location Deaths Economic Loss (USD) Insured Loss (USD)
March 25 – April 8 Flooding Chile 25 1 .5 billion 450 million
September 16 Earthquake Chile 14 1 .5 billion 600 million
Yearlong Drought Canada N/A 1 .0 billion 600 million
August 27 – 29 Tropical Storm Erika Caribbean Islands 36 512 million 50 million
October 22 – 25 Hurricane Patricia Mexico 14 410 million 100 million
All Other Events ~1,300 2 .5 billion 1 .2 billion
Totals ~1,400 8.0 billion1 3.0 billion1,2
Economic and insured losses derived from natural catastrophes
in the Americas (Non-US) were below the 2000-2014 norm
and even lower than the incurred losses in 2014 . The region
has only incurred economic losses beyond USD20 billion
three times (2005, 2010, 2013) and insured losses beyond
USD10 billion once (2010) in the last 15 years . Economic losses
(USD8 .0 billion) in 2015 were 45 percent below the 2000-2014
average, though on a median basis, were only 4 .8 percent
lower . Insured losses (USD3 .0 billion) were actually 18 percent
above the recent average, and an even greater 70 percent
higher on a median basis .
Despite several high profile events that were recorded in the
Americas, none ended up causing catastrophic level of losses .
Three of the top four costliest events on an economic loss
basis occurred in Chile . The most significant was a major flood
event in the northern regions of Norte Grande and Norte
Chico in late March and early April that damaged or destroyed
more than 28,000 homes . On September 16, a magnitude-8 .3
earthquake struck just offshore the Coquimbo Region and
damaged thousands of structures . Most of the damage was
due to tsunami and not from ground shaking since Chile has
strict building codes that are among the best in the world .
Each of these two events caused USD1 .5 billion in damage .
The third event, the April volcanic eruption of Mount Calbuco,
left a USD600 million economic cost . Also in South America,
torrential December rains and flooding aided by El Niño
affected parts of Argentina, Paraguay, Uruguay, and Brazil .
Elsewhere, Canada endured several severe thunderstorm and
winter weather events during the year, though the costliest
event in the region was a billion-dollar drought that was most
intense in the West .
Multiple tropical cyclones impacted the Americas from
both the Atlantic and Pacific Ocean basins . The most
meteorologically significant event was Major Hurricane
Patricia, which came ashore in rural Mexico as a Category 5
storm in October . Patricia, which made landfall between the
cities of Manzanillo and Puerto Vallarta, narrowly avoided
causing catastrophic damage in the country . The storm led
to USD410 million in economic losses, most of which was
incurred to the agricultural sector . In the Caribbean, Tropical
Storm Erika caused damage on multiple islands, but most was
incurred on the island of Dominica . At USD 483 million, it was
the costliest event in the nation’s history . Major Hurricane
Joaquin caused heavy damage to sparsely populated Bahamian
islands and Bermuda though the economic cost was only
USD100 million .
From an insurance perspective, four events left more than
USD200 million in claims payouts by the insurance industry:
two each in Canada and Chile .
For a detailed review of all events in 2015, please visit
www.aonbenfield.com/catastropheinsight and click on
“Thought Leadership” to download updated monthly Global
Catastrophe Recaps .
1 Subject to change as loss estimates are further developed2 Includes losses sustained by private insurers and government-sponsored programs
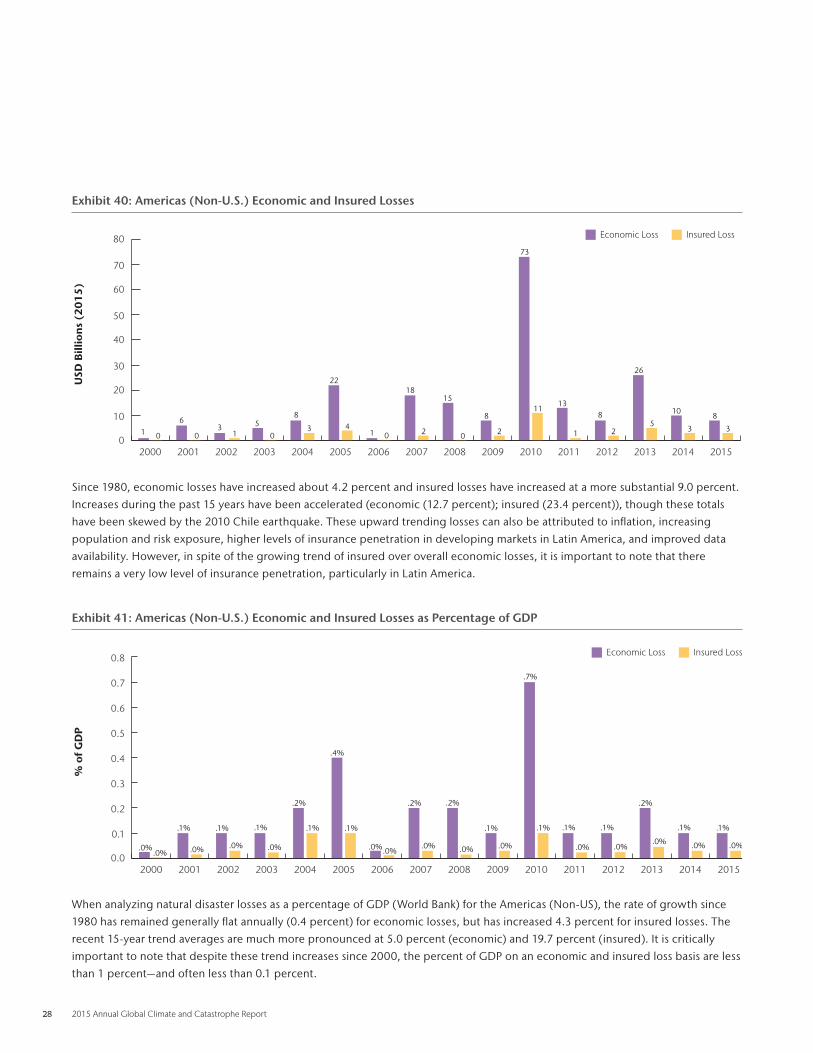
28 2015 Annual Global Climate and Catastrophe Report
Exhibit 40: Americas (Non-U.S.) Economic and Insured Losses
Since 1980, economic losses have increased about 4 .2 percent and insured losses have increased at a more substantial 9 .0 percent .
Increases during the past 15 years have been accelerated (economic (12 .7 percent); insured (23 .4 percent)), though these totals
have been skewed by the 2010 Chile earthquake . These upward trending losses can also be attributed to inflation, increasing
population and risk exposure, higher levels of insurance penetration in developing markets in Latin America, and improved data
availability . However, in spite of the growing trend of insured over overall economic losses, it is important to note that there
remains a very low level of insurance penetration, particularly in Latin America .
Exhibit 41: Americas (Non-U.S.) Economic and Insured Losses as Percentage of GDP
When analyzing natural disaster losses as a percentage of GDP (World Bank) for the Americas (Non-US), the rate of growth since
1980 has remained generally flat annually (0 .4 percent) for economic losses, but has increased 4 .3 percent for insured losses . The
recent 15-year trend averages are much more pronounced at 5 .0 percent (economic) and 19 .7 percent (insured) . It is critically
important to note that despite these trend increases since 2000, the percent of GDP on an economic and insured loss basis are less
than 1 percent—and often less than 0 .1 percent .
USD
Bill
ion
s (2
01
5)
Insured LossEconomic Loss
0
10
20
30
40
50
60
70
80
2015201420132012201120102009200820072006200520042003200220012000
1 0
6
03
15
0
8
3
22
41 0
18
2
15
0
8
2
73
1113
1
8
2
26
5
10
3
8
3
% o
f GD
P
Insured LossEconomic Loss
0.0
0.1
0.2
0.3
0.4
0.5
0.6
0.7
0.8
2015201420132012201120102009200820072006200520042003200220012000
.0%.0%
.1%
.0%
.1%
.0%
.1%
.0%
.2%
.1%
.4%
.1%
.0%.0%
.2%
.0%
.2%
.0%
.1%
.0%
.7%
.1% .1%
.0%
.1%
.0%
.2%
.0%
.1%
.0%
.1%
.0%

Aon Benfield 29
Exhibit 42: Americas (Non-U.S.) Economic Losses by Peril
Every major peril recorded economic losses below its ten year average in the region . Only the miscellaneous perils—dominated by
a volcanic eruption—were above normal . During the past ten years, the tropical cyclone, flood, and earthquake perils have been
the costliest on an annual basis . In 2015, flood was the costliest at just less than USD2 .0 billion .
Exhibit 43: Americas (Non-U.S.) Insured Losses by Peril
Insured losses were above the 10-year normal for multiple perils in 2015 . Losses from earthquake, drought, flood and severe
thunderstorm accounted for the highest percentage of payouts, though none of the perils saw aggregate losses in excess of
USD1 .0 billion . The longer-term averages further underscore the lack of insurance penetration in the Americas as only earthquake
has averaged at least USD1 .0 billion on an annual basis .
Please note that insured losses include those sustained by private insurers and government-sponsored programs .
0
1
2
3
4
5
6
7
8
OtherDroughtWildfireWinter WeatherEarthquakeFloodingSevere WeatherTropical Cyclone
USD
Bill
ion
s (2
01
5)
10 Year Average2015
1.0
6.3
0.91.1
2.5
5.3
1.5
4.7
0.00.2 0.2 0.2
1.21.6
0.6
0.0
0.0
0.2
0.4
0.6
0.8
1.0
OtherDroughtWildfireWinter WeatherEarthquakeFloodingSevere WeatherTropical Cyclone
USD
Bill
ion
s (2
01
5)
10 Year Average2015
0.2
0.7
0.5 0.5
0.6
0.4
0.6
1.0
0.0 0.0
0.1
0.6
0.1
0.00.0
0.0
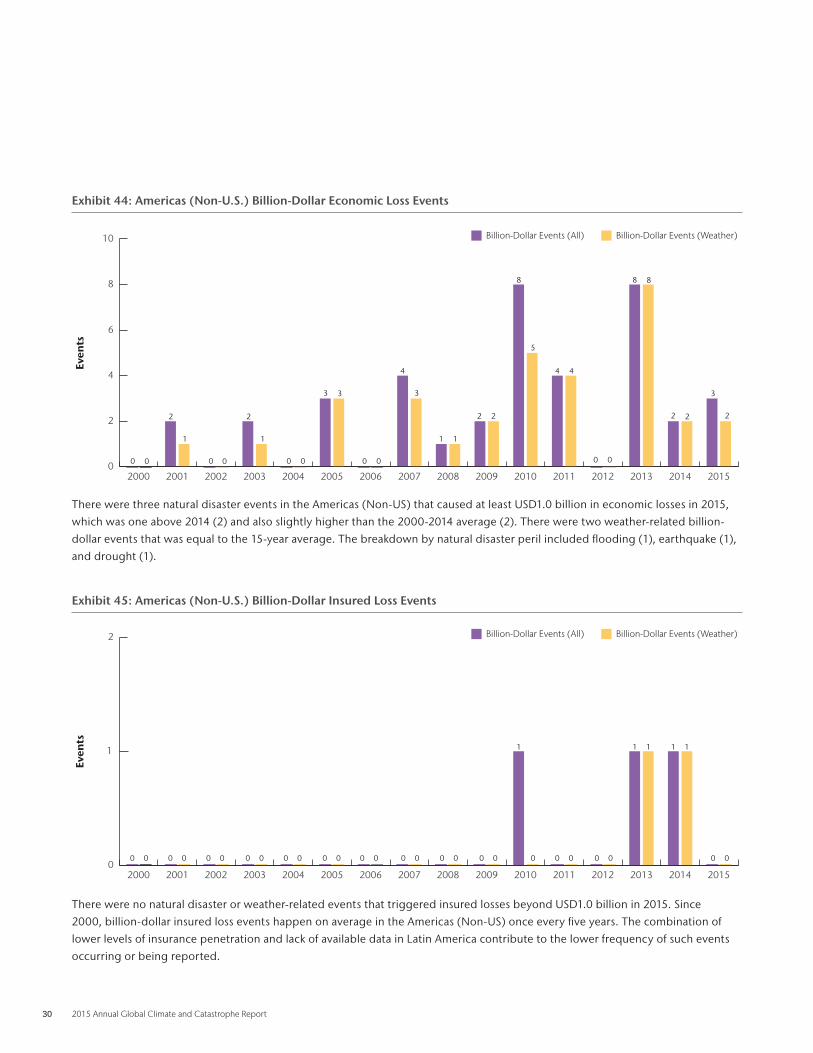
30 2015 Annual Global Climate and Catastrophe Report
Exhibit 44: Americas (Non-U.S.) Billion-Dollar Economic Loss Events
There were three natural disaster events in the Americas (Non-US) that caused at least USD1 .0 billion in economic losses in 2015,
which was one above 2014 (2) and also slightly higher than the 2000-2014 average (2) . There were two weather-related billion-
dollar events that was equal to the 15-year average . The breakdown by natural disaster peril included flooding (1), earthquake (1),
and drought (1) .
Exhibit 45: Americas (Non-U.S.) Billion-Dollar Insured Loss Events
There were no natural disaster or weather-related events that triggered insured losses beyond USD1 .0 billion in 2015 . Since
2000, billion-dollar insured loss events happen on average in the Americas (Non-US) once every five years . The combination of
lower levels of insurance penetration and lack of available data in Latin America contribute to the lower frequency of such events
occurring or being reported .
0
2
4
6
8
10
2015201420132012201120102009200820072006200520042003200220012000
Even
ts
Billion-Dollar Events (Weather)Billion-Dollar Events (All)
2
1
0 0 0 0 0 00 0
2
1
3 3
4
3
1 1
2 2
8
5
0 0
4 4
8 8
2 2
3
2
0
1
2
2015201420132012201120102009200820072006200520042003200220012000
Even
ts
Billion-Dollar Events (Weather)Billion-Dollar Events (All)
1 1 1 1 1
0 00 00 00 00 00 00 00 00 00 00 0 0 0 0 00

Aon Benfield 31
EMEA (Europe, Middle East & Africa)
Exhibit 46: Top 5 Most Significant Events in EMEA
Date(s) Event Location Deaths Economic Loss (USD)
Insured Loss (USD)
December 22 – 31 Flooding United Kingdom N/A 2 .5 billion 1 .3 billion
March 29 – April 1 Windstorms Mike & Niklas Western and Central Europe 9 1 .4 billion 1 .0 billion
October 3 – 4 Flooding France 19 1 .3 billion 725 million
July-December Drought South Africa N/A 2 .0 billion 25 million
January 9 – 11 Windstorms Elon & Felix Western and Northern Europe N/A 650 million 400 million
All Other Events 1,170 6 .5 billion 1 .1 billion
Totals ~1,250 16 billion1 5.0 billion1,2
Economic and insured losses derived from natural catastrophes
in EMEA were well below the 2000-2014 norm and the lowest
since 2011 . For the second consecutive year, the region did
not endure an individual disaster event that caused economic
losses beyond the USD5 .0 billion threshold . Economic losses
(USD16 billion) in 2015 were 35 percent below the 2000-2014
average and 28 percent below the median during the same
timeframe . Insured losses (USD5 .0billion) were comparatively
lower by a substantial 34 percent as compared to the 15-year
average and a slightly less 13 percent on a median basis .
From a pure economic cost standpoint, the most significant
events surrounded the drought peril as El Niño impacts led to
a reduction in precipitation across broad sections of Europe
and Africa . Three billion-dollar drought events were recorded
in the region in 2015, including two alone in Africa (South
Africa and Ethiopia) and one in Romania . The most considerable
impacts to the droughts were to the agricultural sector,
including concerns over food shortages in parts of Africa .
The most notable events in 2015, however, were primarily
attributed to the European Windstorm peril . A fairly active year
saw multiple storms impact western and northern portions of
the European continent . The one-two punch of windstorms
Mike and Niklas at the end of March and early April led to
an estimated USD1 .0 billion insured loss for the insurance
industry . Windstorm Ted (also known locally as Desmond) led
to extensive flooding in the northern UK as the Association
of British Insurers noted insured losses up to USD775 million .
Windstorms Elon, Felix, Heini, Nils, and Eckard also led
to widespread damage . Please note that for consistency
purposes, this report follows the naming convention by Free
University of Berlin .
Extensive flooding impacted the United Kingdom in December
as an active pattern brought substantial rainfall . Economic
losses were in the billions (USD) and insured losses alone
topped USD1 .0 billion . In France, a catastrophic flash flood
event in early October ravaged the French Riviera . Local insurers
noted damages reaching USD725 million given extensive
property damage to residential and commercial interests .
Perhaps the most unusual weather events during 2015 in EMEA
came in Yemen . Two tropical cyclones (Chapala and Megh)
made unprecedented November landfalls within one week’s
time that led to severe damage along coastal sections of the
Yemeni mainland and Socotra Island . Economic damages were
estimated into the hundreds of millions (USD), but relief and
aid organizations struggled to reach the hardest-hit areas
given geopolitical issues in the region .
For a detailed review of all events in 2015, please visit
www.aonbenfield.com/catastropheinsight and click on
“Thought Leadership” to download updated monthly Global
Catastrophe Recaps .
1 Subject to change as loss estimates are further developed2 Includes losses sustained by private insurers and government-sponsored programs
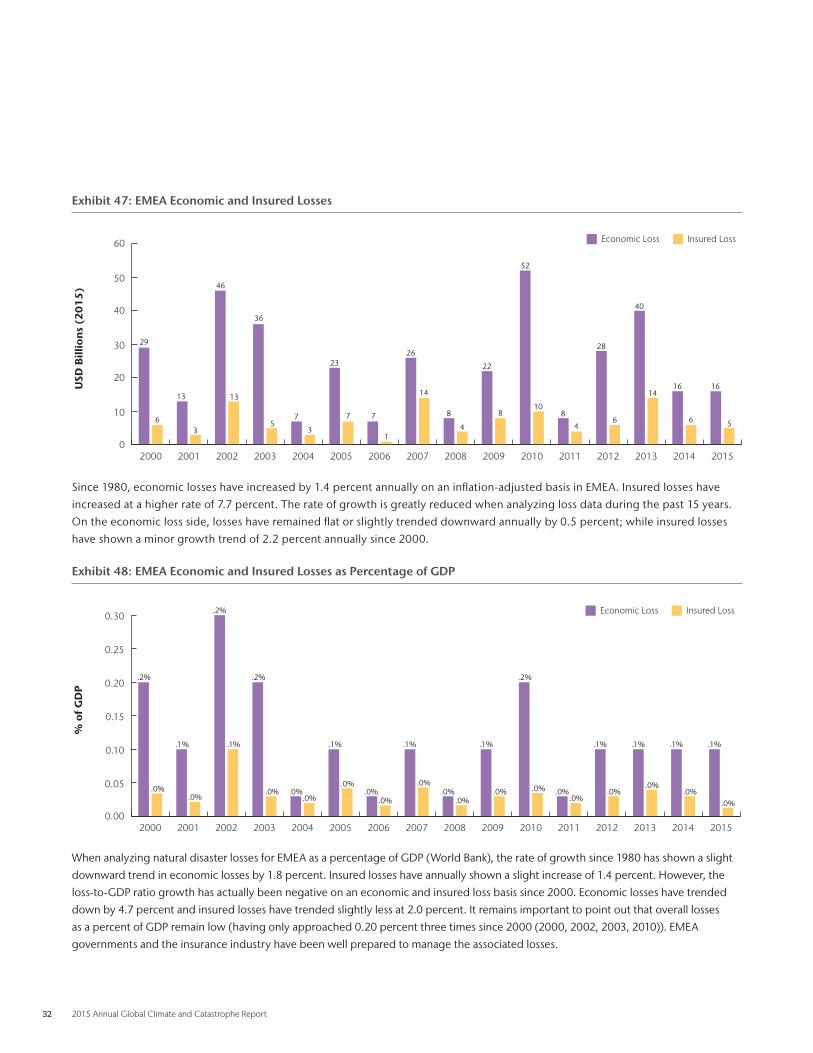
32 2015 Annual Global Climate and Catastrophe Report
Exhibit 47: EMEA Economic and Insured Losses
USD
Bill
ion
s (2
01
5)
Insured LossEconomic Loss
0
10
20
30
40
50
60
2015201420132012201120102009200820072006200520042003200220012000
29
6
13
3
46
13
36
57
3
23
7 7
1
26
14
8
4
22
8
52
108
4
28
6
40
1416
6
16
5
Since 1980, economic losses have increased by 1 .4 percent annually on an inflation-adjusted basis in EMEA . Insured losses have
increased at a higher rate of 7 .7 percent . The rate of growth is greatly reduced when analyzing loss data during the past 15 years .
On the economic loss side, losses have remained flat or slightly trended downward annually by 0 .5 percent; while insured losses
have shown a minor growth trend of 2 .2 percent annually since 2000 .
Exhibit 48: EMEA Economic and Insured Losses as Percentage of GDP
When analyzing natural disaster losses for EMEA as a percentage of GDP (World Bank), the rate of growth since 1980 has shown a slight
downward trend in economic losses by 1 .8 percent . Insured losses have annually shown a slight increase of 1 .4 percent . However, the
loss-to-GDP ratio growth has actually been negative on an economic and insured loss basis since 2000 . Economic losses have trended
down by 4 .7 percent and insured losses have trended slightly less at 2 .0 percent . It remains important to point out that overall losses
as a percent of GDP remain low (having only approached 0 .20 percent three times since 2000 (2000, 2002, 2003, 2010)) . EMEA
governments and the insurance industry have been well prepared to manage the associated losses .
% o
f GD
P
Insured LossEconomic Loss
0.00
0.05
0.10
0.15
0.20
0.25
0.30
2015201420132012201120102009200820072006200520042003200220012000
.2%
.0%
.1%
.0%
.2%
.1%
.2%
.0% .0%.0%
.1% .1% .1%
.2%
.1%
.0%.0%
.0%
.0%.0%
.0%.0% .0% .0%
.0%.0%
.1%
.0%
.1%
.0%
.1%
.0%

Aon Benfield 33
Exhibit 49: EMEA Economic Losses by Peril
0
1
2
3
4
5
6
7
8
OtherDroughtWildfireWinter WeatherEU WindstormEarthquakeFloodingSevere WeatherTropical Cyclone
USD
Bill
ion
s (2
01
5)
10 Year Average2015
0.3 0.30.6
2.2
4.0
8.0
0.0
2.4
3.9
4.6
0.2
2.2
0.1
2.5
6.3
0.40.0
0.4
The drought peril (USD6 .3 billion) was the costliest in EMEA, comprising 40 percent of all economic losses . Flood was the next costliest
at 26 percent, with European Windstorm third at 25 percent . The only peril in the region to surpass its recent 10-year average was
drought . The rest of the major perils were well lower than normal, with flood being particularly lower by 75 percent . Tropical Cyclone
losses in Africa were on par with average .
Exhibit 50: EMEA Insured Losses by Peril
Insured losses were below the 10-year normal for every major peril in EMEA with the exception of European Windstorm and
drought . The closest peril nearest its recent average was flood, which at USD2 .0 billion was within 20 percent . The rest of the
perils were at least 70 percent lower then their averages since 2005 .
Please note that insured losses include those sustained by private insurers and government-sponsored programs .
0.0
0.5
1.0
1.5
2.0
2.5
3.0
OtherDroughtWildfireWinter WeatherEU WindstormEarthquakeFloodingSevere WeatherTropical Cyclone
USD
Bill
ion
s (2
01
5)
10 Year Average2015
0.0 0.0 0.0
0.3
0.0 0.0 0.0 0.00.1
0.0
2.6 2.6
0.0
0.4
0.2
1.5
2.0
2.6
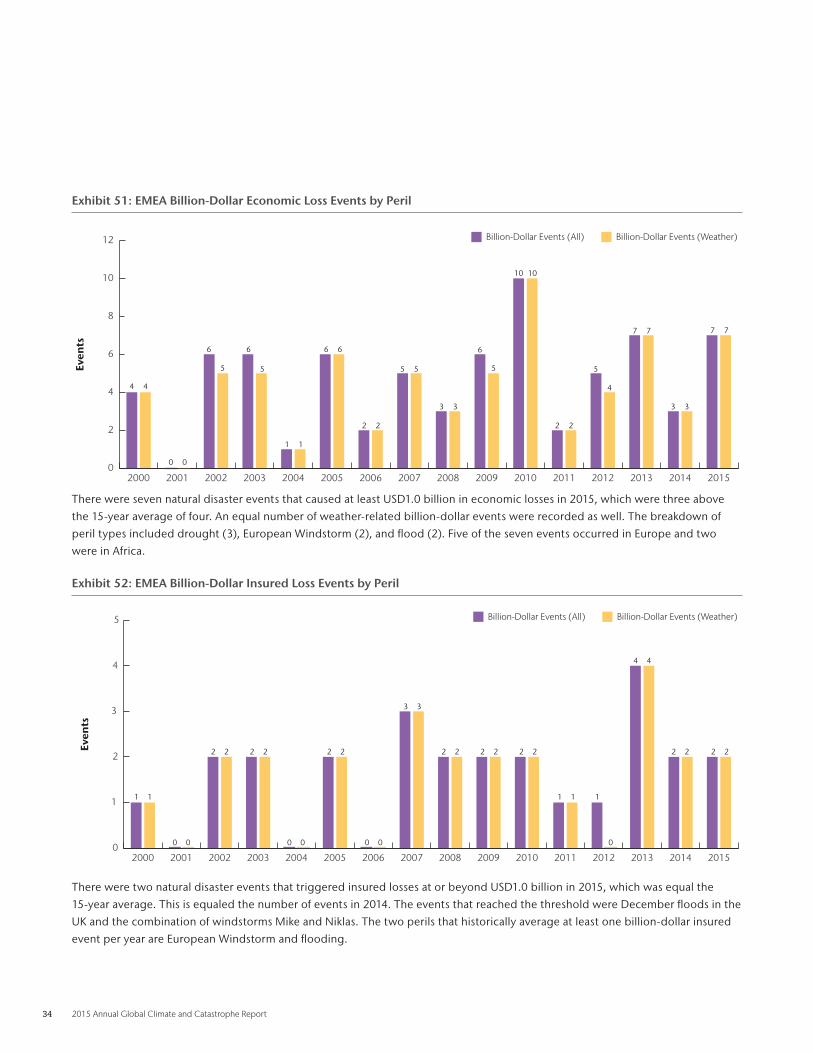
34 2015 Annual Global Climate and Catastrophe Report
Exhibit 51: EMEA Billion-Dollar Economic Loss Events by Peril
0
2
4
6
8
10
12
2015201420132012201120102009200820072006200520042003200220012000
Even
ts
Billion-Dollar Events (Weather)Billion-Dollar Events (All)
4 4
0 0
6
5
6
5
1 1
6 6
2 2
5 5
3 3
6
5
10 10
2 2
5
4
7 7
3 3
7 7
There were seven natural disaster events that caused at least USD1 .0 billion in economic losses in 2015, which were three above
the 15-year average of four . An equal number of weather-related billion-dollar events were recorded as well . The breakdown of
peril types included drought (3), European Windstorm (2), and flood (2) . Five of the seven events occurred in Europe and two
were in Africa .
Exhibit 52: EMEA Billion-Dollar Insured Loss Events by Peril
There were two natural disaster events that triggered insured losses at or beyond USD1 .0 billion in 2015, which was equal the
15-year average . This is equaled the number of events in 2014 . The events that reached the threshold were December floods in the
UK and the combination of windstorms Mike and Niklas . The two perils that historically average at least one billion-dollar insured
event per year are European Windstorm and flooding .
0
1
2
3
4
5
2015201420132012201120102009200820072006200520042003200220012000
Even
ts
Billion-Dollar Events (Weather)Billion-Dollar Events (All)
1 1
0 0
2 2 2 2 2 2 2 2 2 2 2 2 2 2 2 2
4 4
1 1 1
00 0 0 0
3 3

Aon Benfield 35
APAC (Asia & Oceania)
Exhibit 53: Top 5 Most Significant Events in APAC
Date(s) Event Location Deaths Economic Loss (USD) Insured Loss (USD)
Yearlong Forest Fires Indonesia 19 16 .1 billion 250 million
April 25 & May 12 Earthquake Nepal 9,120 8 .0 billion 200 million
Nov . – Dec . Flooding India, Sri Lanka 386 4 .0 billion 380 million
August 15 – 26 Typhoon Goni Japan, Philippines, China 70 1 .8 billion 980 million
April 20 – 24 Severe Weather Australia 3 925 million 671 million
All Other Events ~6,950 30 billion 3 .5 billion
Totals ~16,500 61 billion1 6.0 billion1,2
Economic and insured losses derived from natural catastrophes
in Asia Pacific were each below the 2000-2014 norm and the
lowest since 2012 . Despite the reduced losses, the region
incurred the highest economic cost resulting from natural
disasters in the world . Economic losses (USD60 billion) in
2015 were 22 percent below the 2000-2014 average and
insured losses (USD6 .0 billion) were 41 percent lower . However,
conducting the same analyses on a median basis produced
strikingly different results . This plays into how the loss averages
were heavily skewed given outlier years such as 2011 . When
analyzing economic losses on a median level since 2000, they were
57 percent higher . Insured losses were an even more substantial 70
percent higher than the median during the same timeframe .
The costliest singular event in Asia Pacific was a nearly
yearlong outbreak of major forest fires across Indonesia . The
fires that primarily burned on the island of Sumatra and in
the Kalimantan region initially ignited by slash-and-burn
tactics and spread out of control . A study by the World Bank
concluded that the fires had an USD16 .1 billion economic
cost on the Indonesian economy . Elsewhere, deadly bushfires
razed portions of South Australia and Victoria in December as
the insurance industry incurred a USD122 million and USD45
million bill respectively .
The flood peril left a heavy financial toll in India, China, and
Japan in 2015 . The most notable event occurred in November
and December as an El Niño enhanced monsoon pattern led
to catastrophic flooding in southern India and Sri Lanka . The
Indian state of Tamil Nadu was particularly impacted, with the
greater Chennai metropolitan region sustaining historic flood
damage . Total economic costs from the event were estimated
at up to USD4 .0 billion, though only USD380 million of the
losses were insured .
One of the strongest earthquakes of 2015 (M7 .8) struck Nepal
on April 25 and was followed by a powerful aftershock (M7 .3)
on May 12 . The tremors led to more than 9,100 fatalities in
Nepal, India, Bangladesh and China . Total combined economic
damages and reconstruction costs in the affected countries
were estimated at up to USD8 .0 billion, with most of the
damage occurring in Nepal’s Kathmandu . Another strong
earthquake struck near the Afghanistan and Pakistan border
on October 25 . Despite occurring 212 kilometers (132 miles)
below the surface, the M7 .5 temblor left more than 400
people dead .
Multiple typhoons and cyclones left billions in economic
damage throughout Asia Pacific . Typhoons Goni, Mujigae,
Soudelor, and Chan-hom were the costliest in China, Japan,
the Philippines and Taiwan . Perhaps the most significant
cyclonic event in the region was March’s Cyclone Pam . The
storm ravaged Vanuatu and caused USD450 million in damage .
That equaled 64 percent of Vanuatu’s GDP .
For a detailed review of all events in 2015, please visit
www.aonbenfield.com/catastropheinsight and click on
“Thought Leadership” to download updated monthly Global
Catastrophe Recaps .
1 Subject to change as loss estimates are further developed2 Includes losses sustained by private insurers and government-sponsored programs
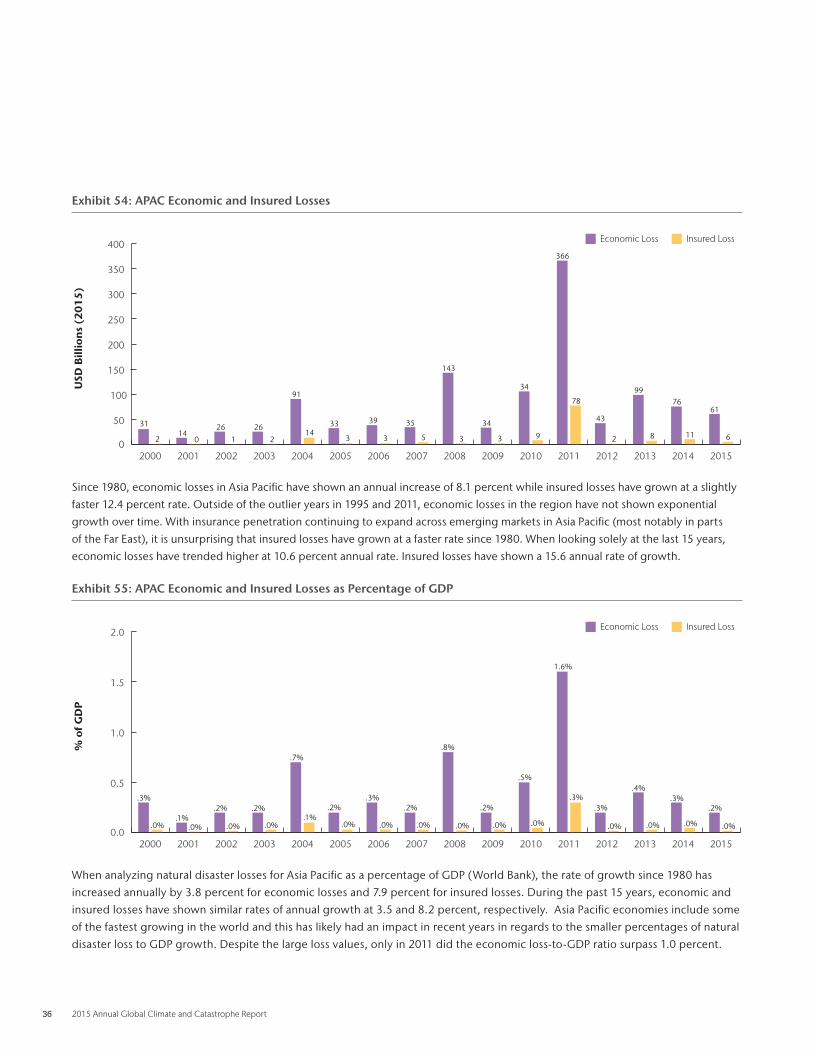
36 2015 Annual Global Climate and Catastrophe Report
Exhibit 54: APAC Economic and Insured Losses
Since 1980, economic losses in Asia Pacific have shown an annual increase of 8 .1 percent while insured losses have grown at a slightly
faster 12 .4 percent rate . Outside of the outlier years in 1995 and 2011, economic losses in the region have not shown exponential
growth over time . With insurance penetration continuing to expand across emerging markets in Asia Pacific (most notably in parts
of the Far East), it is unsurprising that insured losses have grown at a faster rate since 1980 . When looking solely at the last 15 years,
economic losses have trended higher at 10 .6 percent annual rate . Insured losses have shown a 15 .6 annual rate of growth .
Exhibit 55: APAC Economic and Insured Losses as Percentage of GDP
When analyzing natural disaster losses for Asia Pacific as a percentage of GDP (World Bank), the rate of growth since 1980 has
increased annually by 3 .8 percent for economic losses and 7 .9 percent for insured losses . During the past 15 years, economic and
insured losses have shown similar rates of annual growth at 3 .5 and 8 .2 percent, respectively . Asia Pacific economies include some
of the fastest growing in the world and this has likely had an impact in recent years in regards to the smaller percentages of natural
disaster loss to GDP growth . Despite the large loss values, only in 2011 did the economic loss-to-GDP ratio surpass 1 .0 percent .
USD
Bill
ion
s (2
01
5)
Insured LossEconomic Loss
0
50
100
150
200
250
300
350
400
2015201420132012201120102009200820072006200520042003200220012000
31
214
0
26 26
91
1433
3
39
3
35
5
143
3
34
3
34
366
78
43
99
8
76
11
61
6291 2
% o
f GD
P
Insured LossEconomic Loss
0.0
0.5
1.0
1.5
2.0
2015201420132012201120102009200820072006200520042003200220012000
.3%
.0%.1%
.0%
.2%
.0%
.2%
.0%
.7%
.3%
.0%
.2%
.0% .0%
.2%
.0%
.5%
.0%
1.6%
.3%.3%
.0%
.4%.3%
.0%
.2%
.0%.0%
.8%
.1%.2%
.0%
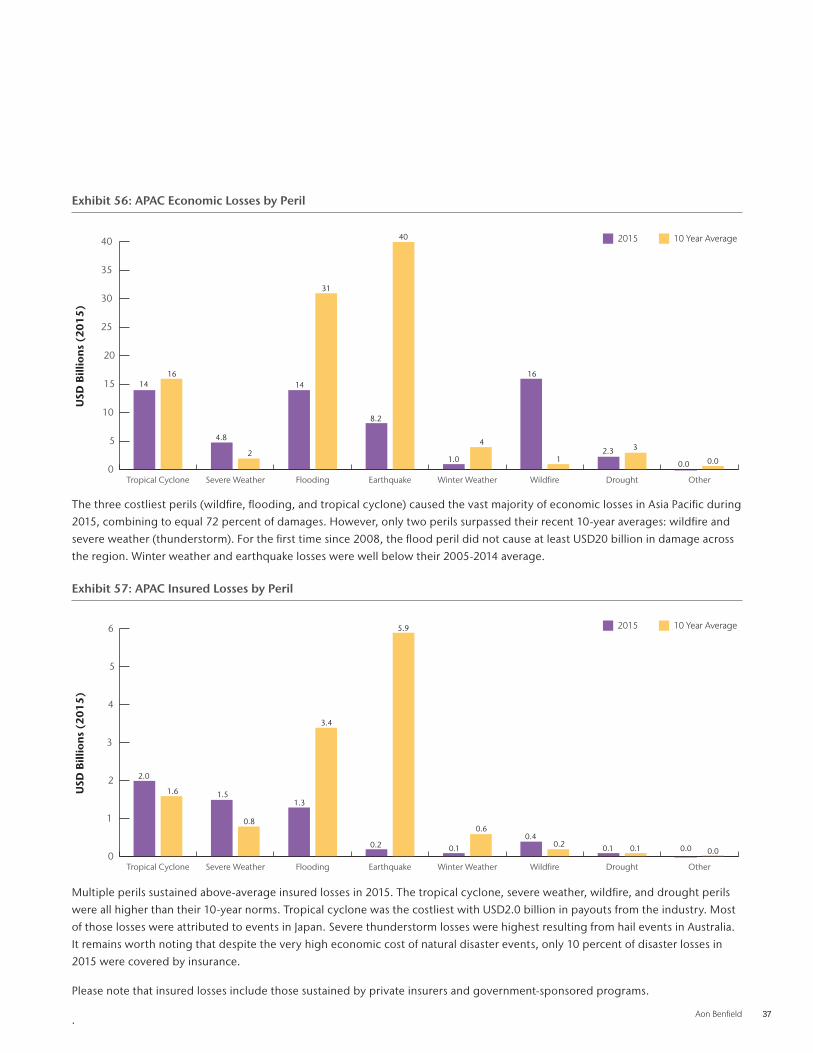
Aon Benfield 37
Exhibit 56: APAC Economic Losses by Peril
The three costliest perils (wildfire, flooding, and tropical cyclone) caused the vast majority of economic losses in Asia Pacific during
2015, combining to equal 72 percent of damages . However, only two perils surpassed their recent 10-year averages: wildfire and
severe weather (thunderstorm) . For the first time since 2008, the flood peril did not cause at least USD20 billion in damage across
the region . Winter weather and earthquake losses were well below their 2005-2014 average .
Exhibit 57: APAC Insured Losses by Peril
Multiple perils sustained above-average insured losses in 2015 . The tropical cyclone, severe weather, wildfire, and drought perils
were all higher than their 10-year norms . Tropical cyclone was the costliest with USD2 .0 billion in payouts from the industry . Most
of those losses were attributed to events in Japan . Severe thunderstorm losses were highest resulting from hail events in Australia .
It remains worth noting that despite the very high economic cost of natural disaster events, only 10 percent of disaster losses in
2015 were covered by insurance .
Please note that insured losses include those sustained by private insurers and government-sponsored programs .
.
0
5
10
15
20
25
30
35
40
OtherDroughtWildfireWinter WeatherEarthquakeFloodingSevere WeatherTropical Cyclone
USD
Bill
ion
s (2
01
5)
10 Year Average2015
14
4.8
2
14
31
8.2
40
1.0
4
16
12.3 3
0.0 0.0
16
0
1
2
3
4
5
6
OtherDroughtWildfireWinter WeatherEarthquakeFloodingSevere WeatherTropical Cyclone
USD
Bill
ion
s (2
01
5)
10 Year Average2015
2.0
1.6 1.51.3
3.4
0.2
5.9
0.1
0.60.4
0.2 0.1 0.1 0.0 0.0
0.8
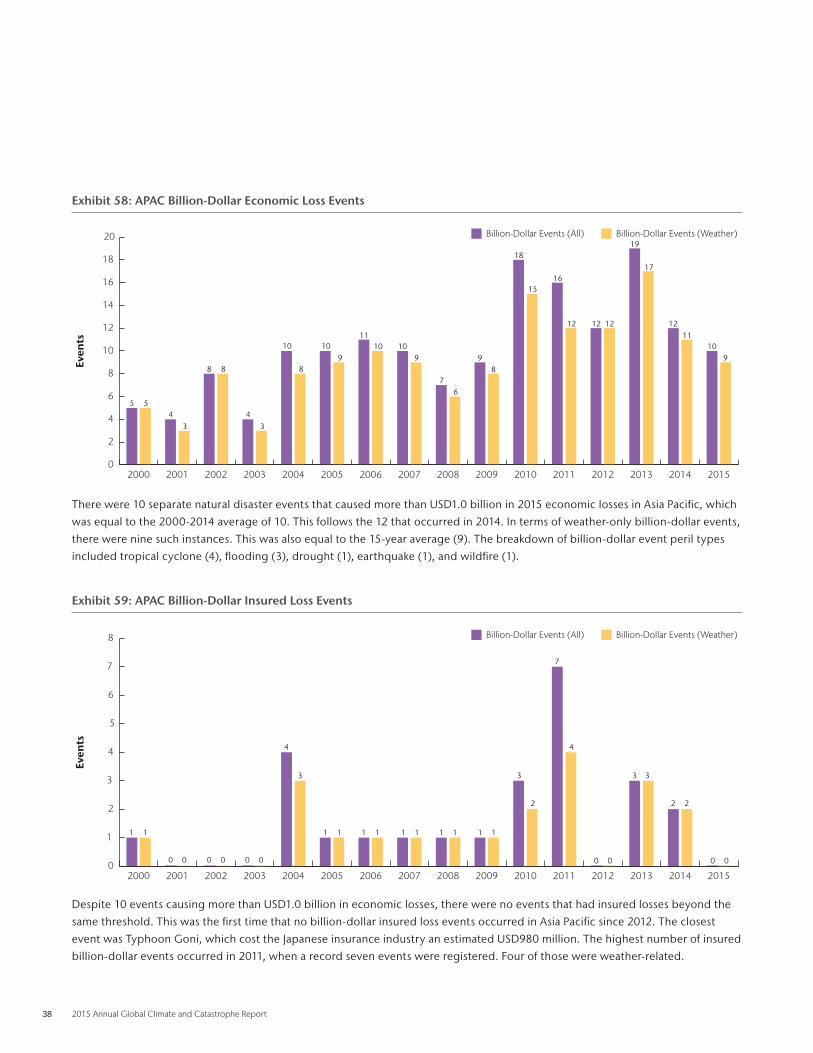
38 2015 Annual Global Climate and Catastrophe Report
Exhibit 58: APAC Billion-Dollar Economic Loss Events
There were 10 separate natural disaster events that caused more than USD1 .0 billion in 2015 economic losses in Asia Pacific, which
was equal to the 2000-2014 average of 10 . This follows the 12 that occurred in 2014 . In terms of weather-only billion-dollar events,
there were nine such instances . This was also equal to the 15-year average (9) . The breakdown of billion-dollar event peril types
included tropical cyclone (4), flooding (3), drought (1), earthquake (1), and wildfire (1) .
Exhibit 59: APAC Billion-Dollar Insured Loss Events
Despite 10 events causing more than USD1 .0 billion in economic losses, there were no events that had insured losses beyond the
same threshold . This was the first time that no billion-dollar insured loss events occurred in Asia Pacific since 2012 . The closest
event was Typhoon Goni, which cost the Japanese insurance industry an estimated USD980 million . The highest number of insured
billion-dollar events occurred in 2011, when a record seven events were registered . Four of those were weather-related .
0
2
4
6
8
10
12
14
16
18
20
2015201420132012201120102009200820072006200520042003200220012000
Even
ts
Billion-Dollar Events (Weather)Billion-Dollar Events (All)
5 54
3
8 8
43
10
8
109
1110 10
9
76
98
18
1516
12 12 12
19
17
1211
109
0
1
2
3
4
5
6
7
8
2015201420132012201120102009200820072006200520042003200220012000
Even
ts
Billion-Dollar Events (Weather)Billion-Dollar Events (All)
1 1 1 1 1 1
0 0 0 0
3 3 3
7
4
2 2 2
1 11 11 1
0 0 0 0 0 0
4
3

Aon Benfield 39
Exhibit 60: United States
Date(s) Event Location Deaths Structures/Claims
Economic Loss (USD)
1/01 – 9/30 Drought Western US 0 Unknown 4 .5+ billion
1/06 – 1/11 Winter Weather Midwest, Northeast, Mid-Atlantic 15 Hundreds+ 100+ million
1/26 – 1/28 Winter Weather Northeast, Mid-Atlantic 2 5,000+ 500+ million
1/31 – 2/04 Winter Weather Midwest, Northeast, Southwest 22 10,000+ 150+ million
2/06 – 2/08 Flooding Northwest, Southwest 1 Hundreds Millions+
2/07 – 2/11 Winter Weather Northeast 2 25,000+ 400+ million
2/13 – 2/15 Winter Weather Midwest, Northeast, Mid-Atlantic 30 45,000+ 650+ million
2/16 – 2/17 Winter Weather Southeast 10 10,000+ 100+ million
2/16 – 2/22 Winter Weather Plains, Ohio Valley, Mid-Atlantic 8 215,000+ 3 .25+ billion
2/25 – 2/26 Winter Weather Southeast, Mid-Atlantic 2 Thousands Millions+
3/01 – 3/06 Winter Weather Central & Eastern US 13 10,000+ 175+ million
3/25 – 3/26 Severe Weather Plains, Midwest, Southeast 1 35,000+ 500+ million
3/31 – 4/01 Severe Weather Plains, Midwest, Southeast 0 20,000+ 175+ million
4/02 – 4/03 Severe Weather Plains, Midwest, Southeast 0 25,000+ 250+ million
4/07 – 4/10 Severe Weather Plains, Midwest, Mississippi Valley 3 160,000+ 1 .65+ billion
4/16 – 4/17 Severe Weather Plains 1 Thousands 100s of Millions
4/18 – 4/21 Severe Weather Plains, Southeast, Northeast 0 135,000+ 1 .4+ billion
4/24 – 4/28 Severe Weather Plains, Southeast 4 115,000+ 950+ million
5/03 – 5/05 Severe Weather Plains, Midwest 1 15,000+ 175+ million
5/06 – 5/13 Severe Weather Plains, Midwest, Rockies 6 90,000+ 1 .0+ billion
5/10 TS Ana South Carolina 0 Hundreds Millions
5/15 – 5/19 Severe Weather Plains, Midwest, Rockies 2 15,000+ 150+ million
5/23 – 5/28 Severe Weather Plains, Midwest, Rockies, Southeast 32 150,000+ 3 .75+ billion
5/28 – 5/30 Severe Weather Plains, Midwest, Rockies, Southeast 0 20,000+ 170+ million
6/03 – 6/08 Severe Weather Rockies, Plains 0 60,000+ 600+ million
6/09 – 6/11 Severe Weather Great Lakes 0 10,000+ 100+ million
6/16 – 6/18 TS Bill Texas, Oklahoma 1 10,000+ 100+ million
6/19 – 6/26 Severe Weather Rockies, Plains, Midwest, Mid-Atlantic 4 110,000+ 1 .3+ billion
6/28 – 6/30 Wildfires Northwest 0 100+ 150+ million
6/29 – 7/01 Severe Weather Midwest, Northeast, Southeast 0 Thousands Millions+
7/12 – 7/14 Severe Weather Midwest, Ohio Valley, Southeast 4 65,000+ 600+ million
7/16 – 7/18 Severe Weather Plains, Midwest 4 7,500+ 75+ million
7/20 – 8/05 Flooding Florida 0 2,000+ 100+ million
7/29 – 8/13 Wildfires California 1 150+ Millions
8/02 – 8/04 Severe Weather Midwest, Plains, Northeast, Mid-Atlantic 4 100,000+ 750+ million
8/13 – 8/31 Wildfires Northwest, Rockies 4 Thousands 150+ million
Appendix A: 2015 Global Disasters

40 2015 Annual Global Climate and Catastrophe Report
Date(s) Event Location Deaths Structures/Claims
Economic Loss (USD)
8/29 – 8/30 Severe Weather Pacific Northwest 2 1,000+ Millions+
9/09 – 10/30 Wildfires California 7 10,000+ 2 .0+ billion
9/13 – 9/15 Flooding Southwest 19 Thousands Millions
9/24 – 9/28 Flooding Northeast, Mid-Atlantic, Southeast 1 Thousands Millions
10/01 – 10/11 Flooding Southeast, Mid-Atlantic 21 70,000+ 2 .0+ billion
10/03 – 10/04 Severe Weather New Mexico 0 10,000+ 90+ million
10/05 – 10/07 Severe Weather Texas 0 10,000+ 80+ million
10/15 – 10/16 Flooding California 1 Hundreds Millions
10/20 – 10/23 Severe Weather New Mexico, Texas 0 20,000+ 250+ million
10/24 – 10/26 Flooding Texas, Southeast 0 17,500+ 250+ million
10/29 – 11/03 Severe Weather Texas, Southeast 6 25,000+ 400+ million
11/10 – 11/12 Severe Weather Midwest, Southeast 0 Thousands Millions
11/16 – 11/18 Severe Weather Plains, Southeast 0 Thousands Millions
11/16 – 11/18 Severe Weather Pacific Northwest 3 30,000+ 500+ million
11/20 – 11/22 Winter Weather Plains, Midwest, Rockies 0 Hundreds Millions
11/25 – 11/29 Winter Weather Plains, Midwest, Rockies 18 Thousands 100+ million
12/07 – 12/11 Severe Weather Pacific Northwest 2 Thousands Millions+
12/16 – 12/18 Winter Weather West, Rockies, Plains, Midwest 3 Thousands Millions+
12/22 – 12/26 Severe Weather Midwest, Southeast, Plains 18 Thousands 1 .0+ billion
12/26 – 12/30 Severe Weather Plains, Midwest, Southeast 46 Thousands 3 .0+ billion
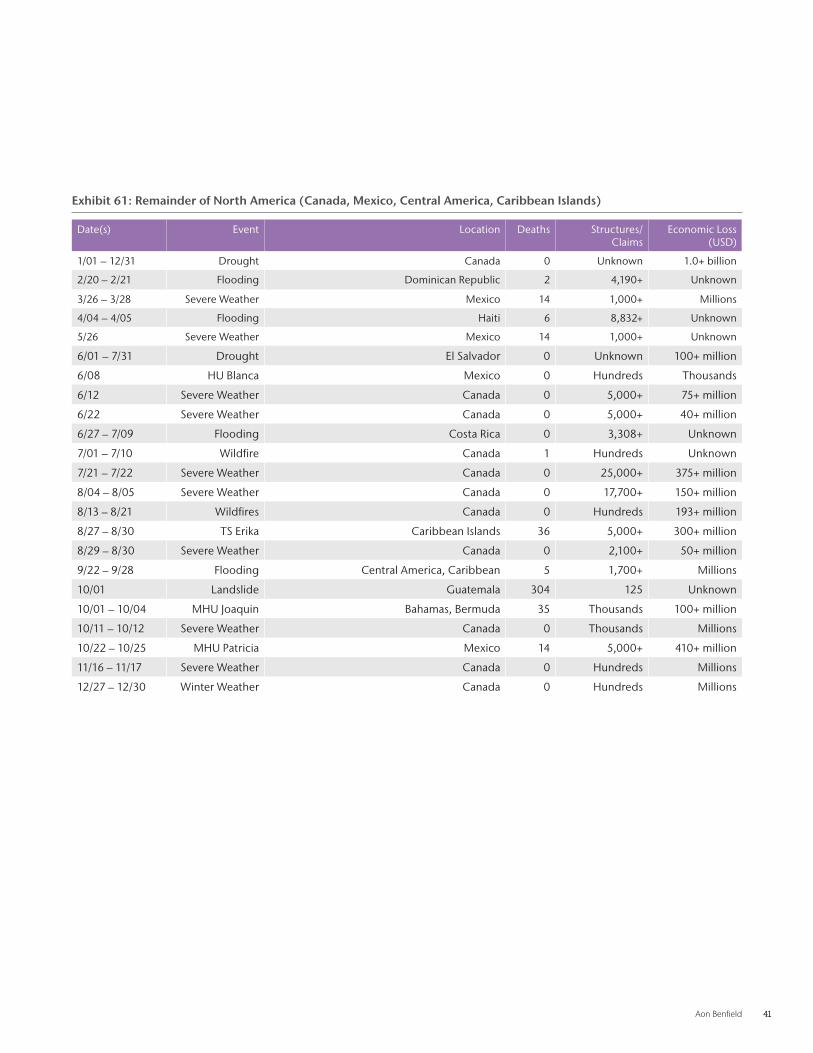
Aon Benfield 41
Exhibit 61: Remainder of North America (Canada, Mexico, Central America, Caribbean Islands)
Date(s) Event Location Deaths Structures/Claims
Economic Loss (USD)
1/01 – 12/31 Drought Canada 0 Unknown 1 .0+ billion
2/20 – 2/21 Flooding Dominican Republic 2 4,190+ Unknown
3/26 – 3/28 Severe Weather Mexico 14 1,000+ Millions
4/04 – 4/05 Flooding Haiti 6 8,832+ Unknown
5/26 Severe Weather Mexico 14 1,000+ Unknown
6/01 – 7/31 Drought El Salvador 0 Unknown 100+ million
6/08 HU Blanca Mexico 0 Hundreds Thousands
6/12 Severe Weather Canada 0 5,000+ 75+ million
6/22 Severe Weather Canada 0 5,000+ 40+ million
6/27 – 7/09 Flooding Costa Rica 0 3,308+ Unknown
7/01 – 7/10 Wildfire Canada 1 Hundreds Unknown
7/21 – 7/22 Severe Weather Canada 0 25,000+ 375+ million
8/04 – 8/05 Severe Weather Canada 0 17,700+ 150+ million
8/13 – 8/21 Wildfires Canada 0 Hundreds 193+ million
8/27 – 8/30 TS Erika Caribbean Islands 36 5,000+ 300+ million
8/29 – 8/30 Severe Weather Canada 0 2,100+ 50+ million
9/22 – 9/28 Flooding Central America, Caribbean 5 1,700+ Millions
10/01 Landslide Guatemala 304 125 Unknown
10/01 – 10/04 MHU Joaquin Bahamas, Bermuda 35 Thousands 100+ million
10/11 – 10/12 Severe Weather Canada 0 Thousands Millions
10/22 – 10/25 MHU Patricia Mexico 14 5,000+ 410+ million
11/16 – 11/17 Severe Weather Canada 0 Hundreds Millions
12/27 – 12/30 Winter Weather Canada 0 Hundreds Millions

42 2015 Annual Global Climate and Catastrophe Report
Exhibit 62: South America
Date(s) Event Location Deaths Structures/Claims
Economic Loss (USD)
12/01 – 1/31 Drought Brazil 0 Unknown Unknown
1/15 – 1/31 Flooding Bolivia, Peru 16 10,780+ Unknown
2/15 Flooding Argentina 8 1,500 17 .2+ million
3/01 – 3/06 Flooding Argentina, Bolivia, Brazil, Ecuador, Peru 47 30,000+ Millions+
3/20 – 4/05 Severe Weather Colombia, Ecuador, Peru 23 802+ Unknown
3/25 – 4/08 Flooding Chile 25 14,000+ 1 .5+ billion
4/20 Severe Weather Brazil 2 2,188+ 2 .0+ million
4/22 – 4/23 Volcano Chile 0 Thousands 600+ million
4/27 Landslide Brazil 15 Hundreds Unknown
5/17 Flooding Colombia 83 Hundreds Unknown
8/06 – 8/10 Flooding Argentina, Chile 9 Thousands Unknown
9/16 Earthquake Chile 14 10,000+ 1 .0+ billion
10/08 – 10/20 Flooding Brazil 3 40,700+ Millions
12/01 – 12/31 Flooding Peru, Paraguay, Uruguay, Brazil 16 10,000+ 200+ million

Aon Benfield 43
Exhibit 63: Europe
Date(s) Event Location Deaths Structures/Claims
Economic Loss (USD)
1/09 – 1/16 EU Windstorms Northern/Central/Western Europe 2 Thousands 650+ million
1/29 – 2/01 Winter Weather Western/Northern Europe 12 Hundreds Millions+
1/30 – 2/02 Flooding Balkans, Turkey 13 2,170+ 13+ million
2/03 – 2/08 Winter Weather Spain, France, Italy, Slovenia, Croatia 7 Thousands Millions+
3/04 – 3/07 Winter Weather Italy, Balkans 7 Thousands Millions+
3/29 – 4/01 WS Mike & Niklas Western & Central Europe 9 10,000+ 1 .0+ billion
4/12 – 4/13 Wildfire Russia 33 1,476+ 140+ million
5/05 – 5/06 Severe Weather Germany, Belgium 1 Thousands 10s of millions
6/01 – 8/31 Drought Romania, Poland, Czech Republic 0 100,000+ 2 .7+ billion
6/27 – 8/01 Heatwave Western, Central & Eastern Europe 1,000+ Unknown Unknown
7/24 – 7/25 Severe Weather Netherlands, Germany, Poland, Slovakia 3 Thousands 25+ million
8/01 – 8/14 Heatwave/Wildfires Central & Southern Europe, Middle East 109+ Unknown 9 .0+ million
9/05 Severe Weather Italy 0 Thousands Millions
9/07 Flooding Spain 4 1,000+ Millions
10/03 – 10/04 Flooding France 19 60,000+ 1 .0+ billion
10/14 – 10/16 Flooding Italy, Balkans 5 Hundreds 10s of Millions
11/01 – 11/03 Flooding Portugal, Spain, Italy 7 Hundreds Millions
11/17 WS Heini UK, Western Europe 0 Thousands 225+ million
11/29 – 11/30 WS Nils Ireland, U .K ., Denmark, Sweden 0 Thousands 10s of Millions
12/04 – 12/06 WS Ted United Kingdom, Ireland, Norway 3 30,500+ 1 .1+ billion
12/22 – 12/31 Flooding United Kingdom 0 25,000+ 2 .5+ billion
12/30 – 12/31 WS Eckard United Kingdom 1 10,000+ 350+ million
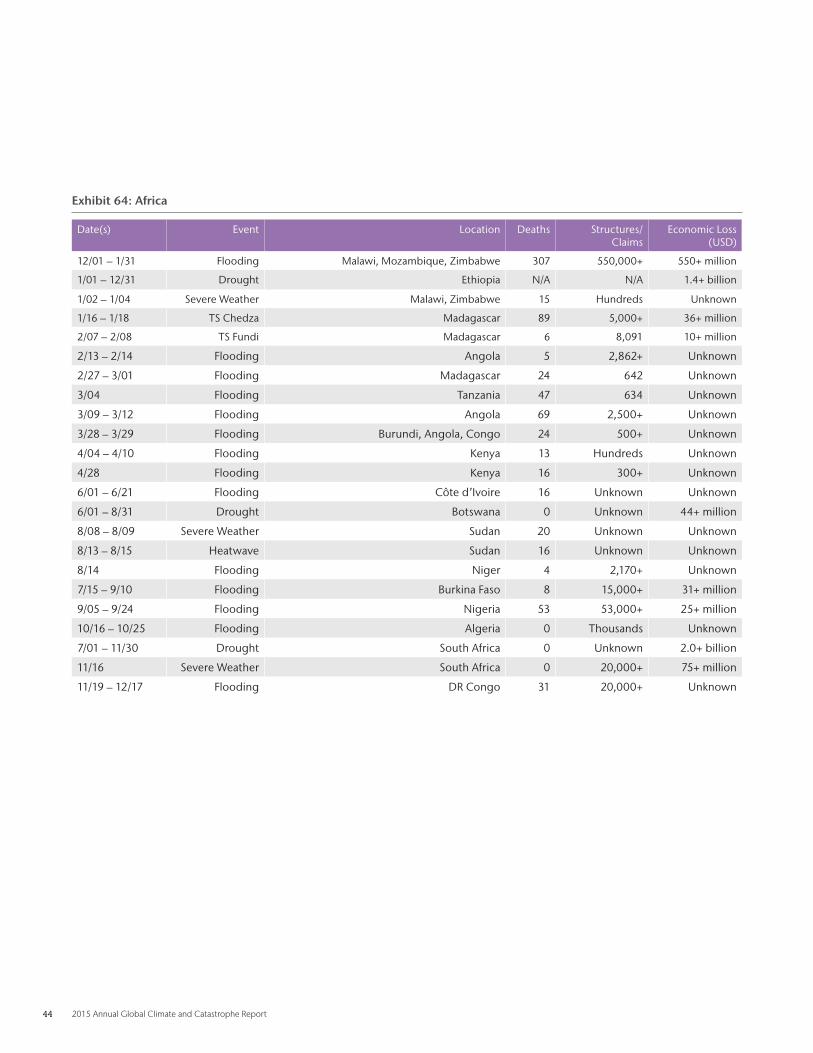
44 2015 Annual Global Climate and Catastrophe Report
Exhibit 64: Africa
Date(s) Event Location Deaths Structures/Claims
Economic Loss (USD)
12/01 – 1/31 Flooding Malawi, Mozambique, Zimbabwe 307 550,000+ 550+ million
1/01 – 12/31 Drought Ethiopia N/A N/A 1 .4+ billion
1/02 – 1/04 Severe Weather Malawi, Zimbabwe 15 Hundreds Unknown
1/16 – 1/18 TS Chedza Madagascar 89 5,000+ 36+ million
2/07 – 2/08 TS Fundi Madagascar 6 8,091 10+ million
2/13 – 2/14 Flooding Angola 5 2,862+ Unknown
2/27 – 3/01 Flooding Madagascar 24 642 Unknown
3/04 Flooding Tanzania 47 634 Unknown
3/09 – 3/12 Flooding Angola 69 2,500+ Unknown
3/28 – 3/29 Flooding Burundi, Angola, Congo 24 500+ Unknown
4/04 – 4/10 Flooding Kenya 13 Hundreds Unknown
4/28 Flooding Kenya 16 300+ Unknown
6/01 – 6/21 Flooding Côte d’Ivoire 16 Unknown Unknown
6/01 – 8/31 Drought Botswana 0 Unknown 44+ million
8/08 – 8/09 Severe Weather Sudan 20 Unknown Unknown
8/13 – 8/15 Heatwave Sudan 16 Unknown Unknown
8/14 Flooding Niger 4 2,170+ Unknown
7/15 – 9/10 Flooding Burkina Faso 8 15,000+ 31+ million
9/05 – 9/24 Flooding Nigeria 53 53,000+ 25+ million
10/16 – 10/25 Flooding Algeria 0 Thousands Unknown
7/01 – 11/30 Drought South Africa 0 Unknown 2 .0+ billion
11/16 Severe Weather South Africa 0 20,000+ 75+ million
11/19 – 12/17 Flooding DR Congo 31 20,000+ Unknown

Aon Benfield 45
Exhibit 65: Asia
Date(s) Event Location Deaths Structures/Claims
Economic Loss (USD)
1/01 – 12/31 Forest Fires Indonesia 19 Unknown 16 .1+ billion
1/01 – 12/31 Drought China 0 Unknown 1 .8+ billion
1/01 – 4/30 Drought Thailand 0 Unknown 428+ million
1/01 – 1/23 Flooding Indonesia 8 13,050+ 6+ million
1/06 – 1/10 Winter Weather Egypt, Israel, Jordan, Lebanon, Syria 9 Unknown 100+ million
1/09 – 1/12 Winter Weather China 1 5,300+ 226+ million
1/10 – 1/14 Earthquakes China 0 17,500+ 16+ million
1/14 – 1/20 Flooding Malaysia 1 Thousands Unknown
1/17 – 1/18 TY Mekkhala Philippines 2 538+ 1 .0+ million
1/19 Severe Weather Oman 0 5,000+ 221+ million
1/23 – 1/25 Flooding Indonesia 1 2,750+ Unknown
1/28 – 1/31 Winter Weather China 0 1,000+ 28+ million
1/31 Severe Weather China 0 Unknown 80+ million
1/31 – 2/2 Flooding Indonesia 2 5,050+ Unknown
2/08 – 2/13 Flooding Indonesia 6 Thousands 235+ million
2/15 – 2/28 Winter Weather Afghanistan, India 230 6,013 Unknown
2/22 Earthquake China 0 3,000+ 15+ million
2/24 – 3/3 Flooding Pakistan 32 Unknown Unknown
3/01 Earthquake China 0 16,300+ 19+ million
3/07 – 3/08 Winter Weather Afghanistan, Pakistan 26 150+ Unknown
3/11 – 3/15 Severe Weather India, Iran 20 1,140+ Unknown
3/14 Earthquake China 2 11,234+ Millions+
3/16 Flooding Indonesia 0 1,600+ Unknown
3/23 – 3/27 Flooding Saudi Arabia 11 1,000+ Millions+
3/24 – 3/25 Severe Weather China 0 1,000+ 275+ million
3/25 – 4/5 STY Maysak Micronesia, Philippines 9 2,000+ 8+ million
3/28 Flooding Indonesia 12 Unknown Unknown
3/29 – 3/31 Winter Weather China 0 1,000+ 108+ million
3/29 – 3/31 Flooding India 17 Thousands 38+ million
3/30 Earthquake China 0 6,260+ 20+ million
3/30 – 4/04 Severe Weather China 6 19,300+ 209+ million
4/01 – 4/03 Severe Weather India, Pakistan, Tajikistan, Afghanistan 33 1,000+ Millions
4/04 – 4/05 Severe Weather China 7 14,500+ 20+ million
4/04 – 4/05 Severe Weather Bangladesh, India, Myanmar 40 46,033+ 4 .3+ million
4/06 – 4/09 Severe Weather China 1 5,000+ 130+ million
4/08 – 4/12 Flooding Kazakhstan 2 1,760+ 5 .3+ million
4/11 – 4/13 Winter Weather China 0 Unknown 174+ million
4/19 – 4/21 Severe Weather China 0 2,000+ 350+ million
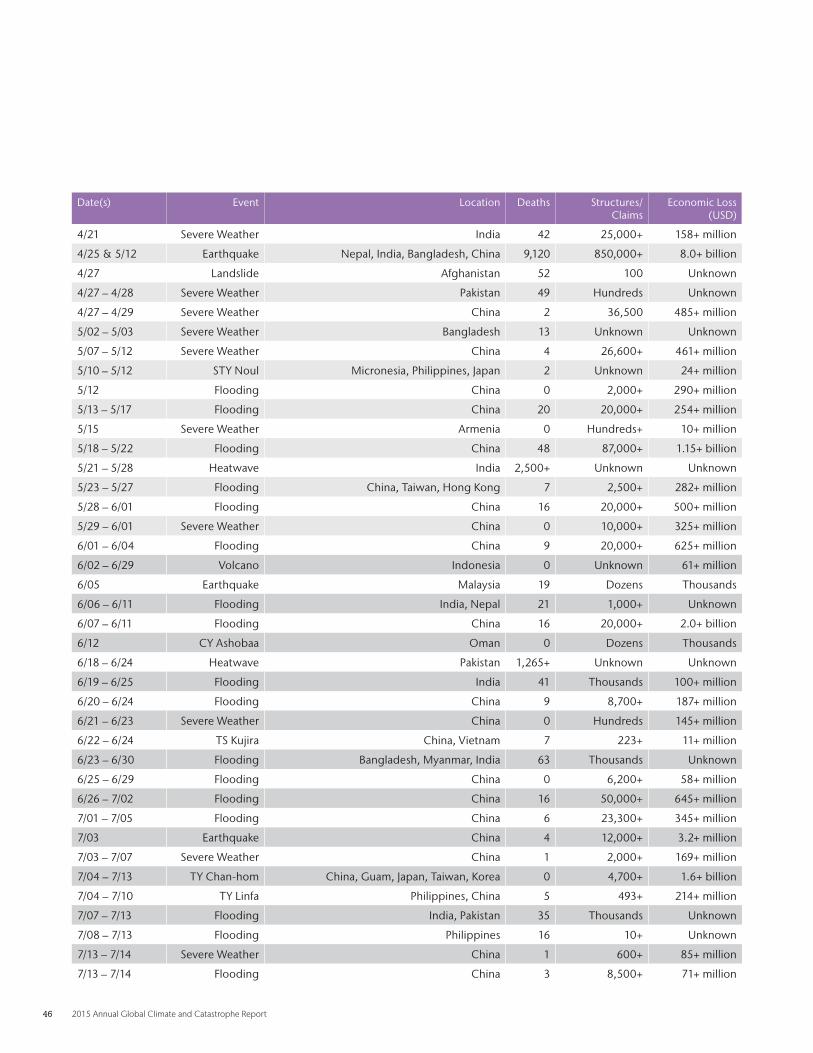
46 2015 Annual Global Climate and Catastrophe Report
Date(s) Event Location Deaths Structures/Claims
Economic Loss (USD)
4/21 Severe Weather India 42 25,000+ 158+ million
4/25 & 5/12 Earthquake Nepal, India, Bangladesh, China 9,120 850,000+ 8 .0+ billion
4/27 Landslide Afghanistan 52 100 Unknown
4/27 – 4/28 Severe Weather Pakistan 49 Hundreds Unknown
4/27 – 4/29 Severe Weather China 2 36,500 485+ million
5/02 – 5/03 Severe Weather Bangladesh 13 Unknown Unknown
5/07 – 5/12 Severe Weather China 4 26,600+ 461+ million
5/10 – 5/12 STY Noul Micronesia, Philippines, Japan 2 Unknown 24+ million
5/12 Flooding China 0 2,000+ 290+ million
5/13 – 5/17 Flooding China 20 20,000+ 254+ million
5/15 Severe Weather Armenia 0 Hundreds+ 10+ million
5/18 – 5/22 Flooding China 48 87,000+ 1 .15+ billion
5/21 – 5/28 Heatwave India 2,500+ Unknown Unknown
5/23 – 5/27 Flooding China, Taiwan, Hong Kong 7 2,500+ 282+ million
5/28 – 6/01 Flooding China 16 20,000+ 500+ million
5/29 – 6/01 Severe Weather China 0 10,000+ 325+ million
6/01 – 6/04 Flooding China 9 20,000+ 625+ million
6/02 – 6/29 Volcano Indonesia 0 Unknown 61+ million
6/05 Earthquake Malaysia 19 Dozens Thousands
6/06 – 6/11 Flooding India, Nepal 21 1,000+ Unknown
6/07 – 6/11 Flooding China 16 20,000+ 2 .0+ billion
6/12 CY Ashobaa Oman 0 Dozens Thousands
6/18 – 6/24 Heatwave Pakistan 1,265+ Unknown Unknown
6/19 – 6/25 Flooding India 41 Thousands 100+ million
6/20 – 6/24 Flooding China 9 8,700+ 187+ million
6/21 – 6/23 Severe Weather China 0 Hundreds 145+ million
6/22 – 6/24 TS Kujira China, Vietnam 7 223+ 11+ million
6/23 – 6/30 Flooding Bangladesh, Myanmar, India 63 Thousands Unknown
6/25 – 6/29 Flooding China 0 6,200+ 58+ million
6/26 – 7/02 Flooding China 16 50,000+ 645+ million
7/01 – 7/05 Flooding China 6 23,300+ 345+ million
7/03 Earthquake China 4 12,000+ 3 .2+ million
7/03 – 7/07 Severe Weather China 1 2,000+ 169+ million
7/04 – 7/13 TY Chan-hom China, Guam, Japan, Taiwan, Korea 0 4,700+ 1 .6+ billion
7/04 – 7/10 TY Linfa Philippines, China 5 493+ 214+ million
7/07 – 7/13 Flooding India, Pakistan 35 Thousands Unknown
7/08 – 7/13 Flooding Philippines 16 10+ Unknown
7/13 – 7/14 Severe Weather China 1 600+ 85+ million
7/13 – 7/14 Flooding China 3 8,500+ 71+ million

Aon Benfield 47
Date(s) Event Location Deaths Structures/Claims
Economic Loss (USD)
7/16 STY Nangka Japan 2 288+ 200+ million
7/17 – 7/25 Flooding Pakistan 18 Thousands Unknown
7/17 – 8/11 Heatwave Japan 59 Unknown Unknown
7/20 – 7/24 Flooding China 28 42,900+ 1 .2+ billion
7/22 – 7/27 Flooding Pakistan, Myanmar, Afghanistan, Bangladesh 162 39,000+ 25+ million
7/24 – 8/06 Flooding Vietnam 42 2,028+ 204+ million
7/25 – 8/07 Flooding Myanmar 121 50,000+ 109+ million
7/26 – 8/06 Flooding India, Pakistan, Bangladesh 303 350,000+ 500+ million
8/01 – 8/05 Flooding North Korea 21 968+ Unknown
8/01 – 8/07 Flooding Nepal 90 1,000+ Unknown
8/01 – 8/15 Flooding Laos 0 2,200+ 10+ million
8/02 – 8/04 Flooding China 15 15,000+ 418+ million
8/02 – 8/08 STY Soudelor China, Taiwan, Saipan 41 150,000+ 3 .2+ billion
8/07 – 8/12 Severe Weather China 1 1,000+ 59+ million
8/15 – 8/26 TY Goni Japan, Philippines, Korea Peninsula 70 20,000+ 900+ million
8/16 – 8/19 Flooding China 23 25,800+ 220+ million
8/19 – 8/26 Severe Weather China 1 10,000+ 281+ million
8/28 – 9/01 Flooding India, Myanmar 47 50,000+ 100+ million
9/06 Severe Weather India 32 Unknown Unknown
9/08 – 9/10 Sandstorm Middle East 12 Thousands Unknown
9/08 – 9/10 Flooding Japan 8 25,000+ 500+ million
9/15 – 9/23 Flooding China 14 4,000+ 473+ million
9/25 Earthquake Indonesia 0 2,500 Unknown
9/25 – 9/28 TY Dujuan Taiwan, China, Japan, Philippines 3 Thousands 687+ million
9/30 – 10/1 Winter Weather China 1 Unknown 177+ million
10/02 – 10/04 TY Mujigae China, Philippines 22 26,800 4 .2+ billion
10/06 – 10/11 Severe Weather China 14 5,200 43 million
10/08 – 10/12 Flooding Myanmar 39 Hundreds Unknown
10/18 – 10/22 STY Koppu Philippines 62 150,000+ 306+ million
10/26 Earthquake Afghanistan, Pakistan 403+ 95,000+ 100+ million
10/28 – 10/30 Flooding Iran, Iraq, Saudi Arabia 70 Unknown Millions
11/03 – 11/04 CY Chapala Yemen 8 Thousands 100s of Millions
11/08 – 11/09 CY Megh Yemen, Somalia 18 3,000+ Unknown
11/09 – 12/08 Flooding India, Sri Lanka 386+ 100,000+ 4 .0+ billion
11/10 – 11/16 Flooding China 0 Thousands 133+ million
11/13 Landslide China 38 48 Unknown
11/17 Earthquake Kyrgyzstan 0 4,371 Unknown
11/17 Flooding Saudi Arabia 12 Hundreds Unknown
11/22 – 11/25 Winter Weather China 4 1,000 268+ million

48 2015 Annual Global Climate and Catastrophe Report
Date(s) Event Location Deaths Structures/Claims
Economic Loss (USD)
11/29 – 12/03 Landslides Indonesia 20 550+ Unknown
12/04 – 12/05 Flooding China 0 Hundreds 90+ million
12/14 – 12/17 TY Melor Philippines 42 279,487+ 140+ million
12/25 Earthquake Pakistan, Afghanistan 2 Thousands Unknown
Exhibit 66: Oceania (Australia, New Zealand, and the South Pacific Islands)
Date(s) Event Location Deaths Structures/Claims
Economic Loss (USD)
1/02 – 1/08 Wildfires Australia 0 996+ 50+ million
2/20 Cyclone Lam Australia 0 Hundreds 78+ million
2/20 Cyclone Marcia Australia 0 36,483+ 650+ million
3/11 – 3/15 CY Pam Vanuatu, South Pacific Islands 16 30,000+ 443+ million
3/13 – 3/15 CY Olwyn Australia (WA) 0 500+ 76+ million
3/20 – 3/24 CY Nathan Australia (QLD, NT) 0 Hundreds Millions
4/19 – 4/22 Severe Weather Australia (NSW) 4 119,935+ 925+ million
4/25 Severe Weather Australia (NSW) 0 14,239+ 500+ million
4/30 – 5/03 Flooding Australia (QLD, NSW) 6 27,825+ 400+ million
5/14 – 5/15 Flooding New Zealand 1 Thousands 100+ million
5/14 STY Dolphin Northern Mariana Islands 0 Hundreds Unknown
6/20 Flooding New Zealand 0 2,839+ 171+ million
6/30 – 7/05 CY Raquel Solomon Islands 1 150+ Millions
8/25 – 8/26 Severe Weather Australia (NSW) 0 1,600+ Millions
7/1 – 10/31 Drought Papua New Guinea 0 Unknown 60+ million
10/27 – 10/28 Severe Weather Australia (QLD) 0 Hundreds Millions
11/25 – 11/27 Wildfires Australia (South Australia) 2 1,861+ 200+ million
11/29 – 11/30 Severe Weather Australia (QLD, NSW) 0 Hundreds 10s of Millions
12/16 Severe Weather Australia (NSW) 0 2,600+ 25+ million
12/25 Wildfires Australia (VIC) 0 100+ 100+ million

Aon Benfield 49
The following tables provide a look at specific global natural disaster events since 1950 . (Please note that the adjusted
for inflation (2015 USD) totals were converted using the US Consumer Price Index (CPI) . Insured losses include those
sustained by private industry and government entities such as the US National Flood Insurance Program (NFIP) .
For additional top 10 lists, please visit www.aonbenfield.com/catastropheinsight
Exhibit 67: Top 10 Costliest Global Economic Loss Events (1950-2015)
Date Event Location Economic Loss1 Actual (USD)
Economic Loss2 (2015 USD)
March 11, 2011 EQ/Tsunami Japan 210 billion 223 billion
January 17, 1995 Earthquake Japan 103 billion 162 billion
August 2005 Hurricane Katrina United States 125 billion 151 billion
May 12, 2008 Earthquake China 85 billion 93 billion
October 2012 Hurricane Sandy US, Caribbean, Bahamas, Canada 72 billion 74 billion
January 17, 1994 Earthquake United States 44 billion 71 billion
November 23, 1980 Earthquake Italy 19 billion 51 billion
July – December 2011 Flooding Thailand 45 billion 47 billion
August 1992 Hurricane Andrew United States, Bahamas 27 billion 45 billion
July/August 1998 Flooding China 31 billion 44 billion
Exhibit 68: Top 10 Costliest Global Insured Loss Events (1950-2015)
Date Event Location Insured Loss1 Actual (USD)
Insured Loss2 (2015 USD)
August 2005 Hurricane Katrina United States 66 .9 billion 80 .8 billion
March 11, 2011 EQ/Tsunami Japan 35 .0 billion 37 .1 billion
October 2012 Hurricane Sandy US, Caribbean, Bahamas, Canada 30 .2 billion 31 .0 billion
August 1992 Hurricane Andrew US, Bahamas 15 .7 billion 26 .4 billion
January 17, 1994 Earthquake United States 15 .3 billion 24 .8 billion
September 2008 Hurricane Ike United States 15 .2 billion 16 .5 billion
June-December 2011 Flooding Thailand 15 .5 billion 16 .2 billion
Yearlong 2012 Drought United States 15 .0 billion 15 .7 billion
October 2005 Hurricane Wilma United States 12 .5 billion 14 .8 billion
February 22, 2011 Earthquake New Zealand 13 .5 billion 14 .5 billion
Appendix B: Historical Natural Disaster Events
1 Insured loss include those sustained from direct damages, plus additional directly attributable event costs
2 Adjusted using US Consumer Price Index (CPI)
1 Economic loss include those sustained from direct damages, plus additional directly attributable event costs
2 Adjusted using US Consumer Price Index (CPI)
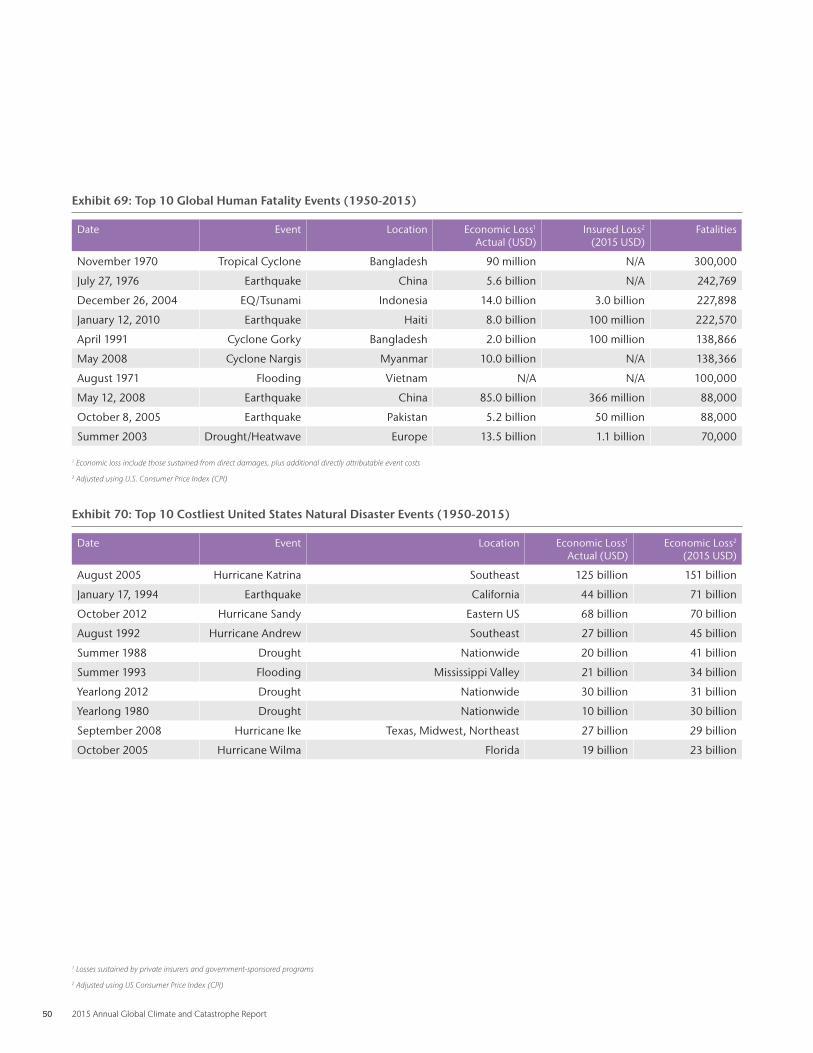
50 2015 Annual Global Climate and Catastrophe Report
Exhibit 69: Top 10 Global Human Fatality Events (1950-2015)
Date Event Location Economic Loss1 Actual (USD)
Insured Loss2 (2015 USD)
Fatalities
November 1970 Tropical Cyclone Bangladesh 90 million N/A 300,000
July 27, 1976 Earthquake China 5 .6 billion N/A 242,769
December 26, 2004 EQ/Tsunami Indonesia 14 .0 billion 3 .0 billion 227,898
January 12, 2010 Earthquake Haiti 8 .0 billion 100 million 222,570
April 1991 Cyclone Gorky Bangladesh 2 .0 billion 100 million 138,866
May 2008 Cyclone Nargis Myanmar 10 .0 billion N/A 138,366
August 1971 Flooding Vietnam N/A N/A 100,000
May 12, 2008 Earthquake China 85 .0 billion 366 million 88,000
October 8, 2005 Earthquake Pakistan 5 .2 billion 50 million 88,000
Summer 2003 Drought/Heatwave Europe 13 .5 billion 1 .1 billion 70,000
Exhibit 70: Top 10 Costliest United States Natural Disaster Events (1950-2015)
Date Event Location Economic Loss1 Actual (USD)
Economic Loss2 (2015 USD)
August 2005 Hurricane Katrina Southeast 125 billion 151 billion
January 17, 1994 Earthquake California 44 billion 71 billion
October 2012 Hurricane Sandy Eastern US 68 billion 70 billion
August 1992 Hurricane Andrew Southeast 27 billion 45 billion
Summer 1988 Drought Nationwide 20 billion 41 billion
Summer 1993 Flooding Mississippi Valley 21 billion 34 billion
Yearlong 2012 Drought Nationwide 30 billion 31 billion
Yearlong 1980 Drought Nationwide 10 billion 30 billion
September 2008 Hurricane Ike Texas, Midwest, Northeast 27 billion 29 billion
October 2005 Hurricane Wilma Florida 19 billion 23 billion
1 Losses sustained by private insurers and government-sponsored programs
2 Adjusted using US Consumer Price Index (CPI)
1 Economic loss include those sustained from direct damages, plus additional directly attributable event costs
2 Adjusted using U.S. Consumer Price Index (CPI)
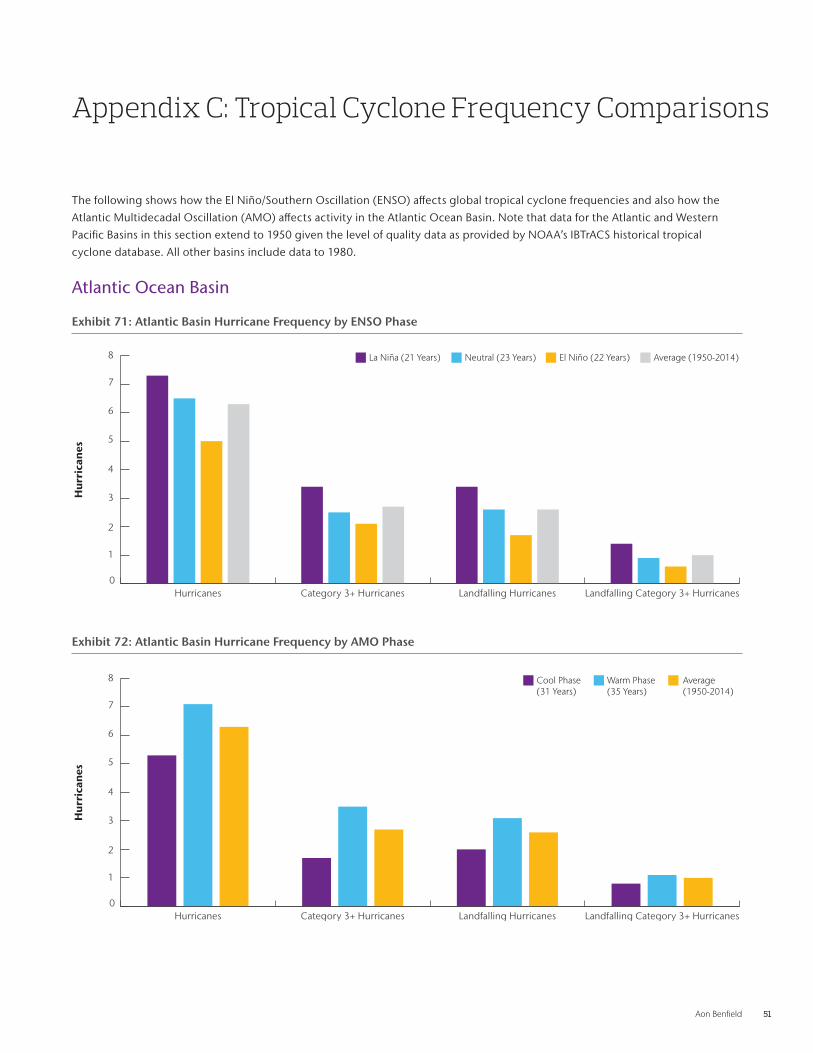
Aon Benfield 51
The following shows how the El Niño/Southern Oscillation (ENSO) affects global tropical cyclone frequencies and also how the
Atlantic Multidecadal Oscillation (AMO) affects activity in the Atlantic Ocean Basin . Note that data for the Atlantic and Western
Pacific Basins in this section extend to 1950 given the level of quality data as provided by NOAA’s IBTrACS historical tropical
cyclone database . All other basins include data to 1980 .
Atlantic Ocean Basin
Exhibit 71: Atlantic Basin Hurricane Frequency by ENSO Phase
Exhibit 72: Atlantic Basin Hurricane Frequency by AMO Phase
0
1
2
3
4
5
6
7
8
Landfalling Category 3+ HurricanesLandfalling HurricanesCategory 3+ HurricanesHurricanes
Average (1950-2014)El Niño (22 Years)Neutral (23 Years)La Niña (21 Years)
Hu
rric
anes
0
1
2
3
4
5
6
7
8
Landfalling Category 3+ HurricanesLandfalling HurricanesCategory 3+ HurricanesHurricanes
Hu
rric
anes
Average (1950-2014)
Warm Phase(35 Years)
Cool Phase (31 Years)
Appendix C: Tropical Cyclone Frequency Comparisons
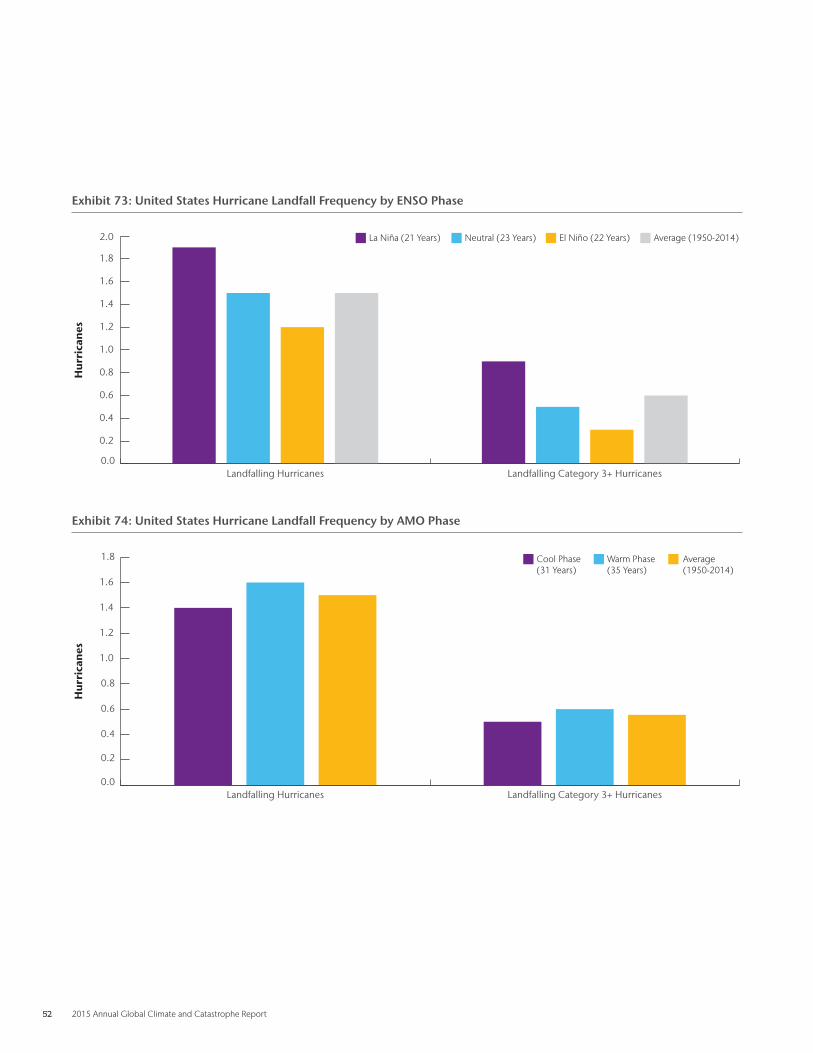
52 2015 Annual Global Climate and Catastrophe Report
Exhibit 73: United States Hurricane Landfall Frequency by ENSO Phase
Exhibit 74: United States Hurricane Landfall Frequency by AMO Phase
0.0
0.2
0.4
0.6
0.8
1.0
1.2
1.4
1.6
1.8
2.0
Landfalling Category 3+ HurricanesLandfalling Hurricanes
Average (1950-2014)El Niño (22 Years)Neutral (23 Years)La Niña (21 Years)
Hu
rric
anes
0.0
0.2
0.4
0.6
0.8
1.0
1.2
1.4
1.6
1.8
Landfalling Category 3+ HurricanesLandfalling Hurricanes
Average (1950-2014)
Warm Phase(35 Years)
Cool Phase (31 Years)
Hu
rric
anes
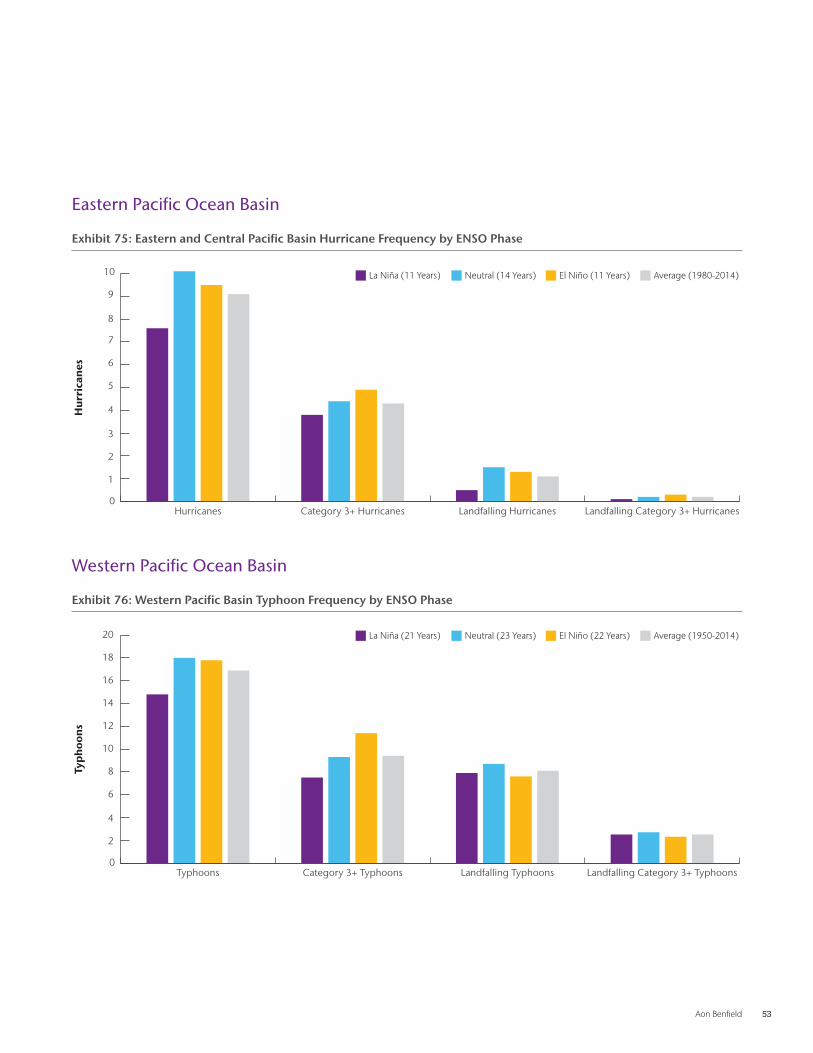
Aon Benfield 53
Eastern Pacific Ocean Basin
Exhibit 75: Eastern and Central Pacific Basin Hurricane Frequency by ENSO Phase
Western Pacific Ocean Basin
Exhibit 76: Western Pacific Basin Typhoon Frequency by ENSO Phase
0
1
2
3
4
5
6
7
8
9
10
Landfalling Category 3+ HurricanesLandfalling HurricanesCategory 3+ HurricanesHurricanes
Average (1980-2014)El Niño (11 Years)Neutral (14 Years)La Niña (11 Years)
Hu
rric
anes
0
2
4
6
8
10
12
14
16
18
20
Landfalling Category 3+ TyphoonsLandfalling TyphoonsCategory 3+ TyphoonsTyphoons
Average (1950-2014)El Niño (22 Years)Neutral (23 Years)La Niña (21 Years)
Typ
hoo
ns

54 2015 Annual Global Climate and Catastrophe Report
North Indian Ocean Basin
Exhibit 77: North Indian Basin Cyclone Frequency by ENSO Phase
Southern Hemisphere
Exhibit 78: Southern Hemisphere Cyclone Frequency by ENSO Phase
0
1
2
3
Landfalling Category 3+ CyclonesLandfalling CyclonesCategory 3+ CyclonesCyclones
Average (1980-2014)El Niño (11 Years)Neutral (14 Years)La Niña (11 Years)
Cyc
lon
es
0
2
4
6
8
10
12
14
16
18
Landfalling Category 3+ CyclonesLandfalling CyclonesCategory 3+ CyclonesCyclones
Average (1980-2014)El Niño (11 Years)Neutral (14 Years)La Niña (11 Years)
Cyc
lon
es

Aon Benfield 55
The following shows a breakdown of historical tropical cyclone landfall data by basin . Note that data for the Atlantic and Western
Pacific Basins in this section extend to 1950 given the level of quality data as provided by NOAA’s IBTrACS historical tropical
cyclone database . All other basins include data to 1980 .
Exhibit 79: Atlantic Ocean Basin Hurricane Landfalls
Exhibit 80: United States Hurricane Landfalls
Lan
dfa
lls
Category 1+≥74 mph (119 kph)
Category 3+≥111 mph (179 kph)
0
1
2
3
4
5
6
7
8
9
20152010200520001995199019851980197519701965196019551950
Average(1950-2014)
Lan
dfa
lls
Category 1+≥74 mph (119 kph)
Category 3+≥111 mph (179 kph)
0
1
2
3
4
5
6
7
20152010200520001995199019851980197519701965196019551950
Average(1950-2014)
Appendix D: Tropical Cyclone Landfall Data by Basin
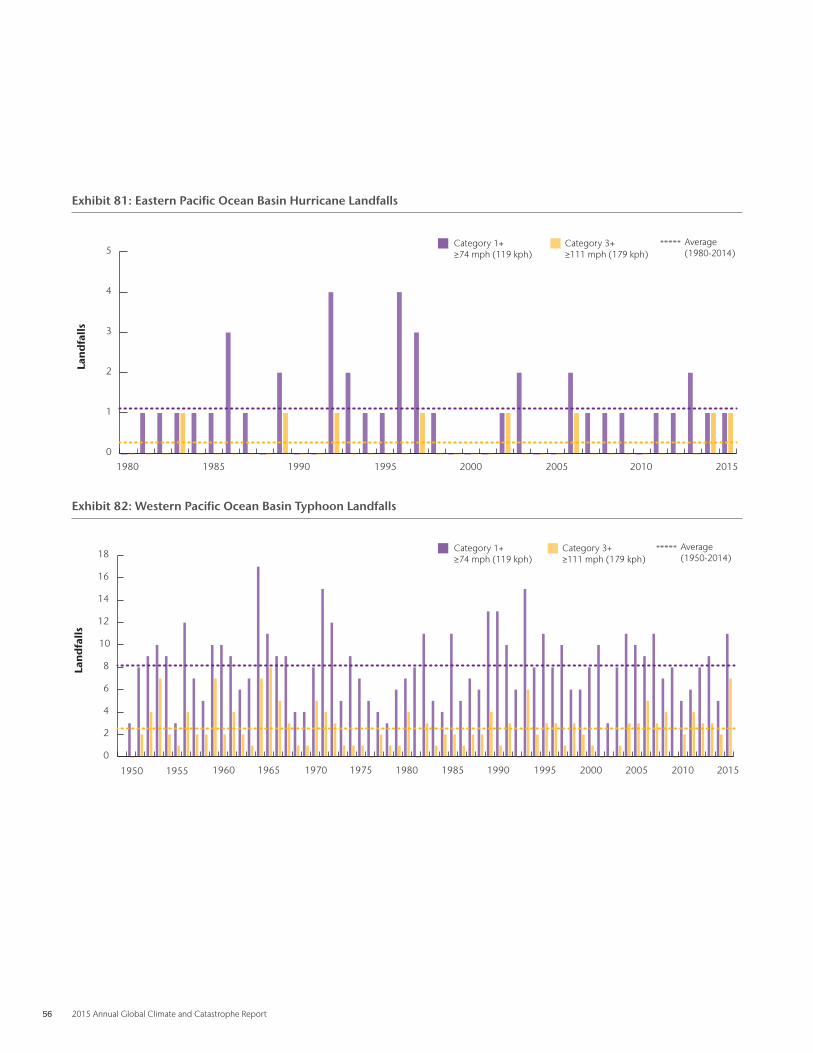
56 2015 Annual Global Climate and Catastrophe Report
Exhibit 81: Eastern Pacific Ocean Basin Hurricane Landfalls
Exhibit 82: Western Pacific Ocean Basin Typhoon Landfalls
Lan
dfa
lls
Category 1+≥74 mph (119 kph)
Category 3+≥111 mph (179 kph)
0
1
2
3
4
5
20152010200520001995199019851980
Average(1980-2014)
Lan
dfa
lls
Category 1+≥74 mph (119 kph)
Category 3+≥111 mph (179 kph)
0
2
4
6
8
10
12
14
16
18
20152010200520001990 199519851980197519701965196019551950
Average(1950-2014)

Aon Benfield 57
Exhibit 83: North Indian Ocean Basin Cyclone Landfalls
Exhibit 84: Southern Hemisphere Cyclone Landfalls
Lan
dfa
lls
Category 1+≥74 mph (119 kph)
Category 3+≥111 mph (179 kph)
0
1
2
3
4
20152010200520001995199019851980
Average(1980-2014)
Lan
dfa
lls
Category 1+≥74 mph (119 kph)
Category 3+≥111 mph (179 kph)
0
1
2
3
4
5
6
20152010200520001995199019851980
Average(1980-2014)
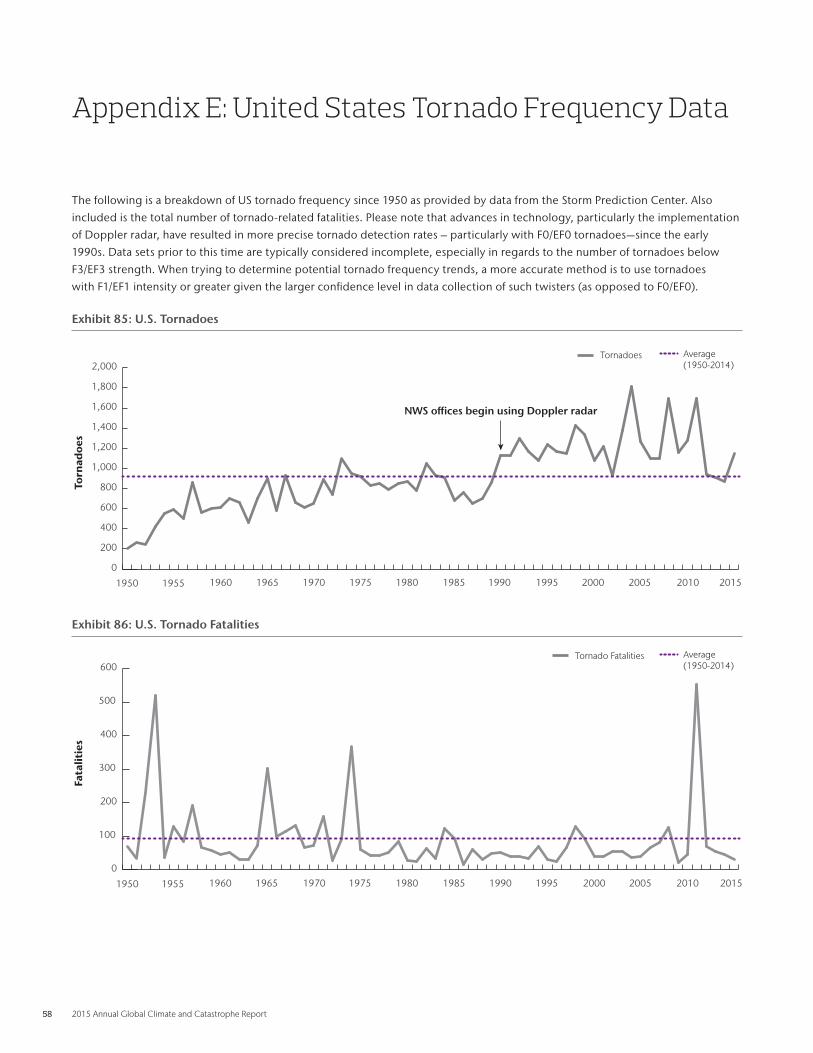
58 2015 Annual Global Climate and Catastrophe Report
The following is a breakdown of US tornado frequency since 1950 as provided by data from the Storm Prediction Center . Also
included is the total number of tornado-related fatalities . Please note that advances in technology, particularly the implementation
of Doppler radar, have resulted in more precise tornado detection rates – particularly with F0/EF0 tornadoes—since the early
1990s . Data sets prior to this time are typically considered incomplete, especially in regards to the number of tornadoes below
F3/EF3 strength . When trying to determine potential tornado frequency trends, a more accurate method is to use tornadoes
with F1/EF1 intensity or greater given the larger confidence level in data collection of such twisters (as opposed to F0/EF0) .
Exhibit 85: U.S. Tornadoes
Exhibit 86: U.S. Tornado Fatalities
Torn
adoe
s
Tornadoes
0
200
400
600
800
1,000
1,200
1,400
1,600
1,800
2,000Average(1950-2014)
20152010200520001995199019851980197519701965196019551950
NWS o�ces begin using Doppler radar
Fata
litie
s
Tornado Fatalities
0
100
200
300
400
500
600Average(1950-2014)
20152010200520001995199019851980197519701965196019551950
Appendix E: United States Tornado Frequency Data

Aon Benfield 59
Since 1950, the overall trend of tornadoes rated at F1/EF1 and above has remained nearly flat with a minimal 1 .3 percent
annual growth . Dependable data since the advent of the Doppler-era in 1990 shows a similar flat annual growth trend at just
0 .2 percent . When breaking down data to just the last 10 years, there has been a slight downward trend of 1 .6 percent .
Exhibit 87: U.S. Tornadoes by Rating (F1/EF1+, F2/EF2+)
Since 1950, the overall trend of higher-end tornadoes rated at F3/EF3 and above has remained nearly flat and shows a slight annual
decrease of 0 .8 percent . A comparable 1 .2 percent annual decrease is also found when looking at dependable data since the
advent of Doppler radar in 1990 . When breaking down data to just the last 10 years, there has been a similar nearly flat growth at
0 .5 percent .
Exhibit 88: U.S. Tornadoes by Rating (F3/EF3+, F4/EF4+)
Torn
adoe
s
F1/EF1+ F2/EF2+
0
100
200
300
400
500
600
700
800
900
1000Average(1950-2014)
20152010200520001995199019851980197519701965196019551950
Torn
adoe
s
F3/EF3+ F4/EF4+
0
20
40
60
80
100
120
140Average(1950-2014)
20152010200520001995199019851980197519701965196019551950

60 2015 Annual Global Climate and Catastrophe Report
Given the level of attention that tornadic activity causes in the United States, there has been increased interest in attempting to
determine whether certain atmospheric phases can be used to correlate seasonal patterns . The following exhibits analyze US tornado
frequencies in relation to ENSO phases . Based on data from the Storm Prediction Center since 1950, it appears that tornadic activity
is slightly elevated during La Niña phases, especially higher-end tornadoes with ratings at or above F3/EF3 strength . However, the
number of tornadoes during ENSO-neutral conditions is near the long-term average, and the totals from El Niño phases are slightly
below average .
Exhibit 89: U.S. Tornado Frequency by ENSO Phase (Total, F1/EF1+, F2/EF2+)
Exhibit 90: U.S. Tornado Frequency by ENSO Phase (F3/EF3+, F4/EF4+, F5/EF5)
0
100
200
300
400
500
F2/EF2F1/EF1F0/EF0
Average (1950-2014)El Niño (22 Years)Neutral (23 Years)La Niña (21 Years)
Torn
adoe
s
0
5
10
15
20
25
30
35
40
45
F5/EF5F4/EF4F3/EF3
Average (1950-2014)El Niño (22 Years)Neutral (23 Years)La Niña (21 Years)
Torn
adoe
s
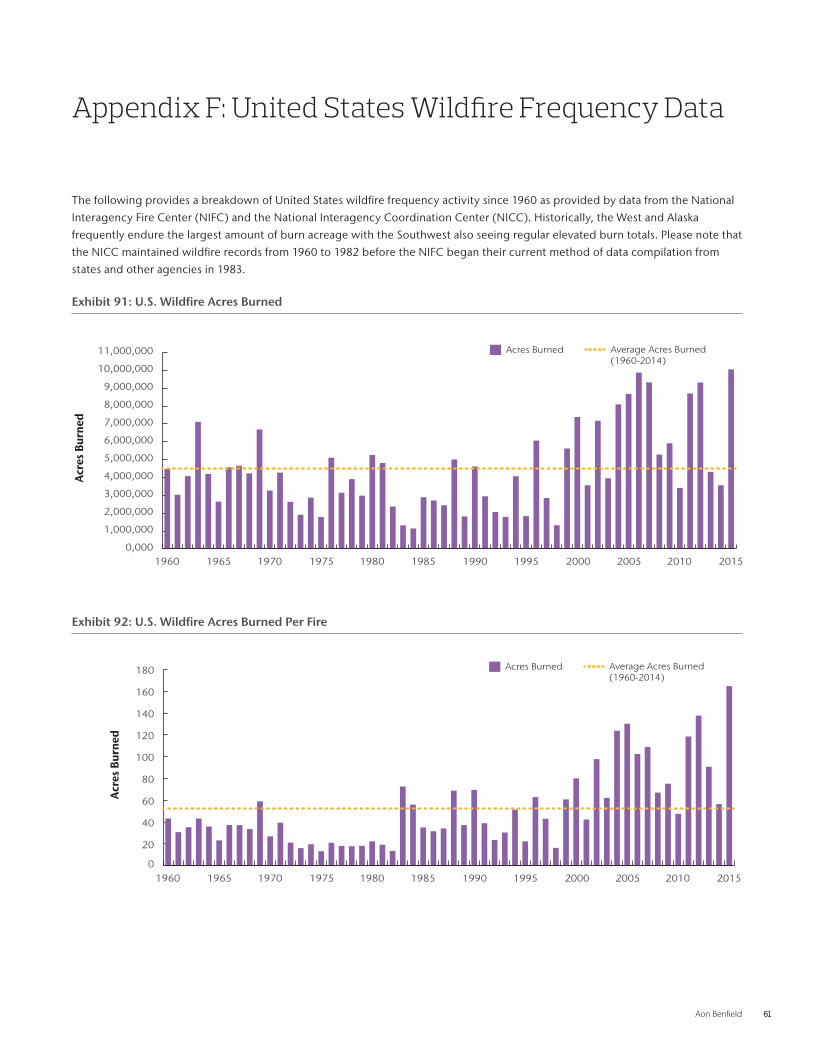
Aon Benfield 61
The following provides a breakdown of United States wildfire frequency activity since 1960 as provided by data from the National
Interagency Fire Center (NIFC) and the National Interagency Coordination Center (NICC) . Historically, the West and Alaska
frequently endure the largest amount of burn acreage with the Southwest also seeing regular elevated burn totals . Please note that
the NICC maintained wildfire records from 1960 to 1982 before the NIFC began their current method of data compilation from
states and other agencies in 1983 .
Exhibit 91: U.S. Wildfire Acres Burned
Exhibit 92: U.S. Wildfire Acres Burned Per Fire
Acr
es B
urne
d
Acres Burned Average Acres Burned(1960-2014)
2015201020052000199519901985198019751970196519600,000
1,000,000
2,000,000
3,000,000
4,000,000
5,000,000
6,000,000
7,000,000
8,000,000
9,000,000
10,000,000
11,000,000
Acr
es B
urne
d
Acres Burned Average Acres Burned(1960-2014)
2015201020052000199519901985198019751970196519600
20
40
60
80
100
120
140
160
180
Appendix F: United States Wildfire Frequency Data
62 2015 Annual Global Climate and Catastrophe Report
This report use publicly available data from the internet and other sources . Impact Forecasting® summarizes this publicly available
information for the convenience of those individuals who have contacted Impact Forecasting® and expressed an interest in natural
catastrophes of various types . To find out more about Impact Forecasting or to sign up for the Cat Reports, visit Impact Forecasting’s
webpage at www.impactforecasting.com .
Additional Report Details
TD = Tropical Depression, TS = Tropical Storm, HU = Hurricane, TY = Typhoon, STY = Super Typhoon, CY = Cyclone
Fatality estimates as reported by public news media sources and official government agencies .
Structures defined as any building — including barns, outbuildings, mobile homes, single or multiple family dwellings, and commercial facilities — that is damaged or destroyed by winds, earthquakes, hail, flood, tornadoes, hurricanes or any other natural-occurring phenomenon . Claims defined as the number of claims (which could be a combination of homeowners, commercial, auto and others) reported by various insurance companies through press releases or various public media outlets .
Damage estimates are obtained from various public media sources, including news websites, publications from insurance companies, financial institution press releases and official government agencies . Economic loss totals include any available insured loss estimates, which can be found in the corresponding event text .

Aon Benfield 63
Aon Benfield, a division of Aon plc (NYSE: AON), is the world’s leading reinsurance intermediary and full-service capital advisor . We
empower our clients to better understand, manage and transfer risk through innovative solutions and personalized access to all
forms of global reinsurance capital across treaty, facultative and capital markets . As a trusted advocate, we deliver local reach to the
world’s markets, an unparalleled investment in innovative analytics, including catastrophe management, actuarial and rating agency
advisory . Through our professionals’ expertise and experience, we advise clients in making optimal capital choices that will empower
results and improve operational effectiveness for their business . With more than 80 offices in 50 countries, our worldwide client base
has access to the broadest portfolio of integrated capital solutions and services . To learn how Aon Benfield helps empower results,
please visit aonbenfield.com .
Impact Forecasting is a catastrophe model development center of excellence within Aon Benfield whose seismologists,
meteorologists, hydrologists, engineers, mathematicians, GIS experts, finance, risk management and insurance professionals analyze
the financial implications of natural and man-made catastrophes around the world . Impact Forecasting’s experts develop software
tools and models that help clients understand underlying risks from hurricanes, tornadoes, earthquakes, floods, wildfires and terrorist
attacks on property, casualty and crop insurers and reinsurers . Impact Forecasting is the only catastrophe model development firm
integrated into a reinsurance intermediary . To find out more about Impact Forecasting®, visit www.impactforecasting.com .
About Aon Benfield
About Impact Forecasting
© Impact Forecasting® . No claim to original government works . The text and graphics of this publication are provided for
informational purposes only . While Impact Forecasting® has tried to provide accurate and timely information, inadvertent technical
inaccuracies and typographical errors may exist, and Impact Forecasting® does not warrant that the information is accurate,
complete or current . The data presented at this site is intended to convey only general information on current natural perils
and must not be used to make life-or-death decisions or decisions relating to the protection of property, as the data may not be
accurate . Please listen to official information sources for current storm information . This data has no official status and should not be
used for emergency response decision-making under any circumstances .
©Aon plc . All rights reserved . No part of this document may be reproduced, stored in a retrieval system, or transmitted in any form
or by any means, electronic, mechanical, photocopying, recording or otherwise . Impact Forecasting® is a wholly owned subsidiary
of Aon plc .
64 2015 Annual Global Climate and Catastrophe Report
ContactsStephen MildenhallChairman of Aon AnalyticsAon Analytics and Innovation Center+65 6231 6481stephen .mildenhall@aon .com
Adam PodlahaHead of Impact ForecastingAon Benfield AnalyticsImpact Forecasting 44 .0 .20 .7522 .3820adam .podlaha@aonbenfield .com
Steve BowenAssociate Director (Meteorologist)Aon Benfield AnalyticsImpact Forecasting1 .312 .381 .5883steven .bowen@aonbenfield .com
Claire DarbinyanSenior Analyst (Meteorologist)Aon Benfield AnalyticsImpact Forecasting+65 .6645 .0110claire .darbinyan@aonbenfield .com


About Aon Aon plc (NYSE:AON) is the leading global provider of risk management, insurance and reinsurance brokerage, and human resources solutions and outsourcing services. Through its more than 66,000 colleagues worldwide, Aon unites to empower results for clients in over 120 countries via innovative and effective risk and people solutions and through industry-leading global resources and technical expertise. Aon has been named repeatedly as the world’s best broker, best insurance intermediary, best reinsurance intermediary, best captives manager, and best employee benefits consulting firm by multiple industry sources. Visit aon.com for more information on Aon and aon.com/manchesterunited to learn about Aon’s global partnership with Manchester United.
© Aon plc 2016. All rights reserved.The information contained herein and the statements expressed are of a general nature and are not intended to address the circumstances of any particular individual or entity. Although we endeavor to provide accurate and timely information and use sources we consider reliable, there can be no guarantee that such information is accurate as of the date it is received or that it will continue to be accurate in the future. No one should act on such information without appropriate profes-sional advice after a thorough examination of the particular situation.
Risk. Reinsurance. Human Resources.