2015 annual report cover & back - brinker international · annual report 2015 . to our...
TRANSCRIPT

B R I N K E RINTERNATIONAL ®
Annual Report 2015

To Our Shareholders, Team Members, Guests, Franchise Partners and Supplier Partners:
LONG-TERM COMMITMENT
For several years now we have been persistently executing against our long-term strategy to deliver top line growth and increased value to you, our shareholders. As we look back at fiscal 2015 and look forward to fiscal 2016, our focus is unchanged.
While fiscal 2015 was not without its challenges, we continued to build upon last year’s accomplishments and deliver solid sales, improved margins and strong earnings. This year marked our 5th consecutive year of double-digit EPS growth, putting us on track to achieve our $4 EPS goal by fiscal 2017. We also returned $377 million to our shareholders in the form of dividends and share repurchase.
Going forward, we are more committed than ever to seeing our strategies through and are confident that this focused and meaningful approach to our business will ensure our place as one of the world’s leading casual dining restaurant companies. We are excited about the innovation in the pipeline for both brands, Chili’s Grill & Bar and Maggiano’s Little Italy, in fiscal 2016. Between technology advancements and distinguished culinary visions, we have several key components in place for our plan to drive sales and traffic in the coming year.
Chili’s Grill & Bar
The Chili’s brand has never been stronger. We offer fresh food served in the most innovative way, and in fiscal 2016, culinary and technology innovation that delivers on this while growing traffic and sales will remain our focus.
In fiscal 2015, we continued to fine-tune our menu and expand our unique culinary point of view of Fresh Mex and Fresh Tex, introducing a number of relevant menu items like smoked wings, burritos and top shelf tacos. Our food is the freshest it’s ever been – we smoke our own ribs, prepare our own salsa, make guacamole table side, and more. To educate guests on our freshness as well as our focused culinary vision, we introduced a new creative direction in Oct. 2014, “Fresh is Happening Now.”

The industry is giving us credit, our operators and team members are excited about what our chefs are bringing to the table and guest feedback tells us that no one can do Fresh Mex and Fresh Tex like Chili’s. They’ve given us full permission to play in this space, and we will continue to hone in on these relevant and differentiating menu platforms in fiscal 2016.
But Chili’s is more than just about serving great food, we’re also about delivering an exceptional dining experience. While the brand has evolved over the past 40 years, its passion has always been centered on one thing – making people feel special. We are proud to be a people company, and one of the ways we make our guests feel special every day is through technology.
Chili’s is embracing the digital guest experience more than anyone else in the industry. Ziosk® tabletop tablets have been in our company-owned restaurants for more than a year now, and we are only getting smarter at how we expand upon this tool to improve the dining experience and connect with our guests.
For instance, tabletop technology is the foundation for our recently launched and industry-leading loyalty program, My Chili’s Rewards. With the largest tabletop tablet network in the country, Chili’s is the first restaurant company of its size to completely integrate a loyalty program with tabletop technology and mobile as well as give guests full control of their points without ever having to rely on a manager or server.
While we are optimistic by initial results and feedback on our loyalty program, we expect to see the greatest impact to our business in fiscal 2016 as more guests sign up and redeem their rewards. By syncing our loyalty program with in-restaurant technology, we’ve made it easier than ever for our guests. Along those same lines, we also added NoWait to our Chili’s mobile app which allows guests to add their name to a restaurant’s wait list remotely, track their place in line and show up right when their table is ready.
Outside of food and technology, we invested back into our business with the acquisition of 103 franchised Chili’s restaurants primarily located in the Northeast and Southeast. The acquisition, which is expected to be EPS accretive in fiscal 2016 and strengthen long-term free cash flow generation, represented a compelling opportunity to create value for our shareholders and strengthen the brand in key markets as we rollout our reimage and loyalty programs to these restaurants.

Maggiano’s Little Italy
Similar to the Chili’s brand, Maggiano’s is committed to strategic growth. The brand welcomed three new restaurants in fiscal 2015 and will continue its steady pace in the next fiscal year with three more restaurants slated to open.
In addition to growth, we are focused on the top and bottom line. Maggiano’s has made great strides the past few years to strengthen its business model through menu innovation and cost of sales improvement. I’m confident that we will strike that perfect balance of being a scratch-kitchen restaurant serving only the highest quality food while becoming smarter about efficiencies.
In regards to the top line, it’s all about building sustained traffic growth and we’re developing better data-driven marketing initiatives that promote more frequency among our loyal guests and draw in new guests. While the brand is still attracting everyday guests with value offerings like On the House Classic Pastas and Lighter Take, it is also refocusing its efforts on special occasions to ensure it remains a number one destination for family and friends celebrating a memorable event.
Global Business Development
Our international business is stronger than ever as it continues to draft off the success of the US and differentiate itself from the competition. In fiscal 2015, we made tremendous progress in improving the guest experience, building a foundation for innovation and driving stronger margins with more than half of our global system now retrofitted for Kitchen of the Future. We also improved our culture, creating a better experience for guests and team members worldwide.
In fiscal 2016, we will remain focused on initiatives that grow sales and improve the business model. We expect to complete the implementation of Kitchen of the Future by the end of the fiscal year and are expanding the reimage program to drive relevancy with loyal and new guests. Additionally, we are opening 25-30 new restaurants and are deepening our insights to unlock the potential in markets poised for growth.

FUNDAMENTAL SHIFT
Chili’s and Maggiano’s continue to deliver results on their plans, and while we remain committed to our long-term strategies and initiatives, we are not resting on our laurels. We’ve made a number of significant technology advancements that have fundamentally shifted how we look at the business, what our guests need and how our team members deliver on those needs.
In fiscal 2016, we are going to leverage big data even more to make faster and better decisions across all fronts. This level of insight coupled with our long-term growth roadmap, makes us confident in our ability to deliver a differentiated experience for our guests as well as top line growth and increased value to shareholders in the year ahead.
Our talented team of operators will also be a key component to helping us deliver on these goals in fiscal 2016. We have one of the strongest operations teams in the industry and are attracting the best with Chili’s recently being named a "100 Best Workplaces for Millennials" by Great Place to Work® and Fortune. Our more than 100,000 team members worldwide are committed to making people feel special and consistently executing on our promises. It is something they do every day in our more than 1,600 restaurants and will continue to deliver upon in fiscal 2016 and beyond.
We are excited for what the year has in store and to see how we can aggressively and nimbly build upon the solid foundation and team we have in place today. As our shareholder, thank you for coming along with us on this journey and for your long-term commitment to Brinker, its brands, guests and team members.
Sincerely,
Wyman T. Roberts Chief Executive Officer and President

UNITED STATESSECURITIES AND EXCHANGE COMMISSION
Washington, D.C. 20549
FORM 10-KANNUAL REPORT PURSUANT TO SECTION 13 OR 15(d) OF
THE SECURITIES EXCHANGE ACT OF 1934
For the fiscal year ended June 24, 2015 Commission File No. 1-10275
BRINKER INTERNATIONAL, INC.(Exact name of registrant as specified in its charter)
DELAWARE 75-1914582(State or other jurisdiction of
incorporation or organization)(I.R.S. Employer
Identification No.)
6820 LBJ Freeway, Dallas, Texas 75240(Address of principal executive offices) (Zip Code)
(972) 980-9917(Registrant’s telephone number, including area code)
Securities registered pursuant to Section 12(b) of the Act:
Title of Each Class
Common Stock, $0.10 par value
Securities registered pursuant to Section 12(g) of the Act: None
Indicate by check mark if the registrant is a well-known seasoned issuer, as defined in Rule 405 of the SecuritiesAct. Yes È No ‘
Indicate by check mark if the registrant is not required to file reports pursuant to Section 13 or Section 15(d) of theAct. Yes ‘ No È
Indicate by check mark whether the registrant has submitted electronically and posted on its corporate Web site, if any, everyInteractive Data File required to be submitted and posted pursuant to Rule 405 of Regulation S-T during the preceding 12 months (or forsuch shorter period that the registrant was required to submit and post such files). Yes È No ‘
Indicate by check mark whether the registrant (1) has filed all reports required to be filed by Section 13 or 15(d) of the SecuritiesExchange Act of 1934 during the preceding 12 months (or for such shorter period that the registrant was required to file such reports), and(2) has been subject to such filing requirements for the past 90 days. Yes È No ‘
Indicate by check mark if disclosure of delinquent filers pursuant to Item 405 of Regulation S-K (229.405 of this chapter) is notcontained herein, and will not be contained, to the best of the registrant’s knowledge, in definitive proxy or information statementsincorporated by reference in Part III of this Form 10-K or any amendment to this Form 10-K. ‘
Indicate by check mark whether the registrant is a large accelerated filer, an accelerated filer, or a non-accelerated filer. See definitionof “accelerated filer” in Rule 12b-2 of the Exchange Act. (Check one):
Large accelerated filer È Accelerated filer ‘
Non-accelerated filer ‘ (Do not check if a smaller reporting company) Smaller reporting company ‘
Indicate by check mark whether the registrant is a shell company (as defined in Rule 12b-2 of the Act). Yes ‘ No È
State the aggregate market value of the voting and non-voting common equity held by non-affiliates computed by reference to theprice at which the common equity was last sold, or the average bid and asked price of such common equity, as of the last business day ofthe registrant’s most recently completed second fiscal quarter. $3,497,359,922.
Indicate the number of shares outstanding of each of the registrant’s classes of common stock, as of the latest practicable date.
Class Outstanding at August 10, 2015
Common Stock, $0.10 par value 60,105,325 shares

DOCUMENTS INCORPORATED BY REFERENCE
We have incorporated portions of our Annual Report to Shareholders for the fiscal year ended June 24, 2015into Part II hereof, to the extent indicated herein. We have also incorporated by reference portions of our ProxyStatement for our annual meeting of shareholders on October 29, 2015, to be dated on or about September 14,2015, into Part III hereof, to the extent indicated herein.
PART I
Item 1. BUSINESS.
General
References to “Brinker,” the “Company,” “we,” “us,” and “our” in this Form 10-K are references to BrinkerInternational, Inc. and its subsidiaries and any predecessor companies of Brinker International, Inc.
We own, develop, operate and franchise the Chili’s Grill & Bar (“Chili’s”) and Maggiano’s Little Italy(“Maggiano’s”) restaurant brands. The Company was organized under the laws of the State of Delaware inSeptember 1983 to succeed to the business operated by Chili’s, Inc., a Texas corporation, which was organized inAugust 1977. We completed the acquisition of Maggiano’s in August 1995.
Restaurant Brands
Chili’s Grill & Bar
Chili’s, a recognized leader in the Bar & Grill category of casual dining, has been operating restaurants for40 years. Chili’s also enjoys a global presence with locations in 30 countries and two U.S. territories around theworld. Whether domestic or international, company-owned or franchised, Chili’s and its more than 100,000 teammembers are dedicated to delivering fresh, high-quality food with a unique point of view, as well as diningexperiences that make people feel special. Chili’s menu features authentic Fresh Mex and Fresh Tex cuisineincluding signature items such as Baby Back Ribs smoked in-house, Hand-Crafted Burgers served with house-made garlic dill pickles, Mix and Match Fajitas, Tableside Guacamole and house-made Chips and Salsa. Thisyear, Chili’s expanded upon its Fresh Tex and Fresh Mex menu platforms introducing items like Smoked Wings,White Spinach Queso and Top Shelf Tacos, carefully crafted with a unique blend of flavors and high-qualityingredients. The all-day menu offers guests a generous selection of appetizers, entrees and desserts at affordableprices. Weekday Lunch Combos are also available enabling guests to pick their favorites for the perfect meal. Inaddition to our flavorful food options, Chili’s offers a full selection of alcoholic beverages including flavor-infused margaritas and craft beer. For guests seeking convenience, Chili’s To Go menu is available to orderonline, through the brand’s mobile app or by calling the restaurant. In addition to convenience, guests can enjoythe control of on-demand ordering, a number of entertainment offerings and the pay-at-the table feature that isavailable on the tabletop device located on every Chili’s table nationwide. In May 2015, Chili’s has alsolaunched My Chili’s Rewards, a guest loyalty program to its company-owned restaurants. My Chili’s Rewardsenables guests to earn and redeem their Chili’s favorites when they want on any device they want.
During the year ended June 24, 2015, at our company-owned restaurants, entrée selections ranged in menuprice from $6.00 to $17.99. The average revenue per meal, including alcoholic beverages, was approximately$14.52 per person. During this same year, food and non-alcoholic beverage sales constituted approximately86.3% of Chili’s total restaurant revenues, with alcoholic beverage sales accounting for the remaining 13.7%.Our average annual sales volume per Chili’s restaurant during this same year was $3.1 million.
Maggiano’s Little Italy
Maggiano’s is a full-service, national, casual dining Italian restaurant brand with a passion for makingpeople feel special. The exterior of each Maggiano’s restaurant varies to reflect local architecture; however, the
2

interior of all locations transport our guests back to a classic Italian-American restaurant in the style of NewYork’s Little Italy in the 1940s. Our Maggiano’s restaurants feature individual and family-style menus, and mostof our restaurants also have extensive banquet facilities designed to host large party business or social events. Wehave a full lunch and dinner menu offering chef-prepared, classic Italian-American fare in the form of appetizers,entrées with bountiful portions of pasta, chicken, seafood, veal and prime steaks, and desserts. Our Maggiano’srestaurants also offer a full range of alcoholic beverages, including a selection of Handcrafted Classic Cocktailsand premium wines. In addition, Maggiano’s offers a full carryout menu as well as local delivery services.
During the year ended June 24, 2015, entrée selections ranged in menu price from $12.95 to $42.50. Theaverage revenue per meal, including alcoholic beverages, was approximately $27.00 per person. During thissame year, food and non-alcoholic beverage sales constituted approximately 83.0% of Maggiano’s totalrestaurant revenues, with alcoholic beverage sales accounting for the remaining 17.0%. Sales from events at ourbanquet facilities made up 18.7% of Maggiano’s total restaurant revenues for the year. Our average annual salesvolume per Maggiano’s restaurant during this same year was $8.6 million.
Business Strategy
We are committed to strategies and initiatives that are centered on long-term sales and profit growth,enhancing the guest experience and team member engagement. These strategies are intended to differentiate ourbrands from the competition, reduce the costs associated with managing our restaurants and establish a strongpresence for our brands in key markets around the world.
Key economic indicators such as total employment and consumer confidence continued to improve steadilythis year and have driven slight improvements in the casual dining industry; however, growing sales and traffichas been a challenge over the last five years with steadily increasing competition. U.S. economic growth hasbeen steady but wage growth has been slow and this wage pressure has challenged both restaurant operators andconsumers as discretionary income available for restaurant visits has been limited. In response to these economicfactors, we have developed strategies that we believe are appropriate for all operating conditions and will providea solid foundation for earnings growth going forward.
We have completed a number of significant initiatives in recent years that have helped us drive profitablesales and traffic growth and to improve the guest experience in our restaurants. Investments in restaurantreimages, new kitchen equipment and operations software have improved the relevance of the Chili’s brand andthe efficiency of our restaurants. Our new kitchen equipment enables us to provide a higher quality product at afaster pace, enhancing both profitability and guest satisfaction. Our Chili’s reimage program is complete and thedesign is intended to revitalize Chili’s in a way which enhances the relevance of the brand while staying true toChili’s brand heritage. All company-owned Chili’s and Maggiano’s restaurants are now operating with anintegrated point of sale and back office software system that was designed to improve the efficiency of ourrestaurant operations and reporting capabilities. We believe that these initiatives will positively impact thecustomer perception of our restaurant in both the dining room and bar areas and provide us with a greatfoundation for continued success.
We have also differentiated the Chili’s brand by leveraging technology initiatives to engage our guests anddrive traffic. All traditional domestic Chili’s restaurants, with the exception of airport and college locations, arenow outfitted with tabletop devices which gives us the largest network of tabletop devices in the country. OurZiosk branded tabletop device is a multi-functional device which provides entertainment, ordering, guest surveyand pay-at-the-table capabilities. We built on this momentum by launching the Chili’s loyalty program called MyChili’s Rewards in the fourth quarter of this fiscal year which utilizes our existing tabletop technology andprovides us an opportunity to connect with our guests in a meaningful way to tailor their experience in ourrestaurants. We are also investing in additional upgrades to our on-line ordering and mobile platforms. We havealso launched No Wait, a new technology which allows our hosts to provide more accurate wait times when a
3
guest arrives during peak shifts, and to send them a text when their table is ready. Guests can also add themselvesto the wait list via the Chili’s mobile app which we believe will reduce the in-restaurant wait time and increasethe efficiency of our restaurants by allowing us to turn tables more effectively.
We continually evaluate our menu at Chili’s to improve quality, freshness and value by introducing newitems and improving existing favorites. Our Fresh Mex platform introduced last year has been very successfuland includes Fresh Mex Bowls, Mix and Match Fajitas and Tableside Guacamole. We leveraged this success bylaunching our new Top-Shelf Taco category including Pork Carnitas, Ranchero Chicken and Prime Rib tacos inthe fourth quarter. We also introduced Fresh Tex, a new Texas themed platform featuring ribs, steaks and burgersthis year. Our traditional burger menu was also updated with a new line of Craft Burgers, featuring fresh potatobuns and house made garlic pickles. We continually seek opportunities to reinforce value and create interest forthe brand with new and varied offerings to further enhance sales and drive incremental traffic. We are committedto offering a compelling everyday menu that provides items our customers prefer at a solid value.
Improvements at Chili’s will have the most significant impact on the business; however, our results will alsobenefit through additional contributions from Maggiano’s and our global business. Maggiano’s continues todeliver sales growth and has opened three restaurants in fiscal 2015 based on the new prototype, which excludesbanquet space. This new prototype will allow the brand to enter new markets for which the existing model wasnot suited. Maggiano’s is committed to delivering high quality food and a dining experience in line with ourbrand heritage. We will continue to strengthen the brand’s business model with kitchen efficiency and inventorycontrols that we believe will continue to enhance profitability.
We capitalized on an opportunity to further expand our domestic business by purchasing a franchisee of 103Chili’s restaurants in the Northeast and Southeast U.S. subsequent to the end of the year. We believe thisacquisition fits well within our capital allocation strategy and will enable us to grow our sales and profits in fiscal2016. We have begun implementing several initiatives at these locations designed to increase sales and marginsincluding restaurant reimage, loyalty and other operational processes. Global expansion allows furtherdiversification which will enable us to build strength in a variety of markets and economic conditions. Thisexpansion will come through franchise relationships, acquisitions, joint venture arrangements and equityinvestments. Our international franchisees opened 22 new restaurants in fiscal 2015 and plan to open 25 to 30new international Chili’s restaurants in fiscal 2016. Growing franchise operations enables us to improve revenuesand operating income through increased royalties and franchise fees. We continue to work with our domesticfranchisees to increase the pace of reimages of their restaurants, and to leverage technology initiatives like MyChili’s Rewards and No Wait in their restaurants.
The casual dining industry is a highly competitive business which is sensitive to changes in economicconditions, trends in lifestyles and fluctuating costs. Our priority remains increasing profitable growth over timein all operating environments. We have designed both operational and financial strategies to achieve this goaland in our opinion, improve shareholder value. Success with our initiatives to improve sales trends andoperational effectiveness will enhance the profitability of our restaurants and strengthen our competitive position.We believe the effective execution of our financial strategies, including repurchasing shares of our commonstock, payment of quarterly dividends, disciplined use of capital and efficient management of operating expenses,will enhance shareholder value. We remain confident in the financial health of our company, the long-termprospects of the industry, as well as our ability to perform effectively in a competitive marketplace and a varietyof economic environments.
Company Development
In fulfilling our long-term vision, over the past fiscal year we continued the expansion of our restaurantbrands domestically through a select number of new company-owned restaurants in strategically desirablemarkets. We concentrate on the development of certain identified markets to achieve the necessary levels toimprove our competitive position, marketing potential, profitability and return on invested capital. Our domesticexpansion efforts focus not only on major metropolitan areas in the United States but also on smaller market
4
areas and non-traditional locations (such as airports and universities) that can adequately support our restaurantbrands. For smaller market areas, we have developed a newer smaller prototype that allows us to expand intothese markets serving our guests while maintaining a focus on profitability and return on invested capital.
The restaurant site selection process is critical and we devote significant effort to the investigation of newlocations utilizing a variety of sophisticated analytical techniques. Our process evaluates a variety of factors,including: trade area demographics, such as target population density and household income levels, physical sitecharacteristics, such as visibility, accessibility and traffic volume; relative proximity to activity centers, such asshopping centers, hotel and entertainment complexes and office buildings; supply and demand trends, such asproposed infrastructure improvements, new developments and existing and potential competition. Members ofeach brand’s executive team inspect, review and approve each restaurant site prior to its acquisition for thatbrand.
The specific rate at which we are able to open new restaurants is determined, in part, by our success inlocating satisfactory sites, negotiating acceptable lease or purchase terms, securing appropriate localgovernmental permits and approvals, and by our capacity to supervise construction and recruit and trainmanagement and hourly team members.
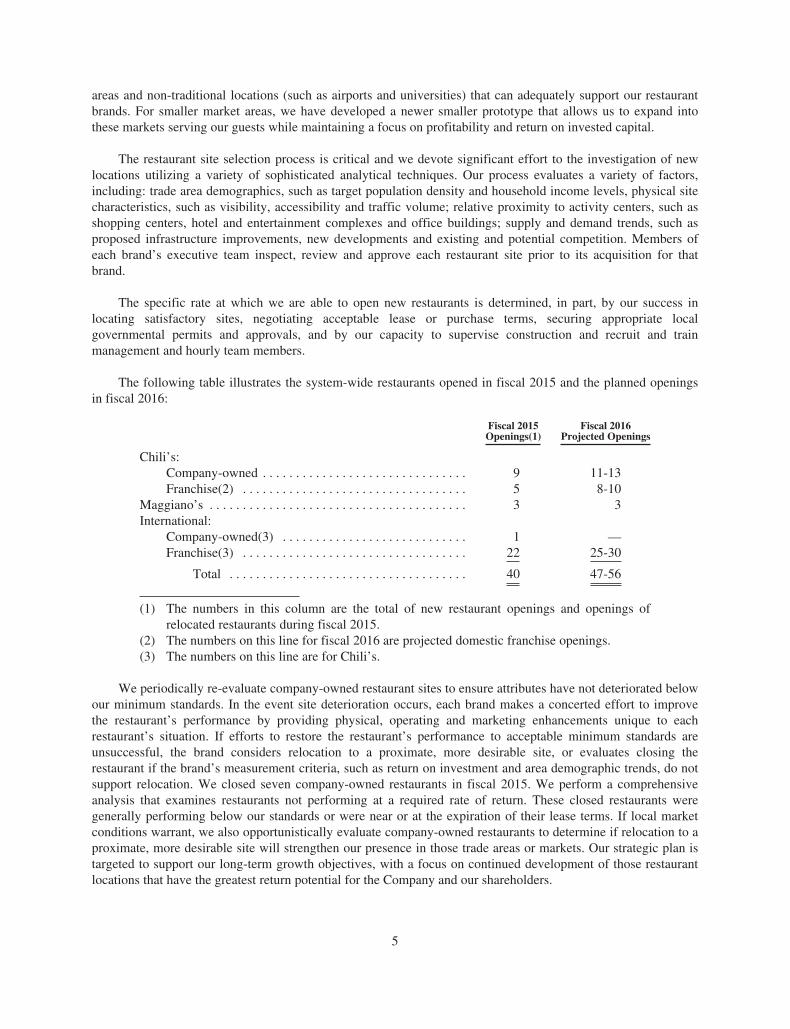
The following table illustrates the system-wide restaurants opened in fiscal 2015 and the planned openingsin fiscal 2016:
Fiscal 2015Openings(1)
Fiscal 2016Projected Openings
Chili’s:Company-owned . . . . . . . . . . . . . . . . . . . . . . . . . . . . . . . 9 11-13Franchise(2) . . . . . . . . . . . . . . . . . . . . . . . . . . . . . . . . . . 5 8-10
Maggiano’s . . . . . . . . . . . . . . . . . . . . . . . . . . . . . . . . . . . . . . . 3 3International:
Company-owned(3) . . . . . . . . . . . . . . . . . . . . . . . . . . . . 1 —Franchise(3) . . . . . . . . . . . . . . . . . . . . . . . . . . . . . . . . . . 22 25-30
Total . . . . . . . . . . . . . . . . . . . . . . . . . . . . . . . . . . . . 40 47-56
(1) The numbers in this column are the total of new restaurant openings and openings ofrelocated restaurants during fiscal 2015.
(2) The numbers on this line for fiscal 2016 are projected domestic franchise openings.(3) The numbers on this line are for Chili’s.
We periodically re-evaluate company-owned restaurant sites to ensure attributes have not deteriorated belowour minimum standards. In the event site deterioration occurs, each brand makes a concerted effort to improvethe restaurant’s performance by providing physical, operating and marketing enhancements unique to eachrestaurant’s situation. If efforts to restore the restaurant’s performance to acceptable minimum standards areunsuccessful, the brand considers relocation to a proximate, more desirable site, or evaluates closing therestaurant if the brand’s measurement criteria, such as return on investment and area demographic trends, do notsupport relocation. We closed seven company-owned restaurants in fiscal 2015. We perform a comprehensiveanalysis that examines restaurants not performing at a required rate of return. These closed restaurants weregenerally performing below our standards or were near or at the expiration of their lease terms. If local marketconditions warrant, we also opportunistically evaluate company-owned restaurants to determine if relocation to aproximate, more desirable site will strengthen our presence in those trade areas or markets. Our strategic plan istargeted to support our long-term growth objectives, with a focus on continued development of those restaurantlocations that have the greatest return potential for the Company and our shareholders.
5

Franchise Development
In addition to our development of company-owned restaurants, our restaurant brands will maintainexpansion through our franchisees and joint venture partners.
As part of our strategy to expand through our franchisees, our franchise operations (domestically andinternationally) increased in fiscal 2015. The following table illustrates the percentages of franchise operations asof June 24, 2015 for the Company and by restaurant brand, respectively:
Percentage of FranchiseOperated Restaurants
Domestic(1) International(2) Overall(3)
Brinker . . . . . . . . . . . . . . . . . . . . . . . . . . . . . . . . . . . 33% 96% 45%Chili’s . . . . . . . . . . . . . . . . . . . . . . . . . . . . . . . . 34% 96% 47%Maggiano’s . . . . . . . . . . . . . . . . . . . . . . . . . . . . —% —% —%
(1) The percentages in this column are based on number of domestic franchised restaurantsversus total domestic restaurants.
(2) The percentages in this column are based on number of international franchisedrestaurants versus total international restaurants.
(3) The percentages in this column are based on the total number of franchised restaurants(domestic and international) versus total system-wide number of restaurants.
International
We continue our international growth through development agreements with new and existing franchiseesand joint venture partners, introducing Chili’s to new countries and expanding the brand within our existingmarkets. As of June 24, 2015, we had 22 total development arrangements. During fiscal year 2015, ourinternational franchisees and joint venture partners opened 22 Chili’s restaurants. We entered into a newdevelopment agreement with one of our existing franchisees for development of two Chili’s Express restaurantsat U.S. Armed Forces installations on the island of Okinawa, Japan.
As we develop Chili’s internationally, we will selectively pursue expansion through various means,including franchising, joint ventures and acquisitions. Similar to our domestic agreements, typical internationalagreements provide the vehicle for payment of development fees and franchise fees in addition to subsequentroyalty fees based on the gross sales of each restaurant. We expect future agreements to remain limited toenterprises who demonstrate a proven track record as a restaurant operator and showcase financial strength thatcan support a multi-unit development agreement, as well as, in some instances, multi-brand operations.
During the year ended June 24, 2015, we also opened one company-owned Chili’s restaurant in Alberta,Canada.
Domestic
We remain committed to also growing our number of domestic franchised restaurants. We areaccomplishing this through existing, new or renewed development and franchise obligations with new or existingfranchisees. In addition, we have from time to time also sold and may sell company-owned restaurants to ourfranchisees (new or existing). As of June 24, 2015, two domestic development arrangements existed. Typicaldomestic agreements provide for payment of development and initial franchise fees in addition to subsequentroyalty and advertising fees based on the gross sales of each restaurant. We expect future domestic agreements toremain limited to enterprises having significant experience as restaurant operators and proven financial ability tosupport and develop multi-unit operations.
Domestic expansion efforts continue to focus not only on major metropolitan areas in the United States butalso on smaller market areas and non-traditional locations (such as airports, college campuses and food courts)that can adequately support our restaurant brands.
6

During the year ended June 24, 2015, our domestic franchisees opened five Chili’s restaurants.
Following the end of our fiscal year 2015, we acquired Pepper Dining Holding Corp., a franchisee of 103Chili’s restaurants primarily located in the Northeast and Southeast United States. This acquisition represented anopportunity to create value for our shareholders and generate additional earnings and cash flow growth. Wecontinue to remain committed to growing and expanding our existing franchisees.
Restaurant Management
Our Chili’s and Maggiano’s brands have separate designated teams who support each brand includingoperations, finance, franchise, marketing, peopleworks and culinary. We believe these strategic, brand-focusedteams foster the identities of the individual and uniquely positioned brands. To maximize efficiencies, brandscontinue to utilize common and shared infrastructure, including, among other services, accounting, informationtechnology, purchasing, legal and restaurant development.
At the restaurant level, management structure varies by brand. A typical restaurant is led by a managementteam including a general manager, two to six additional managers, and for Maggiano’s, an additional three tofour chefs. The level of restaurant supervision depends upon the operating complexity and sales volume ofindividual locations.
We believe there is a high correlation between the quality of restaurant management and the long-termsuccess of a brand. In that regard, we encourage increased experience at all management positions throughvarious short and long-term incentive programs, which may include equity ownership. These programs, coupledwith a general management philosophy emphasizing quality of life, have enabled us to attract and retain key teammembers, and enjoy turnover of managers and team members that is below industry averages.
We ensure consistent quality standards in all brands through the issuance of operations manuals covering allelements of operations and food and beverage manuals, which provide guidance for preparation of brand-formulated recipes. Routine visitation to the restaurants by all levels of supervision enforces strict adherence toour overall brand standards and operating procedures. Each brand is responsible for maintaining their operationaltraining program. Depending on the brand, the training program typically includes a training period of two-to-three months for restaurant management trainees, as well as special training for high-potential managers. We alsoprovide recurring management training for managers and supervisors to improve effectiveness or prepare themfor more responsibility.
Supply Chain
Our ability to maintain consistent quality and continuity of supply throughout each restaurant brand dependsupon acquiring products from reliable sources. Our pre-approved suppliers and our restaurants are required toadhere to strict product and safety specifications established through our quality assurance and culinaryprograms. These requirements ensure high quality products are served in each of our restaurants. We strategicallynegotiate directly with major suppliers to obtain competitive prices. We also use purchase commitment contractswhen appropriate to stabilize the potentially volatile pricing associated with certain commodity items. Allessential products are available from pre-qualified distributors to be delivered to our restaurant brands.Additionally, as a purchaser of a variety of protein products, we require our suppliers to adhere to humaneprocessing standards for their respective industries and encourage them to evaluate new technologies for foodsafety and humane processing improvements. Due to the relatively rapid turnover of perishable food products,inventories in the restaurants, which consists primarily of food, beverages and supplies, have a modest aggregatedollar value in relation to revenues. Internationally, our franchisees and joint venture operations may encountercultural and regulatory differences resulting in variances with product specifications for international restaurantlocations.
7

Advertising and Marketing
Our brands generally target the 18 to 59 year-old age group. It is our belief that these consumers value thebenefits of the casual dining category for multiple meal occasions. Brinker has launched several brand initiativesaimed at making both brands more “New School” or specifically more relevant for today’s evolving consumer. Indoing so, we focus on the largest segment opportunities such as guests we have identified as “Win-backs”, whohave stopped using the brand six months or more ago, and “Switchers”, who are not loyal to one brand.Initiatives include restaurant reimages designed to provide a more comfortable, up-to-date environment; newkitchen equipment and procedures that deliver a more consistent food experience; food innovation with qualityingredients, made with care and presented with pride; and brand messaging that showcases the vibrantexperiences of our restaurants, while demonstrating our quality, freshness and the care we put into thepreparation of our food. We engage with our target groups, through a mix of national television, digitaladvertising, database marketing and social media with each of our restaurant brands utilizing one or more ofthese mediums to meet our communication strategies and budget. We recently launched an industry-leadingloyalty program enabling members to earn and redeem what they want, when they want on the device theywant—online, mobile app or tabletop tablet.
Our franchise agreements generally require advertising contributions to us by the franchisees. We use thesecontributions, in conjunction with company funds, for the purpose of retaining agencies, obtaining consumerinsights, developing and producing brand-specific creative materials and purchasing national or regional media tomeet the brand’s strategy. Some franchisees also spend additional amounts on local advertising. Any such localadvertising must first be approved by us.
Team Members
As of June 24, 2015, we employed approximately 53,000 team members, of which 615 were restaurantsupport center personnel in Dallas, and 4,007 were restaurant area directors, managers, or trainees. Theremaining 48,394 were employed in non-management restaurant positions. Our executive officers have anaverage of 20 years of experience in the restaurant industry.
We have a positive team member relations outlook and continue to focus on improving our team memberturnover rate. We have a variety of tools and strong resources in place to help us recruit and retain the best talentto work in our restaurants.
The majority of our team members, outside of restaurant management and restaurant support centerpersonnel, are paid on an hourly basis. We stand firm in the belief that we provide competitive workingconditions and wages favorable with other companies in our industry. Our team members are not covered by anycollective bargaining agreements.
Trademarks
We have registered and/or have pending, among other marks, “Brinker International”, “Chili’s”, “Chili’sBar & Bites”, “Chili’s Express”, “Chili’s Margarita Bar”, “Chili’s Southwest Grill & Bar”, “Chili’s Too”,“Maggiano’s”, and “Maggiano’s Little Italy”, as trademarks with the United States Patent and Trademark Office.
Available Information
We maintain an internet website with the address of http://www.brinker.com. You may obtain, free ofcharge, at our website, copies of our reports filed with, or furnished to, the Securities and Exchange Commission(the “SEC”) on Forms 10-K, 10-Q and 8-K. Any amendments to such reports are also available for viewing andcopying at our internet website. These reports will be available as soon as reasonably practicable after filing suchmaterial with, or furnishing it to, the SEC. In addition, you may view and obtain, free of charge, at our website,copies of our corporate governance materials, including, Corporate Governance Guidelines, Audit CommitteeCharter, Compensation Committee Charter, Governance and Nominating Committee Charter, Code of Conductand Ethical Business Policy, and Problem Resolution Procedure/Whistle Blower Policy.
8

Item 1A. RISK FACTORS.
We wish to caution you that our business and operations are subject to a number of risks and uncertainties.The factors listed below are important because they could cause actual results to differ materially from ourhistorical results and from those projected in forward-looking statements contained in this report, in our otherfilings with the SEC, in our news releases, written or electronic communications, and verbal statements by ourrepresentatives.
You should be aware that forward-looking statements involve risks and uncertainties. These risks anduncertainties may cause our or our industry’s actual results, performance or achievements to be materiallydifferent from any future results, performances or achievements contained in or implied by these forward-lookingstatements. Forward-looking statements are generally accompanied by words like “believes,” “anticipates,”“estimates,” “predicts,” “expects,” and other similar expressions that convey uncertainty about future events oroutcomes. We expressly disclaim any obligation to update or revise any forward-looking statements, whether asa result of new information, future events or otherwise.
Risks Related to Our Business
Competition may adversely affect our operations and financial results.
The restaurant business is highly competitive as to price, service, restaurant location, nutritional and dietarytrends and food quality, and is often affected by changes in consumer tastes, economic conditions, population andtraffic patterns. We compete within each market with locally-owned restaurants as well as national and regionalrestaurant chains, some of which operate more restaurants and have greater financial resources and longeroperating histories than ours. The U.S. total employment market is growing, and there is active competition forquality management personnel and hourly team members. We continue to face competition as a result of severalfactors, including quick service and fast casual restaurants also offering high quality food and beverage choicesand the convergence in grocery, deli and restaurant services. We compete primarily on the quality, variety andvalue perception of menu items, as well as the quality and efficiency of service, the attractiveness of facilities andthe effectiveness of advertising and marketing programs.
Our restaurants also face competition from the introduction of new products and menu items by competitors,as well as substantial price discounting among other offers, and are likely to continue to face such futurecompetition in light of the slow paced economic growth. Although we may implement a number of businessstrategies, the success of new products, initiatives and overall strategies is highly difficult to predict and will beinfluenced by competitive product offerings, pricing and promotions offered by competitors. Our ability todifferentiate our brands from their competitors, which is in part limited by the advertising spend available to usand by consumer perception, cannot be assured. These factors could reduce the gross sales or profitability at ourrestaurants, which would decrease revenues or profitability generated by company-owned restaurants and royaltypayments from franchisees.
Changing health or dietary preferences may cause consumers to avoid our products in favor of alternativefoods. The foodservice industry as a whole rests on consumer preferences and demographic trends at the local,regional, national and international levels, including the impact on consumer eating habits of new informationregarding diet, nutrition, health and health insurance. We and our franchisees depend on the sustained demand forour products, which may be affected by factors outside of our control. Changes in nutritional or health insuranceguidelines issued by federal or local government agencies, issuance of similar guidelines or statisticalinformation by other federal, state or local municipalities, academic studies, or advocacy organizations, amongother things, may impact consumer choice and cause consumers to select foods other than those that are offeredby our restaurants. We may not be able to adequately adapt our menu offerings to keep pace with developmentsin current consumer preferences, which may result in reductions to the revenues generated by our company-owned restaurants and the payments we receive from franchisees.
9
The slow global economic growth continues to impact consumer discretionary spending and a continuedand prolonged slow trend in growth could result in declines in consumer discretionary spending materiallyaffecting our financial performance in the future.
The restaurant industry is dependent upon consumer discretionary spending. Despite improvement in totalemployment and consumer confidence in the U.S., consumer incomes have been slow to recover anddiscretionary income for restaurant visits has been challenged. Economic improvement in the restaurant industrycontinues to come from cost savings initiatives as well as our success to improve the guest experience within ourexisting restaurant locations. If this current slow economic growth continues for a prolonged period of time and/or deepens in magnitude returning to the negative trends of the prior years, our business, results of operations andability to comply with the covenants under our credit facility could be materially affected. Deterioration in guesttraffic and/or a reduction in the average amount guests spend in our restaurants will negatively impact ourrevenues. This will also result in lower royalties collected, sales deleverage, spreading fixed costs across a lowerlevel of sales, and in turn, cause downward pressure on our profitability. This could result in further reductions instaff levels, asset impairment charges and potential restaurant closures.
Future slow global economic growth or recessionary effects on us are unknown at this time and could have apotential material adverse affect on our financial position and results of operations. There is no assurance thatany governmental plan to restore fiscal responsibility or future plans to stimulate the economy will foster growthin consumer confidence, stabilize the financial markets, increase liquidity and the availability of credit, or resultin lower unemployment.
Inflation may increase our operating expenses.
We have experienced impact from inflation. Inflation has caused added food, labor and benefits costs andincreased our operating expenses. As operating expenses rise, we, to the extent permitted by competition, recovercosts by raising menu prices, or by reviewing, then implementing, alternative products or processes, or other costreduction procedures. We cannot ensure, however, we will be able to continue to recover increases in operatingexpenses due to inflation in this manner.
Changes in governmental regulation may adversely affect our ability to maintain our existing and futureoperations and to open new restaurants.
We are subject to the Fair Labor Standards Act (which governs such matters as minimum wages, overtimeand other working conditions), along with the Americans with Disabilities Act, the Immigration Reform andControl Act of 1986, various family leave mandates and a variety of other laws enacted, or rules and regulationspromulgated by federal, state and local governmental authorities that govern these and other employmentmatters, including, tip credits, working conditions, safety standards and immigration status. We have experiencedand continue to expect adjustments in payroll expenses as a result of federal and state mandated increases in theminimum wage; we cannot be certain there will be no additional significant increases in the future. Enactmentand enforcement of various federal, state and local laws, rules and regulations on immigration and labororganizations may adversely impact the availability and costs of labor for our restaurants in a particular area oracross the United States. Other labor shortages or increased team member turnover could also increase laborcosts. In addition, our suppliers may be affected by higher minimum wage standards or availability of labor,which may increase the price of goods and services they supply to us. We continue to review the Affordable CareAct and regulations issued related to the law to evaluate the potential impact of this law on our business, and toaccommodate various parts of the law as they take effect. There are no assurances that a combination of costmanagement and price increases can accommodate all of the costs associated with compliance.
We are subject to laws and regulations, which vary from jurisdiction to jurisdiction, relating to nutritionalcontent and menu labeling. Compliance with these laws and regulations may lead to increased costs andoperational complexity, changes in sales mix and profitability, and increased exposure to governmental
10
investigations or litigation. We do not expect to incur material costs from compliance with the provision of theAffordable Care Act requiring disclosure of calories on the menus, but cannot reliably anticipate any changes inguest behavior resulting from implementation of this portion of the law, which could have adverse effects on oursales or results of operations.
Each of our company-owned and our franchisees’ restaurants is also subject to licensing and regulation byalcoholic beverage control, health, sanitation, safety and fire agencies in the state, county and/or municipalitywhere the restaurant is located. We generally have not encountered any material difficulties or failures inobtaining and maintaining the required licenses and approvals that could impact the continuing operations of anexisting restaurant, or delay or prevent the opening of a new restaurant. Although we do not, at this time,anticipate any occurring in the future, we cannot be certain that we, or our franchisees, will not experiencematerial difficulties or failures that could impact the continuing operations of an existing restaurant, or delay theopening of restaurants in the future.
We are also subject to federal and state environmental regulations, and although these have not had amaterial negative affect on our operations, we cannot ensure this will not occur in the future. In particular, theU.S. and other foreign governments have increased focus on environmental matters such as climate change,greenhouse gases and water conservation. This may lead to new initiatives directed at regulating an unspecifiedarray of environmental matters. These efforts could result in increased taxation or in future restrictions on orincreases in costs associated with food and other restaurant supplies, transportation costs and utility costs, any ofwhich could decrease our operating profits and/or necessitate future investments in our restaurant facilities andequipment to achieve compliance. Further, more stringent and varied requirements of local and stategovernmental bodies with respect to zoning, land use and environmental factors could delay, prevent or makecost prohibitive the continuing operations of an existing restaurant or the development of new restaurants inparticular locations.
Due to our international franchising, we are also subject to governmental regulations throughout the worldimpacting the way we do business with our international franchisees and joint venture partners. These includeantitrust and tax requirements, anti-boycott regulations, import/export/customs and other international traderegulations, the USA Patriot Act and the Foreign Corrupt Practices Act. Failure to comply with any such legalrequirements could subject us to monetary liabilities and other sanctions, which could adversely impact ourbusiness and financial performance.
The impact of current laws and regulations, the effect of future changes in laws or regulations that imposeadditional requirements and the consequences of litigation relating to current or future laws and regulations, orour inability to respond effectively to significant regulatory or public policy issues, could increase ourcompliance and other costs of doing business and therefore have an adverse affect on our results of operations.Failure to comply with the laws and regulatory requirements of federal, state and local authorities could result in,among other things, revocation of required licenses, administrative enforcement actions, fines and civil andcriminal liability. Compliance with these laws and regulations can be costly and can increase our exposure tolitigation or governmental investigations or proceedings.
Shortages or interruptions in the availability and delivery of food and other products may increase costsor reduce revenues.
Possible shortages or interruptions in the supply of food items and other products to our restaurants causedby inclement weather, natural disasters such as floods, drought and hurricanes; the inability of our suppliers toobtain credit in a tight credit market; food safety warnings or advisories or the prospect of such pronouncements;animal disease outbreaks (such as the avian flu outbreak in the midwestern U.S. in 2015); or other conditionsbeyond our control, could adversely affect the availability, quality and cost of items we buy and the operations ofour restaurants. Our inability to effectively manage supply chain risk could increase our costs and limit theavailability of products critical to our restaurant operations.
11

Our profitability may be adversely affected by increases in energy costs.
Our success depends in part on our ability to absorb increases in utility costs, in particular, electricity andnatural gas. Various regions of the United States in which we operate multiple restaurants have experiencedvolatility in utility prices. This has affected costs in the past and if they occur again, it would have possibleadverse effects on our profitability to the extent not otherwise recoverable through price increases or alternativeproducts, processes or cost reduction procedures. Further, higher prices for petroleum-based fuels may be passedon to us by suppliers putting further pressure on margins as well as impact our guests discretionary funds andability to patron our restaurants or their menu choices.
Successful strategic transactions are important to our future growth and profitability.
We evaluate potential franchisees of new and existing restaurants and joint venture investments, as well asmergers, acquisitions and divestitures, as part of our strategic planning initiative. These transactions involvevarious inherent risks, including accurately assessing:
• the value, future growth potential, strengths, weaknesses, contingent and other liabilities and potentialprofitability of franchise and joint venture partner candidates;
• our ability to achieve projected economic and operating synergies; and
• unanticipated changes in business and economic conditions affecting an acquired business or thecompletion of a divestiture.
We acquired Pepper Dining Holding Corp., a franchisee with 103 Chili’s restaurants in the northeastern andsoutheastern U.S. on June 25, 2015. These acquired restaurants have lower annual average sales volumes anddifferent margin structures than our company-owned Chili’s restaurants. We are integrating the acquiredrestaurants into our Chili’s operations structure and are rolling out processes to improve sales and margins. Weare also reimaging these restaurants and leveraging technology investments in the restaurants. There is noassurance that these initiatives will achieve the sales growth and margin improvements for which we haveplanned, and would not adversely impact our profitability in the future if not met.
If we are unable to meet our business strategy plan, our profitability in the future may be adverselyaffected.
Our ability to meet our business strategy plan is dependent upon, among other things, our and ourfranchisees’ ability to:
• increase gross sales and operating profits at existing restaurants with food and beverage options andhigh quality service desired by our guests through successful implementation of strategic initiatives;
• identify adequate sources of capital to fund and finance strategic initiatives, including reimaging ofexisting restaurants, new restaurant development and new equipment;
• identify available, suitable and economically viable locations for new restaurants;
• obtain all required governmental permits (including zoning approvals and liquor licenses) on a timelybasis;
• hire all necessary contractors and subcontractors, obtain construction materials at suitable prices, andmaintain construction schedules; and
• hire and train or retain qualified managers and team members for existing and new restaurants.
The current slow economic growth could have a material adverse impact on our landlords or other tenantsin retail centers in which we or our franchisees are located, which in turn could negatively affect ourfinancial results.
If the slow economic growth continues or returns to prior recessionary levels, our landlords may be unableto obtain financing or remain in good standing under their existing financing arrangements, resulting in failures
12

to pay required construction contributions or satisfy other lease covenants to us. In addition, other tenants at retailcenters in which we or our franchisees are located or have executed leases, may fail to open or may ceaseoperations. If our landlords fail to satisfy required co-tenancies, this may result in us or our franchiseesterminating leases or delaying openings in these locations. Also, decreases in total tenant occupancy in retailcenters in which we are located may affect guest traffic at our restaurants. All of these factors could have amaterial adverse impact on our operations.
The success of our franchisees is important to our future growth.
We have a significant percentage of system-wide restaurants owned and operated by our franchisees. Whileour franchise agreements are designed to maintain brand consistency, the franchise relationship reduces ourdirect day-to-day oversight of these restaurants and may expose us to risks not otherwise encountered if wemaintained ownership and control. These risks include franchisee defaults in their obligations to us arising fromfinancial or other difficulties encountered by them, such as payments to us or maintenance and improvementsobligations; limitations on enforcement of franchise obligations due to bankruptcy or insolvency proceedings;inability to participate in business strategy changes due to financial constraints; inability to meet rent obligationson leases on which we retain contingent liability; and failure to comply with food quality and preparationrequirements subjecting us to litigation even when we are not legally liable for a franchisee’s actions or failure toact.
Additionally our international franchisees and joint venture partners are subject to risks not encountered byour domestic franchisees. These risks include:
• difficulties in achieving consistency of product quality and service as compared to U.S. operations;
• changes to recipes and menu offerings to meet cultural norms;
• challenges to obtain adequate and reliable supplies necessary to provide menu items and maintain foodquality; and
• differences, changes or uncertainties in economic, regulatory, legal, cultural, social and politicalconditions.
Our sales volumes generally decrease in winter months in North America.
Our sales volumes fluctuate seasonally and are generally higher in the summer months and lower in thewinter months, which may cause seasonal fluctuations in our operating results.
Unfavorable publicity relating to one or more of our restaurants in a particular brand may taint publicperception of the brand.
Multi-unit restaurant businesses can be adversely affected by publicity resulting from poor food quality,illness or health concerns or operating issues stemming from one or a limited number of restaurants. In particular,since we depend heavily on the Chili’s brand for a majority of our revenues, unfavorable publicity relating to oneor more Chili’s restaurants could have a material adverse effect on the Chili’s brand, and consequently on ourbusiness, financial condition and results of operations. The speed at which negative publicity (whether or notaccurate) can be disseminated has increased dramatically with the capabilities of electronic communication,including social media. If we are unable to quickly and effectively respond to such reports, we may sufferdeclines in guest traffic which could materially impact our financial performance.
Our inability or failure to recognize, respond to and effectively manage the accelerated impact of socialmedia could materially adversely impact our business.
There has been a marked increase in the use of social media platforms and similar devices which allowindividuals access to a broad audience of consumers and other interested persons. Many social media platforms
13

immediately publish the content their subscribers and participants can post, often without filters or checks onaccuracy of the content posted. Information posted on such platforms at any time may be adverse to our interestsor may be inaccurate, each of which may harm our performance, prospects, or business. The harm may beimmediate without affording us an opportunity for redress or correction. The dissemination of information onlinecould harm our business, prospects, financial condition, and results of operations, regardless of the information’saccuracy.
Many of our competitors are expanding their use of social media and new social medial platforms arerapidly being developed, potentially making more traditional social media platforms obsolete. As a result, weneed to continuously innovate and develop our social media strategies in order to maintain broad appeal withguests and brand relevance. As part of our marketing efforts, we rely on search engine marketing and socialmedia platforms to attract and retain guests. We have initiated a multi-year effort to implement new technologyplatforms that will allow us to digitally engage with our guests and employees and strengthen our marketing andanalytics capabilities in this increasingly connected society. The initiatives may not be successful, resulting inexpenses incurred without the benefit of higher revenues, increased employee engagement or brand recognition.In addition, a variety of risks are associated with the use of social media, including the improper disclosure ofproprietary information, negative comments about us, exposure of personally identifiable information, fraud, orout-of-date information. The inappropriate use of social media vehicles by our guests or employees couldincrease our costs, lead to litigation or result in negative publicity that could damage our reputation.
Litigation could have a material adverse impact on our business and our financial performance.
We are subject to lawsuits, administrative proceedings and claims that arise in the regular course ofbusiness. These matters typically involve claims by guests, team members and others regarding issues such asfood borne illness, food safety, premises liability, compliance with wage and hour requirements, work-relatedinjuries, discrimination, harassment, disability and other operational issues common to the foodservice industry,as well as contract disputes and intellectual property infringement matters. We could be adversely affected bynegative publicity and litigation costs resulting from these claims, regardless of their validity. Significant legalfees and costs in complex class action litigation or an adverse judgment or settlement that is not insured or is inexcess of insurance coverage could have a material adverse effect on our financial position and results ofoperations.
We are dependent on information technology and any material failure in the operation or security of thattechnology or our ability to execute a comprehensive business continuity plan could impair our ability toefficiently operate our business.
We rely on information systems across our operations, including, for example, point-of-sale processing inour restaurants, management of our supply chain, collection of cash, payment of obligations and various otherprocesses and procedures. Our ability to efficiently manage our business depends significantly on the reliabilityand capacity of these systems. The failure of these systems to operate effectively, problems with maintenance,upgrading or transitioning to replacement systems, or a breach in security of these systems could cause delays incustomer service and reduce efficiency in our operations. A security breach or cyber attack could include theft ofcredit card data or other personal information as well as our intellectual property. Significant capital investmentsmight be required to remediate any problems.
Additionally, our corporate systems and processes and corporate support for our restaurant operations arehandled primarily at our restaurant support center. We have disaster recovery procedures and business continuityplans in place to address most events of a crisis nature, including tornadoes and other natural disasters, and backup and off-site locations for recovery of electronic and other forms of data and information. However, if we areunable to fully implement our disaster recovery plans, we may experience delays in recovery of data, inability toperform vital corporate functions, tardiness in required reporting and compliance, failures to adequately support
14

field operations and other breakdowns in normal communication and operating procedures that could have amaterial adverse effect on our financial condition, results of operation and exposure to administrative and otherlegal claims.
Failure to protect the integrity and security of individually identifiable data of our guests and teammatesand confidential and proprietary information of the company could damage our reputation and expose usto loss of revenues and litigation.
We receive and maintain certain personal information about our guests and team members in ourinformation technology systems, such as point-of-sale, web and mobile platforms, including our rewardsprogram. Additionally our systems contain proprietary and confidential information related to our business. Useof this information is regulated at the federal and state levels, as well as by certain third party contracts. If our orour business associates’ information systems are compromised as a result of a cyber attack or other external orinternal method, or we fail to comply with applicable laws and regulations, it could result in a violation of thelaws and regulations, and an adverse and material impact on our reputation, operations, results of operations andfinancial condition. Such security breaches could also result in litigation or governmental investigation against usor the imposition of penalties. These impacts could also occur if we are perceived either to have had an attack,failure or to have failed to properly respond to an incident. Like many other retail companies, we experiencefrequent attempts to compromise our systems but none have resulted in a material breach. As privacy andinformation security laws and regulations change or cyber risks evolve pertaining to data, we may incuradditional costs in technology, third party services and personnel to remain in compliance and maintain systemsdesigned to anticipate and prevent cyber attacks. Our security frameworks prevent breaches of our systems anddata loss, but these measures cannot provide assurance that we will be successful in preventing such breaches ordata loss.
Failure to protect our service marks or other intellectual property could harm our business.
We regard our Chili’s® and Maggiano’s® service marks, and other service marks and trademarks related toour restaurant businesses, as having significant value and being important to our marketing efforts. We rely on acombination of protections provided by contracts, copyrights, patents, trademarks, service marks and othercommon law rights, such as trade secret and unfair competition laws, to protect our restaurants and services frominfringement. We have registered certain trademarks and service marks in the United States and foreignjurisdictions. However, we are aware of names and marks identical or similar to our service marks being usedfrom time to time by other persons. Although our policy is to oppose any such infringement, further or unknownunauthorized uses or other misappropriation of our trademarks or service marks could diminish the value of ourbrands and adversely affect our business. In addition, effective intellectual property protection may not beavailable in every country in which we have or intend to open or franchise a restaurant. Although we believe wehave taken appropriate measures to protect our intellectual property, there can be no assurance that theseprotections will be adequate, and defending or enforcing our service marks and other intellectual property couldresult in the expenditure of significant resources.
We outsource certain business processes to third-party vendors that subject us to risks, includingdisruptions in business and increased costs.
Some business processes are currently outsourced to third parties. Such processes include certaininformation technology processes, gift card tracking and authorization, credit card authorization and processing,insurance claims processing, certain payroll processing, tax filings and other accounting processes. We alsocontinue to evaluate our other business processes to determine if additional outsourcing is a viable option toaccomplish our goals. We make a diligent effort to ensure that all providers of outsourced services are observingproper internal control practices, such as redundant processing facilities and adequate security frameworks toguard against breaches or data loss; however, there are no guarantees that failures will not occur. Failure of thirdparties to provide adequate services could have an adverse effect on our results of operations, financial conditionor ability to accomplish our financial and management reporting.
15

Disruptions in the global financial markets may adversely impact the availability and cost of credit andconsumer spending patterns.
Previous disruptions to the global financial markets and continuing slow economic recovery have adverselyimpacted the availability of credit already arranged and the availability and cost of credit in the future. Thedisruptions in the financial markets also had an adverse effect on the U.S. and world economy, which hasnegatively impacted consumer spending patterns. There can be no assurance that various U.S. and worldgovernment present and future responses to the previous disruptions in the financial markets will restoreconsumer confidence, stabilize the markets or increase liquidity or the availability of credit.
Declines in the market price of our common stock or changes in other circumstances that may indicate animpairment of goodwill could adversely affect our financial position and results of operations.
We perform our annual goodwill impairment test in the second quarter of each fiscal year. Interim goodwillimpairment tests are also required when events or circumstances change between annual tests that would morelikely than not reduce the fair value of our reporting units below their carrying value. It is possible that a changein circumstances such as the decline in the market price of our common stock or changes in consumer spendinglevels, or in the numerous variables associated with the judgments, assumptions and estimates made in assessingthe appropriate valuation of our goodwill, could negatively impact the valuation of our brands and create thepotential for a non-cash charge to recognize impairment losses on some or all of our goodwill. If we wererequired to write down a portion of our goodwill and record related non-cash impairment charges, our financialposition and results of operations would be adversely affected.
Changes to estimates related to our property and equipment, or operating results that are lower than ourcurrent estimates at certain restaurant locations, may cause us to incur impairment charges on certainlong-lived assets.
We make certain estimates and projections with regards to individual restaurant operations, as well as ouroverall performance in connection with our impairment analyses for long-lived assets. An impairment charge isrequired when the carrying value of the asset exceeds the estimated fair value. The projection of future cashflows used in this analysis requires the use of judgment and a number of estimates and projections of futureoperating results. If actual results differ from our estimates, additional charges for asset impairments may berequired in the future. If impairment charges are significant, our financial position and results of operations couldbe adversely affected.
Identification of material weakness in internal control over financial reporting may adversely affect ourfinancial results.
We are subject to the ongoing internal control provisions of Section 404 of the Sarbanes-Oxley Act of 2002.Those provisions provide for the identification of material weaknesses in internal control over financialreporting. If such a material weakness is identified, it could indicate a lack of adequate controls to generateaccurate financial statements. We routinely assess our internal control over financial reporting, but we cannotassure you that we will be able to timely remediate any material weaknesses that may be identified in futureperiods, or maintain all of the controls necessary for continued compliance. Likewise, we cannot assure you thatwe will be able to retain sufficient skilled finance and accounting team members, especially in light of theincreased demand for such individuals among publicly traded companies.
Other risk factors may adversely affect our financial performance.
Other risk factors that could cause our actual results to differ materially from those indicated in the forward-looking statements by affecting, among many things, pricing, consumer spending and consumer confidence,include, without limitation, changes in economic conditions and financial and credit markets (including rising
16

interest rates and costs for consumers and reduced disposable income); credit availability; increased costs of foodcommodities; increased fuel costs and availability for our team members, customers and suppliers; increasedhealth care costs; health epidemics or pandemics or the prospects of these events; consumer perceptions of foodsafety; changes in consumer tastes and behaviors; governmental monetary policies; changes in demographictrends; availability of employees; terrorist acts; energy shortages and rolling blackouts; and weather (including,major hurricanes and regional winter storms) and other acts of God.
Item 1B. UNRESOLVED STAFF COMMENTS.
None.
Item 2. PROPERTIES.
Restaurant Locations
At June 24, 2015, our system of company-owned and franchised restaurants included 1,629 restaurantslocated in 49 states and Washington, D.C. We also have restaurants in the U.S. territories of Guam and PuertoRico and the countries of Bahrain, Canada, Colombia, Costa Rica, Dominican Republic, Ecuador, Egypt, ElSalvador, Germany, Guatemala, Honduras, India, Indonesia, Japan, Jordan, Kuwait, Lebanon, Malaysia, Mexico,Oman, Peru, Philippines, Qatar, Saudi Arabia, Singapore, South Korea, Taiwan, United Arab Emirates andVenezuela. We have provided you a breakdown of our portfolio of restaurants in the two tables below:
Table 1: Company-owned vs. franchise (by brand) as of June 24, 2015:
Chili’sCompany-owned (domestic) . . . . . . . . . . . . . . . . . . . . . . . . . . . . . . . . . . . . . . . . . . 826Company-owned (international) . . . . . . . . . . . . . . . . . . . . . . . . . . . . . . . . . . . . . . . 13Franchise . . . . . . . . . . . . . . . . . . . . . . . . . . . . . . . . . . . . . . . . . . . . . . . . . . . . . . . . . 741
Maggiano’sCompany-owned . . . . . . . . . . . . . . . . . . . . . . . . . . . . . . . . . . . . . . . . . . . . . . . . . . . 49
Total . . . . . . . . . . . . . . . . . . . . . . . . . . . . . . . . . . . . . . . . . . . . . . . . . . . . . . . . . 1,629
Table 2: Domestic vs. foreign locations (by brand) as of June 24, 2015 (company-owned and franchised):
Domestic(No. of States)
Foreign(No. of countries
and U.S. territories)
Chili’s . . . . . . . . . . . . . . . . . . . . . . . . . . . . . . . . . . . . . . . . 1,259(49) 321(31)Maggiano’s . . . . . . . . . . . . . . . . . . . . . . . . . . . . . . . . . . . 49(21 & D.C.) —
Restaurant Property Information
The following table illustrates the approximate dining capacity for each current prototypical restaurant inour restaurant brands:
Chili’s Maggiano’s
Square Feet . . . . . . . . . . . . . . . . . . . . . . . . . . . . . . . . . . . . . . . . 3,930-6,000 7,700-24,000Dining Seats . . . . . . . . . . . . . . . . . . . . . . . . . . . . . . . . . . . . . . . . 150-252 200-700Dining Tables . . . . . . . . . . . . . . . . . . . . . . . . . . . . . . . . . . . . . . . 35-54 35-150
At June 24, 2015, we owned the land and building for 188 of our 888 company-owned restaurant locations(domestic and international). For these 188 restaurant locations, the net book value for the land was $142 million
17

and for the buildings was $113 million. For the remaining 700 restaurant locations leased by us, the net bookvalue of the buildings and leasehold improvements was $533 million. The 700 leased restaurant locations can becategorized as follows: 569 are ground leases (where we lease land only, but own the building) and 131 are retailleases (where we lease the land/retail space and building). We believe that our properties are suitable, adequate,well-maintained and sufficient for the operations contemplated. Some of our leased restaurants are leased for aninitial lease term of five to 30 years, with renewal terms of one to 30 years. The leases typically provide for afixed rental plus percentage rentals based on sales volume.
Other Properties
We own an office building containing approximately 108,000 square feet which we use for part of ourcorporate headquarters and menu development activities. We lease an additional office complex containingapproximately 198,000 square feet for the remainder of our corporate headquarters which is currently utilized byus, reserved for future expansion of our headquarters, or sublet to third parties. We also lease office space inFlorida for use as a regional operations office. The size of this office space is approximately 4,000 square feet.Effective as of Fiscal 2016, and in connection with the purchase of Pepper Dining Holding Corp., there are twoshort-term regional office leases. One is located in Charlotte, North Carolina, and the other is in Providence,Rhode Island. These offices are approximately 1,600 square feet and approximately 1,955 square feet,respectively.
Item 3. LEGAL PROCEEDINGS.
Evaluating contingencies related to litigation is a complex process involving subjective judgment on thepotential outcome of future events and the ultimate resolution of litigated claims may differ from our currentanalysis. Accordingly, we review the adequacy of accruals and disclosures pertaining to litigated matters eachquarter in consultation with legal counsel and we assess the probability and range of possible losses associatedwith contingencies for potential accrual in the consolidated financial statements.
In August 2004, certain current and former hourly restaurant team members filed a putative class actionlawsuit against us in California Superior Court alleging violations of California labor laws with respect to mealperiods and rest breaks, styled as Hohnbaum, et al. v. Brinker Restaurant Corporation, et al.
On August 6, 2014, the parties reached a preliminary settlement agreement, which remained subject to courtapproval, to resolve all claims in exchange for a settlement payment not to exceed $56.5 million. OnDecember 12, 2014, the court granted final approval of the settlement agreement. In February 2015, we fundedthe settlement in the amount of $44.0 million against our previously established reserve. We do not expect anyfurther payments related to this matter.
We are engaged in various other legal proceedings and have certain unresolved claims pending. Reserveshave been established based on our best estimates of our potential liability in certain of these matters. We are ofthe opinion that, apart from the discussion above, there are no matters pending or threatened which are likely tohave a material adverse effect, individually or in the aggregate, on our consolidated financial condition or resultsof operations.
Item 4. MINE SAFETY DISCLOSURES.
Not applicable.
18

PART II
Item 5. MARKET FOR REGISTRANT’S COMMON EQUITY, RELATED STOCKHOLDERMATTERS AND ISSUER PURCHASES OF EQUITY SECURITIES.
Our common stock is traded on the New York Stock Exchange (“NYSE”) under the symbol “EAT”. Bidprices quoted represent inter-dealer prices without adjustment for retail markup, markdown and/or commissions,and may not necessarily represent actual transactions. The following table sets forth the quarterly high and lowclosing sales prices of the common stock, as reported by the NYSE.
Fiscal year ended June 24, 2015:
High Low
First Quarter . . . . . . . . . . . . . . . . . . . . . . . . . . . . . . . . . . . . . . . . . . . . . . . . . . . $51.77 $44.16Second Quarter . . . . . . . . . . . . . . . . . . . . . . . . . . . . . . . . . . . . . . . . . . . . . . . . . $58.93 $49.55Third Quarter . . . . . . . . . . . . . . . . . . . . . . . . . . . . . . . . . . . . . . . . . . . . . . . . . . $63.12 $57.43Fourth Quarter . . . . . . . . . . . . . . . . . . . . . . . . . . . . . . . . . . . . . . . . . . . . . . . . . $61.82 $54.04
Fiscal year ended June 25, 2014:
High Low
First Quarter . . . . . . . . . . . . . . . . . . . . . . . . . . . . . . . . . . . . . . . . . . . . . . . . . . . $43.74 $38.19Second Quarter . . . . . . . . . . . . . . . . . . . . . . . . . . . . . . . . . . . . . . . . . . . . . . . . . $47.37 $38.87Third Quarter . . . . . . . . . . . . . . . . . . . . . . . . . . . . . . . . . . . . . . . . . . . . . . . . . . $55.00 $44.77Fourth Quarter . . . . . . . . . . . . . . . . . . . . . . . . . . . . . . . . . . . . . . . . . . . . . . . . . $53.55 $48.04
As of August 10, 2015, there were 524 holders of record of our common stock.
During the fiscal year ended June 24, 2015, we continued to declare quarterly cash dividends for ourshareholders. We have set forth the dividends declared for the fiscal year in the following table on the specifieddates:
Dividend Per Shareof Common Stock Declaration Date Record Date Payment Date
$0.28 August 21, 2014 September 5, 2014 September 25, 2014$0.28 October 30, 2014 December 5, 2014 December 26, 2014$0.28 February 5, 2015 March 6, 2015 March 26, 2015$0.28 May 21, 2015 June 12, 2015 June 25, 2015
19

The graph below matches Brinker International, Inc.’s cumulative 5-Year total shareholder return oncommon stock with the cumulative total returns of the S&P 500 index and the S&P Restaurants index.
COMPARISON OF 5 YEAR CUMULATIVE TOTAL RETURN*Among Brinker International, Inc., the S&P 500 Index
and the S&P Restaurants Index
$500
$450
$400
$350
$300
$250
$200
$150
$100
$50
$06/30/10 6/24/156/29/11 6/27/12 6/25/146/26/13
S&P RestaurantsS&P 500Brinker International, Inc.
*$100 invested on 6/30/10 in stock or index, including reinvestment of dividends.Indexes calculated on month-end basis.
Copyright© 2015 S&P, a division of McGraw Hill Financial. All rights reserved.
The graph assumes a $100 initial investment and the reinvestment of dividends in our stock and each of theindexes on June 30, 2010 and its relative performance is tracked through June 24, 2015. The values shown areneither indicative nor determinative of future performance.
2010 2011 2012 2013 2014 2015
Brinker International . . . . . . . . . . . . . . . . . . . . . . . $100.00 $174.00 $221.76 $287.55 $386.66 $446.25S&P 500 . . . . . . . . . . . . . . . . . . . . . . . . . . . . . . . . $100.00 $130.69 $137.81 $166.20 $207.10 $222.47S&P Restaurants(1) . . . . . . . . . . . . . . . . . . . . . . . . $100.00 $140.12 $162.68 $213.15 $213.15 $242.78
(1) The S&P Restaurants Index is comprised of Chipotle Mexican Grill, Inc., Darden Restaurants, Inc.,McDonald’s Corp., Starbucks Corporation and Yum! Brands, Inc.
In May 2013, the Company issued $250.0 million in the aggregate principal amount at maturity of 2.600%Notes due 2018 (the “2018 Notes”) and $300.0 million in the aggregate principal amount at maturity of 3.875%Notes due 2023 (the “2023 Notes”, and together with the 2018 Notes, the “Notes”). J.P. Morgan Securities LLCand Merrill Lynch, Pierce, Fenner & Smith Incorporated served as the joint book-running managers for theoffering. The Notes were issued in a public offering pursuant to a registration statement on Form S-3, FileNo. 333-188252, and are freely tradeable. The Notes are redeemable at the Company’s option at any time, inwhole or in part. The proceeds of the offering were used for general corporate purposes, including the redemptionof the 5.75% notes due June 2014, pay down of the revolver and the repurchase of the Company’s common stockpursuant to its share repurchase program.
20

During the three-year period ended on August 10, 2015, we issued no securities which were not registeredunder the Securities Act of 1933, as amended.
We continue to maintain our share repurchase program; on August 21, 2014, our Board of Directorsincreased our share repurchase authorization by $350 million, bringing the total authorization to $3,935 million.During the fourth quarter, we repurchased shares as follows (in thousands, except share and per share amounts):
TotalNumberof Shares
Purchased(a)
AveragePrice Paidper Share
Total Numberof Shares
Purchased asPart of Publicly
AnnouncedProgram
Approximate DollarValue that May Yet be
PurchasedUnder the Program(b)
March 26, 2015 through April 29, 2015 . . . . . . . . . 926,991 $60.62 926,000 $393,554April 30, 2015 through May 27, 2015 . . . . . . . . . . 148,170 $55.59 148,000 $385,324May 28, 2015 through June 24, 2015 . . . . . . . . . . . 440,878 $56.20 440,594 $360,554
Total . . . . . . . . . . . . . . . . . . . . . . . . . . . . . . . . 1,516,039 $58.84 1,514,594
(a) These amounts include shares purchased as part of our publicly announced programs and shares owned andtendered by team members to satisfy tax withholding obligations on the vesting of restricted share awards,which are not deducted from shares available to be purchased under publicly announced programs. Unlessotherwise indicated, shares owned and tendered by team members to satisfy tax withholding obligationswere purchased at the average of the high and low prices of the Company’s shares on the date of vesting.During the fourth quarter of fiscal 2015, 1,445 shares were tendered by team members at an average price of$59.90.
(b) The final amount shown is as of June 24, 2015.
Item 6. SELECTED FINANCIAL DATA.
The information set forth in that section entitled “Selected Financial Data” in our 2015 Annual Report toShareholders is presented on page F-1 of Exhibit 13 to this document. We incorporate that information in thisdocument by reference.
Item 7. MANAGEMENT’S DISCUSSION AND ANALYSIS OF FINANCIAL CONDITION ANDRESULTS OF OPERATIONS.
The information set forth in that section entitled “Management’s Discussion and Analysis of FinancialCondition and Results of Operations” in our 2015 Annual Report to Shareholders is presented on pages F-2through F-14 of Exhibit 13 to this document. We incorporate that information in this document by reference.
Item 7A. QUANTITATIVE AND QUALITATIVE DISCLOSURES ABOUT MARKET RISK.
The information set forth in that section entitled “Quantitative and Qualitative Disclosures About MarketRisk” contained within “Management’s Discussion and Analysis of Financial Condition and Results ofOperations” is in our 2015 Annual Report to Shareholders presented on page F-14 of Exhibit 13 to thisdocument. We incorporate that information in this document by reference.
Item 8. FINANCIAL STATEMENTS AND SUPPLEMENTARY DATA.
We refer you to the Index to Financial Statements attached hereto on page 27 for a listing of all financialstatements in our 2015 Annual Report to Shareholders. This report is attached as part of Exhibit 13 to thisdocument. We incorporate those financial statements in this document by reference.
21

Item 9. CHANGES IN AND DISAGREEMENTS WITH ACCOUNTANTS ON ACCOUNTING ANDFINANCIAL DISCLOSURE.
None.
Item 9A. CONTROLS AND PROCEDURES.
Disclosure Controls and Procedures
Based on their evaluation of our disclosure controls and procedures (as defined in Rules 13a-15 and 15d-15under the Securities Exchange Act of 1934 [the “Exchange Act”]), as of the end of the period covered by thisAnnual Report on Form 10-K, our principal executive officer and principal financial officer have concluded thatour disclosure controls and procedures were effective.
Management’s Report on Internal Control over Financial Reporting
“Management’s Report on Internal Control over Financial Reporting” and the attestation report of theindependent registered public accounting firm of KPMG LLP on internal control over financial reporting are inour 2015 Annual Report to Shareholders and are presented on pages F-37 through F-39 of Exhibit 13 to thisdocument. We incorporate our report in this document by reference.
Internal Control over Financial Reporting
There were no changes in our internal control over financial reporting during our fourth quarter endedJune 24, 2015, that have materially affected or are reasonably likely to materially affect, our internal control overfinancial reporting.
Item 9B. OTHER INFORMATION.
None.
22

PART III
Item 10. DIRECTORS, EXECUTIVE OFFICERS AND CORPORATE GOVERNANCE.
If you would like information about:
• our executive officers,
• our Board of Directors, including its committees, and
• our Section 16(a) reporting compliance,
you should read the sections entitled “Election of Directors—Information About Nominees”, “Committees of theBoard of Directors”, “Executive Officers”, and “Section 16(a) Beneficial Ownership Reporting Compliance” inour Proxy Statement to be dated on or about September 14, 2015, for the annual meeting of shareholders onOctober 29, 2015. We incorporate that information in this document by reference.
The Board of Directors has adopted a code of ethics that applies to all of the members of Board of Directorsand all of our team members, including, the principal executive officer, principal financial officer, principalaccounting officer or controller, or persons performing similar functions. A copy of the code is posted on ourinternet website at the internet address: http://www.brinker.com/corp_gov/ethical_business_ policy.asp. You mayobtain free of charge copies of the code from our website at the above internet address. Any amendment of, orwaiver from, our code of ethics will be posted on our website within four business days of such amendment orwaiver.
Item 11. EXECUTIVE COMPENSATION.
If you would like information about our executive compensation, you should read the section entitled“Executive Compensation—Compensation Discussion and Analysis” in our Proxy Statement to be dated on orabout September 14, 2015, for the annual meeting of shareholders on October 29, 2015. We incorporate thatinformation in this document by reference.
Item 12. SECURITY OWNERSHIP OF CERTAIN BENEFICIAL OWNERS AND MANAGEMENTAND RELATED STOCKHOLDER MATTERS.
If you would like information about our security ownership of certain beneficial owners and managementand related stockholder matters, you should read the sections entitled “Director Compensation for Fiscal 2015”,“Compensation Discussion and Analysis”, and “Stock Ownership of Certain Persons” in our Proxy Statement tobe dated on or about September 14, 2015, for the annual meeting of shareholders on October 29, 2015. Weincorporate that information in this document by reference.
Item 13. CERTAIN RELATIONSHIPS AND RELATED TRANSACTIONS, AND DIRECTORINDEPENDENCE.
If you would like information about certain relationships and related transactions, you should read thesection entitled “Compensation Committee Interlocks and Insider Participation” in our Proxy Statement to bedated on or about September 14, 2015, for the annual meeting of shareholders on October 29, 2015. Weincorporate that information in this document by reference.
If you would like information about the independence of our non-management directors and thecomposition of the Audit Committee, Compensation Committee and Governance and Nominating Committee,you should read the sections entitled “Director Independence” and “Committees of the Board of Directors” in ourProxy Statement to be dated on or about September 14, 2015, for the annual meeting of shareholders onOctober 29, 2015. We incorporate that information in this document by reference.
23

Item 14. PRINCIPAL ACCOUNTANT FEES AND SERVICES.
If you would like information about principal accountant fees and services, you should read the sectionentitled “Ratification of Independent Auditors” in our Proxy Statement to be dated on or about September 14,2015, for the annual meeting of shareholders on October 29, 2015. We incorporate that information in thisdocument by reference.
PART IV
Item 15. EXHIBITS AND FINANCIAL STATEMENT SCHEDULES.
(a)(1) Financial Statements.
We make reference to the Index to Financial Statements attached to this document on page 27 for a listingof all financial statements attached as Exhibit 13 to this document.
(a)(2) Financial Statement Schedules.
All schedules are omitted as the required information is inapplicable or the information is presented in thefinancial statements or related notes.
(a)(3) Exhibits.
We make reference to the Index to Exhibits preceding the exhibits attached hereto on pages E-1 for a list ofall exhibits filed as a part of this document.
24

SIGNATURES
Pursuant to the requirements of Section 13 or 15(d) of the Securities Exchange Act of 1934, the registranthas duly caused this report to be signed on its behalf by the undersigned, thereunto duly authorized.
BRINKER INTERNATIONAL, INC.,a Delaware corporation
By: /S/ THOMAS J. EDWARDS, JR.
Thomas J. Edwards, Jr.,Executive Vice President and Chief Financial Officer
Dated: August 24, 2015
Pursuant to the requirements of the Securities Exchange Act of 1934, we have signed in our indicatedcapacities on August 24, 2015.
Name Title
/s/ WYMAN T. ROBERTS
Wyman T. Roberts
President and Chief Executive Officer of BrinkerInternational, President of Chili’s Grill & Bar (PrincipalExecutive Officer) and Director
/s/ THOMAS J. EDWARDS, JR.
Thomas J. Edwards, Jr.
Executive Vice President and Chief Financial Officer(Principal Financial and Accounting Officer)
/s/ JOSEPH M. DEPINTO
Joseph M. DePinto
Chairman of the Board
/s/ ELAINE M. BOLTZ
Elaine M. Boltz
Director
/s/ HARRIET EDELMAN
Harriet Edelman
Director
/s/ MICHAEL A. GEORGE
Michael A. George
Director
/s/ WILLIAM T. GILES
William T. Giles
Director
/s/ GERARDO I. LOPEZ
Gerardo I. Lopez
Director
/s/ JON L. LUTHER
Jon L. Luther
Director
/s/ GEORGE R. MRKONIC
George R. Mrkonic
Director
25

Name Title
/s/ ROSENDO G. PARRA
Rosendo G. Parra
Director
/s/ JOSE LUIS PRADO
Jose Luis Prado
Director
26

INDEX TO FINANCIAL STATEMENTS
The following is a listing of the financial statements which are attached hereto as part of Exhibit 13.
Page
Selected Financial Data . . . . . . . . . . . . . . . . . . . . . . . . . . . . . . . . . . . . . . . . . . . . . . . . . . . . . . . . . . . . . . . . . . F-1
Management’s Discussion and Analysis of Financial Condition and Results of Operations . . . . . . . . . . . . . F-2
Consolidated Statements of Comprehensive Income—Fiscal Years Ended June 24, 2015, June 25,2014, and June 26, 2013 . . . . . . . . . . . . . . . . . . . . . . . . . . . . . . . . . . . . . . . . . . . . . . . . . . . . . . . . . . . . . . . F-15
Consolidated Balance Sheets—June 24, 2015 and June 25, 2014 . . . . . . . . . . . . . . . . . . . . . . . . . . . . . . . . . F-16
Consolidated Statements of Shareholders’ (Deficit) Equity—Fiscal Years Ended June 24, 2015, June 25,2014, and June 26, 2013 . . . . . . . . . . . . . . . . . . . . . . . . . . . . . . . . . . . . . . . . . . . . . . . . . . . . . . . . . . . . . . . F-17
Consolidated Statements of Cash Flows—Fiscal Years Ended June 24, 2015, June 25, 2014, and June 26,2013 . . . . . . . . . . . . . . . . . . . . . . . . . . . . . . . . . . . . . . . . . . . . . . . . . . . . . . . . . . . . . . . . . . . . . . . . . . . . . . . F-18
Notes to Consolidated Financial Statements . . . . . . . . . . . . . . . . . . . . . . . . . . . . . . . . . . . . . . . . . . . . . . . . . . F-19
Reports of Independent Registered Public Accounting Firm . . . . . . . . . . . . . . . . . . . . . . . . . . . . . . . . . . . . . F-37
Management’s Responsibility for Consolidated Financial Statements . . . . . . . . . . . . . . . . . . . . . . . . . . . . . . F-39
Management’s Report on Internal Control over Financial Reporting . . . . . . . . . . . . . . . . . . . . . . . . . . . . . . . F-39
27

INDEX TO EXHIBITS
Exhibit
3(a) Certificate of Incorporation of the Registrant, as amended.(1)
3(b) Bylaws of the Registrant.(2)
4(a) Form of 2.600% Note due 2018.(3)
4(b) Form of 3.875% Note due 2023.(3)
4(c) Indenture between the Registrant and Wilmington Trust, National Association, as Trustee.(4)
4(d) First Supplemental Indenture between Registrant and Wilmington Trust, National Association.(3)
4(e) Second Supplemental Indenture between Registrant and Wilmington Trust, National Association.(3)
10(a) Registrant’s Stock Option and Incentive Plan.(5)
10(b) Registrant’s 1999 Stock Option and Incentive Plan for Non-Employee Directors and Consultants.(6)
10(c) Registrant’s Performance Share Plan Description.(7)
10(d) Credit Agreement dated as of June 22, 2010, by and among Registrant, Brinker RestaurantCorporation, Bank of America, N.A., Merrill Lynch, Pierce, Fenner & Smith Incorporated, J.P.Morgan Securities, LLC, Regions Capital Markets, a Division of Regions Bank, J.P. Morgan ChaseBank, N.A., Regions Bank, Compass Bank, and Wells Fargo Bank, National Association, as amendedby Amendment No. 1, dated as of August 9, 2011.(8)
13 2015 Annual Report to Shareholders.(9)
21 Subsidiaries of the Registrant.(10)
23 Consent of Independent Registered Public Accounting Firm.(10)
31(a) Certification by Wyman T. Roberts, President, Chief Executive Officer and President of Chili’s Grill& Bar of the Registrant, pursuant to 17 CFR 240.13a-14(a) or 17 CFR 240.15d-14(a).(10)
31(b) Certification by Thomas J. Edwards,, Jr., Executive Vice President and Chief Financial Officer of theRegistrant, pursuant to 17 CFR 240.13a-14(a) or 17 CFR 240.15d-14(a).(10)
32(a) Certification by Wyman T. Roberts, President, Chief Executive Officer and President of Chili’s Grill& Bar of the Registrant, pursuant to 18 U.S.C. Section 1350, as adopted pursuant to Section 906 ofthe Sarbanes-Oxley Act of 2002.(10)
32(b) Certification by Thomas J. Edwards, Jr., Executive Vice President and Chief Financial Officer of theRegistrant, pursuant to 18 U.S.C. Section 1350, as adopted pursuant to Section 906 of the Sarbanes-Oxley Act of 2002.(10)
99(a) Proxy Statement of Registrant.(11)
101+ Interactive Data File
+ As provided in Rule 406T of Regulation S-T, this information is furnished and not filed for purposesof Sections 11 and 12 of the Securities Act of 1933 and Section 18 of the Securities Exchange Act of1934.
(1) Filed as an exhibit to annual report on Form 10-K for year ended June 28, 1995, and incorporated herein byreference.
(2) Filed as an exhibit to quarterly report on Form 10-Q for quarter ended December 25, 2013, and incorporatedherein by reference.
E-1

(3) Filed as an exhibit to current report on Form 8-K dated May 15, 2013, and incorporated herein by reference.(4) Filed as an exhibit to registration statement on Form S-3 filed April 30, 2013, SEC File No. 333-188252,
and incorporated herein by reference.(5) Filed as an Appendix A to Proxy Statement of Registrant filed on September 17, 2013, and incorporated
herein by reference.(6) Filed as an exhibit to quarterly report on Form 10-Q for the quarter ended December 28, 2005, and
incorporated herein by reference.(7) Filed as an exhibit to quarterly report on Form 10-Q for the quarter ended March 29, 2006, and incorporated
herein by reference.(8) Filed as an exhibit to current report on Form 8-K dated August 9, 2011, and incorporated herein by
reference.(9) Portions filed herewith, to the extent indicated herein.(10) Filed herewith.(11) To be filed on or about September 14, 2015.
E-2

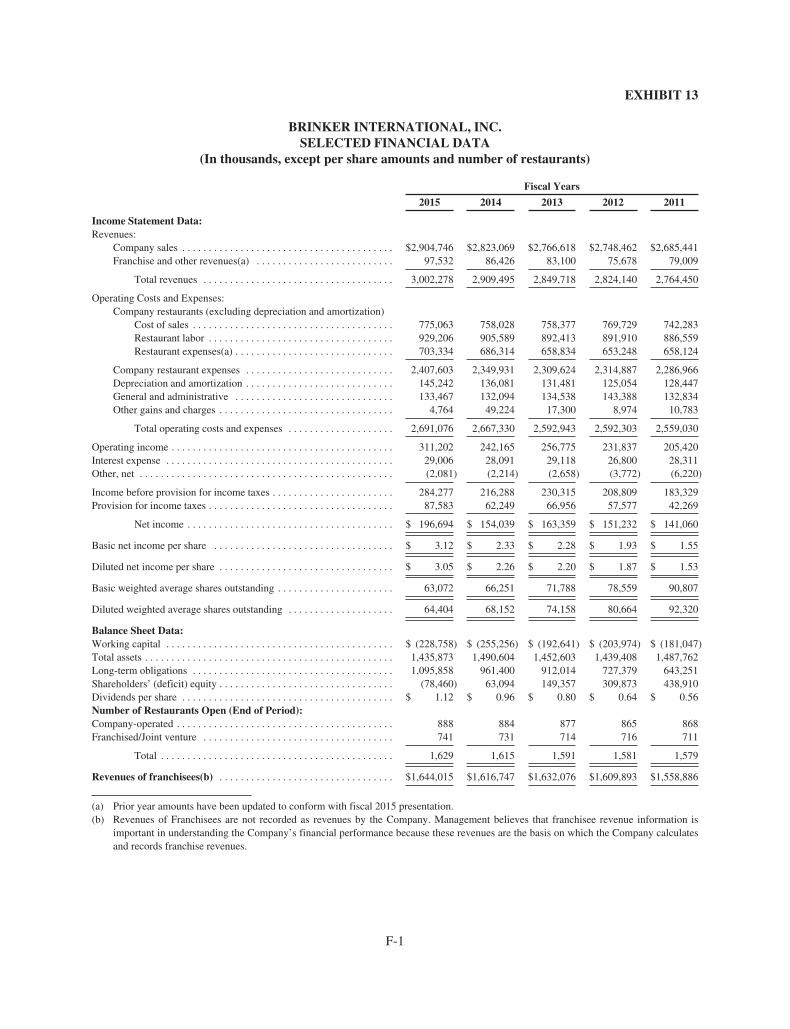
EXHIBIT 13
BRINKER INTERNATIONAL, INC.SELECTED FINANCIAL DATA
(In thousands, except per share amounts and number of restaurants)
Fiscal Years
2015 2014 2013 2012 2011
Income Statement Data:Revenues:
Company sales . . . . . . . . . . . . . . . . . . . . . . . . . . . . . . . . . . . . . . . . $2,904,746 $2,823,069 $2,766,618 $2,748,462 $2,685,441Franchise and other revenues(a) . . . . . . . . . . . . . . . . . . . . . . . . . . 97,532 86,426 83,100 75,678 79,009
Total revenues . . . . . . . . . . . . . . . . . . . . . . . . . . . . . . . . . . . . 3,002,278 2,909,495 2,849,718 2,824,140 2,764,450
Operating Costs and Expenses:Company restaurants (excluding depreciation and amortization)
Cost of sales . . . . . . . . . . . . . . . . . . . . . . . . . . . . . . . . . . . . . . 775,063 758,028 758,377 769,729 742,283Restaurant labor . . . . . . . . . . . . . . . . . . . . . . . . . . . . . . . . . . . 929,206 905,589 892,413 891,910 886,559Restaurant expenses(a) . . . . . . . . . . . . . . . . . . . . . . . . . . . . . . 703,334 686,314 658,834 653,248 658,124
Company restaurant expenses . . . . . . . . . . . . . . . . . . . . . . . . . . . . 2,407,603 2,349,931 2,309,624 2,314,887 2,286,966Depreciation and amortization . . . . . . . . . . . . . . . . . . . . . . . . . . . . 145,242 136,081 131,481 125,054 128,447General and administrative . . . . . . . . . . . . . . . . . . . . . . . . . . . . . . 133,467 132,094 134,538 143,388 132,834Other gains and charges . . . . . . . . . . . . . . . . . . . . . . . . . . . . . . . . . 4,764 49,224 17,300 8,974 10,783
Total operating costs and expenses . . . . . . . . . . . . . . . . . . . . 2,691,076 2,667,330 2,592,943 2,592,303 2,559,030
Operating income . . . . . . . . . . . . . . . . . . . . . . . . . . . . . . . . . . . . . . . . . . 311,202 242,165 256,775 231,837 205,420Interest expense . . . . . . . . . . . . . . . . . . . . . . . . . . . . . . . . . . . . . . . . . . . 29,006 28,091 29,118 26,800 28,311Other, net . . . . . . . . . . . . . . . . . . . . . . . . . . . . . . . . . . . . . . . . . . . . . . . . (2,081) (2,214) (2,658) (3,772) (6,220)
Income before provision for income taxes . . . . . . . . . . . . . . . . . . . . . . . 284,277 216,288 230,315 208,809 183,329Provision for income taxes . . . . . . . . . . . . . . . . . . . . . . . . . . . . . . . . . . . 87,583 62,249 66,956 57,577 42,269
Net income . . . . . . . . . . . . . . . . . . . . . . . . . . . . . . . . . . . . . . . $ 196,694 $ 154,039 $ 163,359 $ 151,232 $ 141,060
Basic net income per share . . . . . . . . . . . . . . . . . . . . . . . . . . . . . . . . . . $ 3.12 $ 2.33 $ 2.28 $ 1.93 $ 1.55
Diluted net income per share . . . . . . . . . . . . . . . . . . . . . . . . . . . . . . . . . $ 3.05 $ 2.26 $ 2.20 $ 1.87 $ 1.53
Basic weighted average shares outstanding . . . . . . . . . . . . . . . . . . . . . . 63,072 66,251 71,788 78,559 90,807
Diluted weighted average shares outstanding . . . . . . . . . . . . . . . . . . . . 64,404 68,152 74,158 80,664 92,320
Balance Sheet Data:Working capital . . . . . . . . . . . . . . . . . . . . . . . . . . . . . . . . . . . . . . . . . . . $ (228,758) $ (255,256) $ (192,641) $ (203,974) $ (181,047)Total assets . . . . . . . . . . . . . . . . . . . . . . . . . . . . . . . . . . . . . . . . . . . . . . . 1,435,873 1,490,604 1,452,603 1,439,408 1,487,762Long-term obligations . . . . . . . . . . . . . . . . . . . . . . . . . . . . . . . . . . . . . . 1,095,858 961,400 912,014 727,379 643,251Shareholders’ (deficit) equity . . . . . . . . . . . . . . . . . . . . . . . . . . . . . . . . . (78,460) 63,094 149,357 309,873 438,910Dividends per share . . . . . . . . . . . . . . . . . . . . . . . . . . . . . . . . . . . . . . . . $ 1.12 $ 0.96 $ 0.80 $ 0.64 $ 0.56Number of Restaurants Open (End of Period):Company-operated . . . . . . . . . . . . . . . . . . . . . . . . . . . . . . . . . . . . . . . . . 888 884 877 865 868Franchised/Joint venture . . . . . . . . . . . . . . . . . . . . . . . . . . . . . . . . . . . . 741 731 714 716 711
Total . . . . . . . . . . . . . . . . . . . . . . . . . . . . . . . . . . . . . . . . . . . . 1,629 1,615 1,591 1,581 1,579
Revenues of franchisees(b) . . . . . . . . . . . . . . . . . . . . . . . . . . . . . . . . . $1,644,015 $1,616,747 $1,632,076 $1,609,893 $1,558,886
(a) Prior year amounts have been updated to conform with fiscal 2015 presentation.(b) Revenues of Franchisees are not recorded as revenues by the Company. Management believes that franchisee revenue information is
important in understanding the Company’s financial performance because these revenues are the basis on which the Company calculatesand records franchise revenues.
F-1

MANAGEMENT’S DISCUSSION AND ANALYSIS OFFINANCIAL CONDITION AND RESULTS OF OPERATIONS
GENERAL
The following Management’s Discussion and Analysis of Financial Condition and Results of Operations(“MD&A”) is intended to help you understand our company, our operations, and our current operatingenvironment. For an understanding of the significant factors that influenced our performance during the pastthree fiscal years, the MD&A should be read in conjunction with the consolidated financial statements andrelated notes included in this annual report. Our MD&A consists of the following sections:
• Overview—a general description of our business and the casual dining segment of the restaurantindustry
• Results of Operations—an analysis of our consolidated statements of comprehensive income for thethree years presented in our consolidated financial statements
• Liquidity and Capital Resources—an analysis of cash flows, including capital expenditures,aggregate contractual obligations, share repurchase activity, known trends that may impact liquidity,and the impact of inflation
• Critical Accounting Estimates—a discussion of accounting policies that require critical judgmentsand estimates
OVERVIEW
We are principally engaged in the ownership, operation, development, and franchising of the Chili’s Grill &Bar (“Chili’s”) and Maggiano’s Little Italy (“Maggiano’s”) restaurant brands. At June 24, 2015, we owned,operated, or franchised 1,629 restaurants.
We are committed to strategies and initiatives that are centered on long-term sales and profit growth,enhancing the guest experience and team member engagement. These strategies are intended to differentiate ourbrands from the competition, reduce the costs associated with managing our restaurants and establish a strongpresence for our brands in key markets around the world.
Key economic indicators such as total employment and consumer confidence continued to improve steadilythis year and have driven slight improvements in the casual dining industry; however, growing sales and traffichas been a challenge over the last five years with steadily increasing competition. U.S. economic growth hasbeen steady but wage growth has been slow and this wage pressure has challenged both restaurant operators andconsumers as discretionary income available for restaurant visits has been limited. In response to these economicfactors, we have developed strategies that we believe are appropriate for all operating conditions and will providea solid foundation for earnings growth going forward.
We have completed a number of significant initiatives in recent years that have helped us drive profitablesales and traffic growth and to improve the guest experience in our restaurants. Investments in restaurantreimages, new kitchen equipment and operations software have improved the relevance of the Chili’s brand andthe efficiency of our restaurants. Our new kitchen equipment enables us to provide a higher quality product at afaster pace, enhancing both profitability and guest satisfaction. Our Chili’s reimage program is complete and thedesign is intended to revitalize Chili’s in a way which enhances the relevance of the brand while staying true toChili’s brand heritage. All company-owned Chili’s and Maggiano’s restaurants are now operating with anintegrated point of sale and back office software system that was designed to improve the efficiency of ourrestaurant operations and reporting capabilities. We believe that these initiatives will positively impact thecustomer perception of our restaurants in both the dining room and bar areas and provide us with a greatfoundation for continued success.
F-2

We have also differentiated the Chili’s brand by leveraging technology initiatives to engage our guests anddrive traffic. All domestic Chili’s restaurants with the exception of airport and college locations are now outfittedwith tabletop devices which gives us the largest network of tabletop devices in the country. Our Ziosk brandedtabletop device is a multi-functional device which provides entertainment, ordering, guest survey and pay-at-the-table capabilities. We built on this momentum by launching the Chili’s loyalty program called My Chili’sRewards in the fourth quarter of this fiscal year which utilizes our existing tabletop technology and provides usan opportunity to connect with our guests in a meaningful way to tailor their experience in our restaurants. Weare also investing in additional upgrades to our on-line ordering and mobile platforms. We have also launched NoWait, a new technology which allows our hosts to provide more accurate wait times when a guest arrives duringpeak shifts, and to send them a text when their table is ready. Guests can also add themselves to the wait list viathe Chili’s mobile app which we believe will reduce the in-restaurant wait time and increase the efficiency of ourrestaurants by allowing us to turn tables more effectively.
We continually evaluate our menu at Chili’s to improve quality, freshness and value by introducing newitems and improving existing favorites. Our Fresh Mex platform introduced last year has been very successfuland includes Fresh Mex Bowls, Mix and Match Fajitas and Tableside Guacamole. We leveraged this success bylaunching our new Top-Shelf Taco category including Pork Carnitas, Ranchero Chicken and Prime Rib tacos inthe fourth quarter. We also introduced Fresh Tex, a new Texas themed platform featuring ribs, steaks and burgersthis year. Our traditional burger menu was also updated with a new line of Craft Burgers, featuring fresh potatobuns and house made garlic pickles. We continually seek opportunities to reinforce value and create interest forthe brand with new and varied offerings to further enhance sales and drive incremental traffic. We are committedto offering a compelling everyday menu that provides items our customers prefer at a solid value.
Improvements at Chili’s will have the most significant impact on the business; however, our results will alsobenefit through additional contributions from Maggiano’s and our global business. Maggiano’s continues todeliver sales growth and has opened three restaurants in fiscal 2015 based on the new prototype, which excludesbanquet space. This new prototype will allow the brand to enter new markets for which the existing model wasnot suited. Maggiano’s is committed to delivering high quality food and a dining experience in line with ourbrand heritage. We will continue to strengthen the brand’s business model with kitchen efficiency and inventorycontrols that we believe will continue to enhance profitability.
We capitalized on an opportunity to further expand our domestic business by acquiring a franchisee whichowns 103 Chili’s restaurants primarily located in the Northeast and Southeast United States subsequent to the endof the year. We believe this acquisition fits well within our capital allocation strategy and will enable us to growour sales and profits in fiscal 2016. We have begun implementing several initiatives designed to increase salesand margins including restaurant reimage, loyalty and other operational processes. Global expansion allowsfurther diversification which will enable us to build strength in a variety of markets and economic conditions.This expansion will come through franchise relationships, acquisitions, joint venture arrangements and equityinvestments. Our international franchisees opened 22 new international Chili’s restaurants in fiscal 2015 and planto open 25-30 in fiscal 2016. Growing our franchise operations enables us to improve revenues and operatingincome through increased royalties and franchise fees. We continue to work with our domestic franchisees toincrease the pace of reimages of their restaurants, and to leverage technology initiatives like My Chili’s Rewardsand No Wait in their restaurants.
The casual dining industry is a highly competitive business which is sensitive to changes in economic conditions,trends in lifestyles and fluctuating costs. Our priority remains increasing profitable growth over time in all operatingenvironments. We have designed both operational and financial strategies to achieve this goal and in our opinion,improve shareholder value. Success with our initiatives to improve sales trends and operational effectiveness willenhance the profitability of our restaurants and strengthen our competitive position. We believe the effective executionof our financial strategies, including repurchasing shares of our common stock, payment of quarterly dividends,disciplined use of capital and efficient management of operating expenses, will enhance shareholder value. We remainconfident in the financial health of our company, the long-term prospects of the industry, as well as our ability toperform effectively in a competitive marketplace and a variety of economic environments.
F-3

RESULTS OF OPERATIONS FOR FISCAL YEARS 2015, 2014, AND 2013
The following table sets forth selected operating data as a percentage of total revenues (unless otherwisenoted) for the periods indicated. All information is derived from the accompanying consolidated statements ofcomprehensive income:
Fiscal Years
2015 2014 2013
Revenues:Company sales . . . . . . . . . . . . . . . . . . . . . . . . . . . . . . . . . . . . . . 96.8% 97.0% 97.1%Franchise and other revenues . . . . . . . . . . . . . . . . . . . . . . . . . . 3.2% 3.0% 2.9%
Total revenues . . . . . . . . . . . . . . . . . . . . . . . . . . . . . . . . . . 100.0% 100.0% 100.0%
Operating Costs and Expenses:Company restaurants (excluding depreciation and
amortization)Cost of sales(1) . . . . . . . . . . . . . . . . . . . . . . . . . . . . . . . . . 26.7% 26.9% 27.4%Restaurant labor(1) . . . . . . . . . . . . . . . . . . . . . . . . . . . . . . 32.0% 32.1% 32.3%Restaurant expenses(1) . . . . . . . . . . . . . . . . . . . . . . . . . . . 24.2% 24.2% 23.8%
Company restaurant expenses(1) . . . . . . . . . . . . . . . . . . . . . . . . 82.9% 83.2% 83.5%Depreciation and amortization . . . . . . . . . . . . . . . . . . . . . . . . . 4.8% 4.7% 4.6%General and administrative . . . . . . . . . . . . . . . . . . . . . . . . . . . . 4.4% 4.5% 4.7%Other gains and charges . . . . . . . . . . . . . . . . . . . . . . . . . . . . . . . 0.2% 1.7% 0.6%
Total operating costs and expenses . . . . . . . . . . . . . . . . . . 89.6% 91.7% 91.0%
Operating income . . . . . . . . . . . . . . . . . . . . . . . . . . . . . . . . . . . . . . . 10.4% 8.3% 9.0%Interest expense . . . . . . . . . . . . . . . . . . . . . . . . . . . . . . . . . . . . . . . . . 1.0% 1.0% 1.0%Other, net . . . . . . . . . . . . . . . . . . . . . . . . . . . . . . . . . . . . . . . . . . . . . . (0.1)% (0.1)% (0.1)%
Income before provision for income taxes . . . . . . . . . . . . . . . . . . . . 9.5% 7.4% 8.1%Provision for income taxes . . . . . . . . . . . . . . . . . . . . . . . . . . . . . . . . 2.9% 2.1% 2.4%
Net income . . . . . . . . . . . . . . . . . . . . . . . . . . . . . . . . . . . . . 6.6% 5.3% 5.7%
(1) As a percentage of company sales.
REVENUES
Revenues are presented in two separate captions on the consolidated statements of comprehensive income toprovide more clarity around company-owned restaurant revenue and operating expense trends. Company salesincludes revenues generated by the operation of company-owned restaurants including gift card redemptions.Franchise and other revenues includes royalties, development fees, franchise fees, Maggiano’s banquet servicecharge income, certain gift card activity (breakage and discounts), tabletop gaming revenue, retail food royaltiesand delivery fee income.
F-4

Total revenues for fiscal 2015 increased to $3,002.3 million, a 3.2% increase from the $2,909.5 milliongenerated for fiscal 2014 driven by a 2.9% increase in company sales attributable to positive comparablerestaurant sales and higher capacity (see table below).
Fiscal Year Ended June 24, 2015
ComparableSales
PriceIncrease
MixShift Traffic Capacity
Brinker International . . . . . . . . . . . . . . . . 1.7% 1.6% 0.0% 0.1% 0.8%Chili’s Company-owned . . . . . . . . . 1.9% 1.4% 0.3% 0.2% 0.4%Maggiano’s . . . . . . . . . . . . . . . . . . . 0.8% 2.3% (1.4)% (0.1)% 8.2%
Chili’s Franchise(1) . . . . . . . . . . . . . . . . . 2.2%U.S. . . . . . . . . . . . . . . . . . . . . . . . . . 2.9%International . . . . . . . . . . . . . . . . . . . 0.4%
Chili’s Domestic(2) . . . . . . . . . . . . . . . . . 2.2%System-wide(3) . . . . . . . . . . . . . . . . . . . . 1.9%
(1) Revenues generated by franchisees are not included in revenues on the consolidatedstatements of comprehensive income; however, we generate royalty revenue andadvertising fees based on franchisee revenues, where applicable. We believe includingfranchisee comparable restaurants revenues provides investors information regardingbrand performance that is relevant to current operations and may impact future restaurantdevelopment.
(2) Chili’s Domestic comparable restaurant sales percentages are derived from salesgenerated by company-owned and franchise operated Chili’s restaurants in the UnitedStates.
(3) System-wide comparable restaurant sales are derived from sales generated by company-owned Chili’s and Maggiano’s restaurants in addition to the sales generated at franchiseoperated restaurants.
Chili’s company sales increased to $2,503.1 million in fiscal 2015, a 2.4% increase from $2,443.9 million infiscal 2014. The increase was primarily driven by increased comparable restaurant sales and restaurant capacity.Chili’s company-owned restaurant capacity increased 0.4% (as measured by sales weeks) compared to the prioryear due to three net restaurant openings during fiscal 2015.
Maggiano’s company sales increased to $401.6 million in fiscal 2015, a 5.9% increase from $379.1 millionin fiscal 2014 primarily driven by increases in restaurant capacity and comparable restaurant sales. Maggiano’srestaurant capacity increased 8.2% for fiscal 2015 (as measured by sales weeks) compared to the prior year dueto three restaurant openings during the fiscal year.
Franchise and other revenues increased to $97.5 million in fiscal 2015 compared to $86.4 million in fiscal2014 driven by the revenues associated with tabletop devices, royalty revenues related to Chili’s new retail foodproducts, and higher royalty income primarily driven by international franchise restaurant openings. Ourfranchisees generated approximately $1,644 million in sales in fiscal 2015.
F-5

Total revenues for fiscal 2014 increased to $2,909.5 million, a 2.1% increase from the $2,849.7 milliongenerated for fiscal 2013 driven by a 2.0% increase in company sales and a 4.0% increase in franchise and otherrevenues. The increase in company sales was primarily attributable to the acquisition of 11 restaurants in Canadaat the end of fiscal 2013, a 0.6% increase in comparable restaurant sales, as well as increases in capacity (seetable below).
Fiscal Year Ended June 25, 2014
ComparableSales
PriceIncrease
MixShift Traffic Capacity
Brinker International . . . . . . . . . . . . . . . . 0.6% 1.2% 1.0% (1.6)% 1.6%Chili’s Company-owned . . . . . . . . . 0.6% 1.2% 1.2% (1.8)% 1.6%Maggiano’s . . . . . . . . . . . . . . . . . . . 0.6% 1.5% (0.7)% (0.2)% 1.7%
Chili’s Franchise(1) . . . . . . . . . . . . . . . . . 0.2%U.S. . . . . . . . . . . . . . . . . . . . . . . . . . (0.3)%International . . . . . . . . . . . . . . . . . . . 1.6%
Chili’s Domestic(2) . . . . . . . . . . . . . . . . . 0.3%System-wide(3) . . . . . . . . . . . . . . . . . . . . 0.5%
(1) Revenues generated by franchisees are not included in revenues on the consolidatedstatements of comprehensive income; however, we generate royalty revenue andadvertising fees based on franchisee revenues, where applicable. We believe includingfranchisee comparable restaurant’s revenues provides investors information regardingbrand performance that is relevant to current operations and may impact future restaurantdevelopment.
(2) Chili’s Domestic comparable restaurant sales percentages are derived from salesgenerated by company-owned and franchise operated Chili’s restaurants in the UnitedStates.
(3) System-wide comparable restaurant sales are derived from sales generated by company-owned Chili’s and Maggiano’s restaurants in addition to the sales generated at franchiseoperated restaurants.
Chili’s company sales increased to $2,443.9 million in fiscal 2014, a 2.1% increase from $2,392.9 million infiscal 2013. The increase was primarily driven by the acquisition of 11 restaurants in Canada at the end of fiscal2013, a 0.6% increase in comparable restaurant sales, as well as increases in domestic restaurant capacity. Chili’scompany-owned restaurant capacity increased 1.6% (as measured by sales weeks) compared to the prior year dueto the acquired Canada restaurants and five net restaurant openings during fiscal 2014.
Maggiano’s company sales increased to $379.1 million in fiscal 2014, a 1.4% increase from $373.7 millionin fiscal 2013 driven by an increase in restaurant capacity and menu pricing. Maggiano’s restaurant capacityincreased 1.7% for fiscal 2014 (as measured by sales weeks) compared to the prior year due to two restaurantopenings during the fiscal year.
Franchise and other revenues increased to $86.4 million in fiscal 2014 compared to $83.1 million in fiscal2013 driven primarily by revenues associated with tabletop devices, partially offset by lower royalty income.Royalty income decreased primarily due to the Canada acquisition in June 2013 as these restaurants werefranchised and five net domestic franchise restaurant closures during fiscal 2014, partially offset by an increasein international franchise royalty revenues due to 22 net restaurant openings in fiscal 2014. Our franchiseesgenerated approximately $1,617 million in sales in fiscal 2014.
COSTS AND EXPENSES
Cost of sales, as a percent of company sales, decreased 0.2% in fiscal 2015 due to favorable menu pricingand efficiency gains related to new fryer equipment, partially offset by unfavorable menu item mix andunfavorable commodity pricing primarily related to burger meat, which is market based, as well as unfavorable
F-6
pricing related to fajita beef and salmon. Cost of sales, as a percent of company sales, decreased 0.5% in fiscal2014 due to increased menu pricing, menu item changes, improved waste control, and efficiency gains in oilusage related to new fryer equipment. Commodity pricing was favorable primarily driven by other items andbread, partially offset by unfavorable pricing primarily related to cheese, seafood and pork.
Restaurant labor, as a percent of company sales, decreased 0.1% in fiscal 2015 primarily driven by leveragerelated to higher company sales coupled with lower health insurance expenses, partially offset by increased wagerates. Restaurant labor, as a percent of company sales, decreased 0.2% in fiscal 2014 primarily driven byleverage related to higher company sales, decreased employee health insurance expenses resulting from favorableclaims experience and decreased employee training costs, partially offset by increased manager salaries primarilydue to merit.
Restaurant expenses, as a percent of company sales, were flat in 2015 primarily driven by leverage related tohigher company sales and lower workers’ compensation insurance expenses, partially offset by equipmentcharges associated with tabletop devices and higher credit card fees. Restaurant expenses, as a percent ofcompany sales, increased 0.4% in fiscal 2014 primarily driven by higher advertising, workers’ compensationinsurance expenses, new restaurant development, utilities expense and tabletop equipment charges, partiallyoffset by sales leverage on fixed costs related to higher company sales, lower research and development, andhigher equity income.
Depreciation and amortization increased $9.2 million in fiscal 2015 primarily due to investments in theChili’s reimage program, new restaurant openings and new fryer equipment, partially offset by an increase infully depreciated assets. Depreciation and amortization increased $4.6 million in fiscal 2014 primarily due toinvestments in the Chili’s reimage program, fryers and kitchen equipment, new restaurant openings, as well asthe acquisition of 11 restaurants in Canada, partially offset by an increase in fully depreciated assets.
General and administrative expenses increased $1.4 million in fiscal 2015 due to higher performance-basedcompensation and technology and innovation expenditures made in support of sales driving initiatives, partiallyoffset by lower stock-based compensation and professional fees. General and administrative expenses decreased$2.4 million in fiscal 2014 primarily due to lower performance based compensation, a reduction in payrollprimarily due to lower headcount, as well as a reduction in other benefits, partially offset by higher legal fees.
Other gains and charges in fiscal 2015 were $4.8 million. We were a plaintiff in the antitrust litigationagainst Visa and MasterCard styled as Progressive Casualty Insurance Co., et al. v. Visa, Inc., et al. A settlementagreement was fully executed by all parties in January 2015 and we recognized a gain of approximately $8.6million. During the second quarter of fiscal 2015, the class action lawsuit styled as Hohnbaum, et al. v. BrinkerRestaurant Corp., et al. (“Hohnbaum case”) was finalized resulting in an additional charge of approximately $5.8million to adjust our previous estimate of the final settlement amount. In February 2015, we funded thesettlement in the amount of $44.0 million against our previously established reserve. Additionally, during fiscal2015 we recorded restaurant impairment charges of $2.3 million related to underperforming restaurants thateither continue to operate or are scheduled to close. We also recorded restaurant closure charges of $1.7 millionprimarily related to lease termination charges and a $1.1 million loss primarily related to the sale of two companyowned restaurants located in Mexico. We incurred $1.2 million in severance other benefits related toorganizational changes made during the fiscal year. The severance charges include expenses related to theaccelerated vesting of stock-based compensation awards. We incurred expenses of approximately $1.1 millionduring fiscal 2015 related to the acquisition of a franchisee which owns 103 Chili’s restaurants subsequent to theend of the year.
Other gains and charges in fiscal 2014 included charges of approximately $39.5 million related to variouslitigation matters including the Hohnbaum case. We also recorded restaurant impairment charges of $4.5 millionrelated to underperforming restaurants that either continue to operate or are scheduled to close. Additionally, werecorded $3.4 million of restaurant closure charges consisting primarily of lease termination charges and other
F-7

costs associated with closed restaurants. We also incurred $2.1 million in severance and other benefits related toorganizational changes made during the fiscal year. The severance charges include expenses related to theaccelerated vesting of stock-based compensation awards. Furthermore, a $0.6 million gain was recordedprimarily related to land sales.
Other gains and charges in fiscal 2013 primarily included a charge of $15.8 million representing theremaining interest payments and unamortized debt issuance costs and discount resulting from the redemption ofthe 5.75% notes. Additionally, other gains and charges included $5.3 million of charges related to the impairmentof the company-owned restaurant in Brazil and certain underperforming restaurants, $2.3 million of leasetermination charges related to previously closed restaurants, and $2.2 million in severance and other benefits.These charges were partially offset by net gains of $11.2 million on the sale of assets, including an $8.3 milliongain on the sale of our remaining 16.6% interest in Macaroni Grill and net gains of $2.9 million related to landsales.
Interest expense increased $0.9 million in fiscal 2015 resulting from higher borrowing balances, partiallyoffset by lower interest rates. Interest expense decreased $1.0 million in fiscal 2014 resulting from lower interestrates partially offset by higher borrowing balances.
Other, net in fiscal 2015, 2014, and 2013 includes $1.8 million, $1.9 million and $2.3 million, respectively,of sublease income primarily from franchisees as part of the respective sale agreements, as well as othersubtenants.
INCOME TAXES
The effective income tax rate for fiscal 2015 increased to 30.8% compared to 28.8% in the prior yearprimarily due to the impact of tax benefits related to litigation charges in the prior year.
The effective income tax rate for fiscal 2014 decreased to 28.8% compared to 29.1% in the prior yearprimarily due to the increased tax benefit resulting from litigation charges of $39.5 million in fiscal 2014 as wellas reserve adjustments related to resolved tax positions.
LIQUIDITY AND CAPITAL RESOURCES
Cash Flows
Cash Flow Provided By Operating Activities
During fiscal 2015, net cash flow provided by operating activities was $368.6 million compared to $359.8million in the prior year. The increase was driven by an increase in current year earnings, partially offset byunfavorable changes in working capital. Cash flow provided by operating activities was negatively impacted bythe payment of the Hohnbaum legal settlement net of taxes and the timing of operational payments.
During fiscal 2014, net cash flow provided by operating activities was $359.8 million compared to $290.7million in the prior year. The increase was driven by an increase in fiscal 2014 earnings excluding non-cashcharges primarily related to litigation reserves and favorable changes in working capital.
Cash Flow Used In Investing Activities
2015 2014 2013
Net cash used in investing activities (in thousands):Payments for property and equipment . . . . . . . . . $(140,262) $(161,066) $(131,531)Proceeds from sale of assets . . . . . . . . . . . . . . . . 1,950 888 17,157Payments for purchase of restaurants . . . . . . . . . 0 0 (24,622)Insurance recoveries . . . . . . . . . . . . . . . . . . . . . . 0 0 1,152
$(138,312) $(160,178) $(137,844)
F-8

Net cash used in investing activities for fiscal 2015 decreased to $138.3 million compared to $160.2 millionin the prior year. Capital expenditures decreased to $140.3 million for fiscal 2015 compared to $161.1 million forfiscal 2014 driven by the wind down and completion of the Chili’s reimage program and decreased spending onrestaurant equipment in fiscal 2015 compared to the prior year due to the purchase of new fryer equipment infiscal 2014. The decreases were partially offset by increased new restaurant construction for both Chili’s andMaggiano’s. We estimate that our capital expenditures during fiscal 2016 will be approximately $110 million to$120 million and will be funded entirely by cash from operations, excluding the impact of the acquisition of afranchisee which owns 103 Chili’s restaurants.
Net cash used in investing activities for fiscal 2014 increased to $160.2 million compared to $137.8 millionin the prior year. Capital expenditures increased to $161.1 million for fiscal 2014 compared to $131.5 million forfiscal 2013 driven by increased new restaurant construction, purchases for the ongoing Chili’s reimage programand fryer equipment. Capital expenditures in fiscal 2013 included purchases related to our kitchen retrofitinitiative, which was completed in the second quarter of fiscal 2013.
During fiscal 2013, we purchased 11 Chili’s restaurants located in Alberta, Canada from a franchisee for$24.6 million. Additionally, we received $17.2 million in proceeds from the sale of assets which primarilyconsisted of $8.4 million related to land sales and $8.3 million from the sale of our remaining interest inMacaroni Grill.
Cash Flow Used In Financing Activities
2015 2014 2013
Net cash used in financing activities (in thousands):Borrowings on revolving credit facility . . . . . . $ 480,750 $ 120,000 $ 110,000Purchases of treasury stock . . . . . . . . . . . . . . . (306,255) (239,597) (333,384)Payments on long-term debt . . . . . . . . . . . . . . . (189,177) (26,521) (316,380)Payments on revolving credit facility . . . . . . . (177,000) (40,000) (150,000)Payments of dividends . . . . . . . . . . . . . . . . . . . (70,832) (63,395) (56,343)Proceeds from issuances of treasury stock . . . . 16,259 29,295 41,190Excess tax benefits from stock-based
compensation . . . . . . . . . . . . . . . . . . . . . . . . 15,893 18,872 8,778Payments for deferred financing costs . . . . . . . (2,501) 0 (5,969)Proceeds from issuance of long-term debt . . . . 0 0 549,528
$(232,863) $(201,346) $(152,580)
Net cash used in financing activities for fiscal 2015 increased to $232.9 million compared to $201.3 millionin the prior year primarily due to increased payments on long-term debt, spending on share repurchases, adecrease in proceeds from issuances of treasury stock related to stock option exercises and an increase inpayments of dividends, partially offset by an increase in net borrowings on the revolving credit facility.
We repurchased approximately 5.4 million shares of our common stock for $306.3 million during fiscal2015 including shares purchased as part of our share repurchase program and to satisfy team member taxwithholding obligations on the vesting of restricted shares. Subsequent to the end of the fiscal year, werepurchased 766,000 shares for approximately $44.0 million as part of our share repurchase program. We alsorepurchased approximately 74,000 shares for $4.1 million to satisfy team member tax withholding obligations onthe vesting of primarily performance shares.
During the first nine months of fiscal 2015, $97 million was drawn from the $250 million revolving creditfacility primarily to fund share repurchases, and we paid the required quarterly term loan payments totaling $18.7million. In March 2015, we terminated the existing credit facility including both the $250 million revolver and
F-9

the term loan and entered into a new $750 million revolving credit facility. Approximately $345.8 million wasdrawn from the new revolver and the proceeds were used to pay off the outstanding balances of the term loan and$250 million revolver in the amount of $168.8 million and $177.0 million, respectively. During the fourth quarterof fiscal 2015, an additional $38.0 million was drawn from the new revolver primarily to fund share repurchases.Subsequent to the end of the fiscal year, an additional $135.5 million was borrowed from the $750 millionrevolving credit facility primarily to fund the acquisition of a franchisee which owns 103 Chili’s restaurants.
The maturity date of the $750 million revolving credit facility is March 12, 2020. The revolving creditfacility bears interest of LIBOR plus an applicable margin, which is a function of our credit rating and debt tocash flow ratio, but is subject to a maximum of LIBOR plus 2.00%. Based on our current credit rating, we arepaying interest at a rate of LIBOR plus 1.38%. One month LIBOR at June 24, 2015 was approximately 0.19%.As of June 24, 2015, $366.2 million of credit is available under the revolving credit facility. As of June 24, 2015,we were in compliance with all financial debt covenants.
As of June 24, 2015, our credit rating by both Standard and Poor’s (“S&P”) and Fitch Ratings (“Fitch”) wasBBB- (investment grade) with a stable outlook. Our corporate family rating by Moody’s was Ba1 (non-investment grade) and our senior unsecured rating was Ba2 (non-investment grade) with a stable outlook. Ourgoal is to retain our investment grade rating from S&P and Fitch and ultimately regain our investment graderating from Moody’s.
We paid dividends of $70.8 million to common stock shareholders in fiscal 2015 compared to $63.4 millionin dividends paid in fiscal 2014. Our Board of Directors approved a 17% increase in the quarterly dividend from$0.24 to $0.28 per share effective with the September 2014 dividend. Additionally, we declared a quarterlydividend late in fiscal 2015 which was paid early in fiscal 2016 on June 25, 2015. Subsequent to the end of thefiscal year, our Board of Directors approved a 14% increase in the quarterly dividend from $0.28 to $0.32 pershare effective with the September 2015 dividend which was declared in August 2015. We will continue to targeta 40 percent dividend payout ratio to provide additional return to shareholders.
In August 2014, our Board of Directors authorized a $350.0 million increase to our existing sharerepurchase program resulting in total authorizations of $3,935.0 million. As of June 24, 2015, approximately$361 million was available under our share repurchase authorizations. Subsequent to the end of the fiscal year,our Board of Directors authorized an additional $250 million in share repurchases, bringing the totalauthorization to $4,185.0 million. Our stock repurchase plan has been and will be used to return capital toshareholders and to minimize the dilutive impact of stock options and other share-based awards. Repurchasedcommon stock is reflected as a reduction of shareholders’ equity. During fiscal 2015, approximately 765,000stock options were exercised resulting in cash proceeds of $16.3 million.
Net cash used in financing activities for fiscal 2014 increased to $201.3 million compared to $152.6 millionin the prior year primarily due to the net cash inflow related to the debt offering in the prior year, partially offsetby decreased spend on share repurchases.
We repurchased approximately 5.1 million shares of our common stock for $239.6 million during fiscal2014 including shares purchased as part of our share repurchase program and to satisfy team member taxwithholding obligations on the vesting of restricted shares.
In May 2013, we issued $550.0 million of notes consisting of two tranches—$250.0 million of 2.60% notesdue in May 2018 and $300.0 million of 3.88% notes due in May 2023. We received proceeds totalingapproximately $549.5 million prior to debt issuance costs and utilized the proceeds to redeem the 5.75% notesdue in June 2014, pay down the revolver and fund share repurchases. The new notes required semi-annualinterest payments which began in the second quarter of fiscal 2014.
In fiscal 2014, our credit facility included a $250 million revolver and a $250 million term loan which werescheduled to mature in August 2016. During fiscal 2014, $120.0 million was drawn from the revolver to fund
F-10

share repurchases. We repaid $40.0 million of the outstanding balance leaving $170 million of credit availableunder the revolver as of June 25, 2014. During fiscal 2014, we paid our required term loan installments totaling$25.0 million bringing the outstanding balance to $187.5 million.
The term loan and revolving credit facility bore interest at LIBOR plus an applicable margin, a function ofour credit rating and debt to cash flow ratio, but subject to a maximum of LIBOR plus 2.50%. Based on ourcredit rating in fiscal 2014, we were paying interest at a rate of LIBOR plus 1.63%. One month LIBOR atJune 25, 2014 was approximately 0.15%. As of June 25, 2014, we were in compliance with all financial debtcovenants.
We paid dividends of $63.4 million to common stock shareholders in fiscal 2014 compared to $56.3 millionin dividends paid in fiscal 2013. Our Board of Directors approved a 20% increase in the quarterly dividend from$0.20 to $0.24 per share effective with the September 2013 dividend. Additionally, we declared a quarterlydividend late in fiscal 2014 which was paid early in fiscal 2015 on June 26, 2014.
In August 2013, our Board of Directors authorized a $200.0 million increase to our existing sharerepurchase program resulting in total authorizations of $3,585.0 million. As of June 25, 2014, approximately$307 million was available under our share repurchase authorizations. Our stock repurchase plan has been andwill be used to return capital to shareholders and to minimize the dilutive impact of stock options and othershare-based awards. Repurchased common stock is reflected as a reduction of shareholders’ equity. During fiscal2014, approximately 1.2 million stock options were exercised resulting in cash proceeds of $29.3 million.
We have evaluated ways to monetize the value of our owned real estate and determined that the alternativesconsidered are more costly than other financing options currently available due to a combination of the incometax impact and higher effective borrowing rates.
Cash Flow Outlook
We believe that our various sources of capital, including future cash flow from operating activities andavailability under our existing credit facility are adequate to finance operations as well as the repayment ofcurrent debt obligations. We are not aware of any other event or trend that would potentially affect our liquidity.In the event such a trend develops, we believe that there are sufficient funds available under our credit facilityand from our internal cash generating capabilities to adequately manage our ongoing business.
Payments due under our contractual obligations for outstanding indebtedness, purchase obligations asdefined by the Securities and Exchange Commission (“SEC”), and the expiration of the credit facility as ofJune 24, 2015 are as follows:
Payments Due by Period(in thousands)
TotalLess than
1 Year1-3
Years3-5
YearsMore than
5 Years
Long-term debt(a) . . . . . . . . . . . . . . . . . . . . . . . . . . . $1,045,915 $ 18,125 $286,149 $407,000 $334,641Capital leases . . . . . . . . . . . . . . . . . . . . . . . . . . . . . . . 59,936 6,050 11,717 10,055 32,114Operating leases . . . . . . . . . . . . . . . . . . . . . . . . . . . . 483,700 113,511 164,936 90,727 114,526Purchase obligations(b) . . . . . . . . . . . . . . . . . . . . . . . 103,011 20,879 33,871 22,611 25,650
Amount of Revolving Credit Facility Expiration by Period(in thousands)
TotalCommitment
Less than1 year
1-3Years
3-5Years
More than5 Years
Revolving credit facility . . . . . . . . . . . . . . . . . . . . . . $ 750,000 $ 0 $ 0 $750,000 $ 0
F-11

(a) Long-term debt consists of principal amounts owed on the five-year revolver, 2.60% notes and 3.88% notes,as well as remaining interest payments on the 2.60% and 3.88% notes totaling $112.5 million. Variable-rateinterest payments associated with the revolver are excluded.
(b) A “purchase obligation” is defined as an agreement to purchase goods or services that is enforceable andlegally binding on us and that specifies all significant terms, including: fixed or minimum quantities to bepurchased; fixed, minimum or variable price provisions; and the approximate timing of the transaction. Ourpurchase obligations primarily consist of long-term obligations for the purchase of fountain beverages andprofessional services contracts, and exclude agreements that are cancelable without significant penalty.
In addition to the amounts shown in the table above, $6.1 million of unrecognized tax benefits have beenrecorded as liabilities. The timing and amounts of future cash payments related to these liabilities are uncertain.
IMPACT OF INFLATION
We have experienced impact from inflation. Inflation has caused increased food, labor and benefits costsand has increased our operating expenses. To the extent permitted by competition, increased costs are recoveredthrough a combination of menu price increases and reviewing, then implementing, alternative products orprocesses, or by implementing other cost reduction procedures.
CRITICAL ACCOUNTING ESTIMATES
Our significant accounting policies are disclosed in Note 1 to our consolidated financial statements. Thefollowing discussion addresses our most critical accounting estimates, which are those that are most important tothe portrayal of our financial condition and results, and that require significant judgment.
Stock-Based Compensation
We measure and recognize compensation cost at fair value for all share-based payments. We determine thefair value of our performance shares using a Monte Carlo simulation model. The Monte Carlo method is astatistical modeling technique that requires highly judgmental assumptions regarding our future operatingperformance compared to our plan designated peer group in the future. The simulation is based on a probabilitymodel and market-based inputs that are used to predict future stock returns. We use the historical operatingperformance and correlation of stock performance to the S&P 500 composite index of us and our peer group asinputs to the simulation model. These historical returns could differ significantly in the future and as a result, thefair value assigned to the performance shares could vary significantly to the final payout. We believe the MonteCarlo simulation model provides the best evidence of fair value at the grant date and is an appropriate techniquefor valuing share-based awards. We determine the fair value of our stock option awards using the Black-Scholesoption valuation model. The Black-Scholes model requires judgmental assumptions including expected life andstock price volatility. We base our expected life assumptions on historical experience regarding option life. Stockprice volatility is calculated based on historical prices and the expected life of the options. We recognizecompensation expense for only the portion of share-based awards that are expected to vest. Therefore, we applyestimated forfeiture rates that are derived from our historical forfeitures of similar awards.
Income Taxes
We make certain estimates and judgments in the calculation of tax expense and the resulting tax liabilitiesand in the recoverability of deferred tax assets that arise from temporary differences between the tax andfinancial statement recognition of revenue and expense. When considered necessary, we record a valuationallowance to reduce deferred tax assets to a balance that is more likely than not to be recognized. We use anestimate of our annual effective tax rate at each interim period based on the facts and circumstances available atthat time while the actual effective tax rate is calculated at year-end.
F-12

We record a liability for unrecognized tax benefits resulting from tax positions taken, or expected to betaken, in an income tax return. We recognize any interest and penalties related to unrecognized tax benefits inincome tax expense. Significant judgment is required in assessing, among other things, the timing and amountsof deductible and taxable items. Tax reserves are evaluated and adjusted as appropriate, while taking into accountthe progress of audits of various taxing jurisdictions.
In addition to the risks related to the effective tax rate described above, the effective tax rate reflected inforward-looking statements is based on current tax law. Any significant changes in the tax laws could affect theseestimates.
Impairment of Long-Lived Assets
We review the carrying amount of property and equipment semi-annually or when events or circumstancesindicate that the carrying amount may not be recoverable. If the carrying amount is not recoverable, we record animpairment charge for the excess of the carrying amount over the fair value. We determine fair value based ondiscounted projected future operating cash flows of the restaurants over their remaining service life using a riskadjusted discount rate that is commensurate with the risk inherent in our current business model. This processrequires the use of estimates and assumptions, which are subject to a high degree of judgment.
Impairment of Goodwill
We assess the recoverability of goodwill related to our restaurant brands on an annual basis or more often ifcircumstances or events indicate impairment may exist. We consider our restaurants brands, Chili’s andMaggiano’s, to be both our operating segments and reporting units. The impairment test is a two-step process.Step one includes comparing the fair value of our reporting units to their carrying value. If the fair value of thereporting unit exceeds the carrying value, then the goodwill balance is not impaired and no further evaluation isrequired. If the carrying value of the reporting unit exceeds its fair value, impairment may exist and performingstep two is necessary to determine the impairment loss. The amount of impairment would be determined byperforming a hypothetical analysis resulting in an implied goodwill value by performing a fair value allocation asif the unit were being acquired in a business combination. This implied value would be compared to the carryingvalue to determine the amount of impairment loss, if any.
We determine fair value based on discounted projected future operating cash flows of the reporting unitsusing a risk adjusted discount rate that is commensurate with the risk inherent in our current business model. Wemake assumptions regarding future profits and cash flows, expected growth rates, terminal values and otherfactors which could significantly impact the fair value calculations. In the event that these assumptions change inthe future, we may be required to record impairment charges related to goodwill. The fair value of our reportingunits was substantially in excess of the carrying value as of our fiscal 2015 goodwill impairment test that wasperformed at the end of the second quarter. No indicators of impairment were identified from the date of ourimpairment test through the end of fiscal year 2015.
Self-Insurance
We are self-insured for certain losses related to health, general liability and workers’ compensation. Wemaintain stop loss coverage with third party insurers to limit our total exposure. The self-insurance liabilityrepresents an estimate of the ultimate cost of claims incurred and unpaid as of the balance sheet date. Theestimated liability is not discounted and is established based upon analysis of historical data and actuarialestimates, and is reviewed on a quarterly basis to ensure that the liability is appropriate. If actual trends,including the severity or frequency of claims, differ from our estimates, our financial results could be impacted.
F-13

Gift Card Revenue
Proceeds from the sale of gift cards are recorded as deferred revenue and recognized as revenue when thegift card is redeemed by the holder. Breakage income represents the value associated with the portion of giftcards sold that will most likely never be redeemed. Based on our historical gift card redemption patterns andconsidering our gift cards have no expiration dates or dormancy fees, we can reasonably estimate the amount ofgift card balances for which redemption is remote and record breakage income based on this estimate. Werecognize breakage income within the Franchise and other revenues caption in the consolidated statements ofcomprehensive income. We update our breakage rate estimate periodically and, if necessary, adjust the deferredrevenue balance accordingly. If actual redemption patterns vary from our estimate, actual gift card breakageincome may differ from the amounts recorded.
Recent Accounting Pronouncements
In April 2015, the Financial Accounting Standards Board (“FASB”) issued Accounting Standards Update(“ASU”) 2015-03, Simplifying the Presentation of Debt Issuance Costs. This update requires that debt issuancecosts be presented in the balance sheet as a direct deduction from the associated debt liability. This update iseffective for annual and interim periods beginning after December 15, 2015, which will require us to adopt thisguidance in the first quarter of fiscal 2017. Early adoption is permitted for financial statements that have not beenpreviously issued. The new guidance will be applied on a retrospective basis. We do not expect the updatedguidance to have a material impact on our financial statements.
In May 2014, the FASB issued ASU 2014-09, Revenue from Contracts with Customers (Topic 606). Thisupdate provides a comprehensive new revenue recognition model that requires a company to recognize revenueto depict the transfer of goods or services to a customer at an amount that reflects the consideration it expects toreceive in exchange for those goods or services. The guidance also requires additional disclosure about thenature, amount, timing and uncertainty of revenue and cash flows arising from customer contracts. In August2015, the FASB issued ASU 2015-14 delaying the effective date for adoption. This update is now effective forannual and interim periods beginning after December 15, 2017, which will require us to adopt these provisions inthe first quarter of fiscal 2019. Early application in fiscal 2018 is permitted. This update permits the use of eitherthe retrospective or cumulative effect transition method. We are evaluating the effect this guidance will have onour consolidated financial statements and related disclosures. We have not yet selected a transition method norhave we determined the effect of the standard on our ongoing financial reporting.
QUANTITATIVE AND QUALITATIVE DISCLOSURES ABOUT MARKET RISK
We are exposed to interest rate risk on short-term and long-term financial instruments carrying variableinterest rates. The variable rate financial instruments consist of the outstanding borrowings on our revolvingcredit facility. At June 24, 2015, $383.8 million was outstanding under the revolving credit facility. The impacton our annual results of operations of a one-point interest rate change on the outstanding balance of thesevariable rate financial instruments as of June 24, 2015 would be approximately $3.8 million.
We purchase certain commodities such as beef, pork, poultry, seafood, produce, dairy and natural gas. Thesecommodities are generally purchased based upon market prices established with vendors. These purchasearrangements may contain contractual features that fix the price paid for certain commodities. We do not usefinancial instruments to hedge commodity prices because these purchase arrangements help control the ultimatecost paid.
This market risk discussion contains forward-looking statements. Actual results may differ materially fromthis discussion based upon general market conditions and changes in domestic and global financial markets.
F-14

BRINKER INTERNATIONAL, INC.CONSOLIDATED STATEMENTS OF COMPREHENSIVE INCOME
(In thousands, except per share amounts)
Fiscal Years
2015 2014 2013
Revenues:Company sales . . . . . . . . . . . . . . . . . . . . . . . . . . . . . . . . . . . . . . . . . . $2,904,746 $2,823,069 $2,766,618Franchise and other revenues . . . . . . . . . . . . . . . . . . . . . . . . . . . . . . 97,532 86,426 83,100
Total revenues . . . . . . . . . . . . . . . . . . . . . . . . . . . . . . . . . . . . . . 3,002,278 2,909,495 2,849,718
Operating Costs and Expenses:Company restaurants (excluding depreciation and amortization)
Cost of sales . . . . . . . . . . . . . . . . . . . . . . . . . . . . . . . . . . . . . . . 775,063 758,028 758,377Restaurant labor . . . . . . . . . . . . . . . . . . . . . . . . . . . . . . . . . . . . . 929,206 905,589 892,413Restaurant expenses . . . . . . . . . . . . . . . . . . . . . . . . . . . . . . . . . 703,334 686,314 658,834
Company restaurant expenses . . . . . . . . . . . . . . . . . . . . . . . . . . . . . . 2,407,603 2,349,931 2,309,624Depreciation and amortization . . . . . . . . . . . . . . . . . . . . . . . . . . . . . 145,242 136,081 131,481General and administrative . . . . . . . . . . . . . . . . . . . . . . . . . . . . . . . . 133,467 132,094 134,538Other gains and charges . . . . . . . . . . . . . . . . . . . . . . . . . . . . . . . . . . 4,764 49,224 17,300
Total operating costs and expenses . . . . . . . . . . . . . . . . . . . . . . 2,691,076 2,667,330 2,592,943
Operating income . . . . . . . . . . . . . . . . . . . . . . . . . . . . . . . . . . . . . . . . . . . 311,202 242,165 256,775Interest expense . . . . . . . . . . . . . . . . . . . . . . . . . . . . . . . . . . . . . . . . . . . . . 29,006 28,091 29,118Other, net . . . . . . . . . . . . . . . . . . . . . . . . . . . . . . . . . . . . . . . . . . . . . . . . . . (2,081) (2,214) (2,658)
Income before provision for income taxes . . . . . . . . . . . . . . . . . . . . . . . . 284,277 216,288 230,315Provision for income taxes . . . . . . . . . . . . . . . . . . . . . . . . . . . . . . . . . . . . 87,583 62,249 66,956
Net income . . . . . . . . . . . . . . . . . . . . . . . . . . . . . . . . . . . . . . . . $ 196,694 $ 154,039 $ 163,359
Basic net income per share . . . . . . . . . . . . . . . . . . . . . . . . . . . . . . . . . . . . $ 3.12 $ 2.33 $ 2.28
Diluted net income per share . . . . . . . . . . . . . . . . . . . . . . . . . . . . . . . . . . . $ 3.05 $ 2.26 $ 2.20
Basic weighted average shares outstanding . . . . . . . . . . . . . . . . . . . . . . . 63,072 66,251 71,788
Diluted weighted average shares outstanding . . . . . . . . . . . . . . . . . . . . . . 64,404 68,152 74,158
Other comprehensive income (loss):Foreign currency translation adjustment . . . . . . . . . . . . . . . . . . . . . . $ (7,690) $ (940) $ 0
Other comprehensive loss . . . . . . . . . . . . . . . . . . . . . . . . . . . . . (7,690) (940) 0
Comprehensive income . . . . . . . . . . . . . . . . . . . . . . . . . . . . . . . . . . . $ 189,004 $ 153,099 $ 163,359
Dividends per share . . . . . . . . . . . . . . . . . . . . . . . . . . . . . . . . . . . . . . . . . . $ 1.12 $ 0.96 $ 0.80
See accompanying notes to consolidated financial statements.
F-15

BRINKER INTERNATIONAL, INC.CONSOLIDATED BALANCE SHEETS
(In thousands, except share and per share amounts)
2015 2014
ASSETSCurrent Assets:
Cash and cash equivalents . . . . . . . . . . . . . . . . . . . . . . . . . . . . . . . . . . . . . . . . . . . . . . . . . . . . $ 55,121 $ 57,685Accounts receivable, net . . . . . . . . . . . . . . . . . . . . . . . . . . . . . . . . . . . . . . . . . . . . . . . . . . . . . 46,588 47,850Inventories . . . . . . . . . . . . . . . . . . . . . . . . . . . . . . . . . . . . . . . . . . . . . . . . . . . . . . . . . . . . . . . . 23,035 23,643Prepaid expenses and other . . . . . . . . . . . . . . . . . . . . . . . . . . . . . . . . . . . . . . . . . . . . . . . . . . . 62,480 65,506Deferred income taxes . . . . . . . . . . . . . . . . . . . . . . . . . . . . . . . . . . . . . . . . . . . . . . . . . . . . . . . 2,493 16,170
Total current assets . . . . . . . . . . . . . . . . . . . . . . . . . . . . . . . . . . . . . . . . . . . . . . . . . . . . . . 189,717 210,854
Property and Equipment:Land . . . . . . . . . . . . . . . . . . . . . . . . . . . . . . . . . . . . . . . . . . . . . . . . . . . . . . . . . . . . . . . . . . . . . 147,763 149,184Buildings and leasehold improvements . . . . . . . . . . . . . . . . . . . . . . . . . . . . . . . . . . . . . . . . . . 1,546,957 1,483,894Furniture and equipment . . . . . . . . . . . . . . . . . . . . . . . . . . . . . . . . . . . . . . . . . . . . . . . . . . . . . 618,084 593,344Construction-in-progress . . . . . . . . . . . . . . . . . . . . . . . . . . . . . . . . . . . . . . . . . . . . . . . . . . . . . 15,001 32,844
2,327,805 2,259,266Less accumulated depreciation and amortization . . . . . . . . . . . . . . . . . . . . . . . . . . . . . . . . . . (1,295,761) (1,202,812)
Net property and equipment . . . . . . . . . . . . . . . . . . . . . . . . . . . . . . . . . . . . . . . . . . . . . . . 1,032,044 1,056,454
Other Assets:Goodwill . . . . . . . . . . . . . . . . . . . . . . . . . . . . . . . . . . . . . . . . . . . . . . . . . . . . . . . . . . . . . . . . . . 132,381 133,434Deferred income taxes . . . . . . . . . . . . . . . . . . . . . . . . . . . . . . . . . . . . . . . . . . . . . . . . . . . . . . . 30,644 30,090Intangibles, net . . . . . . . . . . . . . . . . . . . . . . . . . . . . . . . . . . . . . . . . . . . . . . . . . . . . . . . . . . . . . 16,642 18,841Other . . . . . . . . . . . . . . . . . . . . . . . . . . . . . . . . . . . . . . . . . . . . . . . . . . . . . . . . . . . . . . . . . . . . . 34,445 40,931
Total other assets . . . . . . . . . . . . . . . . . . . . . . . . . . . . . . . . . . . . . . . . . . . . . . . . . . . . . . . 214,112 223,296
Total assets . . . . . . . . . . . . . . . . . . . . . . . . . . . . . . . . . . . . . . . . . . . . . . . . . . . . . . . . . . . . $ 1,435,873 $ 1,490,604
LIABILITIES AND SHAREHOLDERS’ (DEFICIT) EQUITYCurrent Liabilities:
Current installments of long-term debt . . . . . . . . . . . . . . . . . . . . . . . . . . . . . . . . . . . . . . . . . . $ 3,439 $ 27,884Accounts payable . . . . . . . . . . . . . . . . . . . . . . . . . . . . . . . . . . . . . . . . . . . . . . . . . . . . . . . . . . . 92,947 102,931Gift card liability . . . . . . . . . . . . . . . . . . . . . . . . . . . . . . . . . . . . . . . . . . . . . . . . . . . . . . . . . . . 114,726 104,378Accrued payroll . . . . . . . . . . . . . . . . . . . . . . . . . . . . . . . . . . . . . . . . . . . . . . . . . . . . . . . . . . . . 82,915 77,585Other accrued liabilities . . . . . . . . . . . . . . . . . . . . . . . . . . . . . . . . . . . . . . . . . . . . . . . . . . . . . . 111,197 146,054Income taxes payable . . . . . . . . . . . . . . . . . . . . . . . . . . . . . . . . . . . . . . . . . . . . . . . . . . . . . . . . 13,251 7,278
Total current liabilities . . . . . . . . . . . . . . . . . . . . . . . . . . . . . . . . . . . . . . . . . . . . . . . . . . . 418,475 466,110Long-term debt, less current installments . . . . . . . . . . . . . . . . . . . . . . . . . . . . . . . . . . . . . . . . . . . . 970,825 832,302Other liabilities . . . . . . . . . . . . . . . . . . . . . . . . . . . . . . . . . . . . . . . . . . . . . . . . . . . . . . . . . . . . . . . . . 125,033 129,098Commitments and Contingencies (Notes 9 and 14)Shareholders’ (Deficit) Equity:
Common stock—250,000,000 authorized shares; $0.10 par value; 176,246,649 sharesissued and 60,585,608 shares outstanding at June 24, 2015 and 176,246,649 sharesissued and 64,558,909 shares outstanding at June 25, 2014 . . . . . . . . . . . . . . . . . . . . . . . . 17,625 17,625
Additional paid-in capital . . . . . . . . . . . . . . . . . . . . . . . . . . . . . . . . . . . . . . . . . . . . . . . . . . . . . 490,111 484,320Accumulated other comprehensive loss . . . . . . . . . . . . . . . . . . . . . . . . . . . . . . . . . . . . . . . . . . (8,630) (940)Retained earnings . . . . . . . . . . . . . . . . . . . . . . . . . . . . . . . . . . . . . . . . . . . . . . . . . . . . . . . . . . . 2,431,683 2,306,532
2,930,789 2,807,537Less treasury stock, at cost (115,661,041 shares at June 24, 2015 and 111,687,740 shares at
June 25, 2014) . . . . . . . . . . . . . . . . . . . . . . . . . . . . . . . . . . . . . . . . . . . . . . . . . . . . . . . . . . . (3,009,249) (2,744,443)
Total shareholders’ (deficit) equity . . . . . . . . . . . . . . . . . . . . . . . . . . . . . . . . . . . . . . . . . (78,460) 63,094
Total liabilities and shareholders’ (deficit) equity . . . . . . . . . . . . . . . . . . . . . . . . . . . . . . $ 1,435,873 $ 1,490,604
See accompanying notes to consolidated financial statements.
F-16

BRINKER INTERNATIONAL, INC.CONSOLIDATED STATEMENTS OF SHAREHOLDERS’ (DEFICIT) EQUITY
(In thousands)
Common Stock AdditionalPaid-InCapital
RetainedEarnings
TreasuryStock
AccumulatedOther
ComprehensiveLoss TotalShares Amount
Balances at June 27, 2012 . . . . . . 74,342 $17,625 $466,781 $2,112,858 $(2,287,391) $ 0 $ 309,873Net income and comprehensive
income . . . . . . . . . . . . . . . . . . . 0 0 0 163,359 0 0 163,359Dividends ($0.80 per share) . . . . 0 0 0 (58,594) 0 0 (58,594)Stock-based compensation . . . . . 0 0 16,610 0 0 0 16,610Purchases of treasury stock . . . . . (9,176) 0 (5,565) 0 (327,819) 0 (333,384)Issuances of common stock . . . . . 2,278 0 (10,709) 0 51,899 0 41,190Excess tax benefit from stock-
based compensation . . . . . . . . . 0 0 10,303 0 0 0 10,303
Balances at June 26, 2013 . . . . . . 67,444 17,625 477,420 2,217,623 (2,563,311) 0 149,357Net income . . . . . . . . . . . . . . . . . 0 0 0 154,039 0 0 154,039Other comprehensive loss . . . . . . 0 0 0 0 0 (940) (940)Dividends ($0.96 per share) . . . . 0 0 0 (65,130) 0 0 (65,130)Stock-based compensation . . . . . 0 0 16,888 0 0 0 16,888Purchases of treasury stock . . . . . (5,079) 0 (6,103) 0 (233,494) 0 (239,597)Issuances of common stock . . . . . 2,194 0 (23,067) 0 52,362 0 29,295Excess tax benefit from stock-
based compensation . . . . . . . . . 0 0 19,182 0 0 0 19,182
Balances at June 25, 2014 . . . . . . 64,559 17,625 484,320 2,306,532 (2,744,443) (940) 63,094Net income . . . . . . . . . . . . . . . . . 0 0 0 196,694 0 0 196,694Other comprehensive loss . . . . . . 0 0 0 0 0 (7,690) (7,690)Dividends ($1.12 per share) . . . . 0 0 0 (71,543) 0 0 (71,543)Stock-based compensation . . . . . 0 0 14,989 0 0 0 14,989Purchases of treasury stock . . . . . (5,445) 0 (4,804) 0 (301,451) 0 (306,255)Issuances of common stock . . . . . 1,472 0 (20,386) 0 36,645 0 16,259Excess tax benefit from stock-
based compensation . . . . . . . . . 0 0 15,992 0 0 0 15,992
Balances at June 24, 2015 . . . . . . 60,586 $17,625 $490,111 $2,431,683 $(3,009,249) $ (8,630) $ (78,460)
See accompanying notes to consolidated financial statements.
F-17

BRINKER INTERNATIONAL, INC.CONSOLIDATED STATEMENTS OF CASH FLOWS
(In thousands)
Fiscal Years
2015 2014 2013
Cash Flows from Operating Activities:Net income . . . . . . . . . . . . . . . . . . . . . . . . . . . . . . . . . . . . . . . . . . . . . . . . . . . $ 196,694 $ 154,039 $ 163,359Adjustments to reconcile net income to net cash provided by operating
activities:Depreciation and amortization . . . . . . . . . . . . . . . . . . . . . . . . . . . . . . . . 145,242 136,081 131,481Litigation reserves . . . . . . . . . . . . . . . . . . . . . . . . . . . . . . . . . . . . . . . . . 0 39,500 0Restructure charges and other impairments . . . . . . . . . . . . . . . . . . . . . . 5,636 8,533 11,425Deferred income taxes . . . . . . . . . . . . . . . . . . . . . . . . . . . . . . . . . . . . . . 13,140 (23,041) (4,793)Net loss (gain) on disposal of assets . . . . . . . . . . . . . . . . . . . . . . . . . . . 4,523 5,161 (6,905)Stock-based compensation . . . . . . . . . . . . . . . . . . . . . . . . . . . . . . . . . . . 14,802 16,074 15,909(Gain) loss on equity investments . . . . . . . . . . . . . . . . . . . . . . . . . . . . . (368) (328) 851Other . . . . . . . . . . . . . . . . . . . . . . . . . . . . . . . . . . . . . . . . . . . . . . . . . . . . 250 707 363Changes in assets and liabilities:
Accounts receivable . . . . . . . . . . . . . . . . . . . . . . . . . . . . . . . . . . . . 1,932 (5,372) 5,398Inventories . . . . . . . . . . . . . . . . . . . . . . . . . . . . . . . . . . . . . . . . . . . 475 912 908Prepaid expenses and other . . . . . . . . . . . . . . . . . . . . . . . . . . . . . . 4,368 1,827 82Intangibles and other assets . . . . . . . . . . . . . . . . . . . . . . . . . . . . . . (2,140) (3,397) (4,115)Current income taxes . . . . . . . . . . . . . . . . . . . . . . . . . . . . . . . . . . . 6,284 14,087 749Accounts payable . . . . . . . . . . . . . . . . . . . . . . . . . . . . . . . . . . . . . . 1,117 3,756 (9,339)Accrued liabilities . . . . . . . . . . . . . . . . . . . . . . . . . . . . . . . . . . . . . (22,595) 14,617 (9,381)Other liabilities . . . . . . . . . . . . . . . . . . . . . . . . . . . . . . . . . . . . . . . . (749) (3,314) (5,304)
Net cash provided by operating activities . . . . . . . . . . . . . . . . . . . 368,611 359,842 290,688
Cash Flows from Investing Activities:Payments for property and equipment . . . . . . . . . . . . . . . . . . . . . . . . . . . . . . (140,262) (161,066) (131,531)Proceeds from sale of assets . . . . . . . . . . . . . . . . . . . . . . . . . . . . . . . . . . . . . . 1,950 888 17,157Payments for purchase of restaurants . . . . . . . . . . . . . . . . . . . . . . . . . . . . . . . 0 0 (24,622)Insurance recoveries . . . . . . . . . . . . . . . . . . . . . . . . . . . . . . . . . . . . . . . . . . . . 0 0 1,152
Net cash used in investing activities . . . . . . . . . . . . . . . . . . . . . . . (138,312) (160,178) (137,844)
Cash Flows from Financing Activities:Borrowings on revolving credit facility . . . . . . . . . . . . . . . . . . . . . . . . . . . . . 480,750 120,000 110,000Purchases of treasury stock . . . . . . . . . . . . . . . . . . . . . . . . . . . . . . . . . . . . . . (306,255) (239,597) (333,384)Payments on long-term debt . . . . . . . . . . . . . . . . . . . . . . . . . . . . . . . . . . . . . . (189,177) (26,521) (316,380)Payments on revolving credit facility . . . . . . . . . . . . . . . . . . . . . . . . . . . . . . (177,000) (40,000) (150,000)Payments of dividends . . . . . . . . . . . . . . . . . . . . . . . . . . . . . . . . . . . . . . . . . . (70,832) (63,395) (56,343)Proceeds from issuances of treasury stock . . . . . . . . . . . . . . . . . . . . . . . . . . . 16,259 29,295 41,190Excess tax benefits from stock-based compensation . . . . . . . . . . . . . . . . . . . 15,893 18,872 8,778Payments for deferred financing costs . . . . . . . . . . . . . . . . . . . . . . . . . . . . . . (2,501) 0 (5,969)Proceeds from issuance of long-term debt . . . . . . . . . . . . . . . . . . . . . . . . . . . 0 0 549,528
Net cash used in financing activities . . . . . . . . . . . . . . . . . . . . . . . (232,863) (201,346) (152,580)
Net change in cash and cash equivalents . . . . . . . . . . . . . . . . . . . . . . . . . . . . (2,564) (1,682) 264Cash and cash equivalents at beginning of year . . . . . . . . . . . . . . . . . . . . . . . 57,685 59,367 59,103
Cash and cash equivalents at end of year . . . . . . . . . . . . . . . . . . . . . . . . . . . . $ 55,121 $ 57,685 $ 59,367
See accompanying notes to consolidated financial statements.
F-18

BRINKER INTERNATIONAL, INC.
NOTES TO CONSOLIDATED FINANCIAL STATEMENTS
1. NATURE OF OPERATIONS AND SUMMARY OF SIGNIFICANT ACCOUNTING POLICIES
(a) Nature of Operations
We are principally engaged in the ownership, operation, development, and franchising of the Chili’s Grill &Bar (“Chili’s”) and Maggiano’s Little Italy (“Maggiano’s”) restaurant brands. At June 24, 2015, we owned,operated, or franchised 1,629 restaurants in the United States and 29 countries and two territories outside of theUnited States.
(b) Basis of Presentation
Our consolidated financial statements include the accounts of Brinker International, Inc. and our wholly-owned subsidiaries. All intercompany accounts and transactions have been eliminated in consolidation.
We have a 52/53 week fiscal year ending on the last Wednesday in June. Fiscal years 2015, 2014, and 2013which ended on June 24, 2015, June 25, 2014, and June 27, 2013, respectively, each contained 52 weeks.
We discovered an immaterial error related to the classification of certain revenues and expenses in theconsolidated statements of comprehensive income in the previously issued financial statements for the yearended June 25, 2014 primarily related to Maggiano’s delivery services. The amounts had previously beenreported net instead of gross. The error did not impact net income as previously reported or any prior amountsreported on the consolidated balance sheets, statements of cash flows or statements of shareholders’ (deficit)equity. We corrected the error by adjusting the previously reported consolidated statements of comprehensiveincome for the fifty-two week periods ended June 25, 2014 and June 27, 2013, which resulted in a $4.0 million,and a $3.6 million increase in franchise and other revenues and restaurant expenses, respectively.
Revenues are presented in two separate captions on the consolidated statements of comprehensive income toprovide more clarity around company-owned restaurant revenue and operating expense trends. Company salesincludes revenues generated by the operation of company-owned restaurants including gift card redemptions.Franchise and other revenues includes royalties, development fees, franchise fees, Maggiano’s banquet servicecharge income, certain gift card activity (breakage and discounts), tabletop gaming revenue, retail food royaltiesand delivery fee income.
We report certain labor and related expenses in a separate caption on the consolidated statements ofcomprehensive income titled restaurant labor. Restaurant labor includes all compensation-related expenses,including benefits and incentive compensation, for restaurant team members at the general manager level andbelow. Labor-related expenses attributable to multi-restaurant (or above-restaurant) supervision is included inrestaurant expenses.
(c) Use of Estimates
The preparation of the consolidated financial statements in conformity with generally accepted accountingprinciples in the United States of America requires management to make estimates and assumptions that affectthe reported amounts of assets and liabilities and the disclosure of contingent assets and liabilities at the date ofthe consolidated financial statements and the reported amounts of revenues and costs and expenses during thereporting period. Actual results could differ from those estimates.
(d) Revenue Recognition
We record revenue from the sale of food, beverages and alcohol as products are sold. Initial fees receivedfrom a franchisee to establish a new franchise are recognized as income when we have performed our obligations
F-19

required to assist the franchisee in opening a new franchise restaurant, which is generally upon the opening ofsuch restaurant. Fees received for development arrangements are recognized as income upon payment of the fees.Continuing royalties, which are a percentage of net sales of franchised restaurants, are accrued as income whenearned.
Proceeds from the sale of gift cards are recorded as deferred revenue and recognized as revenue when thegift card is redeemed by the holder. Breakage income represents the value associated with the portion of giftcards sold that will most likely never be redeemed. Based on our historical gift card redemption patterns andconsidering our gift cards have no expiration dates or dormancy fees, we can reasonably estimate the amount ofgift card balances for which redemption is remote and record breakage income based on this estimate. Werecognize breakage income within franchise and other revenues in the consolidated statements of comprehensiveincome. We update our estimate of our breakage rate periodically and, if necessary, adjust the deferred revenuebalance accordingly.
(e) Fair Value Measurements
Fair value is defined as the price that we would receive to sell an asset or pay to transfer a liability in anorderly transaction between market participants on the measurement date. In determining fair value, theaccounting standards establish a three level hierarchy for inputs used in measuring fair value, as follows:
• Level 1—inputs are quoted prices in active markets for identical assets or liabilities.
• Level 2—inputs are observable for the asset or liability, either directly or indirectly, including quotedprices in active markets for similar assets or liabilities.
• Level 3—inputs are unobservable and reflect our own assumptions.
(f) Cash and Cash Equivalents
Our policy is to invest cash in excess of operating requirements in income-producing investments. Income-producing investments with original maturities of three months or less are reflected as cash equivalents.
(g) Accounts Receivable
Accounts receivable, net of the allowance for doubtful accounts, represents their estimated net realizablevalue. Provisions for doubtful accounts are recorded based on management’s judgment regarding our ability tocollect as well as the age of the receivables. Accounts receivable are written off when they are deemeduncollectible.
(h) Inventories
Inventories consist of food, beverages and supplies and are valued at the lower of cost or market, using thefirst-in, first-out or “FIFO” method.
(i) Property and Equipment
Property and equipment is stated at cost. Buildings and leasehold improvements are depreciated using thestraight-line method over the lesser of the life of the lease, including certain renewal options, or the estimateduseful lives of the assets, which range from 5 to 20 years. Furniture and equipment are depreciated using thestraight-line method over the estimated useful lives of the assets, which range from 3 to 10 years. Routine repairand maintenance costs are expensed when incurred. Major replacements and improvements are capitalized.
We review the carrying amount of property and equipment semi-annually or when events or circumstancesindicate that the carrying amount may not be recoverable. If the carrying amount is not recoverable, we record an
F-20

impairment charge for the excess of the carrying amount over the fair value. We determine fair value based ondiscounted projected future operating cash flows of the restaurants over their remaining service life using a riskadjusted discount rate that is commensurate with the risk inherent in our current business model. Impairmentcharges are included in other gains and charges in the consolidated statements of comprehensive income.
(j) Operating Leases
Rent expense for leases that contain scheduled rent increases is recognized on a straight-line basis over thelease term, including cancelable option periods where failure to exercise such options would result in aneconomic penalty such that the renewal appears reasonably assured. The straight-line rent calculation and rentexpense includes the rent holiday period, which is the period of time between taking control of a leased site andthe rent commencement date. Contingent rents are generally amounts due as a result of sales in excess ofamounts stipulated in certain restaurant leases and are included in rent expense as they are incurred. Landlordcontributions are recorded when received as a deferred rent liability and amortized as a reduction of rent expenseon a straight-line basis over the lease term.
(k) Advertising
Advertising production costs are expensed in the period when the advertising first takes place. Otheradvertising costs are expensed as incurred. Advertising costs, net of advertising contributions from franchisees,were $94.3 million, $92.2 million and $82.8 million million in fiscal 2015, 2014, and 2013, respectively, and areincluded in restaurant expenses in the consolidated statements of comprehensive income.
(l) Goodwill and Other Intangibles
Goodwill is not subject to amortization, but is tested for impairment annually or more frequently if events orchanges in circumstances indicate that the asset might be impaired. Goodwill has been assigned to reporting unitsfor purposes of impairment testing. Our two restaurant brands, Chili’s and Maggiano’s, are both reporting unitsand operating segments. We have established that the appropriate level to evaluate goodwill is at the operatingsegment level. The menu items, services offered and food preparation are virtually identical at each restaurantwithin the reporting unit and our targeted customer is consistent across each brand. We maintain a centralizedpurchasing department which manages all purchasing and distribution for our restaurants. In addition, contractsfor our food supplies are negotiated at a consolidated level in order to secure the best prices and maintain similarquality across all of our brands. Local laws, regulations and other issues may result in slightly different legal andregulatory environments; however, the overall regulatory climate and economic characteristics within and acrossour operating segments are quite similar. As such, we believe that aggregating components is appropriate for theevaluation of goodwill.
Goodwill impairment tests consist of a comparison of each reporting unit’s fair value with its carryingvalue. We determine fair value based on a combination of market based values and discounted projected futureoperating cash flows of the restaurant brands using a risk adjusted discount rate that is commensurate with therisk inherent in our current business model. If the carrying value of a reporting unit exceeds its fair value,goodwill is written down to its implied fair value. We determined that there was no goodwill impairment duringour annual test as the fair value of our reporting units was substantially in excess of the carrying value. Noindicators of impairment were identified through the end of fiscal year 2015. See Note 5 for additionaldisclosures related to goodwill.
We occasionally acquire restaurants from our franchisees. Goodwill from these acquisitions represents theexcess of the cost of the business acquired over the net amounts assigned to assets acquired, includingidentifiable intangible assets, primarily reacquired franchise rights. In connection with the sale of restaurants, wewill allocate goodwill from the reporting unit, or restaurant brand, to the disposal group in the determination ofthe gain or loss on the disposition. The allocation is based on the relative fair values of the disposal group and the
F-21

portion of the reporting unit that was retained. If we dispose of a restaurant brand and all related restaurants, theentire goodwill balance associated with the reporting unit or brand will be included in the disposal group forpurposes of determining the gain or loss on the disposition. Additionally, if we sell restaurants with reacquiredfranchise rights, we will include those assets in the gain or loss on the disposition.
Reacquired franchise rights are also reviewed for impairment annually or whenever events or changes incircumstances indicate that the carrying amount may not be recoverable. If the carrying amount is notrecoverable, we record an impairment charge for the excess of the carrying amount over the fair value.Impairment charges are included in other gains and charges in the consolidated statements of comprehensiveincome.
(m) Liquor Licenses
The costs of obtaining non-transferable liquor licenses from local government agencies are expensed overthe specified term of the license. The costs of purchasing transferable liquor licenses through open markets injurisdictions with a limited number of authorized liquor licenses are capitalized as indefinite-lived intangibleassets and included in intangibles.
Liquor licenses are reviewed for impairment semi-annually or whenever events or changes in circumstancesindicate that the carrying amount may not be recoverable. If the carrying amount is not recoverable, we record animpairment charge for the excess of the carrying amount over the fair value. We determine fair value based onprices in the open market for licenses in same or similar jurisdictions. Impairment charges are included in othergains and charges in the consolidated statements of comprehensive income.
(n) Sales Taxes
Sales taxes collected from guests are excluded from revenues. The obligation is included in accruedliabilities until the taxes are remitted to the appropriate taxing authorities.
(o) Self-Insurance Program
We are self-insured for certain losses related to health, general liability and workers’ compensation. Wemaintain stop loss coverage with third party insurers to limit our total exposure. The self-insurance liabilityrepresents an estimate of the ultimate cost of claims incurred and unpaid as of the balance sheet date. Theestimated liability is not discounted and is established based upon analysis of historical data and actuarialestimates, and is reviewed on a quarterly basis to ensure that the liability is appropriate. If actual trends,including the severity or frequency of claims, differ from our estimates, our financial results could be impacted.Accrued and other liabilities include the estimated incurred but unreported costs to settle unpaid claims.
(p) Income Taxes
Income taxes are accounted for under the asset and liability method. Deferred tax assets and liabilities arerecognized for the future tax consequences attributable to differences between the financial statement carryingamounts of existing assets and liabilities and their respective tax bases. Deferred tax assets and liabilities aremeasured using enacted tax rates expected to apply to taxable income in the years in which those temporarydifferences are expected to be recovered or settled. The effect on deferred tax assets and liabilities of a change intax rates is recognized in income in the period that includes the enactment date.
We record a liability for unrecognized tax benefits resulting from tax positions taken, or expected to betaken, in an income tax return. We recognize any interest and penalties related to unrecognized tax benefits inincome tax expense.
F-22

(q) Stock-Based Compensation
We measure and recognize compensation cost at fair value for all share-based payments. We recordcompensation expense using a graded-vesting schedule or on a straight-line basis, as applicable, over the vestingperiod, or to the date on which retirement eligibility is achieved, if shorter (non-substantive vesting periodapproach).
Certain employees are eligible to receive stock options, performance shares, restricted stock and restrictedstock units, while non-employee members of the Board of Directors are eligible to receive stock options,restricted stock and restricted stock units. Performance shares represent a right to receive shares of commonstock upon satisfaction of company performance goals at the end of a three-year cycle. The fair value ofperformance shares is determined on the date of grant based on a Monte Carlo simulation model. The fair valueof restricted stock and restricted stock units are based on our closing stock price on the date of grant.
Stock-based compensation expense totaled approximately $15.0 million, $16.9 million and $16.6 million forfiscal 2015, 2014 and 2013, respectively. The total income tax benefit recognized in the consolidated statementsof comprehensive income related to stock-based compensation expense was approximately $5.5 million, $6.9million and $6.6 million during fiscal 2015, 2014 and 2013, respectively.
The weighted average fair values of option grants were $11.72, $14.75 and $12.94 during fiscal 2015, 2014and 2013, respectively. The fair value of stock options is estimated using the Black-Scholes option-pricing modelwith the following weighted average assumptions:
2015 2014 2013
Expected volatility . . . . . . . . . . . . . . . . . . . . . . . . . . . . . . . . . 31.0% 47.7% 53.4%Risk-free interest rate . . . . . . . . . . . . . . . . . . . . . . . . . . . . . . . 1.6% 1.6% 0.7%Expected lives . . . . . . . . . . . . . . . . . . . . . . . . . . . . . . . . . . . . . 5 years 5 years 5 yearsDividend yield . . . . . . . . . . . . . . . . . . . . . . . . . . . . . . . . . . . . . 2.2% 2.2% 2.4%
Expected volatility and the expected life of stock options are based on historical experience. The risk-freerate is based on the yield of a Treasury Note with a term equal to the expected life of the stock options. Thedividend yield is based on the most recent quarterly dividend per share declared and the closing stock price onthe declaration date.
(r) Preferred Stock
Our Board of Directors is authorized to provide for the issuance of 1.0 million preferred shares with a parvalue of $1.00 per share, in one or more series, and to fix the voting rights, liquidation preferences, dividendrates, conversion rights, redemption rights, and terms, including sinking fund provisions, and certain other rightsand preferences. As of June 24, 2015, no preferred shares were issued.
(s) Shareholders’ (Deficit) Equity
In August 2014, our Board of Directors authorized a $350.0 million increase to our existing sharerepurchase program resulting in total authorizations of $3,935.0 million. We repurchased approximately5.4 million shares of our common stock for $306.3 million during fiscal 2015 including shares purchased as partof our share repurchase program and to satisfy team member tax withholding obligations on the vesting ofrestricted shares. As of June 24, 2015, approximately $361 million was available under our share repurchaseauthorizations. Our stock repurchase plan has been and will be used to return capital to shareholders and tominimize the dilutive impact of stock options and other share-based awards. We evaluate potential sharerepurchases under our plan based on several factors, including our cash position, share price, operationalliquidity, proceeds from divestitures, borrowings and planned investment and financing needs. Repurchasedcommon stock is reflected as a reduction of shareholders’ equity. During fiscal 2015, approximately 765,000stock options were exercised resulting in cash proceeds of $16.3 million.
F-23
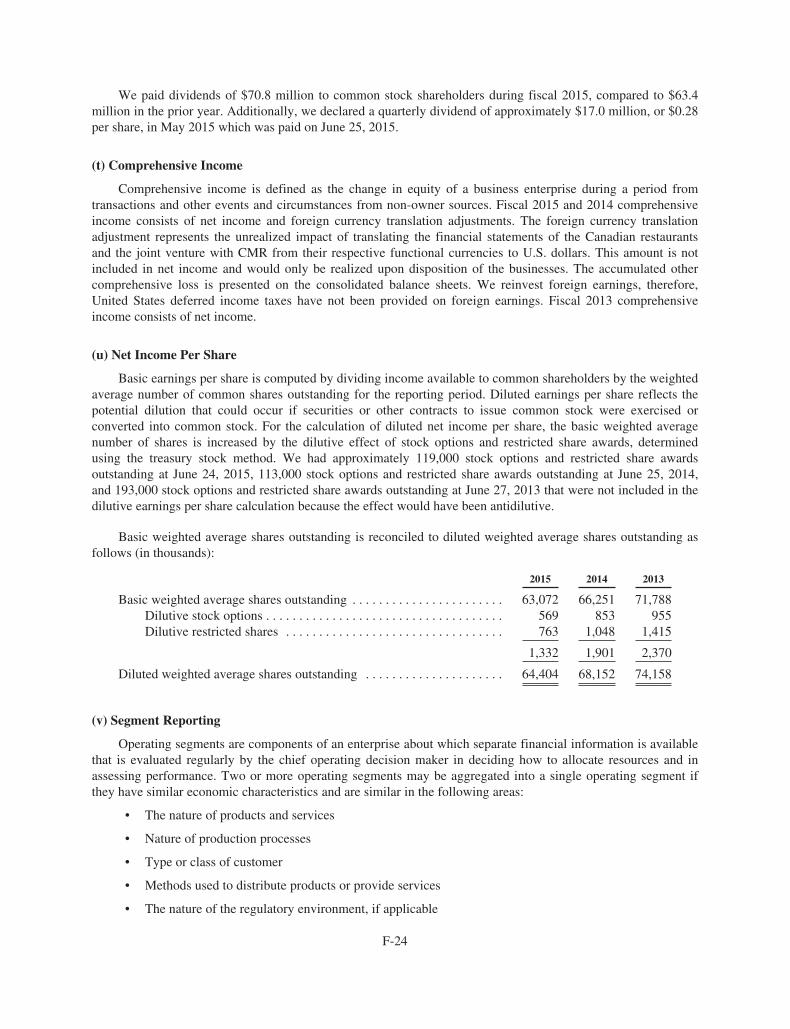
We paid dividends of $70.8 million to common stock shareholders during fiscal 2015, compared to $63.4million in the prior year. Additionally, we declared a quarterly dividend of approximately $17.0 million, or $0.28per share, in May 2015 which was paid on June 25, 2015.
(t) Comprehensive Income
Comprehensive income is defined as the change in equity of a business enterprise during a period fromtransactions and other events and circumstances from non-owner sources. Fiscal 2015 and 2014 comprehensiveincome consists of net income and foreign currency translation adjustments. The foreign currency translationadjustment represents the unrealized impact of translating the financial statements of the Canadian restaurantsand the joint venture with CMR from their respective functional currencies to U.S. dollars. This amount is notincluded in net income and would only be realized upon disposition of the businesses. The accumulated othercomprehensive loss is presented on the consolidated balance sheets. We reinvest foreign earnings, therefore,United States deferred income taxes have not been provided on foreign earnings. Fiscal 2013 comprehensiveincome consists of net income.
(u) Net Income Per Share
Basic earnings per share is computed by dividing income available to common shareholders by the weightedaverage number of common shares outstanding for the reporting period. Diluted earnings per share reflects thepotential dilution that could occur if securities or other contracts to issue common stock were exercised orconverted into common stock. For the calculation of diluted net income per share, the basic weighted averagenumber of shares is increased by the dilutive effect of stock options and restricted share awards, determinedusing the treasury stock method. We had approximately 119,000 stock options and restricted share awardsoutstanding at June 24, 2015, 113,000 stock options and restricted share awards outstanding at June 25, 2014,and 193,000 stock options and restricted share awards outstanding at June 27, 2013 that were not included in thedilutive earnings per share calculation because the effect would have been antidilutive.
Basic weighted average shares outstanding is reconciled to diluted weighted average shares outstanding asfollows (in thousands):
2015 2014 2013
Basic weighted average shares outstanding . . . . . . . . . . . . . . . . . . . . . . . 63,072 66,251 71,788Dilutive stock options . . . . . . . . . . . . . . . . . . . . . . . . . . . . . . . . . . . . 569 853 955Dilutive restricted shares . . . . . . . . . . . . . . . . . . . . . . . . . . . . . . . . . 763 1,048 1,415
1,332 1,901 2,370
Diluted weighted average shares outstanding . . . . . . . . . . . . . . . . . . . . . 64,404 68,152 74,158
(v) Segment Reporting
Operating segments are components of an enterprise about which separate financial information is availablethat is evaluated regularly by the chief operating decision maker in deciding how to allocate resources and inassessing performance. Two or more operating segments may be aggregated into a single operating segment ifthey have similar economic characteristics and are similar in the following areas:
• The nature of products and services
• Nature of production processes
• Type or class of customer
• Methods used to distribute products or provide services
• The nature of the regulatory environment, if applicable
F-24
Our two brands have similar types of products, contracts, customers and employees and all operate as full-service restaurants offering lunch and dinner in the casual-dining segment of the industry. In addition, we havesimilar long-term average margins across our brands. Therefore, we believe we meet the criteria for aggregatingoperating segments into a single reporting segment.
2. ACQUISITION OF CHILI’S RESTAURANTS
On June 1, 2013, we completed the acquisition of 11 Chili’s restaurants in Alberta, Canada from an existingfranchisee for $24.6 million in cash. The results of operations of the Canadian restaurants are included in ourconsolidated financial statements from the date of acquisition. The assets and liabilities of the Canadianrestaurants were recorded at their respective fair values as of the date of acquisition based on a preliminaryestimate. During fiscal 2014, we completed the valuation of the assets and liabilities resulting in an adjustment ofapproximately $8.4 million to goodwill.
The excess of the purchase price over the aggregate fair value of net assets acquired was allocated togoodwill. The majority of the goodwill balance is deductible for tax purposes. The portion of the purchase priceattributable to goodwill represents benefits expected as a result of the acquisition, including sales and unit growthopportunities. As a result of the acquisition, we incurred expenses of approximately $0.4 million during fiscal2013, which are included in other gains and charges in our consolidated statement of comprehensive income.Pro-forma financial information of the combined entities for periods prior to the acquisition is not presented dueto the immaterial impact of the financial results of the Canadian restaurants on our consolidated financialstatements.
3. INVESTMENTS AND OTHER DISPOSITIONS
(a) Investments
We have a joint venture agreement with CMR, S.A.B. de C.V. to develop 50 Chili’s restaurants in Mexico.At June 24, 2015, 38 Chili’s restaurants were operating in the joint venture. We account for the Mexico jointventure investment under the equity method of accounting and record our share of the net income or loss of theinvestee within operating income since their operations are similar to our ongoing operations. These amountshave been included in restaurant expense in our consolidated statements of comprehensive income due to theimmaterial nature of the amounts. The investment in the joint venture is included in other assets in ourconsolidated balance sheets.
In fiscal 2011, we entered into a joint venture investment with BTTO Participacoes Ltda (“BTTO”) todevelop Chili’s restaurants in Brazil. In April 2012, we purchased BTTO’s interest in the joint venture and beganconsolidating the entity’s results. In the fourth quarter of fiscal 2013, we fully impaired the property andequipment and recorded a charge in other gains and charges in the consolidated statement of comprehensiveincome. The restaurant was subsequently closed in July 2013.
(b) Other Dispositions
In April 2013, we sold our remaining ownership interest in Romano’s Macaroni Grill (“Macaroni Grill”) forapproximately $8.3 million in cash proceeds. This amount was recorded as a gain in other gains and charges inthe consolidated statement of comprehensive income in fiscal 2013.
F-25
4. OTHER GAINS AND CHARGES
Other gains and charges consist of the following (in thousands):
2015 2014 2013
Litigation . . . . . . . . . . . . . . . . . . . . . . . . . . . . . . . . . . . . . . $(2,753) $39,500 $ 0Restaurant impairment charges . . . . . . . . . . . . . . . . . . . . . 2,255 4,502 5,276Restaurant closure charges . . . . . . . . . . . . . . . . . . . . . . . . 1,736 3,413 3,637Severance and other benefits . . . . . . . . . . . . . . . . . . . . . . . 1,182 2,140 2,235Acquisition costs . . . . . . . . . . . . . . . . . . . . . . . . . . . . . . . . 1,100 0 0Loss (gain) on the sale of assets, net . . . . . . . . . . . . . . . . . 1,093 (608) (11,228)Impairment of franchise rights . . . . . . . . . . . . . . . . . . . . . 440 0 0Impairment of liquor licenses . . . . . . . . . . . . . . . . . . . . . . 205 0 170Loss on extinguishment of debt . . . . . . . . . . . . . . . . . . . . . 0 0 15,768Other . . . . . . . . . . . . . . . . . . . . . . . . . . . . . . . . . . . . . . . . . (494) 277 1,442
$ 4,764 $49,224 $ 17,300
During fiscal 2015, we were a plaintiff in the antitrust litigation against Visa and MasterCard styled asProgressive Casualty Insurance Co., et al. v. Visa, Inc., et al. A settlement agreement was fully executed by allparties in January 2015 and we recognized a gain of approximately $8.6 million.
During fiscal 2015, the class action lawsuit styled as Hohnbaum, et al. v. Brinker Restaurant Corp., et al.(“Hohnbaum case”) was finalized resulting in an additional charge of approximately $5.8 million to adjust ourprevious estimate of the final settlement amount. See Note 14 for additional disclosures.
We recorded restaurant impairment charges of $2.3 million related to underperforming restaurants thateither continue to operate or are scheduled to close. We also recorded restaurant closure charges of $1.7 millionprimarily related to lease termination charges and a $1.1 million loss primarily related to the sale of two companyowned restaurants located in Mexico. Furthermore, we incurred $1.2 million in severance other benefits relatedto organizational changes made during the fiscal year. The severance charges include expense related to theaccelerated vesting of stock-based compensation awards. We also incurred expenses of approximately $1.1million during fiscal 2015 related to the acquisition of a franchisee which owns 103 Chili’s restaurantssubsequent to the end of the year. See Note 16 for additional disclosures.
Other gains and charges in fiscal 2014 includes charges of approximately $39.5 million related to variouslitigation matters including the Hohnbaum case. See Note 14 for additional disclosures.
During fiscal 2014, we recorded restaurant impairment charges of $4.5 million related to underperformingrestaurants that either continue to operate or are scheduled to close. We also recorded $3.4 million of restaurantclosure charges consisting primarily of lease termination charges and other costs associated with closedrestaurants. Additionally, we incurred $2.1 million in severance and other benefits related to organizationalchanges made during the fiscal year. The severance charges include expense related to the accelerated vesting ofstock-based compensation awards. Furthermore, a $0.6 million gain was recorded primarily related to land sales.
In June 2013, we redeemed the 5.75% notes due May 2014, resulting in a charge of $15.8 millionrepresenting the remaining interest payments and unamortized debt issuance costs and discount.
During fiscal 2013, we recorded restaurant impairment charges of $5.3 million primarily related to theimpairment of the company-owned restaurant in Brazil which subsequently closed in fiscal 2014. We alsorecorded $3.6 million of restaurant closure charges, consisting primarily of $2.3 million of lease terminationcharges and $0.9 million related to the write-down of land associated with a closed facility. Additionally, weincurred $2.2 million in severance and other benefits related to organizational changes. The severance charges
F-26

include expense related to the accelerated vesting of stock-based compensation awards. In fiscal 2013, we alsorecognized gains of $11.2 million on the sale of assets, consisting of an $8.3 million gain on the sale of ourremaining interest in Macaroni Grill and net gains of $2.9 million related to land sales.
The restaurant, liquor license and reacquired franchise rights impairment charges were measured as theexcess of the carrying amount over the fair value. See Note 10 for fair value disclosures related to theseimpairment charges.
5. GOODWILL AND INTANGIBLES
The changes in the carrying amount of goodwill for the fiscal years ended June 24, 2015 and June 25, 2014are as follows (in thousands):
2015 2014
Balance at beginning of year:Goodwill . . . . . . . . . . . . . . . . . . . . . . . . . . . . . . . . . . . . . . . . . . $196,268 $204,937Accumulated impairment losses(a) . . . . . . . . . . . . . . . . . . . . . . (62,834) (62,834)
133,434 142,103
Changes in goodwill:Adjustments(b) . . . . . . . . . . . . . . . . . . . . . . . . . . . . . . . . . . . . . 0 (8,387)Foreign currency translation adjustment . . . . . . . . . . . . . . . . . . (1,053) (282)
Balance at end of year:Goodwill . . . . . . . . . . . . . . . . . . . . . . . . . . . . . . . . . . . . . . . . . . 195,215 196,268Accumulated impairment losses . . . . . . . . . . . . . . . . . . . . . . . . (62,834) (62,834)
$132,381 $133,434
(a) The impairment losses recorded in prior years are related to restaurant brands that we nolonger own.
(b) The valuation of assets and liabilities related to the acquired Canadian restaurants wasfinalized during fiscal 2014 resulting in an adjustment of approximately $8.4 million togoodwill.
Intangible assets, net for the fiscal years ended June 24, 2015 and June 25, 2014 are as follows (inthousands):
2015 2014
Gross CarryingAmount
AccumulatedAmortization
Net CarryingAmount
Gross CarryingAmount
AccumulatedAmortization
Net CarryingAmount
Definite-lived intangible assetsReacquired franchise rights(a) . . . $ 7,423 $(1,625) $5,798 $ 9,107 $(1,121) $7,986Other . . . . . . . . . . . . . . . . . . . . . . . 804 (358) 446 872 (292) 580
$ 8,227 $(1,983) $6,244 $ 9,979 $(1,413) $8,566
Indefinite-lived intangible assets
Liquor licenses . . . . . . . . . . . . . . . $10,398 $10,275
Amortization expense for all definite-lived intangible assets was $0.8 million, $1.0 million and $0.2 millionin fiscal 2015, 2014 and 2013, respectively. Amortization expense for definite-lived intangible assets willapproximate $0.9 million for the next five fiscal years.
(a) The gross carrying amount and accumulated amortization include the impact of foreign currency translationon existing balances of $1.0 million. Additionally, we recorded an impairment charge of $0.4 million infiscal 2015 to write down the Brinker Canada franchise rights. See Note 10 for additional disclosures.
F-27

6. ACCRUED AND OTHER LIABILITIES
Other accrued liabilities consist of the following (in thousands):
2015 2014
Sales tax . . . . . . . . . . . . . . . . . . . . . . . . . . . . . . . . . . . . . . . . . . . . . . . . . . 20,308 19,622Insurance . . . . . . . . . . . . . . . . . . . . . . . . . . . . . . . . . . . . . . . . . . . . . . . . . . 22,658 20,652Property tax . . . . . . . . . . . . . . . . . . . . . . . . . . . . . . . . . . . . . . . . . . . . . . . 14,224 14,209Dividends . . . . . . . . . . . . . . . . . . . . . . . . . . . . . . . . . . . . . . . . . . . . . . . . . 16,961 15,625Litigation reserves . . . . . . . . . . . . . . . . . . . . . . . . . . . . . . . . . . . . . . . . . . 0 39,500Other . . . . . . . . . . . . . . . . . . . . . . . . . . . . . . . . . . . . . . . . . . . . . . . . . . . . . 37,046 36,446
$111,197 $146,054
Other liabilities consist of the following (in thousands):
2015 2014
Straight-line rent . . . . . . . . . . . . . . . . . . . . . . . . . . . . . . . . . . . . . . . . . . . . $ 56,345 $ 57,462Insurance . . . . . . . . . . . . . . . . . . . . . . . . . . . . . . . . . . . . . . . . . . . . . . . . . . 30,988 36,352Landlord contributions . . . . . . . . . . . . . . . . . . . . . . . . . . . . . . . . . . . . . . . 24,785 23,404Unrecognized tax benefits . . . . . . . . . . . . . . . . . . . . . . . . . . . . . . . . . . . . 5,144 5,247Other . . . . . . . . . . . . . . . . . . . . . . . . . . . . . . . . . . . . . . . . . . . . . . . . . . . . . 7,771 6,633
$125,033 $129,098
7. INCOME TAXES
The provision for income taxes consists of the following (in thousands):
2015 2014 2013
Current income tax expense:Federal . . . . . . . . . . . . . . . . . . . . . . . . . . . . . . . . . . . . . $59,726 $ 66,170 $46,852State . . . . . . . . . . . . . . . . . . . . . . . . . . . . . . . . . . . . . . . 11,862 15,219 11,800Foreign . . . . . . . . . . . . . . . . . . . . . . . . . . . . . . . . . . . . . 3,319 3,550 2,879
Total current income tax expense . . . . . . . . . . . . 74,907 84,939 61,531
Deferred income tax (benefit) expense:Federal . . . . . . . . . . . . . . . . . . . . . . . . . . . . . . . . . . . . . 10,754 (18,715) 7,344State . . . . . . . . . . . . . . . . . . . . . . . . . . . . . . . . . . . . . . . 2,018 (4,087) (1,919)Foreign . . . . . . . . . . . . . . . . . . . . . . . . . . . . . . . . . . . . . (96) 112 0
Total deferred income tax (benefit) expense . . . . 12,676 (22,690) 5,425
$87,583 $ 62,249 $66,956
A reconciliation between the reported provision for income taxes and the amount computed by applying thestatutory Federal income tax rate of 35% to income before provision for income taxes is as follows (inthousands):
2015 2014 2013
Income tax expense at statutory rate . . . . . . . . . . . . . . . . . $ 99,497 $ 75,701 $ 80,610FICA tax credit . . . . . . . . . . . . . . . . . . . . . . . . . . . . . . . . . (18,633) (18,116) (16,450)State income taxes, net of Federal benefit . . . . . . . . . . . . . 8,646 7,636 6,368Other . . . . . . . . . . . . . . . . . . . . . . . . . . . . . . . . . . . . . . . . . (1,927) (2,972) (3,572)
$ 87,583 $ 62,249 $ 66,956
F-28

The income tax effects of temporary differences that give rise to significant portions of deferred income taxassets and liabilities as of June 24, 2015 and June 25, 2014 are as follows (in thousands):
2015 2014
Deferred income tax assets:Leasing transactions . . . . . . . . . . . . . . . . . . . . . . . . . . . . . . . . . . . $ 38,858 $ 40,085Stock-based compensation . . . . . . . . . . . . . . . . . . . . . . . . . . . . . . 13,105 13,698Restructure charges and impairments . . . . . . . . . . . . . . . . . . . . . . 2,303 16,726Insurance reserves . . . . . . . . . . . . . . . . . . . . . . . . . . . . . . . . . . . . 18,567 18,550Employee benefit plans . . . . . . . . . . . . . . . . . . . . . . . . . . . . . . . . 470 404Gift cards . . . . . . . . . . . . . . . . . . . . . . . . . . . . . . . . . . . . . . . . . . . 18,499 15,497Other, net . . . . . . . . . . . . . . . . . . . . . . . . . . . . . . . . . . . . . . . . . . . 9,804 8,975
Total deferred income tax assets . . . . . . . . . . . . . . . . . . . . . 101,606 113,935
Deferred income tax liabilities: . . . . . . . . . . . . . . . . . . . . . . . . . .Prepaid expenses . . . . . . . . . . . . . . . . . . . . . . . . . . . . . . . . . . . . . 16,803 16,462Goodwill and other amortization . . . . . . . . . . . . . . . . . . . . . . . . . 27,713 26,551Depreciation and capitalized interest on property and
equipment . . . . . . . . . . . . . . . . . . . . . . . . . . . . . . . . . . . . . . . . . 19,990 20,982Other, net . . . . . . . . . . . . . . . . . . . . . . . . . . . . . . . . . . . . . . . . . . . 3,963 3,680
Total deferred income tax liabilities . . . . . . . . . . . . . . . . . . . 68,469 67,675
Net deferred income tax asset . . . . . . . . . . . . . . . . . . . . . . . $ 33,137 $ 46,260
A reconciliation of unrecognized tax benefits for the fiscal years ended June 24, 2015 and June 25, 2014 areas follows (in thousands):
2015 2014
Balance at beginning of year . . . . . . . . . . . . . . . . . . . . . . . . . . . . . . . . . . $ 7,375 $6,388Additions based on tax positions related to the current year . . . . . 760 1,582Additions based on tax positions related to prior years . . . . . . . . . 18 347Settlements with tax authorities . . . . . . . . . . . . . . . . . . . . . . . . . . . (371) (339)Expiration of statute of limitations . . . . . . . . . . . . . . . . . . . . . . . . . (1,694) (603)
Balance at end of year . . . . . . . . . . . . . . . . . . . . . . . . . . . . . . . . . . . . . . . $ 6,088 $7,375
The total amount of unrecognized tax benefits that would favorably affect the effective tax rate if resolvedin our favor due to the effect of deferred tax benefits was $4.1 million and $4.9 million as of June 24, 2015 andJune 25, 2014, respectively. During the next twelve months, we anticipate that it is reasonably possible that theamount of unrecognized tax benefits could be reduced by approximately $0.8 million ($0.6 million of whichwould affect the effective tax rate due to the effect of deferred tax benefits) either because our tax position willbe sustained upon audit or as a result of the expiration of the statute of limitations for specific jurisdictions.
We recognize accrued interest and penalties related to unrecognized tax benefits in income taxexpense. During fiscal 2015, we recognized an expense of approximately $0.2 million in interest. During fiscal2014 and 2013, we recognized a benefit of approximately $0.3 million and an expense of $0.5 million,respectively, in interest due to the reduction of accrued interest from statute expirations and settlements, net ofaccrued interest for remaining positions. As of June 24, 2015, we had $2.2 million ($1.5 million net of a $0.7million Federal deferred tax benefit) of interest and penalties accrued, compared to $2.5 million ($1.7 million netof a $0.8 million Federal deferred tax benefit) at June 25, 2014.
F-29

8. DEBT
Long-term debt consists of the following (in thousands):
2015 2014
3.88% notes . . . . . . . . . . . . . . . . . . . . . . . . . . . . . . . . . . . . . . . . . . . . . $299,766 $299,7362.60% notes . . . . . . . . . . . . . . . . . . . . . . . . . . . . . . . . . . . . . . . . . . . . . 249,899 249,864Term loan . . . . . . . . . . . . . . . . . . . . . . . . . . . . . . . . . . . . . . . . . . . . . . . 0 187,500Revolving credit facility . . . . . . . . . . . . . . . . . . . . . . . . . . . . . . . . . . . . 383,750 80,000Capital lease obligations (see Note 9) . . . . . . . . . . . . . . . . . . . . . . . . . 40,849 43,086
974,264 860,186Less current installments . . . . . . . . . . . . . . . . . . . . . . . . . . . . . . . . . . . (3,439) (27,884)
$970,825 $832,302
During the first nine months of fiscal 2015, $97 million was drawn from the $250 million revolving creditfacility primarily to fund share repurchases, and we paid the required quarterly term loan payments totaling $18.7million. In March 2015, we terminated the existing credit facility including both the $250 million revolver andthe term loan and entered into a new $750 million revolving credit facility. Approximately $345.8 million wasdrawn from the new revolver and the proceeds were used to pay off the outstanding balances of the term loan and$250 million revolver in the amount of $168.8 million and $177.0 million, respectively. During the fourth quarterof fiscal 2015, an additional $38.0 million was drawn from the new revolver primarily to fund share repurchases.Subsequent to the end of the fiscal year, an additional $135.5 million was borrowed from the $750 millionrevolving credit facility primarily to fund the acquisition of a franchisee which owns 103 Chili’s restaurants. SeeNote 16 for additional disclosures related to the acquisition.
The maturity date of the $750 million revolving credit facility is March 12, 2020. The revolving creditfacility bears interest of LIBOR plus an applicable margin, which is a function of our credit rating and debt tocash flow ratio, but is subject to a maximum of LIBOR plus 2.00%. Based on our current credit rating, we arepaying interest at a rate of LIBOR plus 1.38%. One month LIBOR at June 24, 2015 was approximately 0.19%.As of June 24, 2015, $366.2 million of credit is available under the revolving credit facility.
In May 2013, we issued $550.0 million of notes consisting of two tranches—$250.0 million of 2.60% notesdue in May 2018 and $300.0 million of 3.88% notes due in May 2023. We received proceeds totalingapproximately $549.5 million prior to debt issuance costs and utilized the proceeds to redeem the 5.75% notesdue in June 2014, pay down the revolver and fund share repurchases. The notes require semi-annual interestpayments which began in the second quarter of fiscal 2014.
Our debt agreements contain various financial covenants that, among other things, require the maintenanceof certain leverage and fixed charge coverage ratios. We are currently in compliance with all financial covenants.
Excluding capital lease obligations (see Note 9) and interest, our long-term debt maturities for the five yearsfollowing June 24, 2015 and thereafter are as follows (in thousands):
Fiscal Year Long-Term Debt
2016 . . . . . . . . . . . . . . . . . . . . . . . . . . . . . . . . . . . . . . . . . . . . . . . . . . . . . . . . . . $ 02017 . . . . . . . . . . . . . . . . . . . . . . . . . . . . . . . . . . . . . . . . . . . . . . . . . . . . . . . . . . 02018 . . . . . . . . . . . . . . . . . . . . . . . . . . . . . . . . . . . . . . . . . . . . . . . . . . . . . . . . . . 249,8992019 . . . . . . . . . . . . . . . . . . . . . . . . . . . . . . . . . . . . . . . . . . . . . . . . . . . . . . . . . . 02020 . . . . . . . . . . . . . . . . . . . . . . . . . . . . . . . . . . . . . . . . . . . . . . . . . . . . . . . . . . 383,750Thereafter . . . . . . . . . . . . . . . . . . . . . . . . . . . . . . . . . . . . . . . . . . . . . . . . . . . . . 299,766
$933,415
F-30

9. LEASES
(a) Capital Leases
We lease certain buildings under capital leases. The asset value of $39.0 million at June 24, 2015 andJune 25, 2014, and the related accumulated amortization of $22.1 million and $20.1 million at June 24, 2015 andJune 25, 2014, respectively, are included in property and equipment. Amortization of assets under capital leasesis included in depreciation and amortization expense.
(b) Operating Leases
We lease restaurant facilities and office space under operating leases. The majority having terms expiring atvarious dates through fiscal 2031. The restaurant leases have cumulative renewal clauses of 1 to 30 years at ouroption and, in some cases, have provisions for contingent rent based upon a percentage of sales in excess ofspecified levels, as defined in the leases. We include other rent-related costs in rent expense, such as commonarea maintenance, taxes and amortization of landlord contributions.
Rent expense consists of the following (in thousands):
2015 2014 2013
Straight-lined minimum rent . . . . . . . . . . . . . . . . . . . . . . $ 92,917 $ 90,574 $ 88,773Contingent rent . . . . . . . . . . . . . . . . . . . . . . . . . . . . . . . . 4,774 4,737 3,637Other . . . . . . . . . . . . . . . . . . . . . . . . . . . . . . . . . . . . . . . . 9,998 9,817 9,296
Total rent expense . . . . . . . . . . . . . . . . . . . . . . . . . . . . . . $107,689 $105,128 $101,706
(c) Commitments
As of June 24, 2015, future minimum lease payments on capital and operating leases were as follows (inthousands):
Fiscal YearCapitalLeases
OperatingLeases
2016 . . . . . . . . . . . . . . . . . . . . . . . . . . . . . . . . . . . . . . . . . . . . . . . . . . . . $ 6,050 $113,5112017 . . . . . . . . . . . . . . . . . . . . . . . . . . . . . . . . . . . . . . . . . . . . . . . . . . . . 5,953 94,4052018 . . . . . . . . . . . . . . . . . . . . . . . . . . . . . . . . . . . . . . . . . . . . . . . . . . . . 5,764 70,5312019 . . . . . . . . . . . . . . . . . . . . . . . . . . . . . . . . . . . . . . . . . . . . . . . . . . . . 5,202 50,9912020 . . . . . . . . . . . . . . . . . . . . . . . . . . . . . . . . . . . . . . . . . . . . . . . . . . . . 4,853 39,736Thereafter . . . . . . . . . . . . . . . . . . . . . . . . . . . . . . . . . . . . . . . . . . . . . . . 32,114 114,526
Total minimum lease payments(a) . . . . . . . . . . . . . . . . . . . . . . . . 59,936 $483,700
Imputed interest (average rate of 7%) . . . . . . . . . . . . . . . . . . . . . . (19,087)
Present value of minimum lease payments . . . . . . . . . . . . . . . . . . 40,849Less current installments . . . . . . . . . . . . . . . . . . . . . . . . . . . . . . . . (3,439)
$ 37,410
(a) Future minimum lease payments have not been reduced by minimum sublease rentals tobe received in the future under non-cancelable subleases. Sublease rentals areapproximately $34.9 million and $37.4 million for capital and operating subleases,respectively.
F-31

10. FAIR VALUE DISCLOSURES
(a) Non-Financial Assets Measured on a Non-Recurring Basis
We review the carrying amount of property and equipment and transferable liquor licenses semi-annually orwhen events or circumstances indicate that the carrying amount may not be recoverable. If the carrying amount isnot recoverable, we record an impairment charge for the excess of the carrying amount over the fair value.
We determine the fair value of property and equipment based on discounted projected future operating cashflows of the restaurants over their remaining service life using a risk adjusted discount rate that is commensuratewith the risk inherent in our current business model. Based on our semi-annual review, during fiscal 2015, long-lived assets with a carrying value of $2.3 million, primarily related to four underperforming restaurants includingone restaurant located in Canada, were determined to have no fair value resulting in an impairment charge of$2.3 million. In fiscal 2014, long-lived assets with a carrying value of $5.8 million, primarily related to nineunderperforming restaurants, were written down to their fair value of $1.3 million resulting in an impairmentcharge of $4.5 million.
We determine the fair value of transferable liquor licenses based on prices in the open market for licenses inthe same or similar jurisdictions. Based on our semi-annual review, during fiscal 2015, four transferable liquorlicenses with a carrying value of $0.8 million were written down to the fair value of $0.6 million resulting in animpairment charge of $0.2 million. In fiscal 2014, we determined there was no impairment.
We determine the fair value of reacquired franchise rights based on discounted projected future operatingcash flows of the restaurants associated with these franchise rights. We review the carrying amount annually orwhen events or circumstances indicate that the carrying amount may not be recoverable. If the carrying amount isnot recoverable, we record an impairment charge for the excess of the carrying amount over the fair value.During fiscal 2015, we performed the annual review of reacquired franchise rights and determined there was noimpairment. Subsequent to the annual review, we performed the semi-annual review of long-lived assets anddetermined that one restaurant located in Canada was fully impaired which indicated that the related reacquiredfranchise rights had no fair value resulting in an impairment charge of $0.4 million. During fiscal 2014, wecompleted the valuation of the reacquired franchise rights related to the Canada acquisition and recorded theasset at an estimated fair value of $8.9 million in intangibles on the consolidated balance sheet. In fiscal 2014, wereviewed the reacquired franchise rights during our annual impairment analysis and determined there was noimpairment.
All impairment charges related to underperforming restaurants, liquor licenses and reacquired franchiserights were included in other gains and charges in the consolidated statements of comprehensive income for theperiods presented.
The following table presents fair values for those assets measured at fair value on a non-recurring basis atJune 24, 2015 and June 25, 2014 (in thousands):
Fair Value Measurements Using
(Level 1) (Level 2) (Level 3) Total
Long-lived assets held for use:At June 24, 2015 . . . . . . . . . . . . . . . . . . . . . . . $0 $ 0 $ 0 $ 0At June 25, 2014 . . . . . . . . . . . . . . . . . . . . . . . $0 $ 0 $1,342 $1,342
Liquor licenses:At June 24, 2015 . . . . . . . . . . . . . . . . . . . . . . . $0 $550 $ 0 $ 550At June 25, 2014 . . . . . . . . . . . . . . . . . . . . . . . $0 $ 0 $ 0 $ 0
Reacquired franchise rights:At June 24, 2015 . . . . . . . . . . . . . . . . . . . . . . . $0 $ 0 $ 0 $ 0At June 25, 2014 . . . . . . . . . . . . . . . . . . . . . . . $0 $ 0 $8,860 $8,860
F-32
(b) Other Financial Instruments
Our financial instruments consist of cash and cash equivalents, accounts receivable, accounts payable andlong-term debt. The fair values of cash and cash equivalents, accounts receivable and accounts payableapproximate their carrying amounts because of the short maturity of these items. The carrying amount of debtoutstanding related to the revolving credit facility approximates fair value as the interest rate on this instrumentapproximates current market rates (Level 2). The fair values of the 2.60% notes and 3.88% notes are based onquoted market prices and are considered Level 2 fair value measurements.
The carrying amounts and fair values of the 2.60% notes and 3.88% notes are as follows (in thousands):
June 24, 2015 June 25, 2014
Carrying Amount Fair Value Carrying Amount Fair Value
2.60% Notes . . . . . . . . . . . . . . $249,899 $250,583 $249,864 $250,4003.88% Notes . . . . . . . . . . . . . . $299,766 $290,706 $299,736 $290,211
11. STOCK-BASED COMPENSATION
Our shareholders approved stock-based compensation plans including the Stock Option and Incentive Planand the Stock Option and Incentive Plan for Non-Employee Directors and Consultants (collectively, the “Plans”).In November 2013, our shareholders approved an amendment to the Stock Option and Incentive Plan increasingthe number of shares authorized for issuance by 2.0 million shares. The total number of shares authorized forissuance to employees and non-employee directors and consultants under the Plans is currently 37.3 million. ThePlans provide for grants of options to purchase our common stock, restricted stock, restricted stock units,performance shares and stock appreciation rights.
(a) Stock Options
Expense related to stock options issued to eligible employees under the Plans is recognized using a graded-vesting schedule over the vesting period or to the date on which retirement eligibility is achieved, if shorter.Stock options generally vest over a period of 1 to 4 years and have contractual terms to exercise of 8 years. Fullor partial vesting of awards may occur upon a change in control (as defined in the Plans), or upon an employee’sdeath, disability or involuntary termination.
Transactions during fiscal 2015 were as follows (in thousands, except option prices):
Number ofOptions
WeightedAverageExercise
Price
WeightedAverage
RemainingContractualLife (Years)
AggregateIntrinsic
Value
Options outstanding at June 25, 2014 . . . . . 1,701 $24.80Granted . . . . . . . . . . . . . . . . . . . . . . . . . . . . . 279 51.24Exercised . . . . . . . . . . . . . . . . . . . . . . . . . . . (765) 21.25Forfeited or canceled . . . . . . . . . . . . . . . . . . (42) 34.45
Options outstanding at June 24, 2015 . . . . . 1,173 $33.08 4.8 $28,849
Options exercisable at June 24, 2015 . . . . . . 624 $24.06 3.4 $20,907
At June 24, 2015, unrecognized compensation expense related to stock options totaled approximately $2.5million and will be recognized over a weighted average period of 1.8 years. The intrinsic value of optionsexercised totaled approximately $28.1 million, $25.7 million and $22.4 million during fiscal 2015, 2014 and2013, respectively. The tax benefit realized on options exercised totaled approximately $9.2 million, $8.9 millionand $8.1 million during fiscal 2015, 2014 and 2013, respectively.
F-33

(b) Restricted Share Awards
Restricted share awards consist of performance shares, restricted stock and restricted stock units.Performance shares and most restricted stock units issued to eligible employees under the Plans generally vest infull on the third anniversary of the date of grant, while restricted stock units issued to eligible employees underour career equity plan generally vest upon each employee’s retirement from the Company. Expense is recognizedratably over the vesting period, or to the date on which retirement eligibility is achieved, if shorter. Restrictedstock and restricted stock units issued to non-employee directors under the Plans generally vest in full on thefourth anniversary of the date of grant or upon each director’s retirement from the Board and are expensed whengranted. Full or partial vesting of awards may occur upon a change in control (as defined in the Plans), or uponan employee’s death, disability or involuntary termination.
Transactions during fiscal 2015 were as follows (in thousands, except fair values):
Number ofRestricted
ShareAwards
WeightedAverage
Fair ValuePer Award
Restricted share awards outstanding at June 25, 2014 . . . . . . . . . . . . . . . 1,508 $29.39Granted . . . . . . . . . . . . . . . . . . . . . . . . . . . . . . . . . . . . . . . . . . . . . . . . . . . 282 50.71Vested . . . . . . . . . . . . . . . . . . . . . . . . . . . . . . . . . . . . . . . . . . . . . . . . . . . . (567) 20.68Forfeited . . . . . . . . . . . . . . . . . . . . . . . . . . . . . . . . . . . . . . . . . . . . . . . . . . (64) 36.58
Restricted share awards outstanding at June 24, 2015 . . . . . . . . . . . . . . . 1,159 $38.44
At June 24, 2015, unrecognized compensation expense related to restricted share awards totaledapproximately $13.7 million and will be recognized over a weighted average period of 2.3 years. The fair valueof shares that vested during fiscal 2015, 2014, and 2013 totaled approximately $34.2 million, $42.2 million and$22.0 million, respectively.
12. SAVINGS PLAN
We sponsor a qualified defined contribution retirement plan covering all employees who have attained theage of twenty-one and have completed one year and 1,000 hours of service. Eligible employees are allowed tocontribute, subject to IRS limitations on total annual contributions, up to 50% of their base compensation and100% of their eligible bonuses, as defined in the plan, to various investment funds. We match in cash at a rate of100% of the first 3% an employee contributes and 50% of the next 2% the employee contributes with immediatevesting. In fiscal 2015, 2014, and 2013, we contributed approximately $8.0 million, $7.4 million, and$7.2 million, respectively.
13. SUPPLEMENTAL CASH FLOW INFORMATION
Cash paid for interest and income taxes is as follows (in thousands):
2015 2014 2013
Income taxes, net of refunds . . . . . . . . . . . . . . . . . . . . . . . . . $50,437 $48,379 $60,291Interest, net of amounts capitalized(a) . . . . . . . . . . . . . . . . . 26,190 25,476 41,504
(a) Fiscal 2013 interest includes $15.3 million of interest paid upon retirement of the 5.75%notes in June 2013.
Non-cash investing and financing activities are as follows (in thousands):
2015 2014 2013
Retirement of fully depreciated assets . . . . . . . . . . . . . . . . . . $40,775 $64,420 $55,427Dividends declared but not paid . . . . . . . . . . . . . . . . . . . . . . 18,132 17,250 15,263Accrued capital expenditures . . . . . . . . . . . . . . . . . . . . . . . . 4,109 15,703 9,854
F-34

14. COMMITMENTS AND CONTINGENCIES
In connection with the sale of restaurants to franchisees and brand divestitures, we have, in certain cases,guaranteed lease payments. As of June 24, 2015 and June 25, 2014, we have outstanding lease guarantees or aresecondarily liable for $98.9 million and $116.5 million, respectively. This amount represents the maximumpotential liability of future payments under the guarantees. These leases have been assigned to the buyers andexpire at the end of the respective lease terms, which range from fiscal 2016 through fiscal 2025. In the event ofdefault, the indemnity and default clauses in our assignment agreements govern our ability to pursue and recoverdamages incurred. No material liabilities have been recorded as of June 25, 2014, as the likelihood of default bythe buyers on the assignment agreements was deemed to be less than probable. Our secondary liability positionwill be reduced by approximately $19.0 million in the first quarter of fiscal 2016 related to the Pepper Diningacquisition. See Note 16 for additional disclosures related to the acquisition.
We provide letters of credit to various insurers to collateralize obligations for outstanding claims. As ofJune 24, 2015, we had $32.1 million in undrawn standby letters of credit outstanding. All standby letters of creditare renewable annually.
Evaluating contingencies related to litigation is a complex process involving subjective judgment on thepotential outcome of future events and the ultimate resolution of litigated claims may differ from our currentanalysis. Accordingly, we review the adequacy of accruals and disclosures pertaining to litigated matters eachquarter in consultation with legal counsel and we assess the probability and range of possible losses associatedwith contingencies for potential accrual in the consolidated financial statements.
In August 2004, certain current and former hourly restaurant team members filed a putative class actionlawsuit against us in California Superior Court alleging violations of California labor laws with respect to mealperiods and rest breaks, styled as Hohnbaum, et al. v. Brinker Restaurant Corp., et al. On August 6, 2014, theparties reached a preliminary settlement agreement, which remained subject to court approval, to resolve allclaims in exchange for a settlement payment not to exceed $56.5 million. On December 12, 2014, the courtgranted final approval of the settlement agreement. In February 2015, we funded the settlement in the amount of$44.0 million against our previously established reserve. We do not expect any further payments related to thismatter.
We are engaged in various other legal proceedings and have certain unresolved claims pending. Reserveshave been established based on our best estimates of our potential liability in certain of these matters. Based uponconsultation with legal counsel, Management is of the opinion that there are no matters pending or threatenedwhich are expected to have a material adverse effect, individually or in the aggregate, on our consolidatedfinancial condition or results of operations.
15. QUARTERLY RESULTS OF OPERATIONS (UNAUDITED)
The following table summarizes the unaudited consolidated quarterly results of operations for fiscal 2015and 2014 (in thousands, except per share amounts):
Fiscal Year 2015Quarters Ended
Sept. 24 Dec. 24 March 25 June 24
Revenues . . . . . . . . . . . . . . . . . . . . . . . . . . . . . . . . . . . . . . . . . . . . . $711,018 $742,898 $784,215 $764,147Income before provision for income taxes . . . . . . . . . . . . . . . . . . . $ 47,814 $ 58,744 $ 96,316 $ 81,403Net income . . . . . . . . . . . . . . . . . . . . . . . . . . . . . . . . . . . . . . . . . . . $ 32,738 $ 41,306 $ 65,427 $ 57,223Basic net income per share . . . . . . . . . . . . . . . . . . . . . . . . . . . . . . . $ 0.51 $ 0.65 $ 1.04 $ 0.94Diluted net income per share . . . . . . . . . . . . . . . . . . . . . . . . . . . . . . $ 0.49 $ 0.64 $ 1.02 $ 0.92Basic weighted average shares outstanding . . . . . . . . . . . . . . . . . . 64,668 63,590 62,891 61,132Diluted weighted average shares outstanding . . . . . . . . . . . . . . . . . 66,263 64,963 64,091 62,294
F-35

Fiscal Year 2014Quarters Ended
Sept. 25 Dec. 25 March 26 June 25
Revenues . . . . . . . . . . . . . . . . . . . . . . . . . . . . . . . . . . . . . . . . . . . . . $684,660 $705,662 $759,293 $759,880Income before provision for income taxes . . . . . . . . . . . . . . . . . . . $ 42,582 $ 57,713 $ 80,815 $ 35,178Net income . . . . . . . . . . . . . . . . . . . . . . . . . . . . . . . . . . . . . . . . . . . $ 29,212 $ 39,744 $ 56,263 $ 28,820Basic net income per share . . . . . . . . . . . . . . . . . . . . . . . . . . . . . . . $ 0.44 $ 0.59 $ 0.85 $ 0.44Diluted net income per share . . . . . . . . . . . . . . . . . . . . . . . . . . . . . . $ 0.42 $ 0.58 $ 0.82 $ 0.43Basic weighted average shares outstanding . . . . . . . . . . . . . . . . . . 66,693 66,811 66,479 65,009Diluted weighted average shares outstanding . . . . . . . . . . . . . . . . . 68,802 68,628 68,342 66,824
Net income for fiscal 2015 included a net gain of $2.8 million related to litigation which included antitrustlitigation settlement proceeds of $8.6 million, partially offset by a charge of $5.8 million to adjust our previousreserve estimate of final settlement amounts related to various litigation matters. We recorded a charge of $1.1million in the fourth quarter of fiscal 2015 for acquisition costs incurred prior to completing the acquisition of afranchisee which owns 103 Chili’s restaurants. Long-lived asset impairment of $0.7 million and $1.5 millionwere recorded in the second and fourth quarters, respectively. Additionally, net income included leasetermination charges of $0.9 million, $0.5 million and $0.5 million in the first, second and fourth quarters of fiscal2015 related to restaurants closed in the current year. Severance charges of $0.3 million and $0.9 million wereincurred in the second and fourth quarters of fiscal 2015.
Net income for fiscal 2014 included a $39.5 million charge in the fourth quarter to establish reserves for thepotential settlement of various litigation matters. Long-lived asset impairments of $1.3 million and $3.2 millionwere recorded in the second and fourth quarters, respectively. Additionally, net income included leasetermination charges of $0.2 million, $0.2 million, $0.9 million and $0.6 million in the four quarters of fiscal 2014related to restaurants closed in the current year and adjustments for prior year closures. Severance charges of$0.2 million, $0.2 million, $0.7 million and $1.0 million were incurred in the four quarters of fiscal 2014.
16. SUBSEQUENT EVENTS
On June 25, 2015, we completed the acquisition of Pepper Dining Holding Corp. (“Pepper Dining”), afranchisee of 103 Chili’s® Grill & Bar restaurants primarily located in the Northeast and Southeast United States.The purchase price of $106.5 million was funded with availability under our existing credit facility. The resultsof operations of these restaurants will be included in our consolidated financial statements from the date ofacquisition beginning in fiscal 2016. The acquired restaurants are expected to generate approximately $2.6million of average annual revenue per restaurant in fiscal 2016 which will be partially offset by the loss ofaverage annual royalty revenues of approximately $104,000 per restaurant. We are in the process of evaluatingthe fair value of the assets and liabilities acquired through internal studies and third-party valuations and expectto complete a preliminary purchase price allocation in the first quarter of fiscal 2016.
Subsequent to the end of the fiscal year, an additional $135.5 million was borrowed from the $750 millionrevolving credit facility primarily to fund the acquisition of Pepper Dining. Subsequent to the end of the fiscalyear, we repurchased 766,000 shares for approximately $44.0 million as part of our share repurchase program.We also repurchased approximately 74,000 shares for $4.1 million to satisfy team member tax withholdingobligations on the vesting of primarily performance shares.
On August 20, 2015, our Board of Directors declared a quarterly dividend of $0.32 per share effective withthe September 2015 dividend. Our Board of Directors also authorized an additional $250 million in sharerepurchases, bringing the total authorization to $4,185 million.
F-36

Report of Independent Registered Public Accounting Firm
The Board of Directors and ShareholdersBrinker International, Inc.:
We have audited the accompanying consolidated balance sheets of Brinker International, Inc. andsubsidiaries (the “Company”) as of June 24, 2015 and June 25, 2014, and the related consolidated statements ofcomprehensive income, shareholders’ (deficit) equity and cash flows for each of the years in the three-yearperiod ended June 24, 2015. These consolidated financial statements are the responsibility of the Company’smanagement. Our responsibility is to express an opinion on these consolidated financial statements based on ouraudits.
We conducted our audits in accordance with the standards of the Public Company Accounting OversightBoard (United States). Those standards require that we plan and perform the audit to obtain reasonable assuranceabout whether the financial statements are free of material misstatement. An audit includes examining, on a testbasis, evidence supporting the amounts and disclosures in the financial statements. An audit also includesassessing the accounting principles used and significant estimates made by management, as well as evaluatingthe overall financial statement presentation. We believe that our audits provide a reasonable basis for ouropinion.
In our opinion, the consolidated financial statements referred to above present fairly, in all material respects,the financial position of Brinker International, Inc. and subsidiaries as of June 24, 2015 and June 25, 2014, andthe results of their operations and their cash flows for each of the years in the three-year period ended June 24,2015, in conformity with U.S. generally accepted accounting principles.
We also have audited, in accordance with the standards of the Public Company Accounting Oversight Board(United States), Brinker International, Inc.’s internal control over financial reporting as of June 24, 2015, basedon criteria established in Internal Control—Integrated Framework-2013 issued by the Committee of SponsoringOrganizations of the Treadway Commission and our report dated August 24, 2015 expressed an unqualifiedopinion on the effectiveness of the Company’s internal control over financial reporting.
/s/ KPMG LLP
Dallas, TX
August 24, 2015
F-37

Report of Independent Registered Public Accounting Firm
The Board of Directors and ShareholdersBrinker International, Inc.:
We have audited Brinker International, Inc.’s (the “Company”) internal control over financial reporting asof June 24, 2015, based on criteria established in Internal Control—Integrated Framework-2013 issued by theCommittee of Sponsoring Organizations of the Treadway Commission (COSO). The Company’s management isresponsible for maintaining effective internal control over financial reporting and for its assessment of theeffectiveness of internal control over financial reporting, included in the accompanying Management’s Report onInternal Control Over Financial Reporting. Our responsibility is to express an opinion on the Company’s internalcontrol over financial reporting based on our audit.
We conducted our audit in accordance with the standards of the Public Company Accounting OversightBoard (United States). Those standards require that we plan and perform the audit to obtain reasonable assuranceabout whether effective internal control over financial reporting was maintained in all material respects. Ouraudit included obtaining an understanding of internal control over financial reporting, assessing the risk that amaterial weakness exists, and testing and evaluating the design and operating effectiveness of internal controlbased on the assessed risk. Our audit also included performing such other procedures as we considered necessaryin the circumstances. We believe that our audit provides a reasonable basis for our opinion.
A company’s internal control over financial reporting is a process designed to provide reasonable assuranceregarding the reliability of financial reporting and the preparation of financial statements for external purposes inaccordance with generally accepted accounting principles. A company’s internal control over financial reportingincludes those policies and procedures that (1) pertain to the maintenance of records that, in reasonable detail,accurately and fairly reflect the transactions and dispositions of the assets of the company; (2) provide reasonableassurance that transactions are recorded as necessary to permit preparation of financial statements in accordancewith generally accepted accounting principles, and that receipts and expenditures of the company are being madeonly in accordance with authorizations of management and directors of the company; and (3) provide reasonableassurance regarding prevention or timely detection of unauthorized acquisition, use, or disposition of thecompany’s assets that could have a material effect on the financial statements.
Because of its inherent limitations, internal control over financial reporting may not prevent or detectmisstatements. Also, projections of any evaluation of effectiveness to future periods are subject to the risk thatcontrols may become inadequate because of changes in conditions, or that the degree of compliance with thepolicies or procedures may deteriorate.
In our opinion, Brinker International, Inc. maintained, in all material respects, effective internal control overfinancial reporting as of June 24, 2015, based on criteria established in Internal Control—Integrated Framework-2013 issued by COSO.
We also have audited, in accordance with the standards of the Public Company Accounting Oversight Board(United States), the consolidated balance sheets of Brinker International, Inc. and subsidiaries as of June 24, 2015and June 25, 2014, and the related consolidated statements of comprehensive income, shareholders’ (deficit)equity, and cash flows for each of the years in the three-year period ended June 24, 2015, and our report datedAugust 24, 2015 expressed an unqualified opinion on those consolidated financial statements.
/s/ KPMG LLP
Dallas, TX
August 24, 2015
F-38

MANAGEMENT’S RESPONSIBILITY FOR THE CONSOLIDATED FINANCIAL STATEMENTS
Management is responsible for the reliability of the consolidated financial statements and related notes,which have been prepared in conformity with U. S. generally accepted accounting principles and includeamounts based upon our estimates and judgments, as required. The consolidated financial statements have beenaudited and reported on by our independent registered public accounting firm, KPMG LLP, who were given freeaccess to all financial records and related data, including minutes of the meetings of the Board of Directors andCommittees of the Board. We believe that the representations made to the independent registered publicaccounting firm were valid and appropriate.
We maintain a system of internal control over financial reporting designed to provide reasonable assuranceof the reliability of the consolidated financial statements. Our internal audit function monitors and reports on theadequacy of the compliance with the internal control system and appropriate actions are taken to address controldeficiencies and other opportunities for improving the system as they are identified. The Audit Committee of theBoard of Directors, which is comprised solely of outside directors, provides oversight to the financial reportingprocess through periodic meetings with our independent registered public accounting firm, internal auditors, andmanagement. Both our independent registered public accounting firm and internal auditors have free access tothe Audit Committee. Although no cost-effective internal control system will preclude all errors andirregularities, we believe our internal control over financial reporting as of and for the year ended June 24, 2015provide reasonable assurance that the consolidated financial statements are reliable.
MANAGEMENT’S REPORT ON INTERNAL CONTROL OVER FINANCIAL REPORTING
Management is responsible for establishing and maintaining adequate internal control over financialreporting. We have assessed the effectiveness of our internal control over financial reporting based on theframework in Internal Control—Integrated Framework-2013 issued by the Committee of SponsoringOrganizations of the Treadway Commission. Based on our assessment, we concluded that our internal controlover financial reporting was effective as of June 24, 2015.
Because of inherent limitations, internal control over financial reporting may not prevent or detectmisstatements. Also, projection of any evaluation of effectiveness to future periods are subject to the risk thatcontrols may become inadequate because of changes in conditions, or that the degree of compliance with thepolicies and procedures may deteriorate.
The effectiveness of our internal control over financial reporting as of June 24, 2015 has been audited byKPMG LLP, an independent registered public accounting firm, as stated in its attestation report which is includedherein.
/s/ WYMAN T. ROBERTS
WYMAN T. ROBERTSChief Executive Officer, President and President of Chili’s Grill & Bar
/s/ THOMAS J. EDWARDS, JR
THOMAS J. EDWARDS, JRExecutive Vice President and Chief Financial Officer
F-39

Exhibit 21
BRINKER INTERNATIONAL, INC., A DELAWARE CORPORATIONSUBSIDIARIES
BRINKER RESTAURANT CORPORATION, a Delaware corporationBRINKER INTERNATIONAL PAYROLL COMPANY, L.P., a Delaware limited partnership
BRINKER AIRPORTS, LLC, a Delaware limited liability companyBRINKER ALABAMA, INC., a Delaware corporationBRINKER ARKANSAS, INC., a Delaware corporation
BRINKER BRAZIL, LLC, a Delaware limited liability companyBRINKER CB, LP, a Texas limited partnership
BRINKER CB MANAGEMENT, LLC, a Delaware limited liability companyBRINKER CANADIAN HOLDING CO., ULC, a British Columbia unlimited liability company
BRINKER CANADIAN RESTAURANT CO., ULC, a British Columbia unlimited liability companyBRINKER FLORIDA, INC., a Delaware corporation
BRINKER FREEHOLD, INC., a New Jersey corporationBRINKER GEORGIA, INC., a Delaware corporation
BRINKER LOUISIANA, INC., a Delaware corporationBRINKER MEXICO SERVICES S DE R.L. DE C.V., a Mexico company
BRINKER MHC B.V., a Netherlands private companyBRINKER MICHIGAN, INC., a Delaware corporationBRINKER MISSISSIPPI, INC., a Delaware corporationBRINKER MISSOURI, INC., a Delaware corporation
BRINKER NEVADA, INC., a Nevada corporationBRINKER NEW JERSEY, INC., a Delaware corporation
BRINKER NORTH CAROLINA, INC., a Delaware corporationBRINKER OF BALTIMORE COUNTY, INC., a Maryland corporation
BRINKER OF CARROLL COUNTY, INC., a Maryland corporationBRINKER OF CECIL COUNTY, INC., a Maryland corporation
BRINKER OKLAHOMA, INC., a Delaware corporationBRINKER OPCO, LLC, a Delaware limited liability company
BRINKER PENN TRUST, a Pennsylvania business trustBRINKER PURCHASING, INC., a Delaware corporation
BRINKER SERVICES CORPORATION, a Florida corporationBRINKER TEXAS, INC., a Delaware corporation
BRINKER VIRGINIA, INC., a Delaware corporationCHILI’S BEVERAGE COMPANY, INC., a Texas corporation
CHILI’S, INC., a Delaware corporationCHILI’S, INC., a Tennessee corporation
CHILI’S INTERNATIONAL BASES, B.V., a Netherlands private companyCHILI’S OF BEL AIR, INC., a Maryland corporationCHILI’S OF KANSAS, INC., a Kansas corporation
CHILI’S OF MARYLAND, INC., a Maryland corporationCHILI’S OF WEST VIRGINIA, INC., a West Virginia corporation
MAGGIANO’S, INC., an Illinois corporationMAGGIANO’S BEVERAGE COMPANY, a Texas corporation
MAGGIANO’S HOLDING CORPORATION, a Delaware corporationMAGGIANO’S OF ANNAPOLIS, INC., a Maryland corporation
MAGGIANO’S OF HOWARD COUNTY, INC., a Maryland corporationMAGGIANO’S OF TYSON’S, INC., a Virginia corporation
MAGGIANO’S TEXAS, INC., a Delaware corporationPEPPER DINING HOLDING CORP., a Delaware corporation
PEPPER DINING, INC., a Delaware corporationPEPPER DINING VERMONT, INC., a Vermont corporation
R&R FOOD GROUP, INC., a Delaware corporationBIPC GLOBAL PAYROLL COMPANY, LLC, a Delaware limited liability company
BIPC MANAGEMENT, LLC, a Delaware limited liability companyBIPC ME DMCC, a Dubai Free-Zone company
BIPC INVESTMENTS, LLC, a Delaware limited liability companyBRINKER FAMILY FUND, INC., a Delaware non-profit corporation

Exhibit 23
Consent of Independent Registered Public Accounting Firm
The Board of Directors
Brinker International, Inc.:
We consent to the incorporation by reference in the Registration Statement Nos. 33-56491, 333-02201, 333-93755,333-42224, 333-105720, 333-125289, 333-157050 and 333-201929 on Form S-8; Registration Nos. 333-74902 and333-188252 on Form S-3; and Registration Statement No. 333-116879 on Form S-4 of Brinker International, Inc. ofour reports dated August 24, 2015, with respect to the consolidated balance sheets of Brinker International, Inc. andsubsidiaries as of June 24, 2015 and June 25, 2014, and the related consolidated statements of comprehensiveincome, shareholders’ (deficit) equity, and cash flows for each of the years in the three-year period ended June 24,2015, and the effectiveness of internal control over financial reporting as of June 24, 2015, which reports appear inthe 2015 annual report on Form 10-K of Brinker International, Inc.
/s/ KPMG LLP
Dallas, Texas
August 24, 2015
Exhibit 31(a)
CERTIFICATION
I, Wyman T. Roberts, certify that:
1. I have reviewed this Annual Report on Form 10-K of Brinker International, Inc.;
2. Based on my knowledge, this report does not contain any untrue statement of a material fact or omit to statea material fact necessary to make the statements made, in light of the circumstances under which suchstatements were made, not misleading with respect to the period covered by this report;
3. Based on my knowledge, the financial statements, and other financial information included in this report,fairly present in all material respects the financial condition, results of operations and cash flows of theregistrant as of, and for, the periods presented in this report;
4. The registrant’s other certifying officer(s) and I are responsible for establishing and maintaining disclosurecontrols and procedures (as defined in Exchange Act Rules 13a-15(e) and 15d-15(e)) and internal controlover financial reporting (as defined in Exchange Act Rules 13a-15(f) and 15d-15(f)) for the registrant andhave:
a. Designed such disclosure controls and procedures, or caused such disclosure controls and procedures tobe designed under our supervision, to ensure that material information relating to the registrant,including its consolidated subsidiaries, is made known to us by others within those entities, particularlyduring the period in which this report is being prepared;
b. Designed such internal control over financial reporting, or caused such internal control over financialreporting to be designed under our supervision, to provide reasonable assurance regarding thereliability of financial reporting and the preparation of financial statements for external purposes inaccordance with generally acceptable accounting principles;
c. Evaluated the effectiveness of the registrant’s disclosure controls and procedures and presented in thisreport our conclusions about the effectiveness of the disclosure controls and procedures, as of the endof the period covered by this report based on such evaluation; and
d. Disclosed in this report any change in the registrant’s internal control over financial reporting thatoccurred during the registrant’s most recent fiscal quarter (the registrant’s fourth fiscal quarter in thecase of an annual report) that has materially affected, or is reasonably likely to materially affect, theregistrant’s internal control over financial reporting; and
5. The registrant’s other certifying officer(s) and I have disclosed, based on our most recent evaluation ofinternal control over financial reporting, to the registrant’s auditors and the audit committee of theregistrant’s board of directors (or persons performing the equivalent functions);
a. All significant deficiencies and material weaknesses in the design or operation of internal control overfinancial reporting which are reasonably likely to adversely affect the registrant’s ability to record,process, summarize and report financial information; and
b. Any fraud, whether or not material, that involves management or other employees who have asignificant role in the registrant’s internal control over financial reporting.
Dated: August 24, 2015
/S/ WYMAN T. ROBERTS
Wyman T. Roberts,Chief Executive Officer & President and President ofChili’s Grill & Bar(Principal Executive Officer)

Exhibit 31(b)
CERTIFICATION
I, Thomas J. Edwards, Jr., certify that:
1. I have reviewed this Annual Report on Form 10-K of Brinker International, Inc.;
2. Based on my knowledge, this report does not contain any untrue statement of a material fact or omit to statea material fact necessary to make the statements made, in light of the circumstances under which suchstatements were made, not misleading with respect to the period covered by this report;
3. Based on my knowledge, the financial statements, and other financial information included in this report,fairly present in all material respects the financial condition, results of operations and cash flows of theregistrant as of, and for, the periods presented in this report;
4. The registrant’s other certifying officer(s) and I are responsible for establishing and maintaining disclosurecontrols and procedures (as defined in Exchange Act Rules 13a-15(e) and 15d-15(e)) and internal controlover financial reporting (as defined in Exchange Act Rules 13a-15(f) and 15d-15(f)) for the registrant andhave:
a. Designed such disclosure controls and procedures, or caused such disclosure controls and procedures tobe designed under our supervision, to ensure that material information relating to the registrant,including its consolidated subsidiaries, is made known to us by others within those entities, particularlyduring the period in which this report is being prepared;
b. Designed such internal control over financial reporting, or caused such internal control over financialreporting to be designed under our supervision, to provide reasonable assurance regarding thereliability of financial reporting and the preparation of financial statements for external purposes inaccordance with generally acceptable accounting principles;
c. Evaluated the effectiveness of the registrant’s disclosure controls and procedures and presented in thisreport our conclusions about the effectiveness of the disclosure controls and procedures, as of the endof the period covered by this report based on such evaluation; and
d. Disclosed in this report any change in the registrant’s internal control over financial reporting thatoccurred during the registrant’s most recent fiscal quarter (the registrant’s fourth fiscal quarter in thecase of an annual report) that has materially affected, or is reasonably likely to materially affect, theregistrant’s internal control over financial reporting; and
5. The registrant’s other certifying officer(s) and I have disclosed, based on our most recent evaluation ofinternal control over financial reporting, to the registrant’s auditors and the audit committee of theregistrant’s board of directors (or persons performing the equivalent functions);
a. All significant deficiencies and material weaknesses in the design or operation of internal control overfinancial reporting which are reasonably likely to adversely affect the registrant’s ability to record,process, summarize and report financial information; and
b. Any fraud, whether or not material, that involves management or other employees who have asignificant role in the registrant’s internal control over financial reporting.
Dated: August 24, 2015
/S/ THOMAS J. EDWARDS, JR.
Thomas J. Edwards, Jr.Executive Vice President and Chief Financial Officer(Principal Financial Officer)

Exhibit 32(a)
CERTIFICATION
Pursuant to 18 U.S.C. Section 1350, the undersigned officer of Brinker International, Inc. (the “Company”),hereby certifies that the Company’s Annual Report on Form 10-K for the year ended June 24, 2015 (the“Report”) fully complies with the requirements of Section 13(a) or 15(d), as applicable, of the SecuritiesExchange Act of 1934 and that the information contained in the Report fairly presents, in all material respects,the financial condition and results of operations of the Company.
Dated: August 24, 2015
By: /s/ WYMAN T. ROBERTS
Name:Title:
Wyman T. Roberts,Chief Executive Officer & President andPresident of Chili’s Grill & Bar (PrincipalExecutive Officer)
Exhibit 32(b)
CERTIFICATION
Pursuant to 18 U.S.C. Section 1350, the undersigned officer of Brinker International, Inc. (the “Company”),hereby certifies that the Company’s Annual Report on Form 10-K for the year ended June 24, 2015 (the“Report”) fully complies with the requirements of Section 13(a) or 15(d), as applicable, of the SecuritiesExchange Act of 1934 and that the information contained in the Report fairly presents, in all material respects,the financial condition and results of operations of the Company.
Dated: August 24, 2015
By: /s/ THOMAS J. EDWARDS, JR.
Name:Title:
Thomas J. Edwards, Jr.Executive Vice President and Chief FinancialOfficer (Principal Financial Officer)

BOARD OF DIRECTORS
Elaine M. Boltz Senior Vice President, E-Commerce The TJX Companies, Inc.
Joseph M. DePinto Chairman of the Board, Brinker International, Inc. President and Chief Executive Officer 7-Eleven, Inc.
Harriet Edelman Vice Chairman Emigrant Bank
Michael A. GeorgePresident and Chief Executive Officer QVC, Inc.
William T. GilesChief Financial Officer and Executive Vice President, Finance, Information Technology and Store Development AutoZone
Gerardo I. LopezPresident and Chief Executive Officer Extended Stay America, Inc. and ESH Hospitality, Inc.
Jon L. Luther Retired Chairman of the Board Dunkin' Brands
George R. Mrkonic Non Executive Chairman Paperchase Products Limited, London, UK
Rosendo G. Parra Retired Senior Vice President Dell, Inc.
Jose Luis Prado Retired President Quaker Oats North America, a division of PepsiCo, Inc.
Wyman T. RobertsChief Executive Officer and President and President of Chili's Grill & Bar Brinker International, Inc.
PRINCIPAL OFFICERS Wyman T. Roberts Chief Executive Officer and President and President of Chili's Grill & Bar
Tony A. BridwellSenior Vice President and Chief People Officer
David R. Doyle Senior Vice President and Chief Information Officer
Thomas J. Edwards, Jr.Executive Vice President and Chief Financial Officer
Krista GibsonSenior Vice President and Chief Marketing Officer for Chili's Grill & Bar
Scarlett May Senior Vice President, General Counsel and Secretary
Homero Ortegon Senior Vice President of Strategic Innovation
Marie L. PerrySenior Vice President, Treasurer and Controller
Steve D. Provost Senior Vice President and President of Maggiano's Little Italy
Roger F. Thomson Executive Vice President, Chief Development Officer
Kelli A. Valade Executive Vice President and Chief Operating Officer for Chili's Grill & Bar
SHAREHOLDER INFORMATION
Executive Offices Brinker International, Inc. 6820 LBJ Freeway Dallas, TX 75240 (972) 980-9917
Annual Meeting Thursday, October 29, 2015 at 9:00 a.m. Brinker International, Inc. The Play Room in Building C 6700 LBJ Freeway Dallas, TX 75240
Independent Public Accountants KPMG LLP 717 N. Harwood, Suite 3100 Dallas, TX 75201
NYSE Symbol: EAT
Stock Transfer Agent And Registrar Computershare 250 Royall St. Canton, MA 02021 Customer Service (800) 213-5156 TDD for Hearing Impaired (800) 231-5469 Foreign Shareowners (201) 680-6578 You can now access your Brinker Shareholder Account online via Investor Centre at www.computershare.com
10-K Availability The company will furnish to any shareholder, without charge, a copy of the company's annual report filed with the Securities andExchange Commission on Form 10-K for the 2015 fiscal year from our website at: www.brinker.com or upon written request from the shareholder.
Please send your written request to: Secretary/Investor Relations Brinker International, Inc. 6820 LBJ Freeway Dallas, TX 75240
CEO/CFO Certifications On November 17, 2014, the company submitted its annual Section 303A CEO certification to the New York Stock Exchange. The company also filed the CEO and CFO certifications required under Section 302 of the Sarbanes-Oxley Act of 2002 with the Securities and Exchange Commission as exhibits to its Annual Report on Form 10-K for the year ended June 24, 2015.
Chili's® Grill & Bar and Maggiano's Little Italy® are registered and/or proprietary trademarks of Brinker International Payroll Company, L.P.
B R I N K E R INTERN ATI ON AL ®
6820 LBJ Freeway, Dallas, TX 75240 • www.brinker.com