2015 annual report - dnrec alpha de nps ann… · 2015 annual report – nps program to meet clean...
TRANSCRIPT


2 | P a g e Delaware NPS Program
2015 Annual Report
The Delaware Nonpoint Source Program administers a competitive grant made possible through
Section 319 of the Clean Water Act. The grant provides funding for projects designed to reduce
nonpoint source (NPS) pollution in Delaware. NPS pollution may be defined as any pollution
that originates from a diffuse source (such as an open field or a road) and is transported to
surface or ground waters through leaching or runoff. Reduction of NPS pollution may often be
achieved through incorporation of specific best management practices (BMPs) into project
workplans. Projects may target any source of NPS pollution, but most frequently involve
agriculture, silviculture, construction, marinas, septic systems, and hydromodification activities.
In addition to funding projects that achieve reductions in NPS pollution, the Delaware NPS
Program is committed to addressing the issue through educational programs, publications, and
partnerships with other organizations working to reduce NPS pollution in Delaware.
Program Staff:
Marcia Fox, Program Manager
Sharon Webb, Environmental Scientist
Mark Hogan, Planner
James Sullivan, Planner
Brenda Zeiters, Administrative Specialist
Published and Distributed by the:
Delaware Nonpoint Source Program
DNREC Division of Watershed Stewardship
89 Kings Highway
Dover, DE 19901
Telephone: (302) 739-9922
Fax: (302) 739-8017

3 | P a g e Delaware NPS Program
2015 Annual Report
Table of Contents
Preface............................................................................................................................................. 4
I. The Delaware NPS Program ................................................................................................ 5
II. NPS Program Funding ......................................................................................................... 5
III. Delaware NPS Issues ........................................................................................................... 6
IV. Vision and Mission .............................................................................................................. 7
V. Executive Summary ............................................................................................................. 8
VI. Watersheds ......................................................................................................................... 11
Chesapeake Bay ......................................................................................................... 11
St. Jones River ........................................................................................................... 15
Inland Bays ................................................................................................................ 19
Broadkill River........................................................................................................... 23
Appoquinimink River ................................................................................................ 26
Christina Basin ........................................................................................................... 29
VII. Load Reductions ................................................................................................................ 34
VIII. Future Changes and Challenges ......................................................................................... 34
IX. List of Partner Organizations/Committee Members .......................................................... 37
Appendix ....................................................................................................................................... 38
Appendix A – 2015 Milestones ................................................................................................ 39
Appendix B – Annual Nutrient reductions for N & P .............................................................. 43
Appendix C – Annual Numeric Milestones .............................................................................. 45
Appendix D – Water Quality Trend Data ................................................................................. 46
Appendix E – Bridgeville Branch fact sheet............................................................................. 58
Appendix F – Air Seeder Summary .......................................................................................... 59
Appendix G – Air Seeder Fact Sheet ........................................................................................ 61
Appendix H - Mirror Lake Restoration Fact Sheet ................................................................... 62

4 | P a g e Delaware NPS Program
2015 Annual Report
Preface
The 2015 Delaware NPS Report is developed by the Delaware Department of Natural Resources
and Environmental Control (DNREC) to meet a grant condition that appears in each annual
319(h) Grant award to the State of Delaware from the US Environmental Protection Agency.
This programmatic condition in the award states:
The report shall contain the following:
A brief summary of progress in meeting the schedule of milestones in the approved
Management Program, and,
Reductions in nonpoint source pollutant loading and improvements in water quality that
has resulted from implementation of the Management Program.
Descriptions of priority Watershed Based Plan accomplishments. Accomplishments
should be based on the implementation milestone goals/objectives as identified in each
priority plan. The goal information can be displayed in the form of a watershed
goal/accomplishment chart showing percent achieved, supplemented by a short narrative
that should give the reader a clear understanding of the actions being taken and the
outputs and outcomes which are occurring from the actions. If monitoring was
completed, a summary of that information should also be included. For example, if 1000
feet of streambank stabilization was completed, then how does that compare to the needs
identified in the watershed based plan i.e. what percent of streambank stabilization was
completed compared to the overall needs as identified by the plan. Similar comparisons
should also be provided for each significant pollutant load reduction
What is Nonpoint Source Pollution?
Nonpoint source (NPS) pollution is defined as polluted stormwater runoff associated with
rainfall, snowmelt or irrigation water moving over and through the ground. As this water moves,
it picks up and carries pollutants with it, such as sediments, nutrients, toxics, and pathogens.
These pollutants eventually reach lakes, rivers, wetlands, coastal waters and ground waters of
Delaware
NPS pollution is associated with a variety of activities on the land including farming, logging,
urban/construction runoff, onsite sewage systems, streambank degradation, shore erosion and
others. For example, stormwater flowing off the land carries the nutrients nitrogen and
phosphorus into local streams, rivers and ponds. Under natural conditions, this is beneficial up to
a point. However, if excessive nutrients enter these water bodies they cause nuisance algae
blooms, then these nutrients are deemed pollutants.
The pollution contributed by nonpoint sources is the main reason why many of Delaware’s
waters are considered “impaired.” Impaired waters are those waters that do not meet Water
Quality Standards for designated uses (e.g., fishing, swimming, drinking water, shellfish
harvesting, etc.). Progress in managing NPS pollution in Delaware is represented in this report.
It was produced by the Department of Natural Resources and Environmental Control (DNREC)

5 | P a g e Delaware NPS Program
2015 Annual Report
– NPS Program to meet Clean Water Act, Section 319(h) Grant conditions and to demonstrate
consistency with three essential elements:
1. EPA Strategic Plan Goal 2 – Protecting America’s Waters
2. EPA Strategic Objective 2.2 – Protect and Restore Watersheds and Aquatic Ecosystems
3. Work plan commitments plus time frame (overall progress is reported in this document)
I. The Delaware NPS Program
As part of the Delaware Department of Natural Resources and Environmental Control, the
Delaware NPS Program is committed to addressing the issue of nonpoint sources pollution as it
affects Delaware’s numerous waterbodies. Efforts will include grant funding, education,
outreach, and partnerships with other organizations working together to reduce nonpoint source
pollution in Delaware.
II. NPS Program Funding
Nonpoint Source (NPS) pollution constitutes the nation’s largest source of water quality
problems. Approximately 40 percent of the United States rivers, lakes, and estuaries surveyed to
date are not clean enough to meet basic uses such as fishing or swimming due to NPS pollution.
To counter the ever expanding NPS problem, Congress established the NPS Pollution
Management Program under Section 319 of the Clean Water Act (CWA) in 1987. This program
provides states with grants to implement NPS pollution controls to achieve goals that are
described in NPS pollution management program plans.
On August 4, 1988, Delaware’s original (NPS) Program was approved by the Environmental
Protection Agency (EPA) making it one of the first programs in the nation to comply with
Section 319 of the CWA. Using CWA Section 319 funding, Delaware’s NPS Program
administers a competitive grant program. The grant provides funding for projects designed to
reduce NPS pollution in Delaware’s impaired waterbodies. Reduction of NPS pollution is most
often achieved through incorporation of specific best management practices (BMPs) into project
workplans. Whenever possible, funds are focused in sub-watersheds where NPS control
activities are likely to have the greatest positive impact. Funded restoration activities are
implemented using the most effective measures and practices available in order to achieve water
quality improvements. Eligible types of management program implementation activities include
the following:
Non-regulatory NPS reduction programs
Technical assistance
Financial assistance
Education
Training

6 | P a g e Delaware NPS Program
2015 Annual Report
Technology transfer
Demonstration projects
Proposals are requested annually, reviewed, evaluated and prioritized, and those which are
determined to meet specified requirements are eligible for funding. At least 40 percent of the
overall project cost must be represented by non-federal matching funds.
III. Delaware NPS Issues
More than 90 percent of Delaware's waterways are considered impaired. The state's list of
impaired waters, filed with the EPA, includes 377 bodies of water that suffer from 11 different
impairments, the most common of which are NPS related pollutants including pathogens and
nutrients (nitrogen and phosphorus). Most impairments come from nonpoint sources, which are
harder to control. As Delaware is a groundwater driven state, removing NPS pollutants become
an even harder problem to solve. Due to the rate of groundwater travel through the system, many
NPS pollutants entering the systems up to 30 years ago are just now entering surface water
bodies today. As such, the effectiveness of current agricultural BMPs will not be realized until
much further in the future.
"Impaired waters" are polluted waters. More technically, they are waters that do not meet water-
quality standards for their designated uses, such as recreation, fishing, or drinking. Impaired
waters could be suffering from excess nutrients, low dissolved oxygen, toxins, bacteria, heat, or
any combination of these problems.
Reduction of nonpoint sources of pollution is achieved through the incorporation or installation
of specific best management practices (BMPs) addressing agriculture, silviculture, construction,
septic systems, and hydromodification activities. To encourage and support the BMP installation,
the NPS Program administers a competitive grant program currently made possible through
Section 319 of the Clean Water Act. While this federal financial support has proven successful in
complementing Delaware’s NPS efforts, the NPS Program is currently seeking additional
finances to expand our activities to more systematically address Delaware’s NPS concerns.
Additional roles and responsibilities of the NPS Program include geospatial BMP tracking and
reporting, management of the agricultural State Revolving Fund Program, support for developing
Pollution Control Strategies, and watershed plan development and/or coordination.

7 | P a g e Delaware NPS Program
2015 Annual Report
IV. Vision and Mission
The Department of Natural Resources and Environmental Control envisions a Delaware that
offers a healthy environment where people include a commitment to the protection, enhancement
and enjoyment of the environment in their daily lives; where Delawareans’ stewardship of
natural resources ensures the sustainability of these resources for the appreciation and enjoyment
of future generations; and where people recognize that a healthy environment and a strong
economy support one another.
It's the mission of the Delaware Department of Natural Resources and Environmental Control to
protect and manage the state's vital natural resources, protect public health and safety, provide
quality outdoor recreation and to serve and educate the citizens of the First State about the wise
use, conservation and enhancement of Delaware's Environment.
The Nonpoint Source Management Program is a dynamic and open-ended program intended to
facilitate and promote statewide efforts to manage nonpoint source pollution. The following
priorities will guide this program:
1. The NPS Program will support the identification and quantification of those problems
that are caused specifically by nonpoint source pollution through assessment updates.
2. The NPS Program will be implemented and updated to realistically reduce nonpoint
source pollution in a cost-effective manner.
3. The NPS Program will address nonpoint source pollution through a program that
balances education, research, technical assistance, financial incentives, and regulation.
4. The NPS Program will follow a non-degradation policy in areas where surface and
ground waters meet state water quality standards and a policy to realistically improve
water quality in areas that do not meet these standards.
5. The NPS Program will continue to use the coordinated approach for implementation and
maintain an open ended framework to incorporate new initiatives and support interactive
approaches based on the effectiveness of existing policies and implementation
mechanisms.
6. The NPS Program will support the development and implementation of Watershed
Restoration Action Strategies (WRAS)/Pollution Control Strategies (PCS) for watersheds
of identified impaired or threatened waters in accordance with the Unified Watershed
Assessment List.
In Delaware, the lead agency for the development and implementation of the Nonpoint Source
(NPS) 319 Program is the Department of Natural Resources and Environmental Control
(DNREC), Division of Watershed Stewardship.

8 | P a g e Delaware NPS Program
2015 Annual Report
V. Executive Summary
Nonpoint source pollution continues to be, and is recognized as, the largest remaining source of
water quality impairments in the State. The cumulative impact of agricultural and urban
development and associated nutrient input has degraded water quality and habitat. As a result,
Delaware's NPS Program promotes statewide efforts to manage nonpoint source pollution. Six
priority watersheds (Chesapeake, Christina Basin, Appoquinimink River, Broadkill River, Inland
Bays, and St. Jones River), which comprise of 976,040 acres (1,525 square miles), focus the
State’s efforts for nonpoint source pollution abatement.
This annual report documents the activities and highlights of the State of Delaware, Nonpoint
Source (NPS) Program during the 2015 calendar year. It also fulfills the requirements of Section
319 of the federal Clean Water Act. DNREC’s NPS Program annually prepares this report to
inform stakeholders on the state’s progress in the area of nonpoint source water pollution
abatement. Although this report should not be considered a complete enumeration of all nonpoint
source activities, it describes the most important features and accomplishments of Delaware’s
Nonpoint Source Program.
In 2015, the Delaware NPS Program continues to decrease pollutant loads by achieving
milestone targets to achieve water quality in the First State. These milestones call for the
increased implementation of numerous nonpoint source best management practices, while
decreasing nitrogen and phosphorus loads to receiving waterbodies. This report relates several
accomplishments during calendar year 2015 that support long-term and short-term milestones
(Appendix A) identified in the State’s NPS Management Program. Milestone activities
successfully implemented during 2015 to support and/or enhance the program include grant
funding, education and outreach, and partnerships with other organizations working together
to reduce nonpoint source pollution in Delaware.
Grant Funding
During 2015, DNREC received $1,907,844, in federal section 319(h) grant funds, to implement
Delaware’s Nonpoint Source (NPS) Program. The framework for Delaware’s NPS Program is
detailed in the NPS Management Plan, which reflects the current goals and direction of the NPS
Program. Provisions of the approved plan effectively guide Delaware’s implementation of state
and local nonpoint source management measures and activities through 2019. Funded projects
completed during the calendar year, included implementing best management practices, resulted
in the following pollutant load reductions: nitrogen 2,214,361 pounds/year and phosphorus
96,187 pounds/year. A detailed table of nutrient reductions can be found in Appendix B.
Delaware continues to ensure that projects funded with CWA Section 319 dollars make progress
towards restoring or protecting waters impaired by nonpoint source pollution. Other key
highlights of Pollutant Reduction Controls, Practices, and Actions in 2015 are listed below and
can also be found in Appendix C.
Project highlights, in the 2015 NPS Annual Report, include the following:

9 | P a g e Delaware NPS Program
2015 Annual Report
Soil and Water Conservation District, Conservation Planners - District Planners work
with area farmers to encourage the installation of agriculture best management practices
and partner with the USDA’s Natural Resources Conservation Service in developing
conservation plans, nutrient management plans, and Environmental Quality Incentive
Program (EQIP) contracts. Efforts are focused in priority watersheds that have approved
Watershed Plans. The efforts of the Conservation Planners are represented on a
watershed scale in the table below.
Nutrient Relocation Program - Statewide, the Nutrient Relocation Program accounted
for the transportation of 54,102 tons of poultry manure out of priority watersheds. The
NPS Program supported $100,000 (approximately 3,531 tons) through CWA Section 319
funding.
Wetland and Stream Restoration Projects – DNREC initiated wetland and channel
restoration projects, implementing 10 water control structures and restoring over 450
acres of habitat.
Stream & Corridor Enhancement Program - During 2015, the second and final phase
of 3,675 feet of stream restoration was completed along the upper Christina River
located west of downtown Newark in the Timber Creek, West Branch and Christianstead
subdivisions.
Delaware Conservation Reserve and Enhancement Program (CREP) - A total of 20
expiring CRP and CREP contracts were enrolled in the Conservation Reserve
Enhancement Program in Delaware totaling 152 acres. The CREP coordinator developed
51 plans and contracts for 1,129 acres and conducted 66 field spot checks representing
over 1259 acres of CREP contracts.
The 2015 efforts of NPS efforts are represented in the table below:
Pollutant Controls, Practices, and
Actions implemented from 319 grant
funding
Unit 2015 Cumulative
Progress
Cover Crop (traditional and
commodity) acres 71,701
Nutrient Relocation (net export from
watershed) tons 54,102
Nutrient Management acres 113,312
Tree Planting acres 57
Rain Garden structures 5
Stream Restoration feet 4,375
Education and Outreach
On September 16, 2015, DNREC and the Delaware Chapter of the American Water Resources
Association hosted a walking field tour of the Silver Lake Park, located in Dover, DE. The tour
highlighted various projects that have been implemented in the park, including: a regenerative

10 | P a g e Delaware NPS Program
2015 Annual Report
stormwater conveyance system, a fish ladder that was the result of a mitigation project, the
installation of a riparian buffer, the USGS Water Quality Monitoring Station, Mirror Lake
remediation and restoration, and finally the maintenance of Mirror Lake’s plants that were a part
of the restoration project. The walking tour was a resounding success and maxed out attendance
with 35 participants.
Partnerships
In addition to the competitive grants program, DE NPS Program works with other organizations
on nonpoint source abatement projects. Some of these projects are carried out by NPS staff and
others by partner organizations. In 2015, DE NPS Program assisted with Delaware’s Cropland
Transect Survey. DNREC (Watershed Assessment and Management Section and Nonpoint
Source Program), Delaware Department of Agriculture, University of Delaware Cooperative
Extension, Natural Resource Conservation Service (NRCS), Farm Service Agency (FSA), New
Castle Conservation District, Kent Conservation District, and Sussex Conservation District
partnered together to conduct a statewide cropland transect survey. This survey allows for the
collection of cropland observation data over the course of the entire cropping system. Delaware
began this survey in 2014, and it served as the first update to the state’s conservation tillage
practice database since 2004. New in 2015, the survey incorporated cover crop observations. In
2015 cover crop observation percentages varied from county to county; however, the greatest
numbers of cover crop observations were found in Kent County, where almost half (49.0%) of
all cropland observations incorporated a cover crop. In New Castle County, 29.1% of cropland
observations had cover crop systems in place, and 36.1% of observations in Sussex County
incorporated cover crops. These observations help to supplement the cost-shared cover crop data
received from agricultural partners that may not incorporate voluntary or traditional cover crops.
In summary, Delaware’s NPS Program has strongly supported and promoted the collaborative
efforts of state, federal, and local agencies as well as private organizations in order to achieve
nonpoint source reduction goals. The Delaware NPS Program is committed to implementing an
environmentally sensitive program which focuses on the attainment of water quality goals on a
watershed level by using a balanced approach of education, research, technical and financial
assistance, and regulation.

11 | P a g e Delaware NPS Program
2015 Annual Report
VI. Watersheds
Chesapeake Bay
Location: The Chesapeake Bay Watershed includes land area within Delaware, the District of
Columbia, Maryland, New York,
Pennsylvania, Virginia, and West
Virginia. The portion of the
Chesapeake Drainage within
Delaware makes up about 1% of the
land area within the entire
Chesapeake Bay Watershed. The
watersheds that make up the
Chesapeake Drainage in Delaware
encompass a 451,268 acre area of
land in all three of Delaware’s
counties. The Chesapeake makes up
approximately 10% of New Castle
County, 33% of Kent County, and
50% of Sussex County.
The headwater streams and rivers that
originate in Delaware all ultimately
drain to the Eastern Shore of the
Chesapeake. These streams include,
from north to south: Elk Creek, Perch
Creek, the C&D Canal, Bohemia
Creek, Sassafras River, Chester River,
Choptank River, Marshyhope Creek,
Nanticoke River, Gum Branch,
Gravelly Branch, Deep Creek, Broad
Creek, Wicomico River, and
Pocomoke River.
Goal: Current goals call for the
increased implementation of numerous nonpoint source best management practices, especially in
the agriculture sector (see below for a highlight of key numeric targets). The milestones allow
jurisdictions the opportunity to adapt implementation strategies as necessary to meet the goals
and achieve the Total Maximum Daily Load (TMDL) standard. Delaware’s milestone
commitments are to annually reduce nitrogen by 3,429,386 pounds, phosphorus by 283,228
pounds and sediment by 60,605,240 pounds by the end of 2017, compared to the 2009 baseline.
Impairment: TMDLs were developed by DNREC in response to data collected from water
quality monitoring. The data indicated that numerous streams within the Chesapeake Bay

12 | P a g e Delaware NPS Program
2015 Annual Report
Watershed were impaired; they do not meet Delaware’s Water Quality Standards for dissolved
oxygen, or meet target concentrations for nitrogen or phosphorus.
Implementation: The information presented within this section is drawn from Milestone
reporting made available to the Chesapeake Bay Program for 2015. The Milestone data is
necessary to demonstrate efforts and actions towards progress with the Phase II Chesapeake Bay
Watershed Implementation Plan (WIP). As the WIP reporting criteria is more detailed and up to
date, it’s inclusion within this document is warranted.
Table 1. 2015 (Section 319) annual activities within the Chesapeake Bay Watershed.
319 Projects Grant Year Status 319 Funds
Ecological Restoration FY2011 Complete $15,785
Nutrient Management Planning FY2012 Complete $152,289
Nutrient Relocation FY2012 Complete $17,915
CREP Acres (Salary for Coordinator) FY2013 Complete $60,000 (statewide)
Table 2. 2015 Chesapeake Bay annual milestone data* and annual load reductions based upon
direct funding or leveraged funding associated with the NPS Program.
*Progress information includes annual progress data provided to the Chesapeake Bay Program
Pollutant Controls,
Practices, and ActionsUnit
2015
Chesapeake Bay
Progress
Cumulative
Progress
2015
Watershed
Plan Goal
% Goal
Achieved
Practice and N Load
Reductions (lbs/year)
Practice and P Load
Reductions (lbs/year)
Cover Crop (traditional
and commodity)acres 59,531 Annual 36,809 162% 820,559.0 2,342.4
Nutrient Relocation (net
export from watershed)tons 35,063 Annual 40,000 88% 896,765.1 58,441.0
Nutrient Management acres 103,423 Annual 163,500 63% 313,621.6 22,340.1
Tree Planting acres 57 561 520 108% 2,618.0 82.0
Rain Garden structure 1 818 826 99% 2.0 1.5
Stream Restoration feet 700 2,119 1,600 132% 121.5 110.2
2,033,687.2 83,317.1 Total Reductions

13 | P a g e Delaware NPS Program
2015 Annual Report
Table 3: Subset of water quality monitoring stations, collected in the Chesapeake Bay from 2004
to present, show the following trends, also see Appendix D:
Additional Implementation Activities in the Chesapeake Bay Watershed:
Bridgeville Branch Tax Ditch Stream Restoration: DNREC and Sussex Conservation District
embarked on the Bridgeville Branch Tax Ditch Stream Restoration project in 2015. The project
focused on restoration of a man-made tax ditch to a natural design that benefits wildlife. The
project includes a +1,600 linear foot stretch of the Bridgeville Branch Tax Ditch between N.
Cannon Street and N. Main Street in Bridgeville, Delaware. The innovative design provides
assessments of both vertical and lateral migration of the channel, while maintaining design
capacities, protection of sanitary sewer lines crossing adjacent to the Tax Ditch and improvement
of water quality. This project will remove nutrient amounts (lb/yr) of 121.5 nitrogen, 110.16
phosphorus & 401,760 total suspended solids. DNREC and partners will use this project as a
program initiative to educate staff on the construction methods and benefits of several stream
restoration green technologies. Funding for this project was supported by 21st century funds and
Chesapeake Bay Implementation Grant Funds. More information on the Bridgeville Branch
Restoration project is found in Appendix E.
Sussex Conservation District Air Seeder Program: In 2015, the Sussex Conservation District
purchased an air seeder to help farmers in the early establishment of cover crops and began a
pilot program in Sussex County. The equipment allows a farmer to plant cover crops while their
cash crop is still in the field. By planting early, the cover crop benefits from the longer growing
degree days during the summer, therefore getting a better established crop to improve water
quality and soil health.
The pilot program was
extremely successful
with the planting of
4,017.6 acres planted.
Total acres of planted
cover crops are up
21.3% this year
compared to last year
with a total of over
Station Watershed Station Location Total N
count
Total
N
Trend
Total N
Confidence
Total P
Count
Total
P
trend
Total P
Confidence TSS Count
TSS
Trend
TSS
Confidence
112021Chesapeake Drainage
System
Sewell Branch @ Sewell Branch Rd.
(Rd. 95)97 -0.062 95 102 -- --
101 0 --
207091 ChoptankCulbreth Marsh Ditch @ Shady
Bridge Rd. (Rd. 210)102 0.031 95 102 -- --
102 -0.09048 --
304591 Nanticoke RiverDeep Creek @ Old Furnace Rd. (Rd.
46)43 -0.007 90
43 1.162 98
302031 Marshyhope CreekMarshyhope Creek @ Fishers Bridge
Rd. (Rd. 308)185 -- -- 185 -- --
186 0 --
304151 Nanticoke RiverNanticoke River @ Buoy 66 (mouth
of DuPont Gut)97 -0.038 95 95 -- --
97 -0.216 --
304321 Nanticoke RiverWilliams Pond @ East Poplar St.
101 -0.063 80 100 -- --102 0 --

14 | P a g e Delaware NPS Program
2015 Annual Report
39,355 acres planted countywide. Especially notable was the 33.8% increase in cover crop acres
planted in the Chesapeake Bay Watershed in Sussex County. This increase can be attributed to
the District’s Soil Health outreach effort and the implementation of the air seeder. The
additional cover crop acres will help Delaware's farmers get increased nutrient load reductions in
the Chesapeake Bay Watershed Model. These reductions help Delaware work towards reducing
their nutrient and sediment loads as outlined in the Chesapeake Bay Watershed Implementation
Plan (WIP) and help meet Delaware’s Total Maximum Daily Loads (TMDL) goals and
milestones. More information on the air seeder program is found in Appendix F and a fact sheet
in Appendix G.
In early September, a WTOL-11 television news team from Toledo, Ohio came to Delaware and
Maryland to learn about what both states are doing to help improve water quality in the
Chesapeake Bay. They featured the air seeder during their visit to Delaware. They created a
three part series and the following link is part 2 How Delaware is Helping Clean Up the
Chesapeake Bay.

15 | P a g e Delaware NPS Program
2015 Annual Report
St. Jones River
Location: The St. Jones River Watershed is approximately 25.9 square mile (16,576 acres) and
is located in the central portion of Kent County. It is bounded on the south by the Murderkill
River Watershed, on the east by the Delaware Bay, on the north and northeast by the Leipsic
River and Little Creek Watersheds, and on the west by the Choptank River Watersheds. It drains
90 square miles of land. The major watercourse in the watershed is the St. Jones River which has
its headwaters in the western part of the county, about 22 miles upstream from the Delaware
Bay. Significant ponds in the
watershed are Silver Lake,
Moores Lake, and Wyoming
Lake. Flat wetlands, usually
forested, exist mostly in the
upper portion of the
watershed and eventually
drain into creeks and
streams. Nontidal riverine
wetlands and tidal wetlands
line the banks of the river,
sometimes up to 1/2 mile
wide toward the mouth of the
river. Wetlands comprise
9,669 acres of the watershed
and provide critical services
such as nutrient removal,
erosion control, habitat for
plants and wildlife, flood reduction, and storm water storage to the citizens of Delaware. The
extent to which wetlands can perform these functions and thrive in the future depends on their
health.
The St. Jones Watershed has the largest percentage of protected lands 5,236 acres with the River
Reserve totaling approximately 3,750 acres of the protected lands. The watershed land use is
dominated by agriculture (33%), followed by wetlands (25.5%), and residential lands (17.4%).
The impervious cover in the watershed is approximately 9.8% with a possible future impervious
cover of 23%. Between 2002 and 2007 agricultural lands decreased by 4% and residential lands
increased by 2.1%. Wetland slightly decreased by 0.7% as did forested land by 0.1%.
Goal: Limit pollutants to levels at or below the Total Maximum Daily Load (TMDL) values
specified in the regulation, i.e., an overall reduction of nitrogen and phosphorus in the waterways
by 40%, or 869.5 lbs per day for nitrogen and 63.4 pounds per day for phosphorus. Nonpoint
sources, must reduce total nitrogen from 838.5 lbs per day and total phosphorus from 52.9 lbs
per day (refer to Table 3). The TMDL also calls for 21.8 lbs per day reduction of nitrogen and
3.4 lbs per day from its stormwater (MS4) discharges. The designated uses for the St. Jones
River include primary recreation, secondary recreation, fish, aquatic life and wildlife, industrial
water supply, and agricultural water supply in freshwater segments.

16 | P a g e Delaware NPS Program
2015 Annual Report
Impairment: Delaware studies reviewed indicate the current condition of the watershed is of
degraded quality. Water quality samples have shown that the impairments (parameters) affect
approximately 35.6 miles of streams and 208 acres of ponds. These impairments are primarily
caused by nonpoint sources. Silver Lake and Moores Lake, both within the watershed, have been
impaired by planktonic algae. To date, data has not been provided for Wyoming Pond. Most, if
not all of the St. Jones River segments were listed as impaired by pollutants on Delaware’s
303(d) list. Impairments include dissolved oxygen (DO), nutrients, and bacteria.
Table 1: Land use impairments for the St. Jones River
Source
TN
(lbs/acre/yr)
TP
(lbs/acre/yr)
TN
(lbs/yr)
TP
(lbs/yr)
Area
Urban 10.24 1.25 196,596.15 23,998.55 19,198.40
Agriculture 13.19 1.25 284,740.78 26,984.53 21,587.63
Forest 6.51 0.05 31,611.88 242.79 4,855.89
Wetland 0.00 0.00 0.00 0.00 8,685.97
Water 0.00 0.00 0.00 0.00 1,550.99
Range 7.50 0.45 2,403.58 144.21 320.48
Other 7.50 0.45 10,642.90 638.57 1,419.05
Implementation: Projects that are implementing watershed plan goals are summarized below.
Most of the projects, using 319 Grant funds in 2015, have been in Silver Lake and Wyoming
Pond portion of the St. Jones River Watershed.
Table 2. 2015 (Section 319) annual activities within the St. Jones River Watershed
319 Projects Grant Year Status 319 Funds
Nutrient Management Planning FY2013, project 06 Complete $7,102

17 | P a g e Delaware NPS Program
2015 Annual Report
Table 3. 2015 St. Jones annual progress and annual load reductions based upon direct funding or
leveraged funding associated with the NPS Program.
Pollutant Controls,
Practices, and
Actions
Unit St. Jones
River
Practice and N
Load Reductions
(lbs/year)
Practice and P
Load
Reductions
(lbs/year)
Cover Crop
(traditional and
commodity)
acres 1,645
5,042.0
5.0
Nutrient Relocation
(net export from
watershed)
tons 522
3,151.7
205.4
Nutrient Management acres 3,181
2,145.0
56.0
Tree Planting acres 0 - -
Rain Garden structure 0
Stream Restoration feet 0
Total Reductions 10,338.7 266.4
Table 3: Subset of water quality monitoring stations, collected in the Saint Jones from 2004 to
present, show the following trends, also see Appendix D:
Progress Highlights: The following are specific examples of NPS Program funded projects that
occurred or finalized in 2015:
Station Watershed Station Location Total N
count
Total N
Trend
Total N
Confidence
Total P
Count Total P trend
Total P
Confidence TSS Count TSS Trend
TSS
Confidence
205011Saint Jones
River
St. Jones River @
mouth, Bowers Beach79 -0.076 98 80 -- --
82 -0.5981 --
205041Saint Jones
River
St. Jones River @
Barkers Landing105 -0.025 95 104 -- --
101 -2.113 95
205091Saint Jones
River
St. Jones River @ East
Lebanon Rd. (Rt. 10)100 -0.067 95 101 -- --
101 -1.491 98
205151Saint Jones
River
Fork Branch @ State
College Rd. (Rd. 69)92 -0.021 90 99 -0.003 80
99 -0.2912 98
205181Saint Jones
River
Moores Lake @ S. State
St. (Rd. 27)100 -- -- 101 0.001 95
101 -0.126 --
205191Saint Jones
River
Silver Lake @ Spillway
(Dover City Park) 104 -- -- 128 0.001 80 129 -0.1408 --
205211Saint Jones
River
Derby Pond @ Boat
Ramp (Rt. 13A)94 -- -- 99 0.001 95
99 0 --

18 | P a g e Delaware NPS Program
2015 Annual Report
1. Mirror Lake – The Mirror Lake project, finalized in December of 2013, involves
dewatering Mirror Lake, mixing activated carbon into the sediments to bind
contaminants, and constructing fringing wetlands to cap the contaminants. The project
reach is approximately 1,500 linear feet and lies within the park-like setting that borders
the St. Jones River. The restoration project will focus on the creation of a stable
conveyance and improved ecological diversity within Mirror Lake and along the banks of
the St. Jones.
The construction phase of the Mirror Lake Remediation & Restoration Project,
Watershed Remediation Hazardous Substance Release Site in Dover, ended December 5,
ahead of schedule and under budget. In all, 79 tons of SediMite (activated carbon pellets)
were applied to five (5) acres of lake and channel sediments in 10 days. Nine hundred
sixty-seven (967) cubic yards (1,325 tons) of sand were placed in Mirror Lake to create
the intertidal wetland; 62 tons of stone were placed in Mirror Lake to create two (2) rock
vane hydraulic control structures; and 760 linear feet of 16-inch diameter coir log, double
stacked, were place on the west bank of the lake to prevent erosion. Sixty-seven (67)
volunteers helped on the project. The Boot Camp Program, AmeriCorps, and the
Homeless Shelter contributed 770 hours of volunteer labor; and DNREC staff contributed
511 hours of labor. Sincere thanks go out to all volunteers, especially the Shoreline and
Waterways crew, for help with heavy equipment and bulk material transfer. The
remainder of the plantings, paid for by DE NPS program, on the new ¼ acre intertidal
wetland concluded in the spring 2015. More information on the Mirror Lake Restoration
Project can be found in Appendix G.
2015 Mirror Lake Updates:
Data collected immediately before and 1 year after activated carbon treatment showed….
78% reduction of dissolved PCB concentrations in the sediment pore water
72% reduction of dissolved PCB in the water column
60% reduction in total PCB in resident fish within Mirror Lake, determined
through fish tissue sampling. This reduction in 1 year would have taken
roughly 20 years if the water hadn’t been treated with activated carbon.
A new intertidal wetland was also successfully established with the planting of over
6,000 native plugs and shrubs.
Earth Day 2015, twelve volunteers replanted some areas around mirror lake that did not
survive from the original planting and filled in any gaps. The volunteers also maintained
control of any invasives.
September 2015 Delaware American Resources Association (DEAWRA) hosted a
walking tour of The Mirror Lake project. The tour highlighted various projects that have
been implemented in the park which included: a regenerative stormwater conveyance
system, a fish ladder that was the result of a mitigation project, the installation of a
riparian buffer, the USGS Water Quality Monitoring Station, Mirror Lake remediation

19 | P a g e Delaware NPS Program
2015 Annual Report
and restoration, and finally the maintenance of Mirror Lake’s plants that were a part of
the restoration project. The walking tour was a resounding success and maxed out
attendance with 35 participants.
Inland Bays
Location: The Inland Bays/Atlantic
Ocean Basin comprises approximately
313 square miles of eastern Sussex
County, Delaware. Starting at Lewes
and Cape Henlopen State Park at the
southern edge of the entrance to
Delaware Bay, the area extends
southward approximately 24 miles
along the Atlantic shoreline to the
Maryland State Line. It includes the
coastal towns of Rehoboth Beach,
Dewey Beach, Bethany Beach, South
Bethany Beach, and Fenwick Island.
State Route 1 (SR 1) extends parallel
to the shoreline and connects the
towns.
The three inland bays are located just landward of the Atlantic Ocean shoreline. From north to
south, these are Rehoboth Bay, Indian River Bay, and Little Assawoman Bay. Rehoboth Bay
contains the Lewes-Rehoboth Canal and Rehoboth Bay Watershed; the Indian River Bay
contains the Indian River, Iron Branch, and Indian River Bay Watersheds; and the Little
Assawoman Bay contains the Little Assawoman, Assawoman, and Buntings Branch Watersheds.
Goal: Current goals call for the increased implementation of numerous nonpoint source best
management practices, especially in the agriculture sector (see below for a highlight of key
numeric targets). The goals are those that were presented by Inland Bays Pollution Control
Strategies (PCS) and an approved EPA watershed plan. The PCS involves many strategies to
reduce nitrogen and phosphorous to meet the TMDL, but what is presented here are initiatives of
the 319 program.

20 | P a g e Delaware NPS Program
2015 Annual Report
Table1. Progress toward goals within the Inland Bays Watershed
Table 2. 2015 (Section 319) annual activities within the Inland Bays Watershed
319 Projects Grant Year Status 319 Funds
Nutrient Management Planning FY2011 Complete $27,929
Nutrient Relocation FY2011 Complete $52,555
CREP Acres (salary for Coordinator) FY2012 Complete $60,000 (statewide)

21 | P a g e Delaware NPS Program
2015 Annual Report
Table 3. 2015 Inland Bays annual progress and annual load reductions based upon direct funding
or leveraged funding associated with the NPS Program.
Table 4: Subset of water quality monitoring stations, collected in the Inland Bays from 2004 to
present, show the following trends, also see Appendix D:
Progress Highlights/Partners: NPS pollution in Delaware is a shared responsibility among
numerous local, state and federal agencies, organizations and individuals (Partners). As such,
Delaware has established an extensive partnership to assist in the effort of water quality
improvement. Successful partnerships are one of the most important keys to implementing NPS
Program goals to restore or protect Delaware’s water quality. Initially, watershed planning
projects often provide an important mechanism for partnership development at the local
watershed level.
The Center for The Inland Bays is a NPS watershed partner active in the Inland Bays watershed
that helps to restore and protect water quality within the Inland Bays drainage area. CIB works
independently with the common interest of reducing NPS pollutants to waters of the Inland Bays.
Pollutant Controls,
Practices, and ActionsUnit
2015
Inland Bays
Progress
Cummulative
Progress
Watershed
Plan Goal
% Goal
Achieved
Practice and N
Load Reductions
(lbs/year)
Practice and P
Load Reductions
(lbs/year)
Cover Crop (traditional
and commodity)acres 7,568 Annual 37,637 20% 96,744.0 298.0
Nutrient Relocation (net
export from watershed)tons 12,015 Annual 20,909 57% 67,277.6 4,728.0
Nutrient Management acres 10,114 Annual 53,827 19% 5,206.0 400.0
Riparian Forest Buffer acres 0 209 3,235 6% - -
Rain Garden structure 0 1 3 33% 2.0 1.5
Wetland Restoration acres 0 29 4,175 1% - -
169,229.6 5,427.5 Total Reductions
Station Watershed Station Location Total N
count
Total N
Trend
Total N
Confiden
ce
Total P
Count
Total P
trend
Total P
Confiden
ce
TSS
Count
TSS
Trend
TSS
Confiden
ce
308071 Indian RiverMillsboro Pond @ John
Williams Hwy. (Rt. 24)143 -0.067 95 141 0.001 98
143 0.06214 90
308361 Indian RiverBlackwater Creek @ Omar
Rd. (Rd. 54) 97 -0.133 95 97 -- -- 99 -0.099 --
312011 Indian RiverWhite Creek @ mouth of
Assawoman Canal103 -0.041 98 106 -0.002 95
108 -1.398 95
310011Little Assawoman
Bay
Little Assawoman Bay @ Rt.
54 (The Ditch) 94 -0.023 95 106 -- -- 109 -0.8528 95
310121Little Assawoman
Bay
Beaver Dam Ditch @ Beaver
Dam Rd. (Rd. 368)124 -0.143 95 121 0.001 90
124 -0.1183 80
306091 Rehoboth Bay Rehoboth Bay @ Buoy 7 80 -0.015 98 95 -- -- 97 -0.8721 98
306111 Rehoboth Bay Massey Ditch @ Buoy 17 87 -- -- 104 0.001 90 106 -0.9137 98

22 | P a g e Delaware NPS Program
2015 Annual Report
The NPS Program assists in the implementation of CIB programs by offering guidance and
technical assistance at a programmatic level. The CIB 2015 Annual Report can be viewed at
http://www.inlandbays.org/wp-content/documents/Final_CIB_Annual_Report_2015.pdf.
Additionally, the Center for Inland Bays hired an Inland Bays Watershed Coordinator in 2015.
The coordinator will be responsible for coordinating with partner organizations in the
implementation, tracking, and progress reporting of the Inland Bays Comprehensive
Conservation and Management Plan including the Inland Bays Pollution Control Strategy.

23 | P a g e Delaware NPS Program
2015 Annual Report
Broadkill River
Location: The Broadkill River Watershed is located in the east central portion of Sussex County.
It is bounded on the north by the Cedar Creek Watershed, on the west by the Gravelly Branch
and Deep Creek Watersheds, on the south by
the Lewes-Rehoboth Canal, Rehoboth Bay,
and Indian River Watersheds, and on the east
by the Delaware Bay. The mainstem of the
Broadkill River is approximately 25 miles
long. The major watercourse in this segment
is the Broadkill River which originates at the
Town of Milton and discharges into the
Roosevelt Inlet near Lewes. Major
impoundments in the area are Waggamons
Pond and Diamond Pond located near Milton.
The Broadkill River flows generally eastward
until it approaches the coast where it turns
abruptly and flows south to discharge into the
Roosevelt Inlet. The flow of this stream is
sluggish and the water is turbid. The watershed drains an area of 107 square miles.
Goal: The established TMDL requires in terms of daily nonpoint nutrient loads, a 40% reduction
in nitrogen (baseline 1,675 lbs/day) would require a reduction of 670 lbs/day to reach the target
load. A 40% reduction in phosphorus (baseline 69.3 lbs/day) would require a 27.7 lbs/day
reduction to reach the target load.
Impairment: Water quality monitoring performed by the Department of Natural Resources and
Environmental Control (DNREC) has shown that waters of the Broadkill River and several of its
tributaries and ponds are impaired by high levels of bacteria and elevated levels of nitrogen and
phosphorous, and that the designated uses are not fully supported due to levels of these pollutants
in these waterways. Total Maximum Daily Loads (TMDLs) were established for the Broadkill
River Watershed in December 2006.
Implementation: Where data is available, Section 319 specific information is provided (refer
to Table 1). The Milestone data is necessary to demonstrate efforts and actions towards progress
within the Broadkill River Watershed.
24 | P a g e Delaware NPS Program
2015 Annual Report
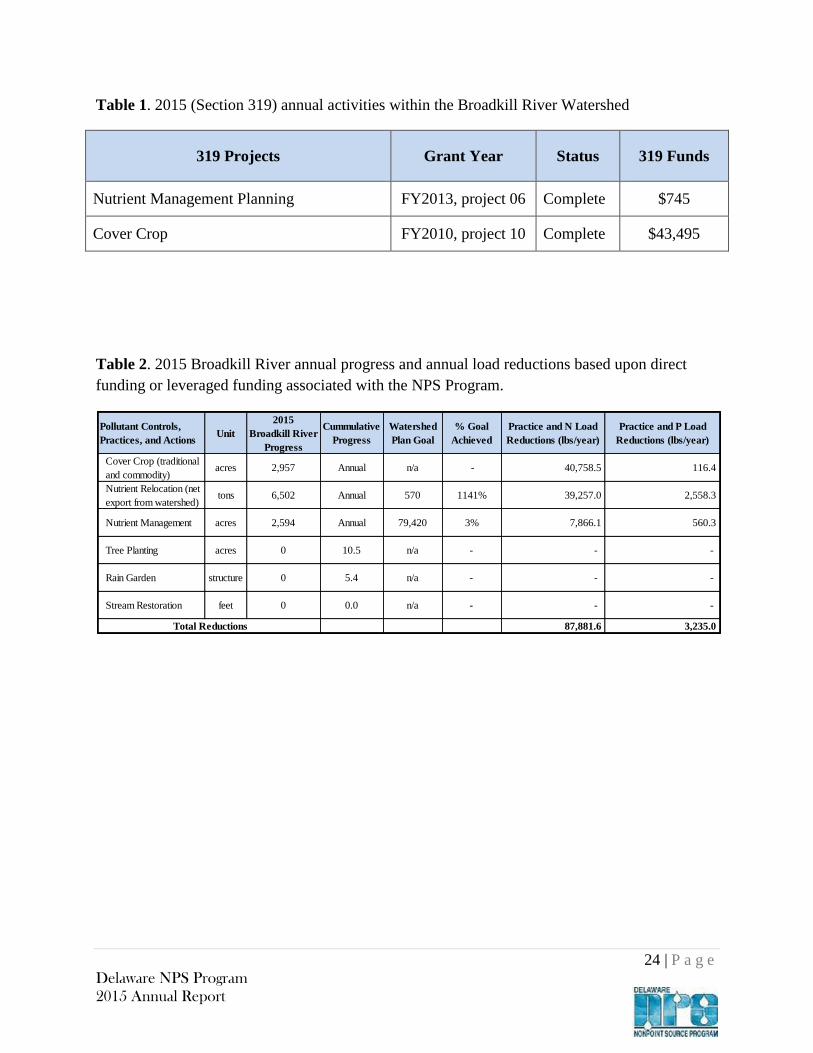
Table 1. 2015 (Section 319) annual activities within the Broadkill River Watershed
319 Projects Grant Year Status 319 Funds
Nutrient Management Planning FY2013, project 06 Complete $745
Cover Crop FY2010, project 10 Complete $43,495
Table 2. 2015 Broadkill River annual progress and annual load reductions based upon direct
funding or leveraged funding associated with the NPS Program.
Pollutant Controls,
Practices, and ActionsUnit
2015
Broadkill River
Progress
Cummulative
Progress
Watershed
Plan Goal
% Goal
Achieved
Practice and N Load
Reductions (lbs/year)
Practice and P Load
Reductions (lbs/year)
Cover Crop (traditional
and commodity)acres 2,957 Annual n/a - 40,758.5 116.4
Nutrient Relocation (net
export from watershed)tons 6,502 Annual 570 1141% 39,257.0 2,558.3
Nutrient Management acres 2,594 Annual 79,420 3% 7,866.1 560.3
Tree Planting acres 0 10.5 n/a - - -
Rain Garden structure 0 5.4 n/a - - -
Stream Restoration feet 0 0.0 n/a - - -
87,881.6 3,235.0 Total Reductions

25 | P a g e Delaware NPS Program
2015 Annual Report
Table 3: Subset of water quality monitoring stations, collected in the Broadkill River from 2004
to present, show the following trends, also see Appendix D:
Station Watershed Station Location Total N
count
Total N
Trend
Total N
Confiden
ce
Total P
Count
Total P
trend
Total P
Confiden
ce
TSS
Count
TSS
Trend
TSS
Confiden
ce
303021Broadkill
River
Ingram Branch @
Gravel Hill Rd. (Rd.
248)
104 0.154 80 103 0.015 95
-- -- --
303041Broadkill
River
Broadkill River @
Rt. 1 Bridge104 -0.058 95 103 0.002 80
103 -0.792 --
303051Broadkill
River
Red Mill Pond @
Rt. 196 -- -- 103 -0.003 95
103 -0.731 95
303171Broadkill
River
Beaverdam Creek
@ Cave Neck Rd.
(Rd. 88)
105 -- -- 103 -0.003 95
104 0 --
303181Broadkill
River
Beaverdam Creek
@ Carpenter Rd.
(Rd. 259) 103 -0.266 98 100 -0.010 95 102 -0.366 98
303311Broadkill
River
Round Pole Branch
@ Cave Neck Rd.
(Rd. 88)
103 0.044 80 101 -- --
102 0 --
26 | P a g e Delaware NPS Program
2015 Annual Report
Appoquinimink River
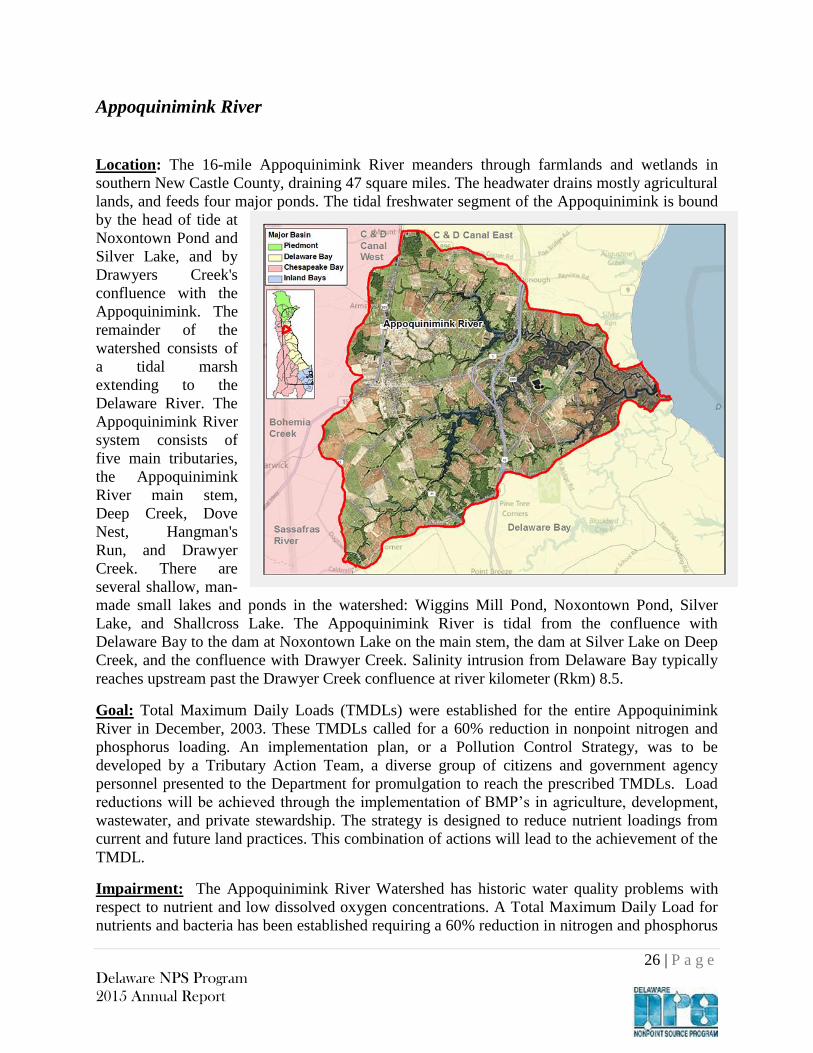
Location: The 16-mile Appoquinimink River meanders through farmlands and wetlands in
southern New Castle County, draining 47 square miles. The headwater drains mostly agricultural
lands, and feeds four major ponds. The tidal freshwater segment of the Appoquinimink is bound
by the head of tide at
Noxontown Pond and
Silver Lake, and by
Drawyers Creek's
confluence with the
Appoquinimink. The
remainder of the
watershed consists of
a tidal marsh
extending to the
Delaware River. The
Appoquinimink River
system consists of
five main tributaries,
the Appoquinimink
River main stem,
Deep Creek, Dove
Nest, Hangman's
Run, and Drawyer
Creek. There are
several shallow, man-
made small lakes and ponds in the watershed: Wiggins Mill Pond, Noxontown Pond, Silver
Lake, and Shallcross Lake. The Appoquinimink River is tidal from the confluence with
Delaware Bay to the dam at Noxontown Lake on the main stem, the dam at Silver Lake on Deep
Creek, and the confluence with Drawyer Creek. Salinity intrusion from Delaware Bay typically
reaches upstream past the Drawyer Creek confluence at river kilometer (Rkm) 8.5.
Goal: Total Maximum Daily Loads (TMDLs) were established for the entire Appoquinimink
River in December, 2003. These TMDLs called for a 60% reduction in nonpoint nitrogen and
phosphorus loading. An implementation plan, or a Pollution Control Strategy, was to be
developed by a Tributary Action Team, a diverse group of citizens and government agency
personnel presented to the Department for promulgation to reach the prescribed TMDLs. Load
reductions will be achieved through the implementation of BMP’s in agriculture, development,
wastewater, and private stewardship. The strategy is designed to reduce nutrient loadings from
current and future land practices. This combination of actions will lead to the achievement of the
TMDL.
Impairment: The Appoquinimink River Watershed has historic water quality problems with
respect to nutrient and low dissolved oxygen concentrations. A Total Maximum Daily Load for
nutrients and bacteria has been established requiring a 60% reduction in nitrogen and phosphorus

27 | P a g e Delaware NPS Program
2015 Annual Report
loads and a bacteria reduction of between 11-15% in freshwater areas and 72-73% in marine
areas.
Implementation: Where data is available, Section 319 specific information is provided (refer to
Table 1). The Milestone data is necessary to demonstrate efforts and actions towards progress
within the Appoquinimink River Watershed.
Table 1. 2015 (Section 319) annual activities within the Appoquinimink River Watershed
319 Projects Grant Year Status 319 Funds
Nutrient Management Planning FY2015 Complete $ 6,545
CREP Acres (salary for Coordinator) FY2015 Complete $ 60,000
(statewide)
Table 2. 2015 Appoquinimink River annual progress and annual load reductions based upon
direct funding or leveraged funding associated with the NPS Program.
Pollutant Controls,
Practices, and ActionsUnit
2015
Appoquinimink
River Progress
Cummulative
Progress
Watershed
Plan Goal
% Goal
Achieved
Practice and N
Load Reductions
(lbs/year)
Practice and P Load
Reductions
(lbs/year)
Cover Crop (traditional
and commodity)acres 0 Annual 3,145 0% - -
Nutrient Relocation (net
export from watershed)tons 0 Annual n/a - - -
Nutrient Management acres 2,263 Annual 12,584 18% 6,862.4 488.8
Riparian Buffer
(forest and vegetative)acres 0 66.1 69.3 95% - -
Rain Garden structure 0 n/a n/a - - -
Stream Restoration feet 0 n/a n/a - - -
6,862.4 488.8 Total Reductions

28 | P a g e Delaware NPS Program
2015 Annual Report
Table 3. Subset of water quality monitoring stations, collected in the Appoquinimink River from
2004 to present, show the following trends, also see Appendix D:
Progress Highlights: All sectors have taken steps to improve water quality through the
implementation of laws, regulations, and voluntary BMPs. Analysis using a basic land use
loading rate model shows that, to date, nonpoint sources of TN and TP have been reduced by
109% and 111%, respectively, from the TMDL baseline levels. There is still a need for further
reductions in areas that are currently lacking such as wastewater and stormwater.
Station Watershed Station Location Total N
count
Total N
Trend
Total N
Confiden
ce
Total P
Count
Total P
trend
Total P
Confiden
ce
TSS
Count
TSS
Trend
TSS
Confiden
ce
109071Appoquinimink
River
Drawyer Creek off
Rt. 13 @ parking
area
103 -0.047 95 103 -- --
104 -0.832 --
109121Appoquinimink
River
Appoquinimink
River @ Silver Run
Rd. (Rt. 9) NE
103 -0.026 95 102 -0.002 80
103 -1.217 95
109131Appoquinimink
River
Noxontown Pond
@ Noxontown Rd.
(Rd. 38) 96 -0.020 90 102 -0.001 90 104 -0.168 --
109171Appoquinimink
River
Appoquinimink
River @ MOT Gut
(west bank)
94 -0.022 95 95 -- --
96 -0.121 --

29 | P a g e Delaware NPS Program
2015 Annual Report
Christina Basin
Location: The Christina Basin is a 565 square mile basin contained in the larger Delaware River
Basin. The Christina Basin, located in New Castle County in northern Delaware, includes four
sub-watersheds:
Brandywine Creek 325 sq. mi.
Red Clay Creek 54 sq. mi.
White Clay Creek 107 sq. mi.
Christina River 78 sq. mi.
Although a small portion can be found within
Maryland, the Christina Basin falls principally
within two states, Pennsylvania to the north and
Delaware to the south. The Pennsylvania portion
is characterized by more open space, including
agricultural land and forests, while the more
urban, southerly portion in Delaware tends to
have more built-up land.
Goal: Delaware’s goal is to reduce pollutant
loadings from current and future land use
practices with an effort to achieve the TMDL.
The effort for the Delaware portion of the
Christina Basin will be implemented through the
work of numerous organizations and individuals
and will be coordinated with the ongoing
pollution reduction efforts in the Pennsylvania
portion of the Christina Basin. The level of
pollution reductions necessary to achieve the
designated uses in the streams of the Delaware
portion of the Christina Basin vary significantly.
For example, bacteria levels need to be reduced
as much as 95 percent in some areas, nitrogen
levels need to be reduced as much as 50 percent
in some areas, and phosphorus levels need to be
reduced as much as 89 percent in some areas. In contrast, other areas of the Christina Basin are
relatively free of excess nitrogen, phosphorus, and bacteria and simply need to be protected in
their current state. Figure 3.21 shows the subwatersheds that were used to determine the TMDLs
for the Christina Basin. Figures 3.22–3.25 graphically represent the pollution reductions as
mandated by the USEPA for the Brandywine Creek, Red Clay, and White Clay Creeks, and the
Christina River.
Impairment: The streams of the Christina Basin in Delaware suffer from impaired water quality
due to the following problems:

30 | P a g e Delaware NPS Program
2015 Annual Report
Nutrients: One hundred and thirty stream miles have higher than desired nitrogen and
phosphorus loads, which could cause low dissolved oxygen (DO) levels.
Bacteria (pathogens): Concentrations along 134.2 miles of stream frequently exceed
the primary recreation standards for swimming of 100 colonies per 100 milliliters.
Sediment: The streams are degraded by high sediment loads that range between 311
and 975 pounds per acre annually, depending on the subwatershed.
Stream Habitat: While biological diversity of the streams has been improving, 39
percent of the nontidal streams in the Piedmont have poor habitat due to the increased
frequency and rate of runoff from urban/suburban development and rural activities
(Shaver et al., 1995).
Contaminated Waste Sites: Contaminated waste sites are situated throughout the
watershed.
Fish Consumption Advisories: Health warnings advising against the consumption of
fish have been posted along 82.2 stream miles due to PCB contaminated sediment and
high PCB levels in fish tissue.
Implementation: The Watershed Implementation Plan development for the Christina Watershed
was approved by EPA in the Spring of 2013.
Progress Highlights: The following are specific examples of NPS Program funded projects that
occurred or finalized in 2015:
1. Upper Christina Stream Restoration - Approximately 3,675 feet of stream restoration will be
implemented along the upper Christina River located west of Newark in the Timber Creek,
West Branch and Christianstead subdivisions. Severe bank erosion is occurring along
numerous properties adjacent to the stream channel. The banks are being undercut, causing
mature trees to fall into the stream channel. Tremendous sediment loads are being released
into the waterway with every storm event, impairing habitat and creating high turbidity
conditions in the water column.
Beginning in 2010, several property owners have contacted the Division of Watershed
Stewardship and expressed their concerns about the loss of trees and property with no
apparent end in sight. They have requested assistance from the Division of Watershed
Stewardship to rectify the problems exacerbated by upstream development and increased
amounts of impervious surface throughout the watershed.
Implementing the appropriate stream restoration techniques will help stabilize the stream
banks resulting in reduced sediment and nutrient loading to the Christina, improvements to
habitat and water quality, and will allow the channel to be resized for the flow volumes that
pass through the systems during average storm events. Bank-toe boulder protection and
vegetative plantings, along with other stream restoration construction techniques, will be
utilized to stabilize the degrading stream banks and improve habitat and water quality and
reduce the loss of property.
2. Limestone Presbyterian Church Rain Garden: As a continuation of the creation of a rain
garden at the Limestone Presbyterian Church rain garden, 2015 brought both training and

31 | P a g e Delaware NPS Program
2015 Annual Report
plant replacement to this area of the White Clay Creek Watershed. This 1600 sq. ft. garden
uses parking lot islands to drain 2.6 acres of parking lot and upland areas. Volunteers
participated in 3 hours of on the ground training held by Red Tail Restoration & Land
Management to learn about invasive species removal and plant identification in the rain
garden. Also, 172 native plants were planted in the garden to replace species that did not
thrive. Species included wild pink, blue flag iris, marsh marigold, buttonbush, New York
ironweed, alumroot, cardinal flower and viburnum. Costs for 2015 paid by the Nonpoint
Source Program totaled $1,005.25.
3. Hillendale Elementary School Rain Garden: Begun in 2013, the five rain gardens at
Hillendale Elementary School in Chadds Ford, PA were finished in 2015 with the planting of
thousands of native plant plugs by the volunteers of the Brandywine Valley Association.
Eventually the rain gardens will be integrated into the school’s curriculum and will be
maintained by school staff and volunteers. Costs for 2015 paid by the Nonpoint Source
Program totaled $1,947.
4. Goddard Park Rain Garden: Led by the White Clay Wild and Scenic Program, two rain
gardens were created in Goddard Park, West Grove, PA in the White Clay Creek Watershed.
The two gardens were retrofitted in two basins (approximately 3,400 sq. ft. total) that drained
parking lots and overland flow. Over 70 volunteers participated in the creation of the rain
gardens including plant selection, augering holes, applying leaf mulch and planting
thousands of native plugs. This truly was a multi-municipality, bi-state effort. In addition,
these gardens have been used for in-class and hands-on workshops on maintenance and
creation of rain gardens. Costs for 2015 paid by the Nonpoint Source Program totaled
$4,706.33 and $1,469.88 was paid for by United Water Delaware.
5. East Fallowfield Township Rain Garden: The Brandwine Valley Association working with
the East Fallowfield Township installed a rain garden at the East Fallowfield Township
building that drains the office and public works building. Working together, these two
groups created, installed and planted this rain garden to help deal with their stormwater
runoff, and to teach township staff for future projects. Costs for 2015 paid by the Nonpoint
Source Program totaled $2,014.87.

32 | P a g e Delaware NPS Program
2015 Annual Report
Table 1. 2015 Christina River Basin annual progress and annual load reductions based upon
direct funding or leveraged funding associated with the NPS Program.
Table 2. Subset of water quality monitoring stations, collected in the Christina Basin from 2004
to present, show the following trends, also see Appendix D:
Additional NPS Activity in the Christina Watershed:
1. Community Water Quality Improvement Grant - The purpose of the Community Water
Quality Improvement Grant Program (CWQIG) is to provide financial assistance to
eligible entities to facilitate projects that will support water quality improvement in
impaired Delaware watersheds. The CWQIG is administered by DNREC, Nonpoint
Source Program. The goals of the program are to support projects that focus on the
developed landscape that will help improve water quality. Funding for the following
projects is available as a result of the interest earned from the State Revolving Fund Loan
Pollutant Controls,
Practices, and ActionsUnit
Christina
Basin
Cummulative
Progress
Watershed
Plan Goal
% Goal
Achieved
Practice and N
Load Reductions
(lbs/year)
Practice and P
Load Reductions
(lbs/year)
Cover Crop (traditional
and commodity)acres 0 Annual 12.4 0% - -
Nutrient Relocation (net
export from watershed)tons 0 Annual 0.0 0% - -
Nutrient Management acres 0 Annual 7,559.0 0% - -
Tree Planting acres 0 0 0.0 0% - -
Rain Garden structure 4 36 31.6 113% 8.0 6.0
Stream Restoration feet 3,675 3,675 0.0 - 637.9 578.3
645.9 584.3 Total Reductions
Station Watershed Station Location Total N
count
Total N
Trend
Total N
Confidence
Total P
Count
Total P
trend
Total P
Confiden
ce
TSS
Count
TSS
Trend
TSS
Confiden
ce
103011Red Clay
Creek
Stanton, Rt. 4 at Stanton
Bridge (USGS gage
01480015)
115 -- -- 114 -0.006 95
115 -0.1105 --
103031Red Clay
Creek
Red Clay Creek @
Lancaster Pike (Rt. 48) 142 -- -- 141 -0.005 95
142 -0.0978 90
105151White Clay
Creek
White Clay Creek @
Delaware Park Blvd. 144 -- -- 142 -0.002 90
144 -0.0949 --
106141Christina
River
Christina River @
Sunset Lake Rd. (Rt. 72) 135 -0.046 98 132 -- -- 135 -0.3515 98
106291Christina
River
Christina River near
Conrail Bridge 124 -0.030 95 124 -0.001 90
124 -0.3691 --

33 | P a g e Delaware NPS Program
2015 Annual Report
Program.
Project Name CWQIG
Award
319 Funds
Leveraged
Quantity Watershed
Upper Christina River Stream
Restoration Project $150,000 150,000 1 Christina
2. City of Newark Community Wildlife Habitat Certification: In 2015, the City of Newark
became the 78th
community in the country and the 2nd
in the State of Delaware to be
designated an NWF Community Wildlife Habitat. To reach this goal, the City and
partners helped to create and certify multiple habitat areas in schools, businesses,
backyards, parks and other spaces and to educate residents about the benefits of habitat
creation to our environment. Costs for 2015 paid by the Nonpoint Source Program
totaled $500.
3. Citizen Attitudes about a Clean Water Fee Survey (Statewide): The Delaware Nature
Society commissioned a representative statewide survey and three regional focus groups
to gauge the level of support or opposition for a proposed clean water fee in Delaware.
The poll of 400 randomly-selected adult Delaware residents was conducted by telephone,
using trained and supervised live interviewers. Focus groups were also conducted in each
of the state’s three counties among a cross-section of area residents. Costs for 2015 paid
by the Nonpoint Source Program totaled $2,000.

34 | P a g e Delaware NPS Program
2015 Annual Report
VII. Load Reductions
In 2015, the Delaware NPS Program load reductions were calculated for many of the 319 funded
projects implemented on a watershed scale. The load reductions are calculated using guidance
established during the Pollution Control Strategy development process.
2015 Project Load Reductions/Year by Watershed
Project Nitrogen (lbs) Phosphorus (lbs)
Chesapeake Bay 2,033,687 83,317
St. Jones River 10,339 266
Inland Bays 169,228 5,426
Broadkill River 87,882 3,235
Appoquinimink River 6,862 489
Christina Basin 646 584
TOTAL 2,308,643 93,318
VIII. Future Changes and Challenges
Programmatic Changes
From 1989 to 1997, the NPS Program relied on the development and implementation of Best
Management Practices, identification of key partners, establishing agreements for interagency
cooperation and funding many successful education, protection and restoration projects. This
early period of NPS management in Delaware served to foster a keen understanding of the value
of collaboration, consensus and community involvement in water quality management.
From 1997 to the present, efforts were made to fund implementation programs or activities that
address the priority NPS contaminant sources such as agriculture, forestry, urban runoff, hydro
modification, land disposal and various other miscellaneous sources. Examples of past activities
include funding Kent and Sussex County Conservation District planner positions, stream
restoration, and septic system pump-out, repair and/or replacement. These activities were

35 | P a g e Delaware NPS Program
2015 Annual Report
prioritized based upon contaminate category and tended to establish BMP implementation on a
geographic wide scale throughout Delaware. This broad approach served to successfully educate
various sectors of the positive outcomes from BMP implementation and fostered a high rate of
acceptance within each of the respective implementation groups.
While these and similar projects are expected to continue, a prioritized approach will be
established to assure NPS activities are focused in stream reach drainages with the highest
potential for contaminant delisting and/or re-establishing designated uses. In short, Delaware’s
NPS focus will target watersheds with accepted Watershed Plans meeting the a) through i)
criteria.
Current activity will be summarized and accounted for during the 2015 Delaware NPS
Management Plan development process. A first draft was submitted to EPA in late 2015.
Comments were received and will be addressed during the next revision. A final approved plan
will be developed by September 2015 that identifies the NPS Program’s long-term goals
reflecting a strategically focused state NPS management program designed to achieve and
maintain water quality standards and to maximize water quality benefits.
Annual milestones in the Delaware NPS Management Plan will describe outcomes and key
actions expected each year. The Plan includes objectives that address nonpoint sources of surface
water and ground water pollution as appropriate (including sources of drinking water) in
alignment with the goals of the Clean Water Act. The objectives include both implementation
steps and how results will be tracked (e.g., water quality improvements or load reductions). The
Plan will include long-term goals and shorter-term (e.g., three- to five-year) objectives that are
well integrated with other key environmental and natural resource programs. The program goals
and objectives will be periodically revised as necessary to reflect progress or problems
encountered, strategies to make progress towards achieving the goals, and indicators to measure
progress. Updates to the NPS Milestones can be found in Appendix A.
Shortfalls
While we have met or exceeded our overall load reduction expectations within the targeted
watersheds, the NPS Program did not achieve a few specific implementation goals we have set
for ourselves. The exact goals for early/standard/late cover crops were not achieved, but cost
share programs have been modified to emphasize early plantings and this acreage is expected to
increase in the future. Forest buffer acreage did not increase and members of the agriculture
community have indicated that current market prices of crops do not support land conversion for
buffers at this time. A collaborative group plans to examine how much of an additional cost
share incentive is needed to encourage additional enrollment in buffer programs. The tons of
poultry litter transported has decreased in recent years; Delaware believes in general that the total
volume of litter has decreased as has the nutrient content of the litter and staff are working with
the CBP Ag Workgroup to assess the data and make necessary model modifications. Finally, the
onsite pump out goal was not achieved, but regulations have been proposed requiring a pump-out
and inspection at the time of property sale or transfer and will also require reporting when
inspections occur; both requirements are expected to increase the number of pump-outs reported
each year.

36 | P a g e Delaware NPS Program
2015 Annual Report
Land Use Changes/Challenges
Ed Ratledge, Director of the Center for Applied Demography and Survey Research at the
University of Delaware says the number of acres of farmland is decreasing. Delaware had
approximately 900,000 acres of farmland in 1920. Currently, we have about 580,000 acres in the
state. Farmland acres are projected to continue to decrease until we reach about 380,000 acres
by 2030.
The NPS program must address land use changes and trends for the next five years and beyond.
As water runs over the landscape it picks up pollutants. These pollutants are either discharged
into surface waters through runoff or seep through the soils into groundwater. The polluted
groundwater eventually gets into the surface waters. As the landscape changes, so too does the
funding demands of the NPS Program. Because of this fact, looking at land use will give the
NPS Program goals, objectives and funding needs in which to focus the various resources the
NPS Program receives. Agriculture BMPs, historically, have given the NPS Program the biggest
return of nutrient uptake per dollar spent.
The trend of land use from agriculture to urban in the future could also mean a trend for the NPS
program to spend more money on technologies and initiatives to reduce non-point source
pollution. When land is developed nutrient loadings come from multiple sources, such as yard
maintenance, wastewater disposal, stormwater runoff, soil erosion, and increases in impervious
cover. Delaware is the 9th fastest growing state according to the U.S. Census Bureau. The fast
rate of growth in Delaware means an increase in urban/residential areas. An increase in
urban/residential areas nutrient loads from these land uses must be dealt with without
relinquishing our efforts in agriculture.

37 | P a g e Delaware NPS Program
2015 Annual Report
IX. List of Partner Organizations/Committee Members
The hard work and many hours of agency staff members, organization members and private
individuals who have partnered with the NPS Program in 2015 to address, reduce, identify and/or
measure NPS pollution in Delaware is greatly appreciated. This NPS pollution control and
prevention program has been very active, well received and effective. It is a credit to our partners
as they have cooperated in the face of many conflicts to make this program what it is today.
Bart Wilson U.S. Fish and Wildlife Service
Jim Short DNREC/Solid Waste
Andrew Whitman DE Department of Transportation
Jim Sullivan DNREC/Watershed Stewardship
Ann Marie Townshend City of Dover Planning Office
Joe Farrell University of Delaware
Austin Short DE Department of Agriculture
John Barndt DNREC/Water Resources
Bob Coleman Delaware Nutrient Management Program
John Schneider DNREC/Watershed Stewardship
Brenda Zeiters DNREC/NPS Program
Kacey Taylor USDA/NRCS
Brittany Sturgis DNREC/ Watershed Stewardship
Kevin Donnelly New Castle Conservation District
Carol Cain DE Department of Transportation
Kimberly Cole DNREC/Delaware Coastal Program
Chris Bason Center for the Inland Bays
Kip Foskey Sussex Conservation District
Chris Brosch DE Department of Agriculture
Lara Allison DNREC/NPS Program
Chuck Williams DNREC/Shoreline
Lynn Mangus Farm Service Agency/State Office
Dale Churchey Delaware CREP Program
Marcia Fox DNREC/Watershed Stewardship
Dave Schepens DNREC/Groundwater Discharges
Marianne Walch Center for the Inland Bays
David Saveikis DNREC/Fish&Wildlife
Mark Biddle DNREC/Watershed Stewardship
Debbie Absher Sussex Conservation District
Mark Hogan DNREC/NPS Program
Dorothy Morris State of Delaware Planning Office
Paul Petrichenko NRCS State Office
Ed Lewandoski University of Delaware
Robert Baldwin Delaware Assoc of Conservation
Districts
Frank Piorko DNREC/Watershed Stewardship
Robert Palmer DNREC/NPS Program
Fred Suffian US EPA
Sally Boswell Center for the Inland Bays
James Gregory DNREC/ Watershed Stewardship
Sally Kepfer NRCS State Office
Jamie Rutherford DNREC/Sediment & Stormwater
Sara Esposito DNREC/ Watershed Stewardship
Jen Walls DNREC/Watershed Stewardship
Sara Wosniak DNREC/ Watershed Stewardship
Jenn Volk University of Delaware
Sharon Webb DNREC/ NPS Program
Jerry Kauffman Water Resources Agency
Steve Williams DNREC/ Watershed Stewardship
Jessica Watson Sussex Conservation District
Tim Garrahan NRCS State Office
Jim Cassidy DNREC/Groundwater Discharges
Tim Riley Kent Conservation District
Jim Chaconas DNREC/Wetlands & Subaqueous Lands
Tom Barthelmeh DNREC/Watershed Stewardship

38 | P a g e Delaware NPS Program
2015 Annual Report
Appendix
Appendix A – 2015 Milestones
Appendix B – Annual Nutrient reductions for N & P
Appendix C – Annual Numeric Milestones
Appendix D – Water Quality Trend Data
Appendix E – Bridgeville Branch fact sheet
Appendix F – Air Seeder Summary
Appendix G – Air Seeder Fact Sheet
Appendix H - Mirror Lake Restoration Fact Sheet

39 | P a g e Delaware NPS Program
2015 Annual Report
Appendix A – 2015 Milestones
Target
Date Short and Mid Term Milestones (2015 – 2019) Deliverable 2015 Comments/Status Updates
2015 Establish baseline conditions for program
indicators Program indicator baseline
Program indicator tracking is ongoing. NPS
Staff will establish a complete list of program
indicators in 2016 and provide updates in the
2016 annual report.
2015 Complete approval of all existing watershed plans Watershed plans COMPLETED - Eleven (11) priority watershed
plans approved in Delaware in 2015.
2015 Complete baseline sampling for initial priority
watersheds Priority watershed baseline
Establish a load reduction baseline for nitrogen,
phosphorus and sediment in priority watersheds.
NPS Staff will establish in 2016 and provide
updates in the annual report.
2015
Estimated pollutant load reductions achieved for
sediment, phosphorus and nitrogen from BMPs
implementation in Delaware’s watersheds.
Increase annual load reductions
as funding allows
Interim goal: Establish baseline load reductions
based on current monitoring data achieved in
select Delaware watersheds (to be determined as
funding allows) for FY2015. (b) Increase annual
load reductions in Delaware watersheds by 2%
annually from the FY2015 baseline

40 | P a g e Delaware NPS Program
2015 Annual Report
Target
Date Short and Mid Term Milestones (2015 – 2019) Deliverable 2015 Comments/Status Updates
2015
Estimated pollutant load reductions achieved for
sediment, phosphorus and nitrogen from BMPs
implementation in priority watersheds.
Establish baseline load reductions
Increase annual load reductions in non-
Chesapeake Bay priority watersheds by 2%
annually from the FY2015 baseline. Increase
annual load reductions in Chesapeake Bay
priority watersheds by 20% annually from the
FY2015 baseline. (to be determined as funding
allows) for FY2015.
2015 Reduce nutrient loads from NPS sources in
Delaware’s priority watersheds.
Establish baseline load reductions
from BMP implementation
Establish baseline of load reductions from BMP
implementation in FY 2015 for the following
priority watersheds:
Inland Bays
Little Assowoman Bay
St. Jones River
Appoquinimink River
Christina River
2016 watersheds. Increase number of outreach and
education interactions
Increase number of outreach and education
interactions by 10% over FY 2015 baseline
2019 Remove NPS related impairments from stream
segments
one stream segment (2015)
five stream segments (2019)
One stream segment will be identified annually
as having improved water quality baseline
assessment and will be included in the NPS
annual success story. In 2015, one stream
segment was removed. A total of five stream
segments will be identified as having improved
water quality baseline assessment by 2019.

41 | P a g e Delaware NPS Program
2015 Annual Report
Target
Date Short and Mid Term Milestones (2015 – 2019) Deliverable 2015 Comments/Status Updates
2019 Assess interim and 2015 progress milestones Biennial milestone updates Assessment ongoing.
2019 Review and update plan as needed Management plan update
Progress is ongoing. Plan will be reviewed in
2017 when Milestones are updated. A complete
plan will be provided to EPA in 2019.
2019
Show relative progress towards BMP
implementation activities for all the EPA approved
watershed plans
Increase BMP implementation
annually by watershed Progress ongoing.
2019
Demonstrate water quality improvement in the
priority watersheds resulting from plan
implementation activities
303(d) de-listing
305(b) reports are prepared every even
numbered year. Any water quality
improvements would result in a 303(d) delisting.
NPS will maintain delisting records and update
annually.
2019 Show a 10% decrease of pollutant loadings in 50%
or more of the priority watersheds Annual load reduction decreases
Increase load reductions annually in non-
Chesapeake Bay priority watersheds by 2% and
by 20% in Chesapeake Bay priority watersheds
from baseline.
Annual
through
2019
Show annual increases in funding and quantities of
BMPs implemented in priority watersheds
Procurement of funds to close
BMP implentation gaps
NPS will seek alternative funding sources to
assist with implementation of water quality
BMPs.
Annual
through
2019
Remove one stream segment per year from the
303(d) list through 2019
Removal of 303(d) stream
segment
305(b) reports are prepared every even
numbered year. Any water quality
improvements would result in a 303(d) delisting.
NPS will maintain delisting records and update
annually. Significant delistings, as a result of
NPS Program activities, will be highlighted in
the annual NPS success story.

42 | P a g e Delaware NPS Program
2015 Annual Report
Target
Date Short and Mid Term Milestones (2015 – 2019) Deliverable 2015 Comments/Status Updates
Target
Date Long Term Milestones (2019-2030) Deliverable 2015 Comments/Status Updates
2030 Complete BMP implementation for 75% of the
EPA approved watershed plans
Increase BMP implementation by
75% Progress ongoing.
2030 Remove 50% or more of high priority TMDLs
from 2010 303(d) list
Removal of half of high priority
TMDLs from 303(d) list Progress ongoing.

43 | P a g e Delaware NPS Program
2015 Annual Report
Appendix B – Annual Nutrient reductions for N & P
Nitrogen Load
Reductions
(lbs/year)
Chesapeake St. Jones
River Inland Bays
Broadkill
River
Appoquinimink
River
Christina
Basin Total
Cover Crops 820,559.0 5,042.00 96,744.00 40,758.50 - - 963,103.50
Nutrient
Relocation 896,765.1 3,151.70 67,277.60 39,257.00 - - 1,006,451.43
Nutrient
Management 313,621.6 2,145.00 5,206.00 7,866.10 6,862.40 - 335,701.10
Tree Planting 2,618.0 - - - - - 2,618.00
Rain Gardens 2.0 - - - - 8 10.00
Stream
Restoration 121.5 - - - - 637.9 759.40
Total N
Reductions 2,033,687.23 10,338.70 169,227.60 87,881.60 6,862.40 645.90 2,308,643.43

44 | P a g e Delaware NPS Program
2015 Annual Report
Phosphorus
Load
Reductions
(lbs/year)
Chesapeake
St.
Jones
River
Inland
Bays
Broadkill
River
Appoquinimink
River
Christina
Basin Total
Cover Crops 2,342.4 5 298 116.4 - - 2,761.77
Nutrient
Relocation 58,441.0 205.4 4,728.00 2,558.30 - - 65,932.70
Nutrient
Management 22,340.1 56 400 560.3 488.8 - 23,356.39
Tree Planting 82.0 - - - - - 82.00
Rain Gardens 1.5 - - - - 6 7.50
Stream
Restoration 110.2 - - - - 578.3 688.46
Total P
Reductions 83,317.12 266.40 5,426.00 3,235.00 0.00 584.30 92,828.82

45 | P a g e Delaware NPS Program
2015 Annual Report
Appendix C – Annual Numeric Milestones
Pollutant Controls, Practices, and
ActionsUnit
2015 Cumulative
Progress
Chesapeake
Bay St. Jones River Inland Bays Broadkill River
Appoquinimink
RiverChristina Basin
Cover Crop (traditional and
commodity)acres 71,701 59,531 1,645 7,568 2,957 0 0
Nutrient Relocation (net export from
watershed)tons 54,102 35,063 522 12,015 6,502 0 0
Nutrient Management acres 113,312 163,004 3,181 1,851 2,594 2,263 0
Tree Planting acres 57 57 0 0 0 0 0
Rain Garden structure 5 1 0 0 0 0 4
Stream Restoration feet 4,375 700 0 0 0 0 3,675

46 | P a g e Delaware NPS Program
2015 Annual Report
Appendix D – Water Quality Trend Data
Total nitrogen and total phosphorus data from 1999-2015 for all Delaware STORET stations was retrieved. Data
from stations with 40 or more data points were analyzed using WQSTAT software to evaluate for concentration
trends using non-parametric methods. 133 stations had 40 or more data points for total phosphorus and 132 stations
for total nitrogen. The software reported statistically significant trends at various confidence levels depending on
the type of statistical test used. For regulatory purposes the Department would not ordinarily consider 80 or 90
percent confidence levels as a trigger for further action. For this analysis, however, the lower confidence results are
reported and mapped to aid in “telling the story”, especially in the mapped data. See the tables and maps below.
Of the 133 stations evaluated for total phosphorus concentration trends, 45 had statistically significant trends.
Trends were closely divided between upward and downward trends. 88 stations showed no trend, either positive or
negative. Of the 132 stations evaluated for total nitrogen concentration trends, 76 stations had statistically
significant trends and 56 stations had no trend upward or downwards. The vast majority of significant trends for
total nitrogen were downward trends, mostly at higher confidence levels.
140 Stations were analyzed for trends in measured concentrations of total suspended solids for the 1998-2014
period of record. Of those 140 stations, sixty one stations had statistically significant trends. Of the sixty one
stations with trends, six stations had statistically significant upward trends and the remaining fifty five stations
showed downward trends. Seventy nine stations did not have statistically significant trends either upward or
downward.

47 | P a g e Delaware NPS Program
2015 Annual Report
Station Watershed Station Location Total
N count
Total N
Trend Total N
Confidence
Total P
Count
Total P
trend Total P
Confidence TSS
Count TSS
Trend TSS
Confidence
101021 Naamans Creek Naaman Creek @ State Line near Hickman Rd. 115 -- -- 111 -- -- 115 0.1322 98
101031 Naamans Creek Naaman Creek S. Branch @ Darley Rd. (Rd. 207) 90 -
0.052 98 90 -- -- 90 -0.0851 95
101061 Naamans Creek Naaman Creek South Branch @ Marsh Rd. (Rt. 3) 66 -- -- 64 -- -- 66 0 --
102041 Shellpot Creek Shellpot Creek @ Hay Rd. (Rd. 501) 106 -
0.052 98 104 -- -- 106 -0.8908 95
102051 Shellpot Creek Shellpot Creek @ Market St. (Rt. 13 Bus.) 95 -- -- 93 -- -- 95 0 --
102081 Shellpot Creek Shellpot Creek @ Carr Rd. 64 -0.041 98 62 -- -- 64 0 --
103011 Red Clay Creek Stanton, Rt. 4 at Stanton Bridge (USGS gage 01480015) 115 -- -- 114
-0.006 95 115 -0.1105 --
103031 Red Clay Creek Red Clay Creek @ Lancaster Pike (Rt. 48) 142 -- -- 141 -
0.005 95 142 -0.0978 90
103041 Red Clay Creek Red Clay Creek @ Barley Mill Rd. (Rd. 258A)
115 -- -- 114 -0.010
95 115 -0.2505 98
103061 Red Clay Creek Burroughs Run @ Creek Rd. (Rt. 82) 115 -
0.017 90 114 -- -- 116 -0.1187 98
104011 Brandywine Creek
Brandywine Creek @ Foot Bridge in Brandywine Park 114 -- -- 113 -
0.002 90 114 -0.0694 --
104021 Brandywine Creek
Brandywine Creek @ New Bridge Rd. (Rd. 279) 143 -
0.019 95 142 -- -- 143 0 --

48 | P a g e Delaware NPS Program
2015 Annual Report
Station Watershed Station Location Total
N count
Total N
Trend Total N
Confidence
Total P
Count
Total P
trend Total P
Confidence TSS
Count TSS
Trend TSS
Confidence
104051 Brandywine Creek
Brandywine Creek @ Smith Bridge Rd. (Rd. 221) 113 -- -- 111 -- -- 113 -0.2003 95
105031 White Clay Creek
White Clay Creek @ Chambers Rock Rd. (Rd. 329) 114 -- -- 113 -
0.005 95 115 -0.3199 98
105151 White Clay Creek
White Clay Creek @ Delaware Park Blvd. 144 -- -- 142 -
0.002 90 144 -0.0949 --
105171 White Clay Creek
White Clay Creek @ McKees Lane 96 -- -- 94 -- -- 96 -0.2606 --
106021 Christina River Christina River beneath Rt. 141 Bridge 105
-0.046 95 105 -- -- 105 -0.5993 95
106031 Christina River Smalleys Dam Spillway @ Smalleys Dam Rd. 108 -- -- 106 -- -- 108 -0.1913 --
106141 Christina River Christina River @ Sunset Lake Rd. (Rt. 72) 135 -
0.046 98 132 -- -- 135 -0.3515 98
106191 Christina River Christina River @ Nottingham Rd. (Rt. 273) 108 -- -- 103 -- -- 108 0 --
106281 Christina River Little Mill Creek @ DuPont Rd. 108 -
0.049 95 104 -- -- 108 -0.2813 98
106291 Christina River Christina River near Conrail Bridge 124 -
0.030 95 124 -0.001 90 124 -0.3691 --
107011 Red Lion Creek Red Lion Creek @ Bear Corbitt Rd. (Rt. 7) 105 -
0.027 98 104 -- -- 105 -0.1792 98 107031 Red Lion Creek Red Lion Creek @ Rt. 9 103 -- -- 102 0.004 95 103 -0.5605 --
108021 Chesapeake &
Delaware Canal
C & D Canal @ DuPont Pkwy. (Rt. 13) N. side
102 -- -- 101 -- -- 102 0.5151 --

49 | P a g e Delaware NPS Program
2015 Annual Report
Station Watershed Station Location Total
N count
Total N
Trend Total N
Confidence
Total P
Count
Total P
trend Total P
Confidence TSS
Count TSS
Trend TSS
Confidence
108111 Chesapeake &
Delaware Canal Lums Pond @ Boat Ramp
97 -0.023 95 108 -- --
-- -- --
109041 Appoquinimink River
Appoquinimink River @ DuPont Pkwy. (Rt. 13) 101
-0.051 95 103 -- -- 104 -0.1259 --
109071 Appoquinimink River
Drawyer Creek off Rt. 13 @ parking area 103 -
0.047 95 103 -- -- 104 -0.8321 --
109091 Appoquinimink River
Appoquinimink River @ Mouth 104 -
0.022 95 103 -- -- 104 0.111 --
109121 Appoquinimink River
Appoquinimink River @ Silver Run Rd. (Rt. 9) NE 103 -
0.026 95 102 -0.002 80 103 -1.217 95
109131 Appoquinimink River
Noxontown Pond @ Noxontown Rd. (Rd. 38) 96 -
0.020 90 102 -0.001 90 104 -0.1677 --
109171 Appoquinimink River
Appoquinimink River @ MOT Gut (west bank) 94 -
0.022 95 95 -- -- 96 -0.1207 --
109191 Appoquinimink River
Shallcross Lake @ Shallcross Lake Rd. (Rd. 428) 103 -
0.073 95 101 -- -- 103 0 --
109251 Appoquinimink River
Deep Creek Branch @ Summit Bridge Rd. (Rt. 71) 86 -
0.222 98 84 -- -- 85 0 --
110011 Appoquinimink River
Blackbird Creek @ Blackbird Station Rd. (Rd. 463) 95 -
0.028 90 97 -- -- 98 0 --
110031 Lower Blackbird
Blackbird Creek @ Blackbird Landing Rd. (Rd. 455) 60 -- -- 66 0.005 90 66 -0.4215 --
110041 Lower Blackbird
Blackbird Creek @ Taylors Bridge Rd. (Rt. 9) 101
-0.040 95 99 -- -- 101 -0.8024 --
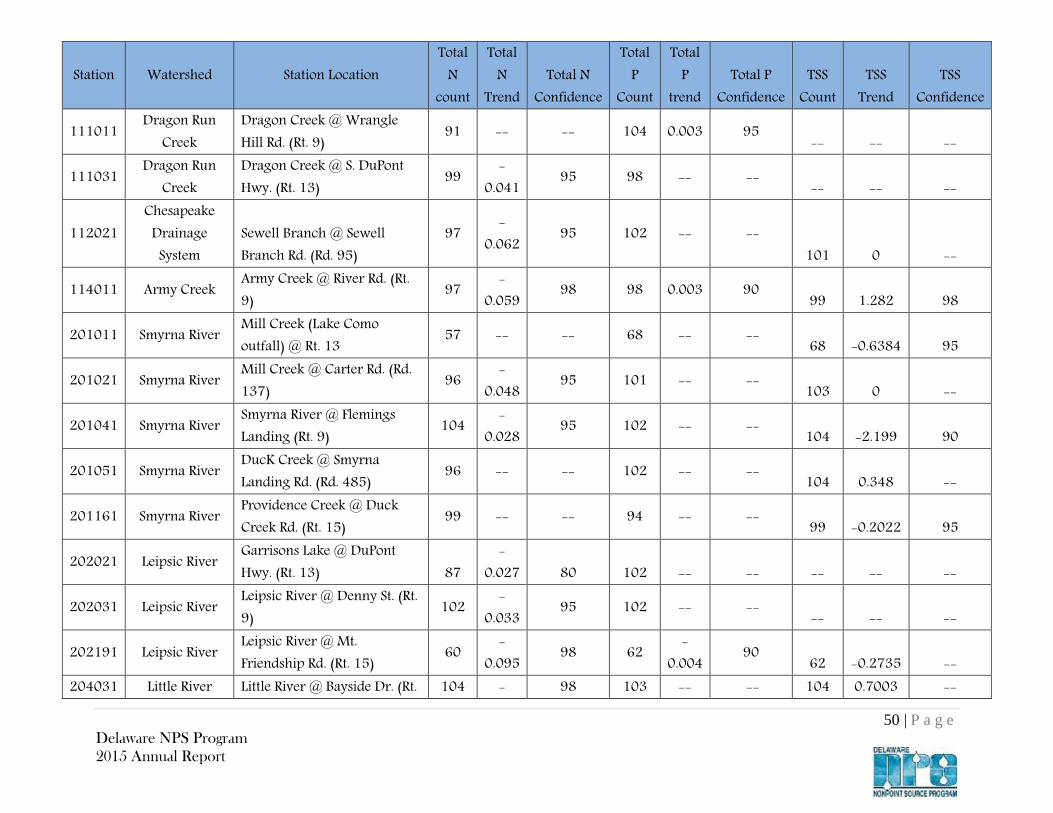
50 | P a g e Delaware NPS Program
2015 Annual Report
Station Watershed Station Location Total
N count
Total N
Trend Total N
Confidence
Total P
Count
Total P
trend Total P
Confidence TSS
Count TSS
Trend TSS
Confidence
111011 Dragon Run Creek
Dragon Creek @ Wrangle Hill Rd. (Rt. 9) 91 -- -- 104 0.003 95 -- -- --
111031 Dragon Run Creek
Dragon Creek @ S. DuPont Hwy. (Rt. 13) 99 -
0.041 95 98 -- -- -- -- --
112021 Chesapeake
Drainage System
Sewell Branch @ Sewell Branch Rd. (Rd. 95)
97 -0.062 95 102 -- --
101 0 --
114011 Army Creek Army Creek @ River Rd. (Rt. 9) 97 -
0.059 98 98 0.003 90 99 1.282 98
201011 Smyrna River Mill Creek (Lake Como outfall) @ Rt. 13 57 -- -- 68 -- -- 68 -0.6384 95
201021 Smyrna River Mill Creek @ Carter Rd. (Rd. 137) 96 -
0.048 95 101 -- -- 103 0 --
201041 Smyrna River Smyrna River @ Flemings Landing (Rt. 9) 104 -
0.028 95 102 -- -- 104 -2.199 90
201051 Smyrna River DucK Creek @ Smyrna Landing Rd. (Rd. 485) 96 -- -- 102 -- -- 104 0.348 --
201161 Smyrna River Providence Creek @ Duck Creek Rd. (Rt. 15) 99 -- -- 94 -- -- 99 -0.2022 95
202021 Leipsic River Garrisons Lake @ DuPont Hwy. (Rt. 13) 87
-0.027 80 102 -- -- -- -- --
202031 Leipsic River Leipsic River @ Denny St. (Rt. 9) 102 -
0.033 95 102 -- -- -- -- --
202191 Leipsic River Leipsic River @ Mt. Friendship Rd. (Rt. 15) 60 -
0.095 98 62 -0.004 90 62 -0.2735 --
204031 Little River Little River @ Bayside Dr. (Rt. 104 - 98 103 -- -- 104 0.7003 --

51 | P a g e Delaware NPS Program
2015 Annual Report
Station Watershed Station Location Total
N count
Total N
Trend Total N
Confidence
Total P
Count
Total P
trend Total P
Confidence TSS
Count TSS
Trend TSS
Confidence 9) 0.043
204041 Little River Little River @ N. Little Creek Rd. (Rt. 8) 105 -- -- 104 -- -- 105 -0.2628 --
205011 Saint Jones River
St. Jones River @ mouth, Bowers Beach 79 -
0.076 98 80 -- -- 82 -0.5981 --
205041 Saint Jones
River St. Jones River @ Barkers Landing 105
-0.025 95 104 -- -- 101 -2.113 95
205091 Saint Jones River
St. Jones River @ East Lebanon Rd. (Rt. 10) 100 -
0.067 95 101 -- -- 101 -1.491 98
205151 Saint Jones River
Fork Branch @ State College Rd. (Rd. 69) 92 -
0.021 90 99 -0.003 80 99 -0.2912 98
205181 Saint Jones River
Moores Lake @ S. State St. (Rd. 27) 100 -- -- 101 0.001 95 101 -0.126 --
205191 Saint Jones River
Silver Lake @ Spillway (Dover City Park) 104 -- -- 128 0.001 80 129 -0.1408 --
205211 Saint Jones River
Derby Pond @ Boat Ramp (Rt. 13A) 94 -- -- 99 0.001 95 99 0 --
206011 Murderkill River Murderkill River @ Rt. 13 168 -- -- 165 -- -- 168 -0.1614 95
206041 Murderkill
River Browns Branch @ Milford-Harrington Hwy. (Rt. 14) 138
-0.219 98 136 -- -- 138 -0.2408 98
206091 Murderkill River
Murderkill River @ Bay Rd. (Rt. 1/113) 134 -
0.028 80 132 -0.005 95 134 -1.705 95
206101 Murderkill River
Murderkill River @ Bowers Beach Wharf (mouth) 148 -
0.020 80 153 -- -- 153 -2.484 95

52 | P a g e Delaware NPS Program
2015 Annual Report
Station Watershed Station Location Total
N count
Total N
Trend Total N
Confidence
Total P
Count
Total P
trend Total P
Confidence TSS
Count TSS
Trend TSS
Confidence
206141 Murderkill River
Murderkill River near levee @ MNWA (RM 3.25) 124 -- -- 123 -
0.007 98 124 -1.906 95
206231 Murderkill River
Murderkill Rv. @ confl. of KCWWTF discharge ditch 123 -
0.038 90 121 -0.006 80 123 -1.594 95
206361 Murderkill River
McColley Pond @ Canterbury Rd. (Rt. 15) 138 -- -- 136 0.001 95 138 0 --
206451 Murderkill River
Coursey Pond @ Canterbury Rd. (Rt. 15) 129 0.031 80 134 -- -- 136 -0.4087 95
206561 Murderkill River
Double Run @ Barratts Chapel Rd. (Rd. 371) 135
-0.080 95 134 0.002 90 135 0.4632 80
207021 Choptank Cow Marsh Creek @ Mahan Corner Rd. (Rd. 208) 99 -- -- 99 0.001 90 99 0 --
207081 Choptank Tappahanna Ditch @ Sandy Bend Rd. (Rd. 222) 98 -
0.020 80 101 0.002 80 101 0 --
207091 Choptank Culbreth Marsh Ditch @ Shady Bridge Rd. (Rd. 210) 102 0.031 95 102 -- -- 102 -0.0905 --
207111 Choptank White Marsh Br. @ Cedar Grove Church Rd. (Rd. 268) 100 0.100 98 100 -- -- 100 -0.0412 80
208021 Mispillion River Mispillion River @ Rt. 1 107 -- -- 106 -
0.171 80 107 -1.134 95
208061 Mispillion River
Mispillion River @ Cedar Creek confluence 103 -
0.036 95 110 -- -- 110 -1.485 80
208181 Mispillion River
Abbotts Pond @ Abbotts Pond Rd. (Rd. 620) 109 -- -- 104 -- -- 108 0 --
208211 Mispillion River Silver Lake @ Maple Ave. 108 -- -- 107 -- -- 109 -0.3279 95

53 | P a g e Delaware NPS Program
2015 Annual Report
Station Watershed Station Location Total
N count
Total N
Trend Total N
Confidence
Total P
Count
Total P
trend Total P
Confidence TSS
Count TSS
Trend TSS
Confidence
208231 Mispillion River
Beaverdam Branch @ Deep Grass Ln. (Rd. 384) 110 0.053 98 106 -- -- 109 -0.237 95
301021 Cedar Creek Swiggetts Pond @ Cedar Creek Rd. (Rt. 30) 108 0.031 80 104 -- -- 107 -0.1727 95
301031 Cedar Creek Cedar Creek @ Coastal Hwy. (Rt. 1) 110 -- -- 109 0.004 95 109 0.3437 --
301091 Cedar Creek Cedar Creek @ Cedar Beach Rd. (Rt. 36) 108 -
0.031 95 106 -- -- 109 -0.8542 --
302031 Marshyhope Creek
Marshyhope Creek @ Fishers Bridge Rd. (Rd. 308) 185 -- -- 185 -- -- 186 0 --
303011 Broadkill River Savannah Ditch @ Savannah Drive (Rd. 246) 103 -
0.416 90 102 -- -- 102 0 --
303021 Broadkill River Ingram Branch @ Gravel Hill Rd. (Rd. 248) 104 0.154 80 103 0.015 95 -- -- --
303031 Broadkill River Broadkill River @ Union St (Rt. 5) 136 -
0.063 95 133 -- -- 135 0 --
303041 Broadkill River Broadkill River @ Rt. 1 Bridge 104 -0.058 95 103 0.002 80 103 -0.792 --
303051 Broadkill River Red Mill Pond @ Rt. 1 96 -- -- 103 -0.003 95 103 -0.7305 95
303061 Broadkill River Broadkill River 0.10 Miles From Mouth 81 -- -- 85 -- -- 87 0 --
303171 Broadkill River Beaverdam Creek @ Cave Neck Rd. (Rd. 88) 105 -- -- 103
-0.003 95 104 0 --
303181 Broadkill River Beaverdam Creek @ Carpenter Rd. (Rd. 259) 103 -
0.266 98 100 -0.010 95 102 -0.3657 98

54 | P a g e Delaware NPS Program
2015 Annual Report
Station Watershed Station Location Total
N count
Total N
Trend Total N
Confidence
Total P
Count
Total P
trend Total P
Confidence TSS
Count TSS
Trend TSS
Confidence
303311 Broadkill River Round Pole Branch @ Cave Neck Rd. (Rd. 88) 103 0.044 80 101 -- -- 102 0 --
303331 Broadkill River Waples Pond @ Rt. 1 105 -- -- 101 -- -- 104 0 --
303341 Broadkill River Pemberton Branch @ Gravel Hill Rd. (Rt. 30) 104 0.051 98 99 -- -- 103 -0.2019 95
304011 Nanticoke
River Nanticoke River @ Sharptown 94 -- -- 93 -- -- 95 0 --
304151 Nanticoke River
Nanticoke River @ Buoy 66 (mouth of DuPont Gut) 97 -
0.038 95 95 -- -- 97 -0.216 --
304191 Nanticoke River
Nanticoke River @ Rifle Range Rd. (Rd. 545) 183 -- -- 181 -- -- 183 -0.1827 98
304311 Nanticoke River
Concord Pond @ German Rd. (Rd. 516) 104 -- -- 101 -- -- 104 0 --
304321 Nanticoke River
Williams Pond @ East Poplar St. 101 -
0.063 80 100 -- -- 102 0 --
304381 Nanticoke River
Bucks Branch @ Conrail Rd. (Rd. 546) 91 -- -- 90 -- -- 91 0 --
304471 Nanticoke River Nanticoke River @ Rt. 13 102 -- -- 100 -- -- 102 0.2111 --
304591 Nanticoke
River Deep Creek @ Old Furnace Rd. (Rd. 46) 43
-0.007 90 43 1.162 98
304681 Nanticoke River
Nanticoke River @ Beach Hwy. (Rt. 16) 49 -- -- 49 -- -- 49 -0.2804 --
305011 Lewes and Rehoboth
Canal Lewes & Rehoboth Canal @ Rt. 1
105 -- -- 104 -- -- 106 -0.8797 98

55 | P a g e Delaware NPS Program
2015 Annual Report
Station Watershed Station Location Total
N count
Total N
Trend Total N
Confidence
Total P
Count
Total P
trend Total P
Confidence TSS
Count TSS
Trend TSS
Confidence
305041 Lewes and Rehoboth
Canal Lewes & Rehoboth Canal @ Rt. 9
104 -- -- 104 -- -- 106 -0.6095 95
306091 Rehoboth Bay Rehoboth Bay @ Buoy 7 80 -0.015 98 95 -- -- 97 -0.8721 98
306111 Rehoboth Bay Massey Ditch @ Buoy 17 87 -- -- 104 0.001 90 106 -0.9137 98
306121 Indian River Indian River Bay @ Buoy 20 102 -- -- 116 0.002 95 119 -0.8166 95
306181 Indian River Indian River @ Buoy 49 (Swan Creek) 95 -
0.054 95 95 -- -- 97 0.3747 --
306321 Indian River Indian River Inlet @ Coast Guard Station 114
-0.016 98 123 -- -- 125 -0.2767 --
306331 Indian River Indian River @ Island Creek 96 -0.032 95 94 -- -- 96 -0.6217 80
306341 Indian River Island Creek upper third 95 -- -- 93 -- -- 95 -0.6645 80
307011 Broad Creek Records Pond @ Willow Street 103 -
0.045 95 101 0.001 90 103 0 --
307031 Broad Creek Broad Creek @ Bethel Rd. (Rd. 493) 47 0.157 80 47 0.005 95 47 2.607 95
307081 Broad Creek Hitch Pond Branch @ Pepper Pond Rd. (Rd. 449) 44 -- -- 49 -- -- 49 0.2381 --
307171 Broad Creek Horsey Pond @ Sharptown Rd. (Rt. 24) 98 -
0.076 90 98 -- -- 100 0 --
307371 Broad Creek Raccoon Prong @ Pepperbox Rd. (Rd. 66) 62 -- -- 66 -- -- 65 0 --

56 | P a g e Delaware NPS Program
2015 Annual Report
Station Watershed Station Location Total
N count
Total N
Trend Total N
Confidence
Total P
Count
Total P
trend Total P
Confidence TSS
Count TSS
Trend TSS
Confidence
308031 Rehoboth Bay Burton Pond @ John Williams Hwy. (Rt. 24 ) 104 -- -- 104 -- -- 107 0 --
308051 Rehoboth Bay Guinea Creek @ Banks Rd. (Rd. 298) 107 -
0.104 95 104 0.001 80 107 -0.2523 80
308071 Indian River Millsboro Pond @ John Williams Hwy. (Rt. 24) 143
-0.067 95 141 0.001 98 143 0.06214 90
308091 Indian River Pepper Creek @ Main St. (Rt. 26) 109 -
0.050 95 107 0.001 95 109 0.1428 --
308281 Indian River Cow Bridge Branch @ Zoar Rd. (Rd. 48) 103 -
0.076 95 107 0.001 90 108 0 --
308341 Indian River Swan Creek @ Mount Joy Rd. (Rd. 297) 103 -- -- 96 -- -- 103 0 --
308361 Indian River Blackwater Creek @ Omar Rd. (Rd. 54) 97 -
0.133 95 97 -- -- 99 -0.099 --
308371 Rehoboth Bay Bundicks Branch @ Beaver Dam Rd. (Rt. 23) 94 0.212 95 94 -- -- 94 -0.1164 80
309041 Iron Branch Whartons Branch @ Dagsboro Rd. (Rt. 20) 107 -
0.106 95 106 -0.001 95 107 -0.4364 95
310011 Little
Assawoman Bay
Little Assawoman Bay @ Rt. 54 (The Ditch)
94 -0.023 95 106 -- --
109 -0.8528 95
310031 Little
Assawoman Bay
Dirickson Creek @ Old Mill Bridge Rd. (Rd. 381)
100 -0.068 95 105 -- --
107 -0.9807 95
310071 Little Assawoman
Little Assawoman Bay Mid-Bay (Ocean Park Lane) 98 -
0.049 95 105 -0.002 95 108 -1.281 95

57 | P a g e Delaware NPS Program
2015 Annual Report
Station Watershed Station Location Total
N count
Total N
Trend Total N
Confidence
Total P
Count
Total P
trend Total P
Confidence TSS
Count TSS
Trend TSS
Confidence Bay
310121 Little
Assawoman Bay
Beaver Dam Ditch @ Beaver Dam Rd. (Rd. 368) 124
-0.143 95 121 0.001 90 124 -0.1183 80
311041 Buntings Branch
Buntings Branch @ Fenwick Rd. (Rt. 54) 99 -- -- 99 -- -- 100 0 --
312011 Indian River White Creek @ mouth of Assawoman Canal 103 -
0.041 98 106 -0.002 95 108 -1.398 95
313011 Pocomoke River
Pocomoke River @ Bethel Rd. (Rd. 419) 97 -- -- 101 -- -- 101 0 --
316011 Nanticoke River
Gravelly Branch @ Coverdale Rd. (Rd. 525) 106 -- -- 101 -- -- 106 0 --
316031 Nanticoke River
Gravelly Branch @ Deer Forest Rd. (Rd. 565) 53 -
0.036 80 53 -- -- 53 -0.0384 --
401011 Delaware Bay Roosevelt Inlet Mouth 99 -- -- 109 -- -- -- -- --

58 | P a g e Delaware NPS Program
2015 Annual Report
Appendix E – Bridgeville Branch fact sheet

59 | P a g e Delaware NPS Program
2015 Annual Report
Appendix F – Air Seeder Summary
Sussex Conservation District
Air Seeder Program Summary
The Air Seeder – Establishing Cover Crops Early to Improve Water Quality and Soil Health
The Sussex Conservation District recently purchased an air seeder to help farmers in the early
establishment of cover crops. The technology of the Miller Nitro with a 90 ft. boom equipped with a
specialized seed box allows the farmer to plant cover crops while their cash crop is still in the field. The
air seeder drops seed below the canopy allowing for better seed to soil contact and more even seed
distribution. By planting early, the cover crop benefits from the longer growing degree days during the
summer, therefore getting a better established crop to improve water quality and soil health.
A pilot program was created enrolling more than 20 interested farmers which began planting in late July
and ran through mid-October. The pilot included a $60 per acre incentive for using the air seeder which
is a $10 increase over regular early planted cover crops. There was no fee for using the air seeder but the
farmer was responsible for purchasing and loading the seed as well as the fuel. The District partnered on
this project with Buckeye Soil Solutions of Ada, Ohio who modified the Miller Nitro with the specialized
seed box and distribution system which they built. Southern States Coop – Dagsboro Store also
partnered on this project by providing an operator for the air seeder.
The District’s goal was to plant 4,000 acres of cover crops in the first year into standing corn, soybeans,
sorghum, and vegetables. The program was a success with 4,017.6 acres planted. Total acres of planted
cover crops are up 21.3% this year compared to last year with a total of over 39,355 acres planted
countywide. Especially notable was the 33.8% increase in cover crop acres planted in the Chesapeake
Bay Watershed in Sussex County. This increase can be attributed to the District’s Soil Health outreach
effort and the implementation of the air seeder. The additional cover crop acres will help Delaware's
farmers get increased nutrient load reductions in the Chesapeake Bay Watershed Model. These reductions
help Delaware work towards reducing their nutrient and sediment loads as outlined in the Chesapeake
Bay Watershed Implementation Plan (WIP) and help meet Delaware’s Total Maximum Daily Loads
(TMDL) goals and milestones.
To encourage participation in the air seeder pilot program, SCD offered an additional $10 per acre
incentive. The concern was that producers may be hesitant to run the air seeder through their cash crop.

60 | P a g e Delaware NPS Program
2015 Annual Report
This is a new technology in the region and we needed a few willing early adopters to give it a try. The
air seeder was featured in the Sussex Conservation District’s newsletter, Crossroads, in May which
sparked a lot of interest (article attached). By early July we had surpassed our goal of 4,000 acres
enrolled. In August, The Delmarva Farmer ran an article in their special section “New Technology.”
Here is a link to the article entitled Air seeder plants cover crops before corn harvest.
In early September, a WTOL-11 television news team from Toledo, Ohio came to Delaware and
Maryland to learn about what both states are doing to help improve water quality in the Chesapeake Bay.
They featured the air seeder during their visit to Delaware. They created a three part series and the
following link is part 2 How Delaware is Helping Clean Up the Chesapeake Bay.
Below are pictures of the air seeder. The District has received positive feedback from program
participants and we are anticipating an increase in demand for 2016. The additional acres and early
establishment of cover crops will help improve water quality and soil health in the region.
The cost of the air seeder was $275,000. Buckeye Soil Solutions discounted the cost of the machine
$75,000, bringing the total cost to the District to $200,000.

61 | P a g e Delaware NPS Program
2015 Annual Report
Appendix G – Air Seeder Fact Sheet

62 | P a g e Delaware NPS Program
2015 Annual Report
Appendix H - Mirror Lake Restoration Fact Sheet