2015 annual report - impa.com · pdf fileknowledge base of member employees. ... electrostatic...
TRANSCRIPT

INDIANA MUNICIPAL POWER AGENCY
2015 Annual Report
LEADING THE WAY
The Evolution of
POWER

ENERGY
IMPA Bainbridge Solar Park, Bainbridge, IndianaC O N T E N T S Message to Members 1
The Evolution of Power 3
Evolution of Technology 9
Evolution of an Agency 10
Evolution of Communities 11
IMPA Member Communities 14
Board of Commissioners & IMPA Senior Management 16
Financial Highlights 20

in transition

I M PA 2015 annual report 1I M PA 2015 annual report 1
People often say the only constant in life is change. The same can be said for electricity and the utility industry. While Thomas Edison is credited with mastering the incandescent lightbulb and opening the first electric utility in the late 1870s, making electric light and power available to the masses, he was most certainly not the first to tackle the idea. Electricity, and harnessing it to produce light and energy, had already been through many iterations prior to Edison’s success. Whether it was the evolution of man during the Stone Age, the onset of the industrial revolution, or the transformation of society due to technology in the 21st century, evolution, revolution and transformation are an integral part of our history. At the same time, electricity is one constant that continues to significantly impact our daily lives. It remains a great value – a resource used every day that touches everything we do. If it were not for electricity, so many staple needs of today – lights, machines, computers, the internet – would not exist.
The Indiana Municipal Power Agency (IMPA) has led the way in evolution and transformation in the energy industry, and most certainly in Indiana’s municipal electric communities. As we look back at 2015, we see that this year was no exception. We witnessed changes in our power portfolio, in our facilities, in our services and within our member cities and towns. We accomplished great feats as an Agency and together with our member communities to better prepare them for the future. Despite all of the change, there were some things
that remained the same: our dedication to our members, our reliable service and the intrinsic value of our Agency and our member municipal electric utilities. No matter the evolution of other areas, these remain the same. This year highlighted the many reasons to be proud of our public power heritage, while embracing and welcoming changing industries, technologies, communities and times.
IMPA achieved a great number of transformations in 2015 that promise to lead the way for our future. While we have traditionally relied on coal-fired generation to support our wholesale power supply to member communities, coal no longer dominates the electric industry. The end of the coal era is approaching as economic and environmental concerns, coupled with advanced technology, are paving the way for other resources. In particular, the advent of horizontal drilling and fracking technologies has made stores of natural gas more easily accessible, creating an abundant supply of the resource while dropping its price. IMPA is embracing this change, looking for opportunities where advanced technologies or access to renewable and natural gas resources make sense in our diverse power portfolio.
In 2015, IMPA continued to incorporate renewable resources into our portfolio. Adding solar parks in six member communities was just another step in our efforts to construct a solar park in every member community served by IMPA. Additionally, we continue to look for other opportunities
Message to Members
Raj Rao President and CEO
Sue Saunders Chairwoman of the Board

to obtain cost-effective and environmentally-responsible power sources that support our efforts to expand our low and no-carbon resources. While IMPA uses natural gas as fuel for our peaking resources in our current portfolio, advances in technology make it a more viable solution for baseload generation in the future.
Chief among the successes we celebrated this year were stable wholesale rates for our municipal utilities. Our accrued costs to members actually saw a 1% decrease over 2014, a testament to IMPA’s financial stability and our continued dedication to providing members with a low-cost power supply.
Providing advanced services and our growing number of member communities fueled the need for IMPA to expand its meeting facilities. In August of 2015, we celebrated the completion of the new IMPA Conference Center. The facility has already proven to be a valuable resource to the Agency and our member communities. In addition to providing much needed meeting space for IMPA’s Board of Commissioners,
the Conference Center has already hosted a large number of meetings, conferences and workshops designed to grow the knowledge base of member employees.
Several member communities also experienced defining moments in 2015 that promise to transform their economic and community environments. Chief among those were investment announcements, company expansions, and community award designations. While 2015 was a stellar year for our communities, we know their efforts will lead to even bigger things to come.
The path we travel is never easy, yet we have found ways to evolve and adjust to our trials. Just as Edison faced challenges head on and persevered, so have we learned to adapt and press forward, each time finding more success than before. As we face 2016, we are reinvigorated with the desire to create a tidal wave of transformation in the power industry, leading the way for our member communities and their customers.
IMPA Senior Vice President of Generation Jack Alvey speaks to students of Bainbridge Elementary School in Bainbridge, Indiana at the ribbon cutting for the IMPA solar park in their community.

While IMPA has utilized coal as its primary fuel source to generate power for nearly 35 years, the history of coal dates back much further, having played an integral role in the landscape of electricity generation for over a century. Gaining popularity in the 1800s during the Industrial Revolution, coal was used to fuel steamships and locomotives, as well as provide power to the many factories and mills throughout the country. Over the next hundred years, the coal industry served as a major employer in the United States, due to the fact that coal was needed by virtually every state to provide power to its residents, businesses and industries.
IMPA’s mission to provide low-cost, reliable power to municipally-owned electric utilities throughout the State of Indiana placed coal at the forefront of its electricity generation from the beginning. IMPA began its strategy of investing in asset ownership of large, efficient generation units with the latest environmental control technology in 1982, when the Agency purchased a 156 megawatt (MW) share of Gibson Station Unit 5. In the 1990s, IMPA added 66 MW of coal-fired generation from Trimble County Unit 1 (TC1), located across the Ohio River from Indiana in northern Kentucky. While Gibson 5 was one of the first units equipped with a sulfur dioxide (SO2) flue gas desulfurization (scrubber), Trimble County 1 had an even more efficient scrubber. Fifteen years later, IMPA exercised its rights as a partner in TC1 to participate in Trimble County 2 (TC2), which entered service in early 2011. Improvements in both combustion and environmental control capabilities from TC1 meant TC2’s high temperature and high pressure supercritical design make it one the lowest emitting and efficient units in the country.
IMPA continued to expand its asset ownership in 2012 when it joined with a group of nine owners participating in the Prairie State Energy Campus. Prairie State’s ownership is unique in that it is comprised of 95 percent joint action agencies like IMPA and rural electric cooperatives. Prairie State is a mine mouth plant that includes a thirty year supply of coal reserves. Since the fuel reserves and coal mine are owned by the participating agencies, no shipping costs are incurred in acquiring fuel for the plant, making Prairie State the lowest fuel cost coal plant east of the Mississippi River.
IMPA’s coal-fired generation units – Trimble County Units 1 and 2, Gibson Station Unit 5, the Prairie State Energy Campus and Whitewater Valley Station – continued to serve as the core of IMPA’s power supply in 2015. They have reliably provided a baseload energy source that, along with certain purchased power agreements, meets the power supply needs of IMPA’s 60 communities. In total, these units supply over 600 MW of capacity to IMPA’s members.
The Prairie State Energy Campus experienced a stellar year of operations in 2015, achieving record performance on both of its units and reaching several significant station and unit milestones. The 1,600 MW plant utilizes clean generation technologies to produce electricity in a more efficient and environmentally responsible manner. Since the coal used to power Prairie State is derived from the adjacent underground mine, the carbon dioxide emissions associated with transporting coal from elsewhere are avoided. Coupled with the plant’s ultra-efficient design, Prairie State’s carbon dioxide emissions are significantly less than the typical U.S. coal plant.
The Evolution of
PowerI M PA 2015 annual report 3
I M PA 2015 annual report4
S S
Prairie State continued to see improvement in its operations as the year progressed. Even with planned maintenance outages in the spring, Unit 1 obtained an availability factor of 82.2 percent for the year, while Unit 2 saw an availability factor of 79.5 percent. Subsequent to the planned maintenance outages, Units 1 and 2 jointly had an average availability factor of 92 percent from June through December. Prairie State’s
member owners are public power utilities throughout the Midwest who provide an affordable and reliable power supply to their member communities. As community-owned utilities, they focus on ensuring reliable electricity at a reasonable cost with the utmost protection of the environment. Prairie State supplies approximately 200 MW of power to IMPA’s member communities and is one of the cleanest coal-fired power plants in the nation.
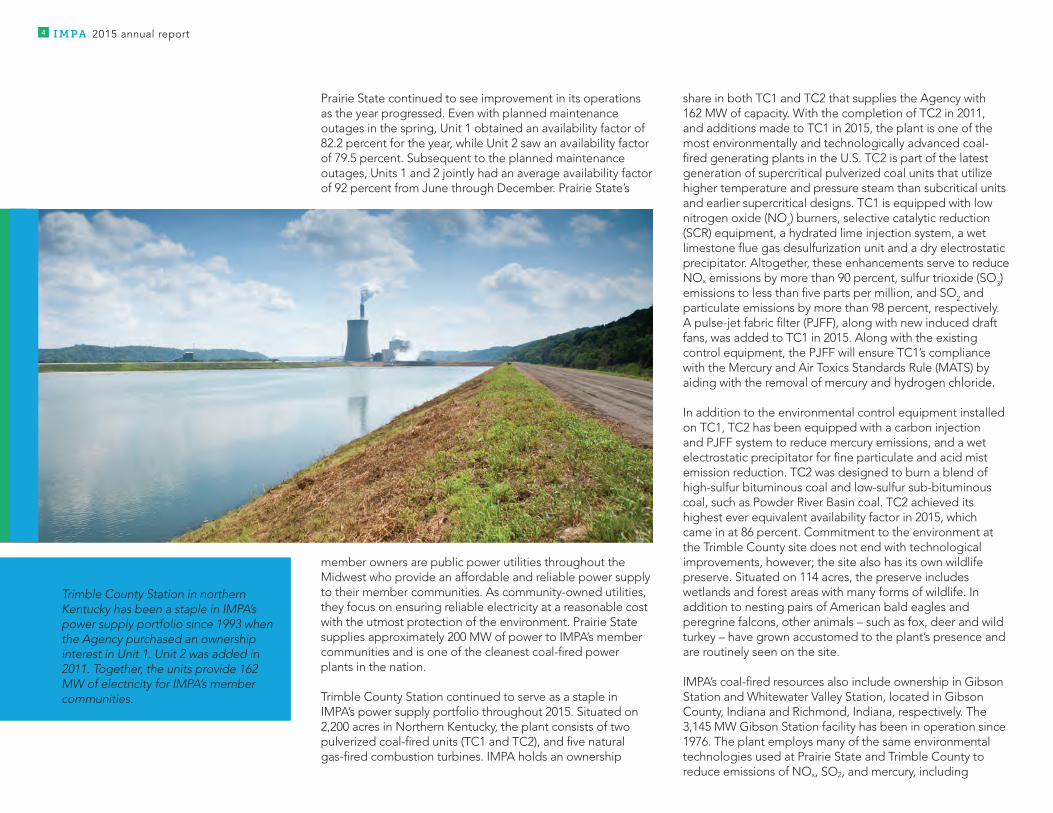
Trimble County Station continued to serve as a staple in IMPA’s power supply portfolio throughout 2015. Situated on 2,200 acres in Northern Kentucky, the plant consists of two pulverized coal-fired units (TC1 and TC2), and five natural gas-fired combustion turbines. IMPA holds an ownership
share in both TC1 and TC2 that supplies the Agency with 162 MW of capacity. With the completion of TC2 in 2011, and additions made to TC1 in 2015, the plant is one of the most environmentally and technologically advanced coal-fired generating plants in the U.S. TC2 is part of the latest generation of supercritical pulverized coal units that utilize higher temperature and pressure steam than subcritical units and earlier supercritical designs. TC1 is equipped with low nitrogen oxide (NOx) burners, selective catalytic reduction (SCR) equipment, a hydrated lime injection system, a wet limestone flue gas desulfurization unit and a dry electrostatic precipitator. Altogether, these enhancements serve to reduce NOx emissions by more than 90 percent, sulfur trioxide (SO3) emissions to less than five parts per million, and SO2 and particulate emissions by more than 98 percent, respectively. A pulse-jet fabric filter (PJFF), along with new induced draft fans, was added to TC1 in 2015. Along with the existing control equipment, the PJFF will ensure TC1’s compliance with the Mercury and Air Toxics Standards Rule (MATS) by aiding with the removal of mercury and hydrogen chloride.
In addition to the environmental control equipment installed on TC1, TC2 has been equipped with a carbon injection and PJFF system to reduce mercury emissions, and a wet electrostatic precipitator for fine particulate and acid mist emission reduction. TC2 was designed to burn a blend of high-sulfur bituminous coal and low-sulfur sub-bituminous coal, such as Powder River Basin coal. TC2 achieved its highest ever equivalent availability factor in 2015, which came in at 86 percent. Commitment to the environment at the Trimble County site does not end with technological improvements, however; the site also has its own wildlife preserve. Situated on 114 acres, the preserve includes wetlands and forest areas with many forms of wildlife. In addition to nesting pairs of American bald eagles and peregrine falcons, other animals – such as fox, deer and wild turkey – have grown accustomed to the plant’s presence and are routinely seen on the site.
IMPA’s coal-fired resources also include ownership in Gibson Station and Whitewater Valley Station, located in Gibson County, Indiana and Richmond, Indiana, respectively. The 3,145 MW Gibson Station facility has been in operation since 1976. The plant employs many of the same environmental technologies used at Prairie State and Trimble County to reduce emissions of NOx, SO2, and mercury, including
Trimble County Station in northern Kentucky has been a staple in IMPA’s power supply portfolio since 1993 when the Agency purchased an ownership interest in Unit 1. Unit 2 was added in 2011. Together, the units provide 162 MW of electricity for IMPA’s member communities.
precipitators, scrubbers, low NOx burners, SCR and flue gas desulfurization. Gibson Station is also home to the Cane Ridge Wildlife Area, one of the Midwest’s most successful conservation efforts. IMPA and the other Gibson Station owners donated 463 acres of land to the United States Fish and Wildlife Service to provide a natural habitat for waterfowl and other wildlife.
In 2014, IMPA acquired operational control of the Whitewater Valley Station (WWVS) in Richmond, Indiana. IMPA member utility Richmond Power and Light, faced with closing WWVS due to impending environmental regulations, chose to transfer control to IMPA. With IMPA assuming control, the plant could continue providing a reliable power supply to the residents of the community while simultaneously supplementing IMPA’s power portfolio. WWVS consists of two sub-critical, pulverized coal-fired units and is equipped with both a dry electrostatic precipitator and a PJFF. The station’s first unit has a nominal generating capacity of 35 MW and the second unit has a capacity of 65 MW. In 2015, IMPA added a carbon injection and sorbent injection system for compliance with the MATS rule. Since acquiring operational control, the station has been utilized by IMPA during peak load periods during the hot summer and cold winter months.
Coal fired generating units have been the foundation of IMPA’s power supply, and will continue to have their place within the Agency’s power portfolio. However, in recent years, advances in new technology and changes in environmental regulations have begun to pave the way for other resources to play a larger role in electricity generation, including natural gas and renewable resources. While not renewable, natural gas is a viable fuel alternative in its own right due to its low-carbon emissions that are almost 50 percent less than coal. Natural gas is gaining in popularity, aiming to overtake coal as one of the top resources for electricity production in the United States. Hydraulic fracturing, or fracking as it is more commonly known, began to gain popularity through the 1980s and 1990s as a method to harness natural gas as a fuel source, but has recently become more efficient and affordable as technology has advanced. The process of horizontal drilling into the earth and fracturing the rock with high pressure liquid and sand to release natural gas has made the resource more easily accessible. Today, 33 states are producing or have produced natural gas, leading to an abundance of the fuel throughout the country and a competitive - and at times lower - cost in comparison to coal.
I M PA 2015 annual report 5
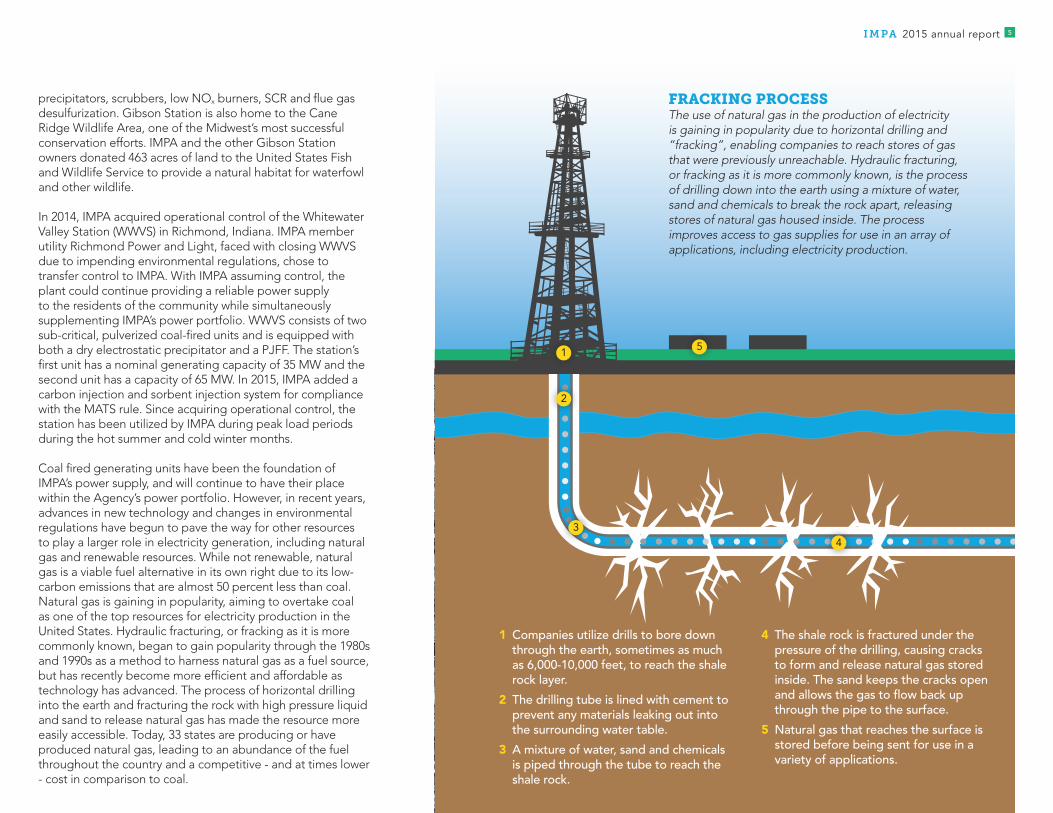
FRACKING PROCESSThe use of natural gas in the production of electricity is gaining in popularity due to horizontal drilling and “fracking”, enabling companies to reach stores of gas that were previously unreachable. Hydraulic fracturing, or fracking as it is more commonly known, is the process of drilling down into the earth using a mixture of water, sand and chemicals to break the rock apart, releasing stores of natural gas housed inside. The process improves access to gas supplies for use in an array of applications, including electricity production.
1
2
34
1 Companies utilize drills to bore down through the earth, sometimes as much as 6,000-10,000 feet, to reach the shale rock layer.
2 The drilling tube is lined with cement to prevent any materials leaking out into the surrounding water table.
3 A mixture of water, sand and chemicals is piped through the tube to reach the shale rock.
4 The shale rock is fractured under the pressure of the drilling, causing cracks to form and release natural gas stored inside. The sand keeps the cracks open and allows the gas to flow back up through the pipe to the surface.
5 Natural gas that reaches the surface is stored before being sent for use in a variety of applications.
5

IMPA’s 420 MW of natural gas generation serve to balance the Agency’s generation portfolio with a diverse mix of resources. The Agency owns three combustion turbine units in Anderson, Indiana, two in Richmond, Indiana and two in Indianapolis, Indiana. IMPA’s five dual-fuel combustion turbines rely on either fuel oil or natural gas, and are reliable generation resources to use during periods of peak electric usage. IMPA’s power supply portfolio is rounded out by nuclear energy, a no carbon resource. Approximately 14 percent of IMPA’s power supply portfolio is fueled by nuclear energy acquired through a purchased power agreement. As with all resources, the Agency continuously investigates viable sources of generation that will reliably serve its member communities with an affordable and environmentally-friendly source of power.
Building on the growing need for renewable energy sources, IMPA led the way for green energy in its member communities in 2015. The Agency’s diverse portfolio already included 50 MW of wind energy from Crystal Lake Wind Energy Center in Iowa, as well as 3 MW of solar energy IMPA constructed in 2014. The Agency added to its solar resources in 2015 as it completed construction of and energized six solar parks throughout the state, with each park ranging in size from 0.3 MW up to 3 MW. Solar installations in the communities of Argos, Bainbridge, Crawfordsville, Pendleton, Peru and Tell City joined the ranks of IMPA’s other solar parks located in Frankton, Rensselaer, and Richmond, Indiana, which were completed in 2014. In total, IMPA now owns and operates 13 MW of solar capacity throughout the state, with plans to expand even further. The Agency is already working with several communities to add approximately 10 MW of solar generation in 2016. IMPA’s goal is to install a solar park in every member community over the next several years.
IMPA had the opportunity to celebrate the opening of these parks with many of the people the solar parks serve. The Agency held ribbon cutting ceremonies marking the completion of the parks in each community. One important focus of these projects for IMPA is the fact that renewable energy sources are being installed directly within its member communities, bringing electricity generation directly to the people, businesses and industries served by IMPA’s member municipally-owned utilities.
Just as generation and the electric industry have evolved over time, so have the regulations and requirements placed upon electric utilities and wholesale power providers. Several regulatory entities are charged with ensuring the security, reliability and resiliency of electricity in the United States, including the North American Electric Reliability Corporation (NERC), the Federal Energy Regulatory Commission (FERC) and ReliabilityFirst. NERC oversees the reliability of the Bulk Electric System (BES), which is comprised of all the generation resources, transmission lines, interconnections and associated equipment in the U.S. NERC relies on several regional organizations, including ReliabilityFirst, to preserve and enhance electric service reliability and security within their specific geographic area.
IMPA is registered as a Generator Owner, Generator Operator, and Resource Planner with NERC, as the Agency is the owner of two BES generating plants located in the region that ReliabilityFirst oversees. Additionally, NERC and ReliabilityFirst partner to enforce compliance with reliability standards, which are written and voted on by the electric industry. Upon final approval from FERC, they become NERC standards that are mandatory and enforceable with potentially significant monetary fines for entities that are found non-compliant. NERC reliability standards cover a wide array of industry activities, such as modeling, planning, communications, operations, maintenance, and cyber security.
IMPA designates certain staff members as subject matter experts for each NERC standard, a designation that also includes the responsibility of maintaining compliance with the standard requirements. Throughout the year, IMPA submits information to ReliabilityFirst to show compliance to a standard, which could be in the form of a data submittal, self-certification, or spot-check. IMPA also proactively maintains an internal compliance program. As part of the internal compliance plan, an internal annual self-audit is performed on every applicable standard to IMPA, which includes spot-checking evidence or documentation to verify compliance to the standard. IMPA also uses an outside contractor to perform a gap-analysis/mock audit to verify its compliance. In addition, the Agency may voluntarily create a guideline for personnel to follow if necessary.
I M PA 2015 annual report6
IMPA owns and operates 13 MW of solar energy throughout nine member communities in Indiana. The Agency plans to add an additional 10 MW of solar energy in 2016.
0.7MW
0.3MW
3MW
1MW
2MW
3MW
1MW
1MW
ARGOS 2,700 panels approx. 7 acres
BAINBRIDGE1,350 panels approx. 3 acres
CRAWFORDSVILLE11,500 panels approx. 22 acres
FRANKTON3,888 panels approx. 14 acres
PENDLETON8,100 panels approx. 16 acres
PERU 11,500 panels approx. 23 acres
RENSSELAER3,888 panels approx. 11 acres
RICHMOND4,032 panels approx. 8 acres
TELL CITY4,050 panels approx. 10 acres
1MW

Students from Bainbridge Elementary cut the ribbon for the IMPA Bainbridge Solar Park. The park is one of six solar facilities IMPA completed in member communities throughout the state in 2015.

IMPA President and CEO Raj Rao addresses the Agency’s Board of Commissioners in the new IMPA Conference Center. The 14,000-square-foot conference center and meeting facility opened its doors in August 2015.

Over the course of 2015, IMPA improved its programs and policies to meet the additional requirements that NERC has added in the communications, operations/misoperations, cybersecurity, and protection system maintenance/testing standards. For 2016, NERC is adding further requirements to the standards in these same areas of operations that IMPA must perform. Additionally, new standards that cover the verification of generator operational models and allow the generator to stay connected to the BES during defined frequency and voltage excursions are expected to be added. As requirements and regulations continue to change and evolve, IMPA will stay abreast of those changes and do its part to help maintain the reliability and resiliency of the BES.
Even with the evolution of power throughout IMPA’s history, the Agency’s track record of being one of the lowest-cost wholesale power providers has withstood the test of time. The Agency’s diversified portfolio, lasting success and sound financial decisions continue to make the Agency a leader within the utility industry and a valuable resource for Indiana’s municipal electric communities.
While the landscape of electricity generation has changed since the days of Thomas Edison, the underlying reason has not: electricity is a valuable resource to people, businesses and industries throughout the world. In Indiana, IMPA seeks to continue the same tradition of low-cost, reliable and environmentally-responsible energy production that it has held since its inception.
Evolution of Technology:Edison’s work with the incandescent lightbulb and electricity generation was truly groundbreaking at the time. However, what makes Edison’s work even more innovative and extraordinary was that he didn’t stop with those two radical discoveries. He continued to work and improve on his creations, developing a whole suite of inventions that utilized the lightbulb technology. He went above and beyond, continuing with the evolution of the technology.
a hundred years after Edison’s lightbulb went mainstream, new technology has effectively replaced the incandescent bulb. Energy efficient lightbulbs such as compact fluorescent (CFL) and light-emitting diodes (LED) have entered onto the lighting scene, reducing energy consumption and offering alternatives to customers. Most notably, LED lights are nearly seven times more efficient than incandescents, cut energy use by more than 80 percent and can last more than 25 times longer. At first, the price of these new bulbs was cost prohibitive, but as their popularity has grown and government mandates have killed the incandescent bulb, prices are on the decline.
Historically, lighting has made up a fairly significant part of an electric utility’s load. However, as more people turn to energy efficient lighting to replace aging incandescents, electric utilities will continue to see this portion of their electric load shrink. As incandescent load diminishes with the evolution of LED lights, the industry is expected to lose approximately 10 percent of electricity demand, causing additional challenges for electric utilities and the industry. For many, the answer will be found in adjusting their rate structure to cover fixed costs. The evolution of lighting technology is upon us and is welcomed by many consumers. Municipal electric utilities are adapting to these changing times as well.
With the onset of improved lighting technology also comes the opportunity for electric utilities to reduce energy consumption and refresh lighting in their communities. In 2010, IMPA was awarded a federal Energy Efficiency and Conservation Block Grant on behalf of 20 of its member communities. The grant, given by the US Department of Energy and administered through the American Recovery and Reinvestment Act, provided $5 million to the Agency on behalf of the member communities to implement local street light retrofitting programs. Collectively, the 20 members participating in the grant program retrofitted approximately 8,500 street lights in their communities. The participating communities are estimated to save $140,000 annually as a result of the change to energy efficient lighting.
I M PA 2015 annual report 9
Five short years later, in 2015, IMPA once again facilitated the acquisition of a grant to assist member communities in installing energy efficient lighting. The communities of Dublin and Williamsport, in partnership with IMPA, were together one of seven grant recipients statewide to receive a community conservation grant from the Indiana Office of Energy Development, with additional support from the U.S. Department of Energy. These projects received a total of $38,579 to install LED streetlights in their communities. The streetlights replaced less efficient lamps, including old mercury vapor lights, thus reducing the amount of energy needed to produce the same amount of light and resulting in cost savings for the communities. IMPA worked with both Dublin and Williamsport to procure the appropriate streetlights for the community projects, worked with vendors and helped ensure that the projects were completed within the grant’s timeframe requirements. Combined, these lighting projects in 22 cities and towns throughout Indiana not only brought new, energy efficient street lights to the communities, but also served to educate residents and visitors alike about the many benefits that LED lights and streetlights can provide to a community and its residents.
Evolution of an AgencyChange has been a constant for IMPA ever since its inception, whether in the number of communities served, generation owned and operated, or even office locations.
Since 2000, IMPA’s membership has nearly doubled to the 60 communities it presently serves. IMPA’s growth combined with its changing services and member community growth during this same time period resulted in the transformation of the Agency’s headquarters to better serve the needs of its member communities. In August of 2015, IMPA completed construction of a new conference center and additional office space, christening the building with a ribbon cutting ceremony attended by many of the people that brought the vision to a reality. The new, 14,000 square-foot facility includes a state-of-the-art meeting center designed to adapt to the changing needs of member utilities and communities over time. Since its August opening, the facility has already hosted several events and meetings and welcomed nearly a thousand
visitors through its doors. The conference center will continue to see frequent use as IMPA provides workshops in a variety of areas, including customer service, engineering, lineman training and others, to support the development of member staff in member municipal utilities.
Along with increased meeting and conference space, IMPA’s new facility contains expanded office space to house the Agency’s ISC division. ISC was launched in 2001, and the group’s service offerings have grown and adapted over time, expanding to include operations and field services for member communities. The evolution and growth of ISC, IMPA’s engineering and operations arm, meant the group needed additional space to better serve Indiana’s municipal electric utilities. The expanded office space is highlighted by open offices designed to improve communication and collaboration among ISC engineers and their clients. With added storage space and meeting rooms, ISC is able to continue evolving and growing to best serve IMPA communities.
Another example of IMPA’s evolution in recent years can be found by simply looking at the officers of its Board of Commissioners. For the first time in the Agency’s history, the position of Chairperson of the IMPA Board is held by a woman. Sue Saunders, Lewisville’s representative on the IMPA Board of Commissioners, was chosen to serve as the Chair of the IMPA Board beginning in 2015. It is also notable that the IMPA member community Chairwoman Saunders represents is among IMPA’s smallest members. While over the years other representatives from smaller communities have also served as the Chair of the IMPA Board, it highlights the level of involvement of all IMPA member communities, no matter their load size or number of customers served.
Change has punctuated IMPA’s development through the years, but the Agency’s fiscal responsibility stands the test of time. IMPA is consistently rated A+/A1 by rating agencies, a sign that the Agency does its part to protect the security of its investments and its member communities. IMPA also proactively seeks opportunities to bring savings to member communities when it can. In December, IMPA and its Board of Commissioners approved the refunding of approximately
I M PA 2015 annual report10

I M PA 2015 annual report 11
$429 million of the Agency’s tax-exempt bonds. The bond refundings will result in a reduction of IMPA’s principal and interest payments over the next 30 years by approximately $90.5 million, resulting in a present value savings of approximately $53 million. Additionally, in January 2016, IMPA had the opportunity to refund approximately $156 million more of the Agency’s tax-exempt bonds. The additional refundings resulted in a reduction of IMPA’s principal and interest payments of approximately $40 million, with a present-value savings of approximately $29 million.
Evolution of Communities Evolution and transformation in the electric utility industry, and at IMPA, are often punctuated by transformation in communities. IMPA is committed to supporting its member communities in their efforts to attract and retain businesses, as well as grow their economic development strengths and offerings. IMPA’s partnership with the communities it serves with wholesale power often leads to successful ventures within the community boundaries.
Community demographics constantly change, a change that can dramatically impact the makeup of that community’s workforce as well as the services offered and available to residents. In 2015, IMPA added community profiles and demographic information to its website to better assist its member communities and potential industries in accessing a wealth of information about the cities and towns served by the Agency. Viewers are able to pull essential data relating to demographics, consumer expenses and labor force, just to name a few. Economic development professionals, site selectors, local elected officials, researchers and many more can benefit from the wide range of data available.
Anderson, Indiana, one of IMPA’s member communities, experienced a wealth of economic development successes in 2015. The City embraced opportunities to increase diversity in its economy and community by welcoming several foreign investors. Most notably, Japanese auto parts maker NTN Driveshaft, Inc. announced plans to build a new, 406,000. square-foot facility in the community. Company officials selected Anderson for the new $87 million facility thanks to its business-friendly climate, availability of skilled
labor and strong work ethic. The plant is expected to employ up to 510 workers. Additionally, Italian plastics processor Sirmax is constructing its new facility on a brownfield site, which will help improve the vitality of the City’s core. Anderson also welcomed the Italian company of Tecnoplast, a small manufacturer, which specializes in plastic materials and technological systems for manufacturing. Besides Italy, Anderson also received foreign direct investment from the countries of Thailand (Royal Interpack North America, Inc.), Israel (Home Design Products), and Japan (Greenville Technologies). Anderson is just one example of member communities evolving their services and offerings to meet the needs of a transforming society throughout the world. IMPA is proud to partner with its members on their economic development efforts, which also result in quality of life improvements for the entire community. The design of IMPA’s long-term power sales contracts enable member communities to easily serve new customers. As an all-requirements Agency, IMPA is capable of absorbing such new loads and providing a community’s total requirements, including new growth.
Community demographic profiles were added to IMPA’s website at www.impa.com in 2015. The statistics and data provide member communities and potential industries with a wealth of information about cities and towns served by the Agency.

Attracting new businesses and industries is not the only measurement of success among Indiana’s municipal electric communities. Developing strong downtowns, providing amenities for residents, and promoting overall stellar communities are also front of mind for many of IMPA’s member communities. In Indiana, cities and towns have the opportunity to compete for Stellar Community Designation through a competitive statewide process. If selected as a Stellar Community Designee, communities have access to additional grants and funds to support development efforts in their communities. After four years of hard work to secure the designation, the community of Crawfordsville accomplished its goal when it was named a Stellar Community in 2015. The City’s plan addresses community issues in a comprehensive way, including keeping people in the community and attracting new residents. Crawfordsville hopes the plan will truly be transformative for the community. The City joins other IMPA members Huntingburg and Richmond as recipients of the Stellar Community Designation during the past three years.
Additionally in 2015, IMPA was invited to serve on the AgriNovus Innovation Council to improve connectivity for its members in the growing areas of agriculture science, research and technology industries. AgriNovus is an initiative focused on growing agriculturally-related industries centered around research and technology. IMPA is the first utility to participate in the Innovation Council.
Besides directly assisting members with economic development efforts, IMPA also provides and hosts economic development workshops designed to increase the skill sets of attendees, translating into improved services in member communities, and promoting sustainability. IMPA partnered with the Indiana Economic Forum as well as the Indiana Office of Community and Rural Affairs to offer workshops focused on policy in Indiana and how it shapes the state, as well as engaging and re-energizing efforts to support local downtowns and communities.
Value of IMPA and Local Municipal Electric Utilities
The more things change, the more they stay the same. One constant that has stood the test of time – for the utility industry, for IMPA, and for its member communities – is the value of public power, the value the Agency provides to its member communities, and the value Indiana’s local municipal electric utilities provide to their communities and customers. Perhaps the most valuable element of a municipally owned electric utility are its employees – the neighbors, friends and family working for the local utility to provide reliable and attentive service to the residents and businesses of the community. They are the eyes, ears and voices of the local utility, and deal with everything from downed power lines and disconnections to computer billing software and troubleshooting. IMPA refocused its efforts in 2015 to ensure ample education opportunities for member utility personnel existed. The Agency offered a variety of programs designed to increase the skill sets of member employees in the areas of customer service, economic development, safety education and training. The education focus continues for 2016 as IMPA offers its Second Wednesday Workshops – monthly one-day training sessions meant to meet the needs of lineworkers, engineering, and customer service personnel in all IMPA member communities. With ample training opportunities, IMPA hopes to build a network of educated and customer-oriented personnel focused on building and maintaining thriving municipal electric utilities throughout Indiana. Customer focused service, community owned dedication, local ownership and reliability are unwavering values maintained by IMPA and its member communities, no matter the transformation or evolutions around them. These values are enduring, unchanging, and invaluable.
I M PA 2015 annual report12

THOMAS EDISON may not have been able to foresee how far the evolution
of light and electricity would reach from his experiments. However, given the
evolution that had occurred leading up to his discoveries, he probably had an inkling
of the wondrous things that could occur. Transformation, revolution and evolution are
the tools by which progress occurs. IMPA is proud to lead the way for the next great
evolution of power in Indiana’s municipal electric systems.
I M PA 2015 annual report 13
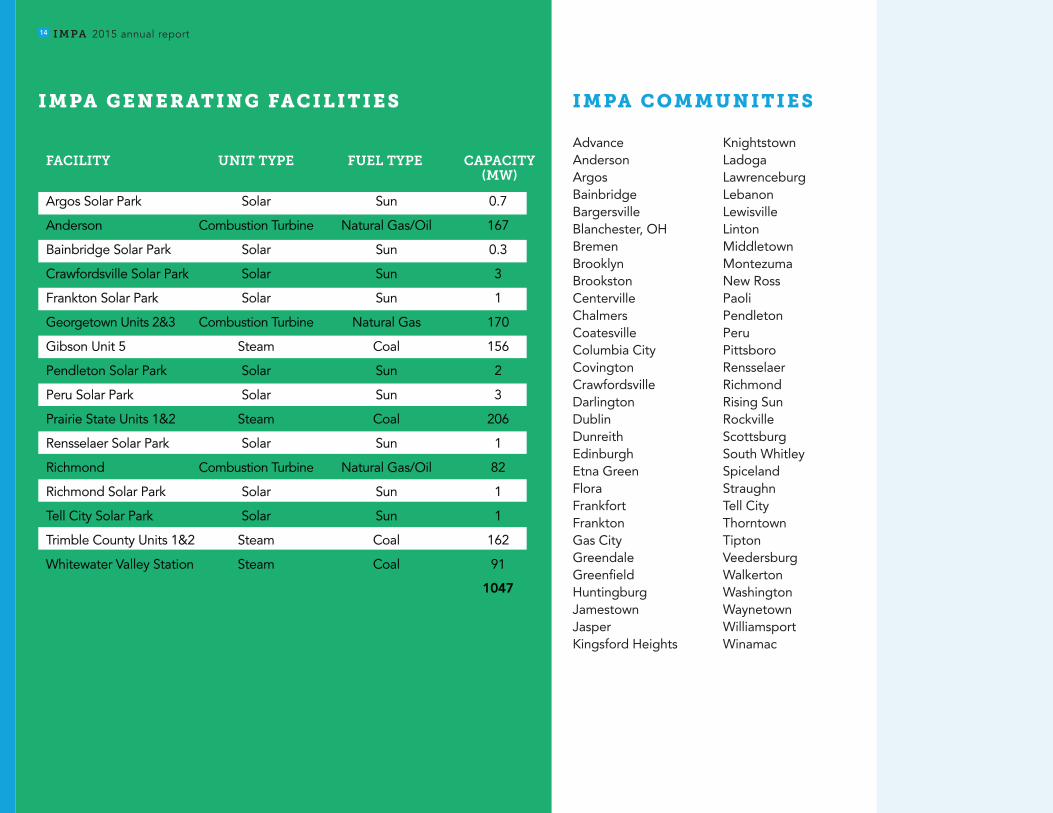
Knightstown Ladoga Lawrenceburg Lebanon LewisvilleLinton Middletown Montezuma New Ross Paoli Pendleton Peru Pittsboro Rensselaer Richmond Rising Sun Rockville Scottsburg South Whitley Spiceland StraughnTell City Thorntown Tipton Veedersburg Walkerton Washington Waynetown Williamsport Winamac
Advance AndersonArgosBainbridge Bargersville Blanchester, OH BremenBrooklyn Brookston Centerville Chalmers Coatesville Columbia City Covington Crawfordsville Darlington Dublin Dunreith Edinburgh Etna Green Flora Frankfort FranktonGas City Greendale Greenfield Huntingburg JamestownJasperKingsford Heights
IMPA COMMUNITIESIMPA GENERATING FACILITIES
FACILITY UNIT TYPE FUEL TYPE CAPACITY (MW)
I M PA 2015 annual report14
Argos Solar Park Solar Sun 0.7
Anderson Combustion Turbine Natural Gas/Oil 167
Bainbridge Solar Park Solar Sun 0.3
Crawfordsville Solar Park Solar Sun 3
Frankton Solar Park Solar Sun 1
Georgetown Units 2&3 Combustion Turbine Natural Gas 170
Gibson Unit 5 Steam Coal 156
Pendleton Solar Park Solar Sun 2
Peru Solar Park Solar Sun 3
Prairie State Units 1&2 Steam Coal 206
Rensselaer Solar Park Solar Sun 1
Richmond Combustion Turbine Natural Gas/Oil 82
Richmond Solar Park Solar Sun 1
Tell City Solar Park Solar Sun 1
Trimble County Units 1&2 Steam Coal 162
Whitewater Valley Station Steam Coal 91
1047

Kingsford HeightsWalkerton Bremen
WinamacArgos
Etna GreenColumbia City
South Whitley
Rensselaer
ChalmersPeru
BrookstonGas City
Flora
WilliamsportThorntown
TiptonFrankfort
Frankton
IMPA COMBUSTIONTURBINE PLANT
GEORGETOWNCOMBUSTIONTURBINE PLANT
Middletown
Anderson
Lebanon PendletonDarlington
Advance
Ladoga
New Ross
Greenfield
Jamestown
Bainbridge Pittsboro
BargersvilleBrooklyn
CoatesvilleMontezuma
Rockville
Edinburgh
Linton
WashingtonPaoli
Scottsburg
Jasper
Huntingburg
Greendale
Lawrenceburg
Rising Sun
GIBSON STATION
Tell City
IMPA COMBUSTIONTURBINE PLANT
WHITEWATER VALLEY STATION
Richmond
Centerville
Dublin
Straughn
Lewisville
Spiceland
Dunreith
Knightstown
Blanchester, OHPRAIRIE STATEENERGY CAMPUS, IL
Covington
Veedersburg
Waynetown
Crawfordsville
TRIMBLE COUNTYSTATION, KY
IMPA COMMUNITY
IMPA SOLAR PARK
IMPA GENERATION
I M PA 2015 annual report 15

16 I M P A 2015 annual report
71
2
3
4
1 Olin S. Clawson, Lawrenceburg
2 Larry Parker, Richmond
3 C. Sue Saunders, Lewisville
4 S. Troy Elless, Bainbridge
Phillip R. Goode, Crawfordsville 1
David L. Banta, Williamsport 2
G. Dick Klein, Tipton 3
Tony P. Pochard, Anderson 4
James E. Hanson, Middletown 5
Ram G. Reddy, Blanchester 6
IMPABoard of Commissionersand IMPA Senior Management
1
2 3
4
5
12
3
4
5
6
1
2
3
4
5
IMPA Senior Management
1 Doug Buresh Senior Vice President of Planning and Operations
2 Peter Prettyman Vice President and General Counsel
3 Jack Alvey Senior Vice President of Generation
4 Chris Rettig Senior Vice President and Chief Financial Officer
5 Raj Rao President and Chief Executive Officer
Commissioners not pictured:
Chris L. Shelton, Advance
Kevin J. McGinnis, Bargersville
Max L. Eldridge, Brookston
Mayor Bradley D. Crain, Covington
Patty M. Arnett, Kingsford Heights
James B. Cox, Ladoga
Rebecca L. Lowe, New Ross
Gary N. Barnett, Paoli
Jason B. Love, Pittsboro
Stacy L. Smith, Straughn
Kackie Tiede Chrapliwy, Walkerton

Beverly J. Norman, Waynetown 1
John S. Reutepohler, Huntingburg 2
Ron Fritz, Flora 3
Jay A. McCoskey, Lebanon 4
E. Sue Bovard, Rising Sun 5
Steve A. Wingler, Coatesville 6
1
2
34
5
6
Brad J. Zellers, Winamac 1
Jerald L. Schitter, Jasper 2
K. Ken Smith, Veedersburg 3
Lisa M. Corey, Frankton 4
Mayor Stephen A. Wood, Rensselaer 5
David A. Wilkinson, South Whitley 6
1 Tim A. McClintick, Pendleton
2 James J. Lindstrom, Argos
3 Barry J. Baker, Etna Green
4 Brent W. Slover, Linton
5 Roger B. Merriman, Peru
1
2
3
4
5
2 3
4
5
6
1
2
34
5
6
1

1 Gary D. Moody, Thorntown
2 John W. Norris, Montezuma
3 Dr. Steven G. Waltz, Rockville
4 Nathan D. Ulerick, Dublin
5 Faith A. Willoughby, Chalmers
1 Shawn E. Lickey, Columbia City
2 Anita K. Ash, Washington
3 Gene Kates, Centerville
4 Michael L. Fruth, Greenfield
5 Jay M. Stoneburner, Bremen
6 Mike C. Jenner, Edinburgh
Ray A. Young, Brooklyn 1
Mayor William H. Graham, Scottsburg 2
Dennis K. Dixon, Tell City 3
Raymond P. Smith, Gas City 4
Stephen A. Miller, Frankfort 5
David B. Dudley, Dunreith 1
Jeffrey L. Lane, Spiceland 2
Greg F. Gayler, Darlington 3
Robert H. Hartman, Greendale 4
Greg L. Neice, Knightstown 5
Wayne D. Henry, Jamestown 6
Trim
1
2
3
4
5
1
2 3
4
5 6

I M PA 2015 annual report 21I M PA 2015 annual report20I M PA 2015 annual report19
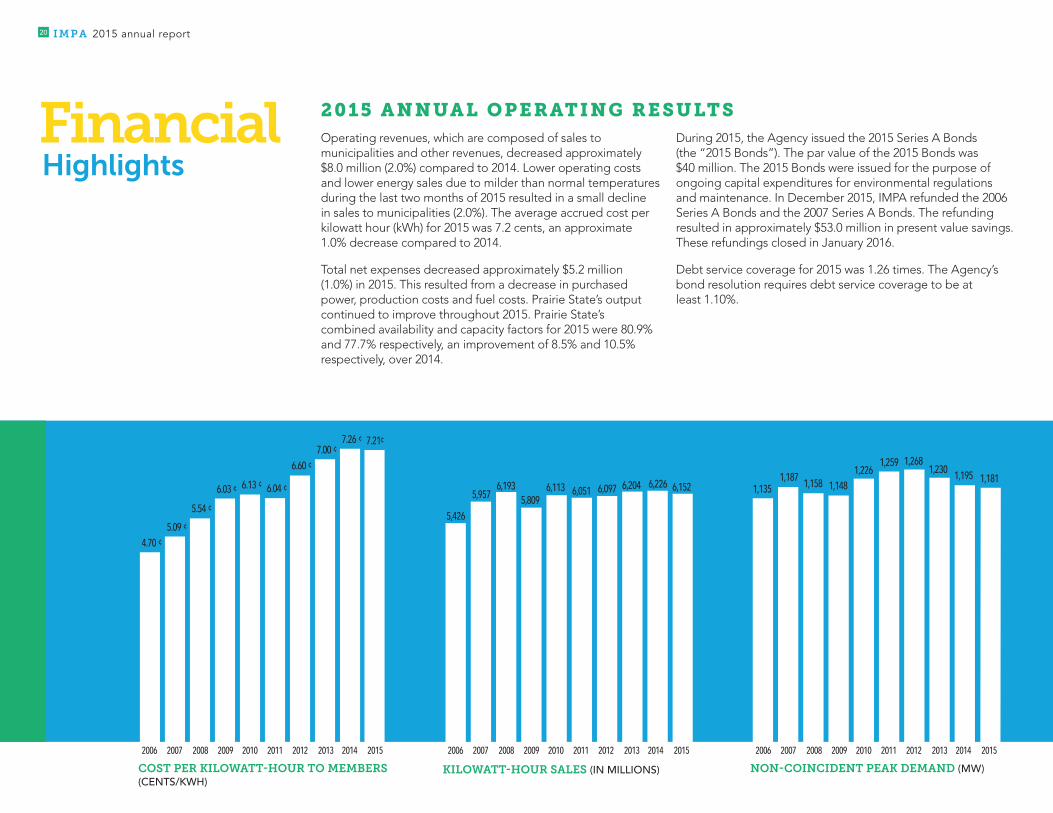
Operating revenues, which are composed of sales to municipalities and other revenues, decreased approximately$8.0 million (2.0%) compared to 2014. Lower operating costs and lower energy sales due to milder than normal temperaturesduring the last two months of 2015 resulted in a small declinein sales to municipalities (2.0%). The average accrued cost perkilowatt hour (kWh) for 2015 was 7.2 cents, an approximate 1.0% decrease compared to 2014.
Total net expenses decreased approximately $5.2 million (1.0%) in 2015. This resulted from a decrease in purchased power, production costs and fuel costs. Prairie State’s output continued to improve throughout 2015. Prairie State’s combined availability and capacity factors for 2015 were 80.9% and 77.7% respectively, an improvement of 8.5% and 10.5% respectively, over 2014.
During 2015, the Agency issued the 2015 Series A Bonds (the “2015 Bonds”). The par value of the 2015 Bonds was $40 million. The 2015 Bonds were issued for the purpose ofongoing capital expenditures for environmental regulationsand maintenance. In December 2015, IMPA refunded the 2006 Series A Bonds and the 2007 Series A Bonds. The refundingresulted in approximately $53.0 million in present value savings.These refundings closed in January 2016.
Debt service coverage for 2015 was 1.26 times. The Agency’sbond resolution requires debt service coverage to be atleast 1.10%.
2015 ANNUAL OPERATING RESULTS
CONDENSED CONSOLIDATED STATEMENTS OF REVENUES, EXPENSES AND CHANGES IN NET POSITION ($ millions)
Sales to municipalities $ 443.3 $ 452.3
Other revenues 5.5 4.3
Total Operating Revenues 448.8 456.6
Purchased power, fuel and production expenses 255.9 274.9
Transmission and local facilities 38.9 34.9
Other operating expenses 77.2 62.3
Total Operating Expenses 372.0 372.1
Total Operating Income 76.8 84.5
Interest expenses 61.7 64.7
Interest income (3.8) (4.2)
Other non-operating income (5.1) (2.6)
Total Non-Operating Expenses (Income) 52.8 57.9
Net Income 24.0 26.6
Net Position at Beginning of Year 247.6 221.0
Net Position at End of Period $ 271.6 $ 247.6
CONDENSED CONSOLIDATED STATEMENTS OF NET POSITION($ millions)
Utility plant, net $ 1,214.3 $ 1,167.3
Cash and investments 288.9 270.0
Other current assets 115.0 122.9
Deferred outflows 96.6 85.0
Total Assets $ 1,714.8 $ 1,645.2
Net investment in capital assets (115.9) (139.3)
Restricted 155.7 168.7
Unrestricted 231.8 218.2
Total Net Position $ 271.6 $ 247.6
Non-Current Liabilities 1,327.7 1,299.2
Current liabilities 115.5 98.4
Total Liabilities $ 1,443.2 $ 1,397.6
Total Net Position and Liabilities $ 1,714.8 $ 1,645.2
2015 2014 2015 2014
FinancialHighlights
2016 IMPA Staff
Senior ManagementRaj Rao President and Chief Executive Officer
Jack Alvey Senior Vice President of Generation
Doug Buresh Senior Vice President of Planning and Operations
Peter Prettyman Vice President and General Counsel
Chris Rettig Senior Vice President and Chief Financial Officer
Market OperationsMatt Andryuk Kyle Brouillette Ryan Daugherty Joh Lloyd Rob Rucker Frank Smardo Brodie Williams Sam Wilson
Planning, Engineering & OperationsGeorge Andrews Scott Berry Larry Brown Matthew Chambers Mel Denton Brian Markley Bev Matthews Alan New Joel Roper Don Summitt Nathan Van Winkle Kerry Vincent James Welsh Dan Worl
Whitewater Valley StationMelvin Bond Steve Brown Alan Burkhart Blair Canady Jerry Catron James Chaplin Steve Clark Jeffrey Coleman Chico Cotton Chris Cox Doug Friend Gene Giffen Jeff Henderson Jesse Jaynes Dustin Jones David Madden Clint Markley Jeffrey Newton Rick Pennington Mark Phenis Scott SchultzCody Shubert Jerry Spicer Daniel Straight Larry Thomas Randal Thurston
ISCKade BakerKurt Beanblossom Clay Becker Roger ButlerBill Castrodale Paul Conklin Tom Connell Rob DotySteve Esarey Derek Howard Dan JervisPhil Lopresto Keith PriddyJoe Schmidt Dacota Straw
Legal and Government RelationsEmily Atwood Carolyn Wright
Member Services Bryan Brackemyre Eric Burch Niki Dick Meredith Slavens
Accounting and FinanceJacki Hall Lezli Lingerfeldt Chauncey Long Tara Redner Sarah Shaughnessy
AdministrationSondra Brosmer Jane Hemmerlein Brandy Noelker Karen Pomeroy Cathy Rudd Shanah Tran
2006 2007 2008 2009 2010 2011 2012 2013 2014 2015
4.705.09
5.54
6.03 6.13 6.04
6.607.00
7.26
6,1521,181
KILOWATT-HOUR SALES (IN MILLIONS) NON-COINCIDENT PEAK DEMAND (MW) COST PER KILOWATT-HOUR TO MEMBERS (CENTS/KWH)
2006 2007 2008 2009 2010 2011 2012 2013 2014 2015
1,187 1,1581,226
1,148
1,259 1,2681,230 1,195
1,135
2006 2007 2008 2009 2010 2011 2012 2013 2014 2015
6,193 6,1135,809
6,051 6,097 6,204 6,226
5,426
5,957
SALES TO MUNICIPALITIES (IN MILLIONS) NET INCOME (IN MILLIONS) DEBT SERVICE COVERAGE (TIMES)2006 2007 2008 2009 2010 2011 2012 2013 2014 2015
$255.1
$303.5
$350.4
$374.4
$342.9$365.4
$402.6
$434.5$452.3
2006 2007 2008* 2009* 2010 2011 2012 2013 2014 2015
$8.1
$9.6
$4.7$5.2
$13.6
$18.5
$23.6$24.2
$26.6
1.201.24
1.12 1.13
1.301.35
1.28 1.28 1.28
2006 2007 2010 2011 2012 2013 2014 2015
* Includes transfers from Rate Stabilization Fund * Includes transfers from Rate Stabilization Fund
2008* 2009*
$443.3
$24.01.26
7.21
2006 2007 2008 2009 2010 2011 2012 2013 2014 2015
4.705.09
5.54
6.03 6.13 6.04
6.607.00
7.26
6,1521,181
KILOWATT-HOUR SALES (IN MILLIONS) NON-COINCIDENT PEAK DEMAND (MW) COST PER KILOWATT-HOUR TO MEMBERS(CENTS/KWH)
2006 2007 2008 2009 2010 2011 2012 2013 2014 2015
1,187 1,1581,226
1,148
1,259 1,2681,230 1,195
1,135
2006 2007 2008 2009 2010 2011 2012 2013 2014 2015
6,193 6,1135,809
6,051 6,097 6,204 6,226
5,426
5,957
SALES TO MUNICIPALITIES (IN MILLIONS) NET INCOME (IN MILLIONS) DEBT SERVICE COVERAGE (TIMES)2006 2007 2008 2009 2010 2011 2012 2013 2014 2015
$255.1
$303.5
$350.4
$374.4
$342.9$365.4
$402.6
$434.5$452.3
2006 2007 2008* 2009* 2010 2011 2012 2013 2014 2015
$8.1
$9.6
$4.7$5.2
$13.6
$18.5
$23.6$24.2
$26.6
1.201.24
1.12 1.13
1.301.35
1.28 1.28 1.28
2006 2007 2010 2011 2012 2013 2014 2015
* Includes transfers from Rate Stabilization Fund * Includes transfers from Rate Stabilization Fund
2008* 2009*
$443.3
$24.01.26
7.21
Operating revenues, which are composed of sales to municipalities and other revenues, decreased approximately $8.0 million (2.0%) compared to 2014. Lower operating costs and lower energy sales due to milder than normal temperatures during the last two months of 2015 resulted in a small decline in sales to municipalities (2.0%). The average accrued cost per kilowatt hour (kWh) for 2015 was 7.2 cents, an approximate 1.0% decrease compared to 2014.
Total net expenses decreased approximately $5.2 million (1.0%) in 2015. This resulted from a decrease in purchased power, production costs and fuel costs. Prairie State’s output continued to improve throughout 2015. Prairie State’s combined availability and capacity factors for 2015 were 80.9% and 77.7% respectively, an improvement of 8.5% and 10.5% respectively, over 2014.
During 2015, the Agency issued the 2015 Series A Bonds (the “2015 Bonds”). The par value of the 2015 Bonds was $40 million. The 2015 Bonds were issued for the purpose of ongoing capital expenditures for environmental regulations and maintenance. In December 2015, IMPA refunded the 2006 Series A Bonds and the 2007 Series A Bonds. The refunding resulted in approximately $53.0 million in present value savings. These refundings closed in January 2016.
Debt service coverage for 2015 was 1.26 times. The Agency’s bond resolution requires debt service coverage to be at least 1.10%.
2015 ANNUAL OPERATING RESULTS
20 I M P A 2015 annual report
FinancialHighlights
2006 2007 2008 2009 2010 2011 2012 2013 2014 2015
4.705.09
5.54
6.03 6.13 6.04
6.607.00
7.26
6,1521,181
KILOWATT-HOUR SALES (IN MILLIONS) NON-COINCIDENT PEAK DEMAND (MW) COST PER KILOWATT-HOUR TO MEMBERS (CENTS/KWH)
2006 2007 2008 2009 2010 2011 2012 2013 2014 2015
1,187 1,1581,226
1,148
1,259 1,2681,230 1,195
1,135
2006 2007 2008 2009 2010 2011 2012 2013 2014 2015
6,193 6,1135,809
6,051 6,097 6,204 6,226
5,426
5,957
SALES TO MUNICIPALITIES (IN MILLIONS) NET INCOME (IN MILLIONS) DEBT SERVICE COVERAGE (TIMES)2006 2007 2008 2009 2010 2011 2012 2013 2014 2015
$255.1
$303.5
$350.4
$374.4
$342.9$365.4
$402.6
$434.5$452.3
2006 2007 2008* 2009* 2010 2011 2012 2013 2014 2015
$8.1
$9.6
$4.7$5.2
$13.6
$18.5
$23.6$24.2
$26.6
1.201.24
1.12 1.13
1.301.35
1.28 1.28 1.28
2006 2007 2010 2011 2012 2013 2014 2015
* Includes transfers from Rate Stabilization Fund * Includes transfers from Rate Stabilization Fund
2008* 2009*
$443.3
$24.01.26
7.21
2006 2007 2008 2009 2010 2011 2012 2013 2014 2015
4.705.09
5.54
6.03 6.13 6.04
6.607.00
7.26
6,1521,181
KILOWATT-HOUR SALES (IN MILLIONS) NON-COINCIDENT PEAK DEMAND (MW) COST PER KILOWATT-HOUR TO MEMBERS(CENTS/KWH)
2006 2007 2008 2009 2010 2011 2012 2013 2014 2015
1,187 1,1581,226
1,148
1,259 1,2681,230 1,195
1,135
2006 2007 2008 2009 2010 2011 2012 2013 2014 2015
6,193 6,1135,809
6,051 6,097 6,204 6,226
5,426
5,957
SALES TO MUNICIPALITIES (IN MILLIONS) NET INCOME (IN MILLIONS) DEBT SERVICE COVERAGE (TIMES)2006 2007 2008 2009 2010 2011 2012 2013 2014 2015
$255.1
$303.5
$350.4
$374.4
$342.9$365.4
$402.6
$434.5$452.3
2006 2007 2008* 2009* 2010 2011 2012 2013 2014 2015
$8.1
$9.6
$4.7$5.2
$13.6
$18.5
$23.6$24.2
$26.6
1.201.24
1.12 1.13
1.301.35
1.28 1.28 1.28
2006 2007 2010 2011 2012 2013 2014 2015
* Includes transfers from Rate Stabilization Fund * Includes transfers from Rate Stabilization Fund
2008* 2009*
$443.3
$24.01.26
7.21

I M P A 2015 annual report 21
CONDENSED CONSOLIDATED STATEMENTS OF REVENUES, EXPENSES AND CHANGES IN NET POSITION ($ millions)
Sales to municipalities $ 443.3 $ 452.3
Other revenues 5.5 4.3
Total Operating Revenues 448.8 456.6
Purchased power, fuel and production expenses 255.9 274.9
Transmission and local facilities 38.9 34.9
Other operating expenses 77.2 62.3
Total Operating Expenses 372.0 372.1
Total Operating Income 76.8 84.5
Interest expenses 61.7 64.7
Interest income (3.8) (4.2)
Other non-operating income (5.1) (2.6)
Total Non-Operating Expenses (Income) 52.8 57.9
Net Income 24.0 26.6
Net Position at Beginning of Year 247.6 221.0
Net Position at End of Period $ 271.6 $ 247.6
CONDENSED CONSOLIDATED STATEMENTS OF NET POSITION ($ millions)
Utility plant, net $ 1,214.3 $ 1,167.3
Cash and investments 288.9 270.0
Other current assets 115.0 122.9
Deferred outflows 96.6 85.0
Total Assets $ 1,714.8 $ 1,645.2
Net investment in capital assets (115.9) (139.3)
Restricted 155.7 168.7
Unrestricted 231.8 218.2
Total Net Position $ 271.6 $ 247.6
Non-Current Liabilities 1,327.7 1,299.2
Current liabilities 115.5 98.4
Total Liabilities $ 1,443.2 $ 1,397.6
Total Net Position and Liabilities $ 1,714.8 $ 1,645.2
2015 2014 2015 2014
2006 2007 2008 2009 2010 2011 2012 2013 2014 2015
4.705.09
5.54
6.03 6.13 6.04
6.607.00
7.26
6,1521,181
KILOWATT-HOUR SALES (IN MILLIONS) NON-COINCIDENT PEAK DEMAND (MW) COST PER KILOWATT-HOUR TO MEMBERS(CENTS/KWH)
2006 2007 2008 2009 2010 2011 2012 2013 2014 2015
1,187 1,1581,226
1,148
1,259 1,2681,230 1,195
1,135
2006 2007 2008 2009 2010 2011 2012 2013 2014 2015
6,193 6,1135,809
6,051 6,097 6,204 6,226
5,426
5,957
SALES TO MUNICIPALITIES (IN MILLIONS) NET INCOME (IN MILLIONS) DEBT SERVICE COVERAGE (TIMES)2006 2007 2008 2009 2010 2011 2012 2013 2014 2015
$255.1
$303.5
$350.4
$374.4
$342.9$365.4
$402.6
$434.5$452.3
2006 2007 2008* 2009* 2010 2011 2012 2013 2014 2015
$8.1
$9.6
$4.7$5.2
$13.6
$18.5
$23.6$24.2
$26.6
1.201.24
1.12 1.13
1.301.35
1.28 1.28 1.28
2006 2007 2010 2011 2012 2013 2014 2015
* Includes transfers from Rate Stabilization Fund * Includes transfers from Rate Stabilization Fund
2008* 2009*
$443.3
$24.01.26
7.21

revolution andtransformation
evolution are the tools by which progress occurs.
IMPA is proud to lead the way for the
next great evolution of power in
Indiana’s municipal electric systems.


IMPA’s power portfolio includes 50 MW of wind from Crystal Lake Wind Energy Center.
ENERGY
IMPA Bainbridge Solar Park, Bainbridge, Indiana
