2015 ars eu_red_s9_schutter
TRANSCRIPT

2015 ARS, Europe: Amsterdam, The NetherlandsRed Room, Session 9
Uncertainty in RAM Analysis
George de Schutter
Begins at 2:15 PM, Wednesday, April 22nd

PRESENTATION SLIDESThe following presentation was delivered at the:
International Applied Reliability Symposium, EuropeApril 21 - 23, 2015: Amsterdam, Netherlands
http://www.ARSymposium.org/europe/2015/
The International Applied Reliability Symposium (ARS) is intended to be a forum for reliability and maintainability practitioners within industry and government to discuss their success stories and lessons learned regarding
the application of reliability techniques to meet real world challenges. Each year, the ARS issues an open"Call for Presentations" at http://www.ARSymposium.org/europe/presenters/index.htm and the presentations
delivered at the Symposium are selected on the basis of the presentation proposals received.
Although the ARS may edit the presentation materials as needed to make them ready to print, the content of the presentation is solely the responsibility of the author. Publication of these presentation materials in the
ARS Proceedings does not imply that the information and methods described in the presentation have been verified or endorsed by the ARS and/or its organizers.
The publication of these materials in the ARS presentation format is Copyright © 2015 by the ARS, All Rights Reserved.

George de Schutter, Royal HaskoningDHV Slide Number: 2Session 9Red Room App
lied
Rel
iabi
lity
Sym
posi
um, E
urop
e 20
15
Introduction
“All models are wrong, but some are useful.”
George Edward Pelham Box (October 18, 1919 – March 28, 2013),British mathematician and Professor of Statistics at the University of Wisconsin

George de Schutter, Royal HaskoningDHV Slide Number: 3Session 9Red Room App
lied
Rel
iabi
lity
Sym
posi
um, E
urop
e 20
15
Introduction (2)Royal HaskoningDHVindependent, international engineering, project management and consultancy companyasset management, aviation, buildings, energy, industry, infrastructure, maritime, mining, strategy, transport, urban and rural planning, water management and water technology7,000 colleagues100 offices35 countries

George de Schutter, Royal HaskoningDHV Slide Number: 4Session 9Red Room App
lied
Rel
iabi
lity
Sym
posi
um, E
urop
e 20
15
Introduction (3) Royal HaskoningDHV performs RAM (Reliability,
Availability, Maintainability) studies for: Oil and Gas facilities Infrastructure: Locks, Bridges, Tunnels Water facilities Other
RAM analysis is used for: Design optimization Verification of reliability / availability requirements Forecasting production / availability Maintenance optimization Sparing strategy Cost reduction
George de Schutter, Royal HaskoningDHV Slide Number: 5Session 9Red Room App
lied
Rel
iabi
lity
Sym
posi
um, E
urop
e 20
15
Introduction (4)Asset Management Perspective:Asset Management: coordinated activity of an organization to realize value from assets balancing of costs, opportunities and risks against the desired
performance of assets, to achieve the organizational objectives
Asset owners need reliable production or availability forecastsNew ISO 55000 sets standard for asset management Risk management is essential

George de Schutter, Royal HaskoningDHV Slide Number: 6Session 9Red Room App
lied
Rel
iabi
lity
Sym
posi
um, E
urop
e 20
15
Risk Management (ISO 31000)
Organization objective: required performanceAwareness of probability of not reaching required performance: probabilistic approach
Risk Assessment
Introduction (5)
Risk Identification
Risk Analysis
Risk Evaluation
Risk Mitigation Mon
itorin
g &
revi
ew
Com
mun
icat
ion
&
cons
ulta
tion
Establishing context
George de Schutter, Royal HaskoningDHV Slide Number: 7Session 9Red Room App
lied
Rel
iabi
lity
Sym
posi
um, E
urop
e 20
15
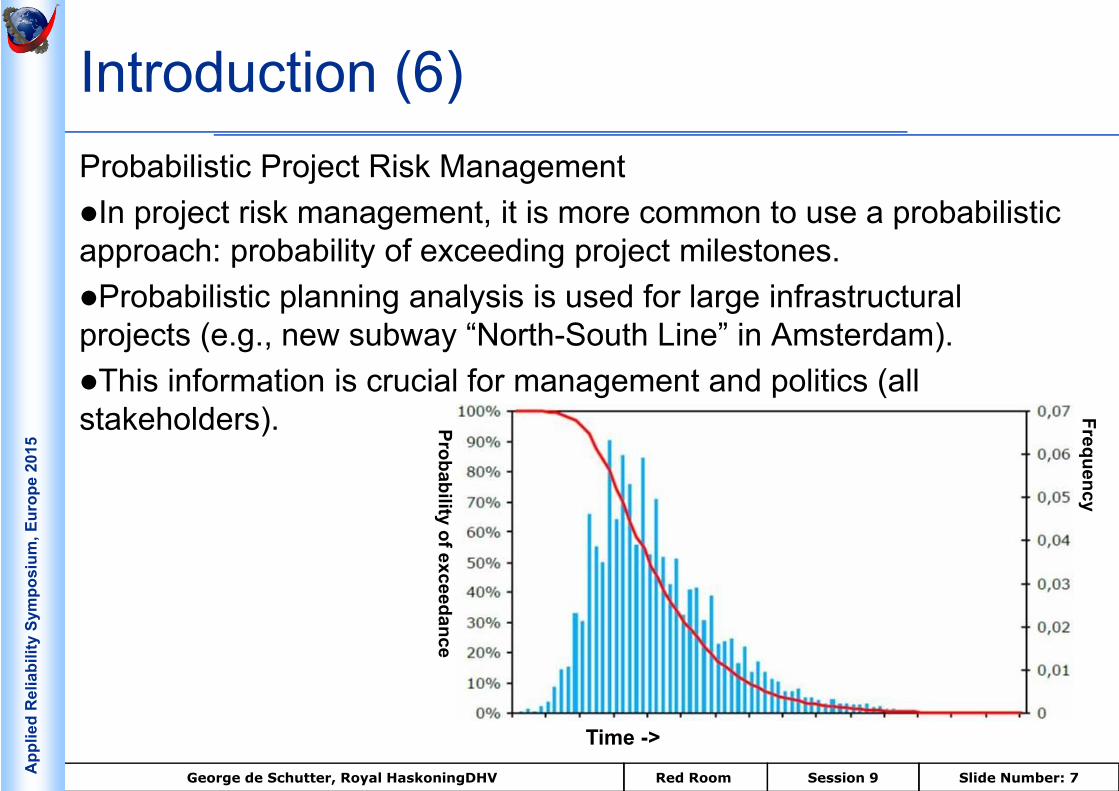
Introduction (6)Probabilistic Project Risk ManagementIn project risk management, it is more common to use a probabilistic approach: probability of exceeding project milestones. Probabilistic planning analysis is used for large infrastructural projects (e.g., new subway “North-South Line” in Amsterdam).This information is crucial for management and politics (all stakeholders). Probability of exceedance
Time ->
Frequency

George de Schutter, Royal HaskoningDHV Slide Number: 8Session 9Red Room App
lied
Rel
iabi
lity
Sym
posi
um, E
urop
e 20
15
Introduction (7)Observations:Clients are often unaware of the uncertainty of the outcome of a RAM studyIn other words: probability that actual performance will be below calculated performanceMost RAM studies do not report uncertainty (“confidence”)

George de Schutter, Royal HaskoningDHV Slide Number: 9Session 9Red Room App
lied
Rel
iabi
lity
Sym
posi
um, E
urop
e 20
15
Agenda
Introduction 10 min Traditional RAM Analysis 10 min Probabilistic RAM Analysis 10 min Project Example Results 10 min Summary & Conclusions 5 min Questions & Discussion 15 min
George de Schutter, Royal HaskoningDHV Slide Number: 10Session 9Red Room App
lied
Rel
iabi
lity
Sym
posi
um, E
urop
e 20
15
Vocabulary CMMS – Computerized Maintenance Management
System FMECA – Failure Mode, Effect and Criticality Analysis FTA – Fault Tree Analysis MTBF – Mean Time Between Failure MTTR – Mean Time to Repair RAM – Reliability, Availability, Maintainability RBD – Reliability Block Diagram SD – Standard Deviation

George de Schutter, Royal HaskoningDHV Slide Number: 11Session 9Red Room App
lied
Rel
iabi
lity
Sym
posi
um, E
urop
e 20
15
RAM(S) Reliability, Availability, Maintainability (and Safety) RAM Analysis is used for: Design optimization Verification of reliability / availability requirements Forecasting production / availability Maintenance optimization Sparing strategy Cost reduction
George de Schutter, Royal HaskoningDHV Slide Number: 12Session 9Red Room App
lied
Rel
iabi
lity
Sym
posi
um, E
urop
e 20
15
The outcome of RAM analysis should serve the boardroom in risk-based decision making:
Risk-based production targetsSupport business plansFocus for investmentsDesign optimizationMaintenance optimizationCost reduction
Need for accurate performance prediction

George de Schutter, Royal HaskoningDHV Slide Number: 13Session 9Red Room App
lied
Rel
iabi
lity
Sym
posi
um, E
urop
e 20
15
Traditional RAM analysis stepwise1. Client: draft design2. Define system functions, define failure and performance
requirements for system3. Choose method of analysis4. Build model5. Data collection6. Calculations7. Results and reporting
George de Schutter, Royal HaskoningDHV Slide Number: 14Session 9Red Room App
lied
Rel
iabi
lity
Sym
posi
um, E
urop
e 20
15
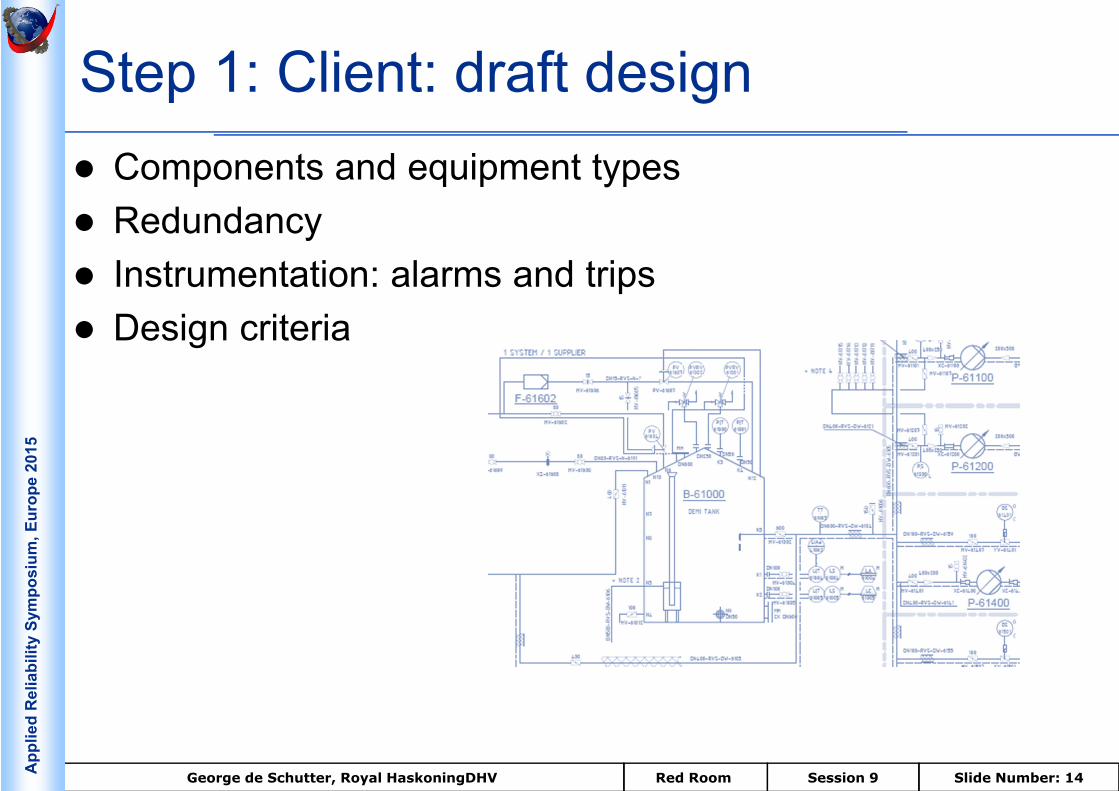
Step 1: Client: draft design Components and equipment types Redundancy Instrumentation: alarms and trips Design criteria

George de Schutter, Royal HaskoningDHV Slide Number: 15Session 9Red Room App
lied
Rel
iabi
lity
Sym
posi
um, E
urop
e 20
15Step 2: System functions, failure definition and performance requirements
System function (e.g., producing gas, guiding traffic, etc.) Clear definition of system failure When does system fail? (e.g., production volume below xx m3/h,
product off-spec, throughput below xx vehicles/h)
Define required performance (e.g., availability > 99%, number of outages per year < 10)
George de Schutter, Royal HaskoningDHV Slide Number: 16Session 9Red Room App
lied
Rel
iabi
lity
Sym
posi
um, E
urop
e 20
15
Step 3: Choose method of analysis Depending on requirements, select a modelling method: FMECA Count Parts Fault Tree Analysis Reliability Block Diagram Etc.
George de Schutter, Royal HaskoningDHV Slide Number: 17Session 9Red Room App
lied
Rel
iabi
lity
Sym
posi
um, E
urop
e 20
15
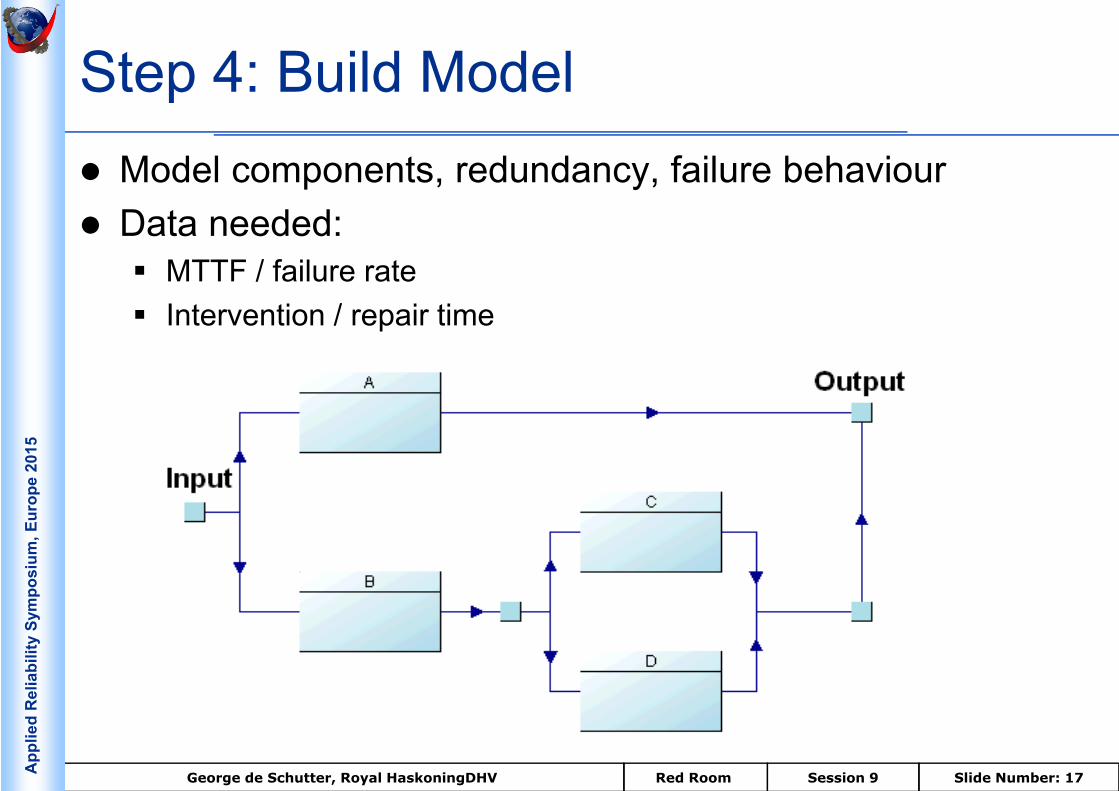
Step 4: Build Model Model components, redundancy, failure behaviour Data needed: MTTF / failure rate Intervention / repair time

George de Schutter, Royal HaskoningDHV Slide Number: 18Session 9Red Room App
lied
Rel
iabi
lity
Sym
posi
um, E
urop
e 20
15
Step 5: Data collection (1)1. Client- or vendor-specific data2. Generic sources (e.g., Oreda, RiAC)3. Expert judgment
Failure data Uncertainty !
First reason for uncertainty: sampling. Failure data is based on a certain population (“sample”)
of components that is a sample of the total population. Smaller samples result in higher uncertainty.

George de Schutter, Royal HaskoningDHV Slide Number: 19Session 9Red Room App
lied
Rel
iabi
lity
Sym
posi
um, E
urop
e 20
15
Step 5: Data collection (2)Other reasons for uncertainty
Is the data used applicable for the specific application?Different branch of industryDifferent environmentDifferent vendorDifferent maintenance strategy
In general, more specific data is favourable, but be careful!

George de Schutter, Royal HaskoningDHV Slide Number: 20Session 9Red Room App
lied
Rel
iabi
lity
Sym
posi
um, E
urop
e 20
15
Step 5: Data collection (3)
Data from generic source, example:
Reference: Offshore Reliability Data, 5th ed. – Topside equipment
George de Schutter, Royal HaskoningDHV Slide Number: 21Session 9Red Room App
lied
Rel
iabi
lity
Sym
posi
um, E
urop
e 20
15
Perform calculation based on model and failure data
Using RAM software (e.g., Isograph Reliability Workbench®, ReliaSoft®)
Step 6: Calculations

George de Schutter, Royal HaskoningDHV Slide Number: 22Session 9Red Room App
lied
Rel
iabi
lity
Sym
posi
um, E
urop
e 20
15
Obtain results from calculations If needed, modify design or maintenance Report results to client Often single figure (e.g., “Availability = 97.1%”)
Step 7: Results and reporting

George de Schutter, Royal HaskoningDHV Slide Number: 23Session 9Red Room App
lied
Rel
iabi
lity
Sym
posi
um, E
urop
e 20
15
Probabilistic RAM analysis stepwise1. Client: draft design2. * Define system functions, define failure and
performance requirements for system3. Choose method of analysis4. * Build model5. * Data collection6. * Calculations7. * Results and reporting

George de Schutter, Royal HaskoningDHV Slide Number: 24Session 9Red Room App
lied
Rel
iabi
lity
Sym
posi
um, E
urop
e 20
15Step 2*: System functions, failure definition and performance requirements System function (e.g., producing gas, guiding traffic, etc.) Clear definition of system failure When does system fail? (e.g., production volume below xx m3/h,
product off-spec, throughput below xx vehicles/h)
Define required performance, for example: Probability of production volume > 100 m3/h is 95%
Target value
100m3/h
95%
Expected value
George de Schutter, Royal HaskoningDHV Slide Number: 25Session 9Red Room App
lied
Rel
iabi
lity
Sym
posi
um, E
urop
e 20
15
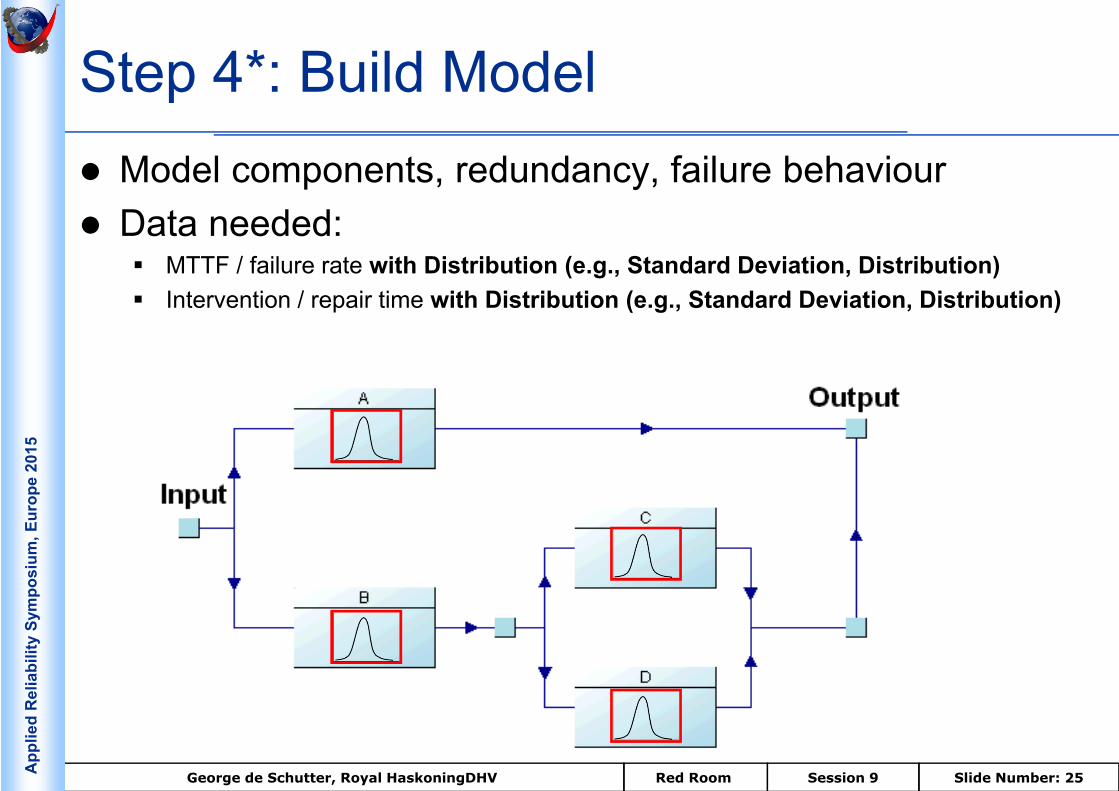
Step 4*: Build Model Model components, redundancy, failure behaviour Data needed:
MTTF / failure rate with Distribution (e.g., Standard Deviation, Distribution) Intervention / repair time with Distribution (e.g., Standard Deviation, Distribution)

George de Schutter, Royal HaskoningDHV Slide Number: 26Session 9Red Room App
lied
Rel
iabi
lity
Sym
posi
um, E
urop
e 20
15
Step 5*: Data collection (1)Still possibility of using different sources:1.Client- or vendor-specific data2.Generic sources (e.g., Oreda, RiAC)3.Expert judgment
But information on spread in data is needed or needs to be estimated!
George de Schutter, Royal HaskoningDHV Slide Number: 27Session 9Red Room App
lied
Rel
iabi
lity
Sym
posi
um, E
urop
e 20
15
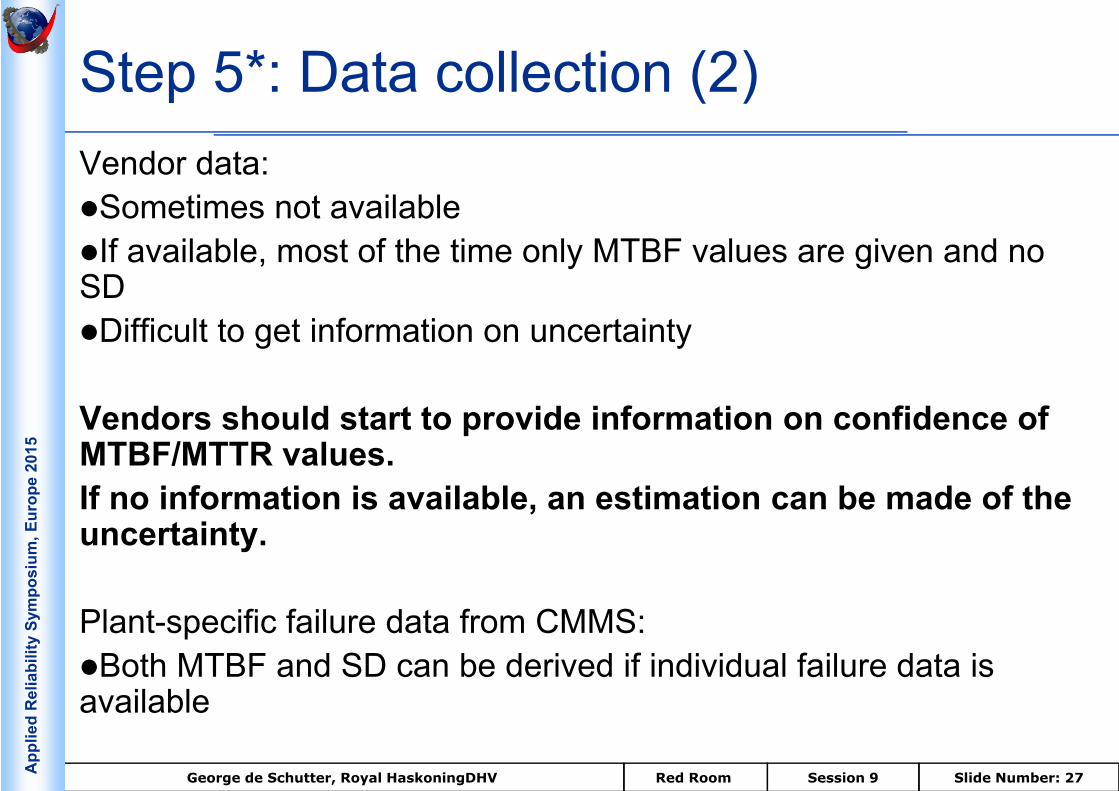
Step 5*: Data collection (2)Vendor data:Sometimes not availableIf available, most of the time only MTBF values are given and no SDDifficult to get information on uncertainty
Vendors should start to provide information on confidence of MTBF/MTTR values.If no information is available, an estimation can be made of the uncertainty.
Plant-specific failure data from CMMS:Both MTBF and SD can be derived if individual failure data is available
George de Schutter, Royal HaskoningDHV Slide Number: 28Session 9Red Room App
lied
Rel
iabi
lity
Sym
posi
um, E
urop
e 20
15
Step 5*: Data collection (3)
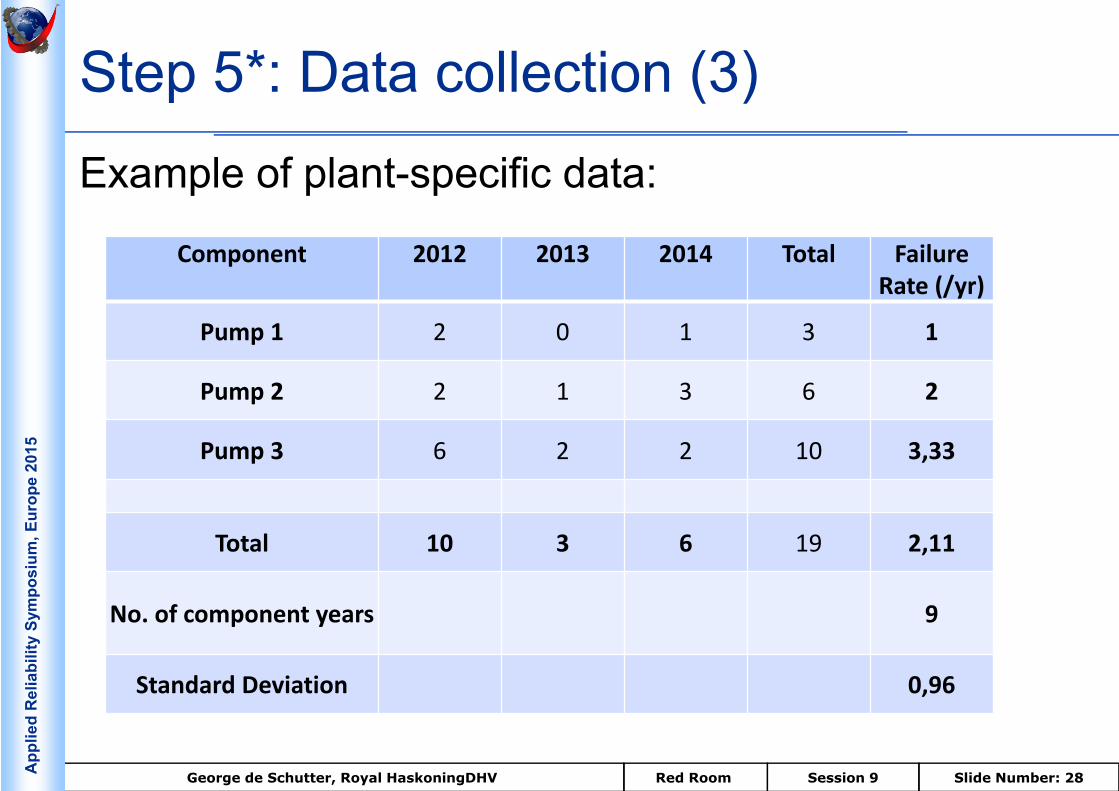
Example of plant-specific data:
Component 2012 2013 2014 Total Failure Rate (/yr)
Pump 1 2 0 1 3 1
Pump 2 2 1 3 6 2
Pump 3 6 2 2 10 3,33
Total 10 3 6 19 2,11
No. of component years 9
Standard Deviation 0,96
George de Schutter, Royal HaskoningDHV Slide Number: 29Session 9Red Room App
lied
Rel
iabi
lity
Sym
posi
um, E
urop
e 20
15
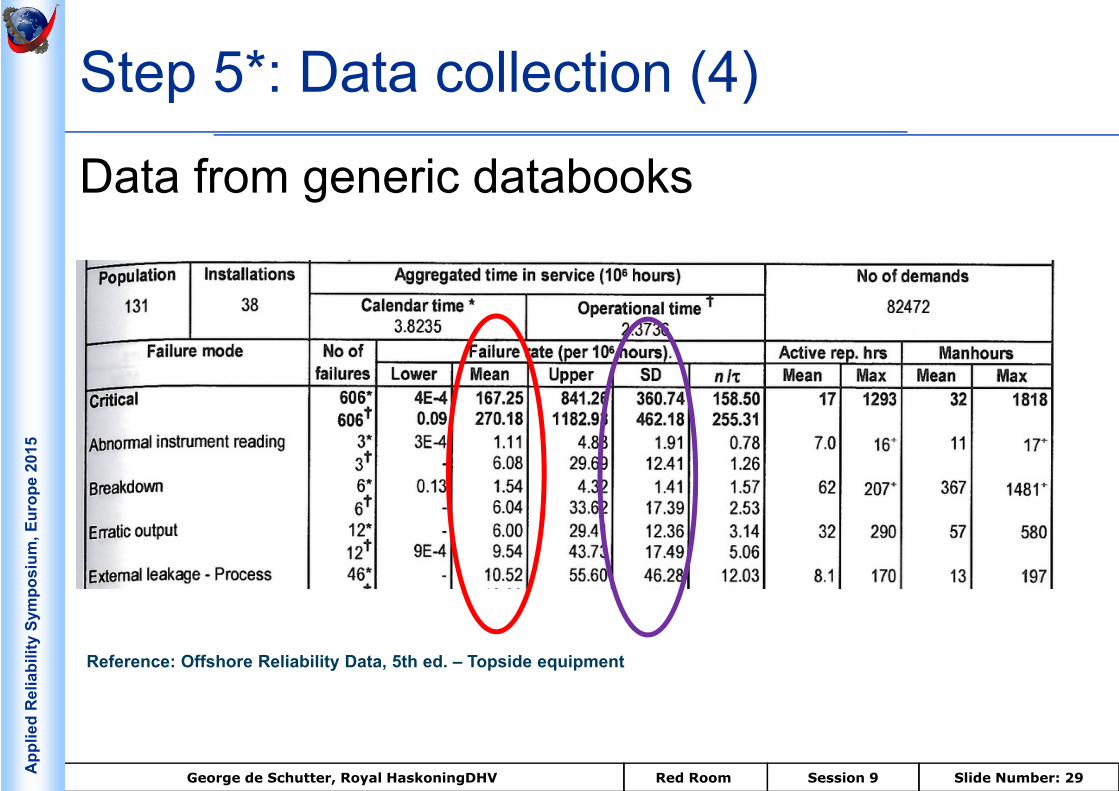
Step 5*: Data collection (4)
Data from generic databooks
Reference: Offshore Reliability Data, 5th ed. – Topside equipment
George de Schutter, Royal HaskoningDHV Slide Number: 30Session 9Red Room App
lied
Rel
iabi
lity
Sym
posi
um, E
urop
e 20
15
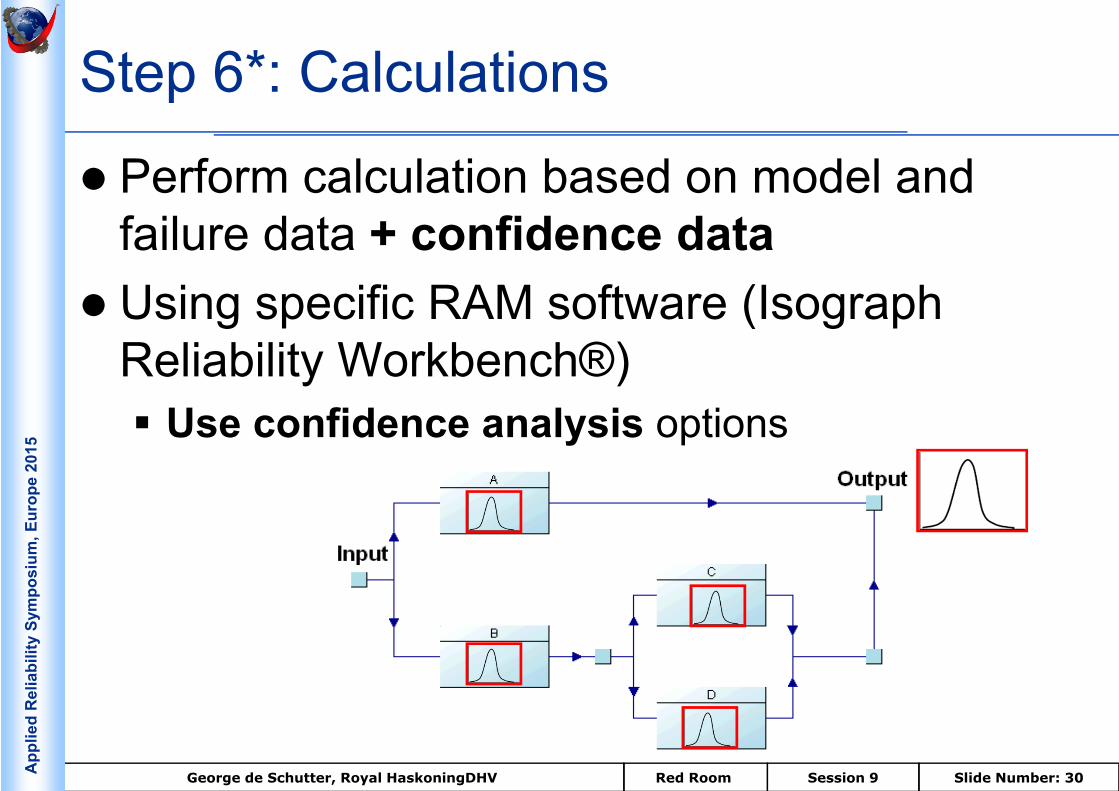
Perform calculation based on model and failure data + confidence data
Using specific RAM software (Isograph Reliability Workbench®) Use confidence analysis options
Step 6*: Calculations
George de Schutter, Royal HaskoningDHV Slide Number: 31Session 9Red Room App
lied
Rel
iabi
lity
Sym
posi
um, E
urop
e 20
15
Obtain results from calculations If needed, modify design or maintenance Report results to client Report probability that required performance
will be achieved
Step 7*: Results and reporting (1)

George de Schutter, Royal HaskoningDHV Slide Number: 32Session 9Red Room App
lied
Rel
iabi
lity
Sym
posi
um, E
urop
e 20
15
Step 7*: Results and reporting (2)
~ 15%
Required availability
~ 85%
Expected value(calculated)
15% probability that target availability is not achieved
100 m3/h 150 m3/h

George de Schutter, Royal HaskoningDHV Slide Number: 33Session 9Red Room App
lied
Rel
iabi
lity
Sym
posi
um, E
urop
e 20
15
Step 7*: Results and reporting (3)
~ 50%
Required availability
~ 50%
Expected value (calculated)
50% probability that target availability is not achieved!
100 m3/h
George de Schutter, Royal HaskoningDHV Slide Number: 34Session 9Red Room App
lied
Rel
iabi
lity
Sym
posi
um, E
urop
e 20
15
Project Example (1) Gas landfall station (screening study) Fault Tree Analysis Information on data uncertainty was included in the model
for each component: Failure rate Failure rate standard deviation (from Oreda) Failure rate distribution: Normal MTTR MTTR standard deviation (rule of thumb) MTTR distribution: Normal

George de Schutter, Royal HaskoningDHV Slide Number: 35Session 9Red Room App
lied
Rel
iabi
lity
Sym
posi
um, E
urop
e 20
15
Project Example (2) Resulting unavailability distribution
George de Schutter, Royal HaskoningDHV Slide Number: 36Session 9Red Room App
lied
Rel
iabi
lity
Sym
posi
um, E
urop
e 20
15
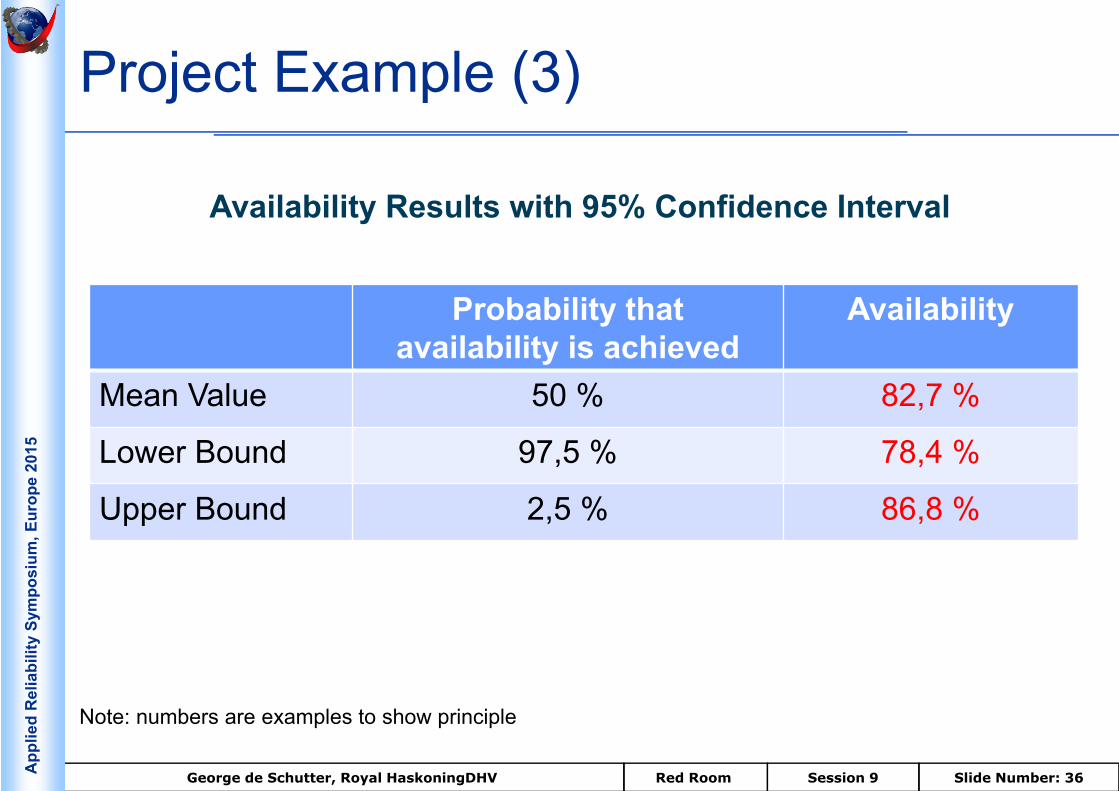
Project Example (3)
Availability Results with 95% Confidence Interval
Note: numbers are examples to show principle
Probability that availability is achieved
Availability
Mean Value 50 % 82,7 %
Lower Bound 97,5 % 78,4 %
Upper Bound 2,5 % 86,8 %

George de Schutter, Royal HaskoningDHV Slide Number: 37Session 9Red Room App
lied
Rel
iabi
lity
Sym
posi
um, E
urop
e 20
15
Asset owners are often unaware of the uncertainty in results from RAM analysis: any calculated unavailability point-value does not tell the whole story
Confidence interval analysis is supported by RAM analysis software (e.g., Isograph Reliability Workbench®)
Proof of concept successfully implemented for an existing study of Royal HaskoningDHV
Proof of concept shows that spread in results can be substantial
Practical challenges in confidence analysis need to be solved
Conclusions
George de Schutter, Royal HaskoningDHV Slide Number: 38Session 9Red Room App
lied
Rel
iabi
lity
Sym
posi
um, E
urop
e 20
15
Discussion
Awareness of uncertainty in results of RAM analysis is important.
Probabilistic approach has added value in specific cases:Contractual requirements (bonus / financial penalty contracts)Strong corporate demands for meeting production targets
George de Schutter, Royal HaskoningDHV Slide Number: 39Session 9Red Room App
lied
Rel
iabi
lity
Sym
posi
um, E
urop
e 20
15
Challenges of Probabilistic Approach
Vendors often do not provide information on data uncertainty
Many databooks provide no or limited information on data uncertainty
Clients are not aware of the uncertainty
Although information on data uncertainty might be difficult to acquire, estimating the spread in failure data using expert judgment results in a more realistic result than implementing no spread.

George de Schutter, Royal HaskoningDHV Slide Number: 40Session 9Red Room App
lied
Rel
iabi
lity
Sym
posi
um, E
urop
e 20
15
Questions for Discussion
Does your organisation use RAM analysis? Is your organisation sufficiently aware of the
uncertainty in RAM analysis? Does a probabilistic approach (confidence analysis
on the results) in RAM analysis offer added value?

George de Schutter, Royal HaskoningDHV Slide Number: 41Session 9Red Room App
lied
Rel
iabi
lity
Sym
posi
um, E
urop
e 20
15
Questions
Thank you for your attention.
Do you have any questions?

George de Schutter, Royal HaskoningDHV Slide Number: 42Session 9Red Room App
lied
Rel
iabi
lity
Sym
posi
um, E
urop
e 20
15
Contact information George de Schutter MSc. Consultant RAMS Analysis and Risk Management at
Royal HaskoningDHV Amersfoort, The Netherlands Feel free to contact [email protected] LinkedIn: nl.linkedin.com/in/georgedeschutter