2015 black bear harvest report bear harvest summary 2015 results reported in this document were...
TRANSCRIPT

www.dec.ny.gov
BLACK BEAR HARVEST SUMMARY
2015
Results reported in this document were funded by the Federal Aid in Wildlife Restoration Act. Grant WE-173-G
Donald Winslow with his Tioga County black bear, taken in October, 2015.

2015 20145‐Year Average
(2010‐2014)
Historical Average
(1991‐2000)
Northern Zone 583 518 460 515Early 183 291 217 172
Bow 53 26 24 15
Muzzleloader 94 42 41 25
Regular 253 159 178 303
% Female : % Male 33% ‐ 67% 37% ‐ 63% 38% ‐ 62% 43% ‐ 57%
Southern Zone 1,132 1,110 869 207Early 192 337 337Bow 327 305 305 54
Muzzleloader 17 16 12 1
Regular 596 452 485 153
% Female : % Male 36% ‐ 64% 41% ‐ 59% 40% ‐ 60% 37% ‐ 63%
New York State 1,715 1,628 1,329 722Early 375 628 285 172
Bow 380 331 328 69
Muzzleloader 111 58 53 26
Regular 849 611 663 455
% Female : % Male 35% ‐ 65% 40% ‐ 60% 40% ‐ 60% 41% ‐ 59%
NEW YORK STATE
DEPARTMENT OF ENVIRONMENTAL CONSERVATION
2015 Bear Harvest Summary
0100200300400500600700800
Bear Take by Implement
Northern Zone Southern Zone
Page 2

9S
9T
9X
9N
8J
8Y
6N
6H
6A
3K
4A
3C
5C
3G
9A
9R
8G
7R
6G
9K9M
8X
8C
8R
7H
7F
4P
6F
2A
4Z
1A
9A
9W
9Y
7J
7P
6S
4F
3A
4R
2A2A
3P
5F
4Y
5T
9H
8P
8T
8S
6P6R
6J
3H
4G 4H
4S
3N
4J
5G
4L
5S
7S
6C
2A
4B
3S
4T
4K
5A
9G
8M
8H
8W
7M
4O
4W
5H
3J
3R
5J
5R
1C
9J
9C
9F
8A
9P
8N
8F
7A 6K
3M
3F
4U
4C
Black Bear Harvest Density2015
NYSDEC Bureau of Wildlife, February 2016
Northern Zone
Southern Zone
Allegany State Parkprohibits bear hunting
Bears Taken per 100 Square Miles0.1 - 2.5
2.6 - 5.0
5.1 - 10.0
10.1 - 15.0
15.1 - 33.1
WMUs
No Bear Hunting
Page 3

2015 NEW YORK STATE BLACK BEAR TAKE BY WILDLIFE MANAGEMENT UNITSeason Key: E = Early, B = Bowhunting, M = Muzzleloader, R = Regular, T = Total
Department of Environmental Conservation
E
NORTHERN
B M R TWMU
5A 01 1 4 6
5C 315 12 24 54
5F 06 5 13 24
5G 13 3 15 22
5H 1530 18 74 137
5J 29 5 6 22
6A 50 3 8 16
6C 444 14 28 90
6F 625 9 31 71
6G 00 1 1 2
6H 110 2 4 17
6J 840 18 22 88
6K 30 2 12 17
6N 50 1 11 17
Regular
583ZONENORTHERN
183Bowhunting 53Muzzleloader 94
253
Early
E
SOUTHERN
B M R TWMU
3A 1240 1 31 84
3C 1224 0 26 62
3F 10 0 0 1
3G 60 0 6 12
3H 1322 0 34 69
3J 62 0 12 20
3K 1645 0 65 126
3M 1920 3 34 76
3N 00 0 2 2
3P 81 0 5 14
3R 03 0 1 4
4C 00 0 5 5
4F 10 1 7 9
4G 100 1 9 20
4H 40 1 6 11
4K 30 0 4 7
4L 20 0 7 9
4O 200 1 32 53
4P 712 2 12 33
4R 723 1 17 48
4S 30 1 3 7
4U 30 0 3 6
4W 190 0 60 79
4Z 30 0 4 7
5S 70 0 10 17
6R 40 0 13 17
6S 20 0 0 2
7M 00 0 4 4
7P 00 0 3 3
7S 200 1 8 29
8G 00 0 2 2
8M 20 0 0 2
8N 20 0 1 3
8P 30 0 2 5
8R 20 0 0 2
8T 200 1 17 38
8W 50 0 8 13
8X 280 0 30 58
8Y 60 0 18 24
9G 10 0 0 1
9H 00 0 2 2
9J 170 0 21 38
9K 70 0 4 11
9M 40 0 5 9
9N 00 0 1 1
9P 80 0 14 22
9R 60 2 17 25
9T 00 0 10 10
9W 50 0 3 8
9X 30 1 10 14
9Y 00 0 8 8
Regular
1,132ZONESOUTHERN
192Bowhunting 327Muzzleloader 17
596
Early
STATE TOTAL 1,715
NEW YORK STATE BEAR TAKE BY SEX*
NZ E B M R T
Male 120 39 65 166 389
Female 63 14 28 86 191 SZ E B M R T
Male 114 234 10 358 715 Female 78 90 7 236 411
* Sex was not reported for all bears.
* Only Wildlife Management Units (WMUs) with reported bear harvests are included here.
Page 4

9S
9T
9X
9N
8J
8Y
6N
6H
6A
3K
4A
3C
5C
3G
9A
9R
8G
7R
6G
9K9M
8X
8C
8R
7H
7F
4P
6F
2A
4Z
1A
9A
9W
9Y
7J
7P
6S
4F
3A
4R
2A2A
3P
5F
4Y
5T
9H
8P
8T
8S
6P6R
6J
3H
4G 4H
4S
3N
4J
5G
4L
5S
7S
6C
2A
4B
3S
4T
4K
5A
9G
8M
8H
8W
7M
4O
4W
5H
3J
3R
5J
5R
1C
9J
9C
9F
8A
9P
8N
8F
7A 6K
3M
3F
4U
4C
Black Bear Harvest by Town
2015
NYSDEC Bureau of Wildlife, February 2016
Northern Zone
Southern Zone
Allegany State Parkprohibits bear hunting
# Bears Taken1 - 5
6 - 10
11 - 15
16 - 25
26 - 50
No Bear Hunting
WMUs
Towns
Page 5

NEW YORK STATE BEAR TAKE BY TOWN AND COUNTY*
Key: E = Early, B = Bowhunting, M = Muzzleloader, R = Regular, T = Total
2015
NORTHERN ZONE
583183
53
94
ZONE TOTAL
EARLY
BOWHUNTING
MUZZLELOADER
REGULAR 253
ECLINTON B M R T
Altona 00 0 1 1Ausable 15 0 0 6Beekmantown 00 0 2 2Black Brook 04 3 7 14Clinton 00 0 2 2Ellenburg 01 1 2 4Mooers 00 0 1 1Peru 03 0 0 3Saranac 02 1 9 12Schuyler Falls 00 0 1 1
15 1 5 25 46TOTAL
EESSEX B M R T
Chesterfield 01 0 0 1Crown Point 00 3 1 4Elizabethtown 00 1 0 1Essex 00 0 2 2Jay 02 0 1 3Keene 00 1 2 3Lewis 00 0 2 2Minerva 02 1 3 6Moriah 00 0 2 2Newcomb 00 0 2 2North Elba 00 0 1 1Schroon 03 2 1 6St Armand 02 0 1 3Ticonderoga 20 0 2 4Westport 01 0 0 1Wilmington 00 2 1 3
11 2 10 21 44TOTAL
EFRANKLIN B M R T
Bellmont 01 4 1 6Brandon 21 0 0 3Brighton 02 0 0 2Duane 01 0 0 1Franklin 00 1 0 1Harrietstown 00 2 2 4Malone 10 0 3 4Moira 00 1 0 1Santa Clara 01 0 1 2Tupper Lake 03 0 3 6Waverly 20 0 6 8
9 5 8 16 38TOTAL
EFULTON B M R T
Bleecker 01 2 3 6Ephratah 00 0 1 1Johnstown 00 2 0 2Mayfield 20 1 1 4Oppenheim 03 1 3 7Stratford 01 2 0 3
5 2 8 8 23TOTAL
EHAMILTON B M R T
Arietta 21 0 1 4Hope 00 0 2 2Indian Lake 12 0 4 7Inlet 00 1 2 3Lake Pleasant 00 1 3 4Long Lake 04 4 4 12Morehouse 00 0 3 3Wells 11 1 9 12
8 4 7 28 47TOTAL
EHERKIMER B M R T
Fairfield 00 0 4 4Norway 30 3 6 12Ohio 44 0 8 16Russia 12 2 1 6Salisbury 05 2 9 16Webb 13 1 4 9
14 9 8 32 63TOTAL
EJEFFERSON B M R T
Antwerp 51 2 1 9Le Ray 02 0 1 3Lorraine 20 0 0 2Philadelphia 02 0 0 2Rodman 00 1 3 4Rutland 00 0 1 1Theresa 00 0 2 2Wilna 08 0 1 9
13 7 3 9 32TOTAL
ELEWIS B M R T
Croghan 012 11 5 28Denmark 10 0 0 1Diana 32 2 9 16Greig 15 2 1 9Leyden 00 1 0 1Lowville 00 0 1 1Lyonsdale 13 0 3 7Martinsburg 10 1 5 7New Bremen 03 1 2 6Osceola 30 0 3 6Pinckney 00 0 1 1Turin 00 0 3 3Watson 011 2 4 17West Turin 00 0 1 1
36 10 20 38 104TOTAL
EONEIDA B M R T
Annsville 10 0 0 1Ava 00 1 0 1Boonville 02 4 4 10Camden 00 0 1 1Forestport 25 0 3 10Remsen 11 0 6 8Western 00 0 1 1
8 4 5 15 32TOTAL
ESARATOGA B M R T
Corinth 02 0 0 2Day 01 0 0 1Edinburg 00 1 2 3Hadley 00 0 1 1
3 0 1 3 7TOTAL
EST LAWRENCE B M R T
Canton 01 3 1 5Clare 04 1 7 12Clifton 01 0 0 1Colton 04 2 8 14Edwards 06 0 3 9Fine 112 2 2 17Fowler 11 0 2 4Gouverneur 00 1 4 5Hermon 04 1 0 5Hopkinton 26 2 6 16Lawrence 00 2 0 2Morristown 10 0 0 1Parishville 15 1 1 8Piercefield 01 2 4 7Pierrepont 03 0 1 4Pitcairn 26 0 1 9Potsdam 00 0 1 1Russell 11 1 6 9
55 9 18 47 129TOTAL
EWARREN B M R T
Chester 00 0 1 1Hague 00 0 1 1Horicon 00 0 1 1Johnsburg 03 0 3 6Lake George 00 0 1 1Stony Creek 02 0 0 2Thurman 00 0 1 1Warrensburg 00 0 3 3
5 0 0 11 16TOTAL
EWASHINGTON B M R T
Fort Ann 01 1 0 21 0 1 0 2TOTAL
* Only towns with reported bear harvests are included here.
Page 6

SOUTHERN ZONE
1,132192
327
17
ZONE TOTAL
EARLY
BOWHUNTING
MUZZLELOADER
REGULAR 596
EALBANY B M R T
Berne 00 0 1 1Coeymans 00 0 1 1New Scotland 00 0 2 2Rensselaerville 00 0 2 2Westerlo 20 1 0 3
0 2 1 6 9TOTAL
EALLEGANY B M R T
Alfred 00 0 2 2Alma 20 0 4 6Almond 20 0 0 2Amity 00 0 1 1Andover 10 0 4 5Angelica 00 0 2 2Belfast 10 0 0 1Birdsall 00 0 1 1Burns 00 0 1 1Caneadea 10 0 1 2Clarksville 20 0 2 4Cuba 00 0 2 2Friendship 00 0 1 1Hume 10 0 0 1New Hudson 00 0 1 1Rushford 10 0 0 1Scio 10 0 0 1Wellsville 00 0 2 2West Almond 00 0 1 1Willing 10 0 3 4Wirt 20 0 3 5
0 15 0 31 46TOTAL
EBROOME B M R T
Binghamton 10 0 0 1Colesville 30 1 2 6Conklin 30 0 0 3Fenton 00 0 1 1Kirkwood 10 0 1 2Sanford 50 0 8 13Vestal 00 0 2 2Windsor 90 0 6 15
0 22 1 20 43TOTAL
ECATTARAUGUS B M R T
Allegany 00 0 2 2Carrollton 00 0 1 1Cold Spring 00 2 3 5Conewango 00 0 1 1Dayton 00 0 1 1East Otto 00 0 1 1Ellicottville 00 0 1 1
Franklinville 10 0 0 1Great Valley 00 0 2 2Hinsdale 10 0 2 3Humphrey 00 0 1 1Ischua 00 0 1 1Little Valley 20 0 3 5Lyndon 10 0 0 1Machias 10 0 0 1Napoli 00 0 1 1Olean 00 0 2 2Otto 00 0 1 1Persia 00 0 2 2Portville 10 1 0 2Randolph 00 0 3 3Salamanca 00 0 1 1South Valley 40 0 2 6Yorkshire 10 0 0 1
0 12 3 31 46TOTAL
ECHAUTAUQUA B M R T
Arkwright 40 0 0 4Busti 00 0 1 1Carroll 10 0 4 5Chautauqua 00 0 3 3Cherry Creek 30 0 0 3Clymer 20 0 1 3Ellicott 10 0 0 1Ellington 00 0 1 1French Creek 00 0 8 8Gerry 00 0 1 1Harmony 10 0 1 2Kiantone 00 0 2 2Mina 10 0 0 1North Harmony 10 0 0 1Ripley 50 0 1 6Sherman 10 0 2 3Stockton 30 0 1 4Westfield 20 0 2 4
0 25 0 28 53TOTAL
ECHEMUNG B M R T
Ashland 10 0 2 3Baldwin 00 0 1 1Big Flats 20 0 1 3Chemung 00 0 3 3Horseheads 00 0 2 2Southport 10 0 3 4
0 4 0 12 16TOTAL
ECHENANGO B M R T
Afton 10 0 3 4Bainbridge 10 0 2 3Norwich 00 0 1 1Otselic 00 0 2 2Pharsalia 00 0 1 1Smithville 00 0 1 1
0 2 0 10 12TOTAL
ECOLUMBIA B M R T
Ancram 00 0 1 1Austerlitz 00 0 1 1
Canaan 10 0 2 3Chatham 10 0 1 2Copake 00 0 1 1Hillsdale 30 0 0 3New Lebanon 10 0 2 3
0 6 0 8 14TOTAL
EDELAWARE B M R T
Andes 16 0 8 15Bovina 10 0 4 5Colchester 52 0 14 21Delhi 10 0 1 2Deposit 60 0 5 11Franklin 10 0 0 1Hamden 04 1 2 7Hancock 130 0 34 47Masonville 30 0 0 3Middletown 43 1 0 8Roxbury 15 0 2 8Sidney 10 0 1 2Stamford 20 0 0 2Tompkins 10 0 6 7Walton 10 1 8 10
20 41 3 85 149TOTAL
EDUTCHESS B M R T
Dover 30 0 3 6Milan 10 0 0 1Northeast 10 0 1 2Pawling 20 0 0 2Stanford 00 0 2 2
0 7 0 6 13TOTAL
EERIE B M R T
Hamburg 10 0 0 10 1 0 0 1TOTAL
EFULTON B M R T
Ephratah 00 0 1 10 0 0 1 1TOTAL
EGENESEE B M R T
Byron 00 0 1 10 0 0 1 1TOTAL
EGREENE B M R T
Ashland 03 0 2 5Athens 10 0 0 1Cairo 07 0 2 9Catskill 41 0 3 8Durham 03 0 2 5Halcott 00 0 3 3Hunter 13 0 4 8Jewett 22 0 5 9Lexington 45 0 4 13New Baltimore 00 2 0 2Prattsville 02 0 0 2Windham 00 0 1 1
26 12 2 26 66TOTAL
EHERKIMER B M R T
Fairfield 00 0 2 2
* Only towns with reported bear harvests are included here.
Page 7

German Flatts 10 0 0 1Little Falls 00 0 1 1Manheim 10 0 3 4Salisbury 10 0 1 2
0 3 0 7 10TOTAL
ELIVINGSTON B M R T
Groveland 10 0 0 1Nunda 00 0 1 1Ossian 00 0 1 1Portage 00 0 2 2Springwater 00 0 1 1West Sparta 10 0 0 1
0 2 0 5 7TOTAL
EMONTGOMERY B M R T
Palatine 00 0 2 2St Johnsville 00 0 2 2
0 0 0 4 4TOTAL
EONEIDA B M R T
Deerfield 30 0 0 30 3 0 0 3TOTAL
EONTARIO B M R T
Richmond 10 0 0 10 1 0 0 1TOTAL
EORANGE B M R T
Blooming Grove 00 0 2 2Chester 11 0 0 2Deerpark 14 0 7 12Goshen 10 0 0 1Greenville 45 0 3 12Highlands 10 0 2 3Middletown 00 0 1 1Minisink 30 1 2 6Monroe 33 0 0 6Mount Hope 00 0 2 2Port Jervis City 01 0 0 1Tuxedo 42 0 1 7Wallkill 20 0 0 2Warwick 79 1 19 36Woodbury 01 0 0 1
26 27 2 39 94TOTAL
EOTSEGO B M R T
Cherry Valley 00 0 1 1Maryland 00 0 3 3Milford 00 1 0 1Roseboom 00 0 1 1Worcester 10 0 0 1
0 1 1 5 7TOTAL
EPUTNAM B M R T
Kent 00 0 1 1Southeast 00 0 1 1
0 0 0 2 2TOTAL
ERENSSELAER B M R T
Berlin 10 0 1 2East Greenbush 20 0 0 2
Grafton 00 0 3 3Hoosick 10 0 3 4Nassau 00 0 3 3Poestenkill 00 0 1 1Sand Lake 10 0 0 1Schaghticoke 00 0 1 1Stephentown 00 0 2 2
0 5 0 14 19TOTAL
EROCKLAND B M R T
Ramapo 01 0 1 21 0 0 1 2TOTAL
ESCHOHARIE B M R T
Blenheim 10 0 0 1Broome 10 0 3 4Conesville 10 0 4 5Fulton 40 0 2 6Gilboa 41 1 2 8Jefferson 20 0 0 2Richmondville 00 0 2 2Schoharie 00 0 2 2
1 13 1 15 30TOTAL
ESCHUYLER B M R T
Montour 00 0 1 1Orange 00 0 3 3Tyrone 10 0 0 1
0 1 0 4 5TOTAL
ESTEUBEN B M R T
Addison 20 0 3 5Avoca 10 0 0 1Bath 40 0 2 6Cameron 30 0 2 5Campbell 50 0 3 8Canisteo 10 0 8 9Caton 20 0 1 3Cohocton 20 0 0 2Corning 30 0 2 5Erwin 20 2 3 7Greenwood 30 0 11 14Hartsville 60 0 2 8Hornby 00 0 1 1Hornellsville 10 0 4 5Howard 20 0 0 2Jasper 40 0 1 5Lindley 20 0 3 5Prattsburg 00 0 2 2Rathbone 20 0 2 4Thurston 30 0 1 4Troupsburg 20 0 1 3Tuscarora 10 0 2 3West Union 50 0 0 5Woodhull 10 0 2 3
0 57 2 56 115TOTAL
ESULLIVAN B M R T
Bethel 12 0 9 12Callicoon 32 0 1 6Cochecton 30 0 0 3
Delaware 10 0 5 6Fallsburgh 23 0 6 11Forestburg 29 0 9 20Fremont 10 0 6 7Highland 14 0 11 16Liberty 04 0 2 6Lumberland 42 0 11 17Mamakating 211 0 7 20Neversink 011 0 6 17Rockland 36 0 3 12Thompson 413 0 6 23Tusten 24 0 17 23
71 29 0 99 199TOTAL
ETIOGA B M R T
Barton 10 0 0 1Nichols 10 0 1 2Owego 30 0 2 5
0 5 0 3 8TOTAL
EULSTER B M R T
Denning 110 0 8 19Esopus 20 0 0 2Hardenburgh 01 1 1 3Hurley 12 0 1 4Kingston 10 0 2 3Lloyd 10 0 1 2Marbletown 02 0 1 3Olive 08 0 4 12Rochester 64 0 9 19Rosendale 10 0 1 2Saugerties 22 0 4 8Shandaken 13 0 11 15Shawangunk 01 0 5 6Ulster 11 0 0 2Wawarsing 65 0 13 24Woodstock 18 0 2 11
47 24 1 63 135TOTAL
EWASHINGTON B M R T
Cambridge 00 0 2 2Easton 10 0 1 2Hebron 20 0 0 2Jackson 00 0 4 4Salem 00 0 1 1White Creek 30 0 2 5
0 6 0 10 16TOTAL
EWYOMING B M R T
Perry 00 0 2 2Pike 00 0 1 1
0 0 0 3 3TOTAL
EYATES B M R T
Italy 00 0 1 1Jerusalem 10 0 0 1
0 1 0 1 2TOTAL
* Only towns with reported bear harvests are included here.
STATE TOTAL 1,715
Page 8
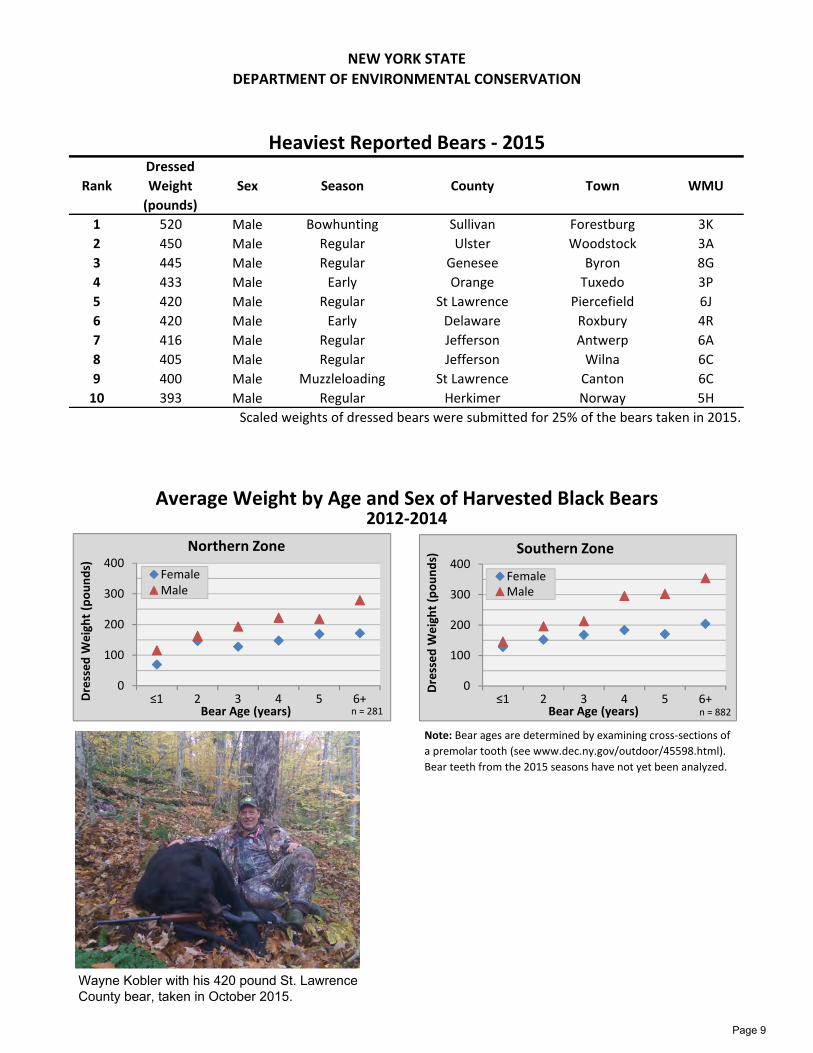
Rank
Dressed
Weight
(pounds)
Sex Season County Town WMU
1 520 Male Bowhunting Sullivan Forestburg 3K
2 450 Male Regular Ulster Woodstock 3A
3 445 Male Regular Genesee Byron 8G
4 433 Male Early Orange Tuxedo 3P
5 420 Male Regular St Lawrence Piercefield 6J
6 420 Male Early Delaware Roxbury 4R
7 416 Male Regular Jefferson Antwerp 6A
8 405 Male Regular Jefferson Wilna 6C
9 400 Male Muzzleloading St Lawrence Canton 6C
10 393 Male Regular Herkimer Norway 5H
Scaled weights of dressed bears were submitted for 25% of the bears taken in 2015.
Note: Bear ages are determined by examining cross‐sections of
a premolar tooth (see www.dec.ny.gov/outdoor/45598.html).
Bear teeth from the 2015 seasons have not yet been analyzed.
NEW YORK STATE
Average Weight by Age and Sex of Harvested Black Bears2012‐2014
DEPARTMENT OF ENVIRONMENTAL CONSERVATION
Heaviest Reported Bears ‐ 2015
0
100
200
300
400
≤1 2 3 4 5 6+Dressed W
eight (pounds)
Bear Age (years)
Northern Zone
FemaleMale
n = 281
0
100
200
300
400
≤1 2 3 4 5 6+
Dressed W
eight (pounds)
Bear Age (years)
Southern Zone
FemaleMale
n = 882
Wayne Kobler with his 420 pound St. Lawrence County bear, taken in October 2015.
Page 9

Notes: Sum of male and female proporations across seasons within each zone equals 100%.
Male and female bear take during the Southern Zone muzzleloader seasons were <2% if the total harvest.
2015 Distribution of Black Bear Harvest by Sex
NEW YORK STATE
DEPARTMENT OF ENVIRONMENTAL CONSERVATION
2015 Reported Bear Take by Day
0
2
4
6
8
10
12
14
16
18
20
9/19 9/26 10/3 10/10 10/17 10/24 10/31 11/7 11/14 11/21 11/28 12/5
# Bears
Northern Zone
Female
Male
0102030405060708090100110120
9/12 9/19 9/26 10/3 10/10 10/17 10/24 10/31 11/7 11/14 11/21 11/28 12/5 12/12 12/19
# Bears
Southern Zone
Female
Male
0%
10%
20%
30%
40%
Early Bow Muzzle Regular Early Bow Muzzle Regular
Northern Zone Southern Zone
Female
Male
Page 10

* Note: Bear ages are determined by
examining cross‐sections of a premolar tooth
(see www.dec.ny.gov/outdoor/45598.html).
Bear ages from the 2015 seasons have not yet
been determined and will be included in the
2016 report. Juvenile bears (<1 year) may be
legally taken in the Adirondack.
NEW YORK STATEDEPARTMENT OF ENVIRONMENTAL CONSERVATION
Age Distribution of Bear Harvest in the 2014 Season*
Average Age of Harvested Bears
0%
10%
20%
30%
40%
50%
60%
≤1 2 3 4 5 6 7 8 9 ≥10
Bear Age (years)
Northern Zone
Female
Male
n = 255
0%
10%
20%
30%
40%
50%
≤1 2 3 4 5 6 7 8 9 ≥10
Bear Age (years)
Southern Zone
Female
Male
n = 699
0
1
2
3
4
5
6
7
years
Northern Zone
FemaleMale
0
1
2
3
4
5
6
years
Southern Zone
Female
Male
Page 11

NEW YORK STATE BLACK BEAR HARVEST HISTORYDepartment of Environmental Conservation
Year
STATE TOTALS
E B M R
NORTHERN ZONE
E B M R
SOUTHERN ZONE
TOTALTOTAL E B M R TOTAL
2015 1,715375 380 111 849583183 53 94 253 1,132192 327 17 5962014 1,628629 330 58 611518291 26 42 159 1,110337 305 16 4512013 1,35884 332 41 90138084 15 35 246 978317 6 6552012 1,337386 371 55 525606386 39 49 132 731332 6 3932011 1,25870 293 30 86527570 3 9 193 983290 21 6722010 1,064255 315 81 413521255 35 71 160 543280 10 2532009 1,487426 310 138 613814426 44 128 216 673266 10 3972008 1,29585 232 117 86158285 13 99 385 713219 18 4762007 1,117306 247 70 494544306 28 61 149 573219 9 3452006 79674 237 25 46031874 9 16 219 478228 9 2412005 1,066184 227 56 599453184 19 45 205 613208 11 3942004 1,014425 227 58 304674425 49 54 146 340178 4 1582003 1,863730 256 122 7551,370730 35 112 493 493221 10 2622002 912182 127 34 569550182 16 30 322 362111 4 2472001 800240 145 54 361523240 18 52 213 277127 2 1482000 1,070180 107 39 744728180 12 37 499 34295 2 2451999 685270 126 35 254523270 37 34 182 16289 1 721998 59732 76 13 47627732 13 11 221 32063 2 2551997 525133 73 38 281346133 1 37 175 17972 1 1061996 64279 38 19 50636979 0 17 273 27338 2 233
0
250
500
750
1000
1250
1500
1750
2000
1990
1991
1992
1993
1994
1995
1996
1997
1998
1999
2000
2001
2002
2003
2004
2005
2006
2007
2008
2009
2010
2011
2012
2013
2014
2015
# B
ears
Northern
Southern
NYS
SEASON KEY: E=Early B=Bowhunting M=Muzzleloading R=Regular
Page 12

NEW YORK STATE DEPARTMENT OF ENVIRONMENTAL CONSERVATION
2015 Bear Hunting Seasons
Page 13

NEW YORK STATE DEPARTMENT OF ENVIRONMENTAL CONSERVATION
Black Bear Management Cooperator Program
DEC relies upon hunter participation to collect critical data for black bear management. Successful hunters are required by law to report their harvest, but many hunters also voluntarily submit premolar teeth from the bears (Figure 1), which are then used to determine the bear’s age. DEC uses this information to assess the impact of harvest on the bear population by determination of the average age of harvested male and female bears in the various bear hunting areas. Additionally, by recording age and sex of harvested bears over a period of years, biologists can more accurately model bear populations.
Hunters who Report their Bear and Submit a Tooth become NYS Black Bear Management Cooperators and receive a commemorative patch.
Black Bear Cooperator Patches 2006‐2015
Figure 1. Portion of bear skull showing upper and lower premolar teeth, immediately behind the large canines.
Page 14

NEW YORK STATE DEPARTMENT OF ENVIRONMENTAL CONSERVATION
Learn More about Black Bears
DEC has several great resources available for those interested in learning more about black bears, bear management, and bear hunting.
Living with New York Black Bears is
available at school and public
libraries throughout New York.
DEC has partnered with Untamed Science to provide
free curriculum and multimedia resources available to
all New York Educators; loads of interactive learning
appropriate for students in kindergarten to 8th grade.
This short booklet is full of tips for
bear hunters, before and after the
harvest.
www.dec.ny.gov/docs/wildlife_pdf/bb
hunting10.pdf
See www.dec.ny.gov/animals/7215.html
for New York’s Black Bear program.
This booklet, from the Northeast Black
Bear Technical Committee, describes
various options for bear management.
www.dec.ny.gov/docs/wildlife_pdf/bear
mgmtopt.pdf
Page 15