2015 bus stop accessibility report
TRANSCRIPT

2015 Bus Stop Assessment Prepared By: Ronnie Prince – Jones December 2015

1
Introduction
The Mass Transportation Authority (MTA) is the public transportation provider for Genesee County, Michigan. The MTA offers both demand response and fixed route service. Demand response is provided through curb-to-curb service while fixed route service is provided by local route bus stops. The MTA operates 14 fixed routes in the City of Flint and partially into surrounding suburbs. Bus stops serve as the connection between the bus and the community. In an effort to enhance the transit rider experience and improve accessibility for limited-mobility riders, the MTA has undergone an analysis of bus stops. MTA first commissioned The Disability Network of Genesee County to assess the accessibility of stops and shelters based on guidelines established by the Americans with Disabilities Act (ADA). After a review of over 200 stops, TDN made seven observations and corresponding recommendations identified in the Bus Stop Accessibility Study (2014). In addition to accessibility, these observations and recommendations considered connectivity of the stop to adjacent sidewalks and streets, shelter design and maintenance, signage, and the Adopt-A-Shelter program. While this study highlights common stop and shelter mistakes and offers crucial recommendations, a comprehensive study of stops and shelters is needed to fully understand the breadth of the problem. System-wide, there are 1,142 bus stops. For each primary fixed route there can be 65-130 stops per outbound and inbound cycle. There are 85 shelters spread across the fixed route system. Shelters are typically located in high-traffic areas such as neighborhood, commercial, or employment centers. While the MTA operates an Adopt-A-Shelter program, all stops and shelters are owned and operated by the MTA. As the City of Flint undergoes a resurgence of planning and community development a renewed emphasis has been placed on the role stops and shelters play in the community. Community members have discussed the need for more stops and shelters and want to participate in the Adopt-A-Shelter program. In order for the MTA to fulfill these requests, a comprehensive inventory and analysis of stops and shelters of the MTA fixed routes was completed. This report will be used as a tool to improve bus stop connectivity, accessibility, and safety. Through this report, MTA will consider short-term solutions that can impact today’s riders and long-term solutions that can be implemented as a way to attract new riders of all ages. Genesee County’s population is expected to become older, with mobility issues increasing. As MTA implements changes, ensuring access for senior citizens and persons with disabilities is a continued concern. This project will provide supplemental information and data that may prove beneficial when seeking future capital funding.
Methodology
Before collecting data for this report, the Bus Stop Accessibility Study prepared by The Disability Network was used as a reference to evaluate the entire fixed route system. Bus Stops were identified and evaluated using the latest updated version of the run guides for each route. Run guides are an operational tool used to show the route, run times, and stop locations.

2
From riding the bus, a MTA representative was able to observe patrons waiting for bus stops and entering on and off the bus. Data was collected while riding the bus using Route Evaluation Forms. Stops were rated during normal operating hours of fixed routes. Therefore, the amount of time to visually assess conditions varies. In order to better compensate for this each route, inbound and outbound, were rode at least twice. By seeing the process in real-time and gathering data through personal interaction as well, added a level of fluidity that walking or driving to bus stops would not permit. Assessments of the fixed route system were done in June and July 2015 midday, between 12pm and 5pm. Weather conditions were favorable during assessments. Bus Stops were rated on three conditions: Sidewalk Condition, Accessibility, and Shelter Condition (if applicable). These conditions are standard features when accessing bus stops. All stops were rated by Sidewalk Conditions. This is an important criterion, because sidewalks create safer places for pedestrians to travel along roadways can encourage more people to use transit systems. It is critical to ensure that sidewalks and other pedestrian pathways gave appropriate width, surface, and separation from motor vehicle traffic, lighting, and signage along roadways. Sidewalks serve as the primary medium for pedestrians and they are a critical part of public transit systems. Narrow sidewalks that cannot accommodate the volume of foot traffic may encourage pedestrians to walk in the roadway or take alternate routes, increasing the potential for conflict with motor vehicles.i When scoring sidewalks, the area surrounding the stop was assessed. A stop could receive a rating between 1 (poor) and 5 (excellent). If the sidewalk is concrete, with minimal or no cracks at all it received a rating 5 (excellent) as it serves as an ideal model. For stops in areas were sidewalk is non-existent with only grassy areas or dirt path it received a rating 1 (poor). For stops that received a rating 1 (poor) or rating 2 (below average) there is need to be concern as there is no dedicated pedestrian path which may result in users seeking to walk along the side of the street. The next criterion, Accessibility/Connectivity, is closely related to Sidewalk Conditions. Connectivity of sidewalks is important for individuals that find walking challenging or use a mobility device. The distinctive difference between sidewalk conditions and accessibility/connectivity is ease of usage for passengers. Within this category, the slope and width of sidewalks were also taken into account. Lastly, for bus stops that have bus shelters they were ranked with another criterion, Shelter Condition. This criterion is important as it was used to update the MTA’s record of shelter location and the current conditions. For the purposes of this report, only the structural aesthetics of the shelters were rated. A pleasant waiting area can improve a passenger’s experience and increase transit usage. According to the Federal Highway Administration, well-designed shelters should have the following characteristics:
Bus drivers should have a clear sight line to the bus stop or shelter, so that they have sufficient time to see and stop for passengers.
Passengers waiting at the bus stop and in the shelter should have sufficient time to see and hail the bus, especially at bus stops serving more than one route.
Bus shelters should be transparent and well lit

3
Based upon these characteristics established by the Federal Highway Administration, bus shelters were ranked in addition with the criteria established.i This was taken into account in addition to shelter condition. Each applicable criterion is important when evaluating bus stops. Research has shown that neighborhoods that contain obstacles such as narrow or missing sidewalks, poor lighting, and poor roadway connectivity are likely to discourage walking and bicycling on residential streets.ii
Criteria
Sidewalk Condition (1 – 5) 1: Poor – Sidewalk is non-existent; grassy area is worn to dirt path or no grass is present
2: Below Average– grassy area; Sidewalk consists of loose gravel; and/or excessive cracks in concrete; concrete pad
3: Average – Sidewalk is standard concrete, cracks in concrete; Concrete is slightly uneven 4: Good – Sidewalk is concrete, some cracks in concrete
5: Excellent – Sidewalk is concrete, minimal cracks in concrete or none at all Accessibility/Connectivity (1-5) 1: Poor – No access to sidewalk and/or immediately bus stop is on an active street 2: Below Average – Sidewalk is in a far distance (>10ft), bus stop is on field or tree lawn 3: Average – Small Tree Lawn before sidewalk (<6ft)
4: Good – Bus Stop is directly on concrete, or on small tree lawn (<3ft) with good connectivity 5: Excellent – Bus stop is directly on concrete with good connectivity
Shelter Condition (1 – 5) 1: Poor – Shelter structure is unsound; present itself as a severe hazard. 2: Below Average – Shelter is below standards. Shelter’s windows and benches are broken; graffiti and other acts of vandalism present throughout 3: Average – Minor wear and tear of benches and windows; some graffiti and other acts of vandalism 4: Good – Shelter is without damage to bench or windows; graffiti and other acts of vandalism are minor 5: Excellent – Shelter is without damage and clear of graffiti and other acts of vandalism
4
Data Analysis
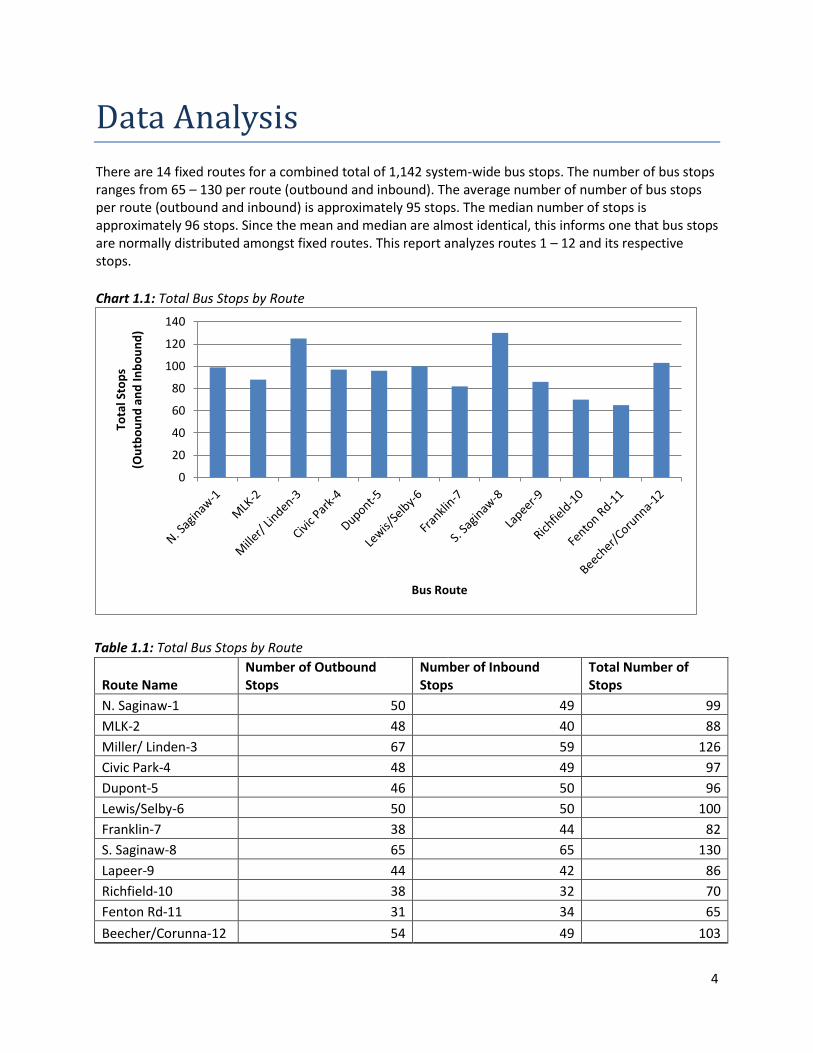
There are 14 fixed routes for a combined total of 1,142 system-wide bus stops. The number of bus stops ranges from 65 – 130 per route (outbound and inbound). The average number of number of bus stops per route (outbound and inbound) is approximately 95 stops. The median number of stops is approximately 96 stops. Since the mean and median are almost identical, this informs one that bus stops are normally distributed amongst fixed routes. This report analyzes routes 1 – 12 and its respective stops.
Chart 1.1: Total Bus Stops by Route
0
20
40
60
80
100
120
140
Tota
l Sto
ps
(Ou
tbo
un
d a
nd
Inb
ou
nd
)
Bus Route
Route Name Number of Outbound Stops
Number of Inbound Stops
Total Number of Stops
N. Saginaw-1 50 49 99
MLK-2 48 40 88
Miller/ Linden-3 67 59 126
Civic Park-4 48 49 97
Dupont-5 46 50 96
Lewis/Selby-6 50 50 100
Franklin-7 38 44 82
S. Saginaw-8 65 65 130
Lapeer-9 44 42 86
Richfield-10 38 32 70
Fenton Rd-11 31 34 65
Beecher/Corunna-12 54 49 103
Table 1.1: Total Bus Stops by Route

5
Chart 2.1: Sidewalk Conditions Assessment
Table 2.1: Sidewalk Observations per ranking
The MTA tries to place bus stops in areas that already have the pedestrian infrastructure to support its fixed route services and the results of the Side Walk Condition Assessment establish this connection. According to the data, 76% of the sidewalks in range of bus stops observed attained a ranking of average or better. The conditions of sidewalks can be attributed to the effects of aging, weather, and overall usage. According to the Federal Highway Administration, concrete sidewalks can last approximately 80 years but many cities consider 25 years to be an expected lifespan for concrete sidewalk.iii It is plausible to be concerned about the large number of sidewalks being rated average as they will have to be replaced or receive routine maintenance in order to prevent from falling below acceptable standards.
5%
26%
45%
17%
7%
Excellent
Good
Average
Below Average
Poor
Sidewalk Condition Total Excellent 54 Good 281 Average 474 Below Average 178 Poor 82
Total Observations 1069

6
Chart 3.1: Accessibility/Connectivity Assessment
Table 3.1: Accessibility/Connectivity Observations per ranking
Accessibility/Connectivity refers to the ease of usage of the sidewalk when entering and exiting the bus. The high number stops rated average can be attributed to the wide variation of bus stops. The MTA puts its best effort forth to cater to the needs of individuals who are physically disabled by placing stops that are accessible and connective. In efforts to further accommodate for needs, the MTA offers curb-to-curb paratransit service. In areas where curb-to-curb service overlaps with fixed routes services individuals must be at least 65 years old or disabled. Unrestricted curb-to-curb service is available to customers outside of the fixed route service area. According to the data, 68% of the sidewalks in range of bus stops observed attained a ranking of average or better.
6%
25%
37%
23%
9%
Excellent
Good
Average
Below Average
Poor
Accessibility/Connectivity Total
Excellent 60
Good 273
Average 401
Below Average 241
Poor 94
Total Observations 1069
7
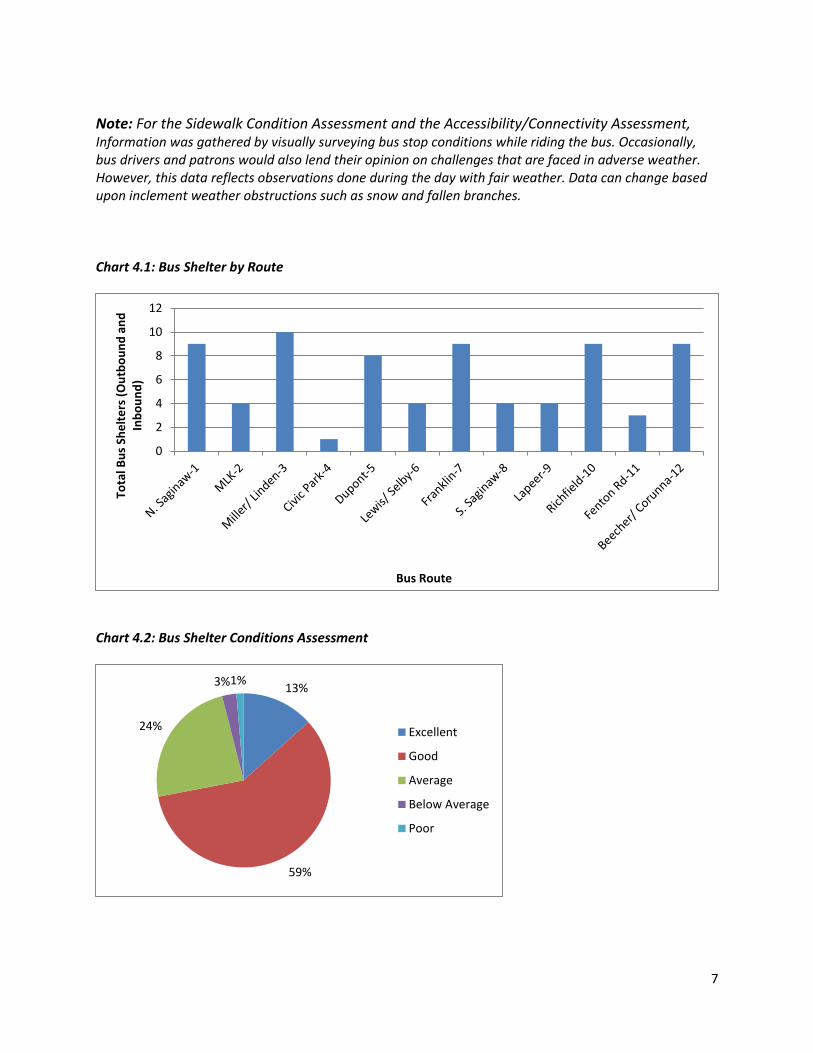
Note: For the Sidewalk Condition Assessment and the Accessibility/Connectivity Assessment, Information was gathered by visually surveying bus stop conditions while riding the bus. Occasionally, bus drivers and patrons would also lend their opinion on challenges that are faced in adverse weather. However, this data reflects observations done during the day with fair weather. Data can change based upon inclement weather obstructions such as snow and fallen branches. Chart 4.1: Bus Shelter by Route
Chart 4.2: Bus Shelter Conditions Assessment
0
2
4
6
8
10
12
Tota
l Bu
s Sh
elt
ers
(O
utb
ou
nd
an
d
Inb
ou
nd
)
Bus Route
13%
59%
24%
3%1%
Excellent
Good
Average
Below Average
Poor

8
Table 4.2: Bus Shelter Conditions Assessment
Shelter Conditions Total
Excellent 10
Good 44
Average 18
Below Average 2
Poor 1
Total Observations 75
Overall, the bus shelters were generally up to par. 96% of total bus shelters received a rating of average or better. Shelters have a standard size, but there are deviations with some. A standard bus shelter is and has approximately two benches and two entrances/exits to access.
Major Findings
Major Findings: Sidewalk Conditions There is no route that is perfect. Each route has some great bus stops and shelters and each has some terrible stops and shelters. The Miller/Linden Route travels through one of the most commercialized areas within Genesee County serviced by the MTA. It has the highest ridership volume. There are some excellent bus stops on Miller Rd that have road cut outs specifically for transit users, but many of these areas have incomplete sidewalk networks making it difficult for pedestrians to navigate. The Franklin Rd Route primarily services the Flint cultural area and has some great examples of sidewalks in residential areas. For the most part, sidewalks are in acceptable conditions and support accessibility and connectivity for users. There were quite a few bus stops on many routes that would only have one or two slabs of concrete sidewalks that looked relatively new, but no accessible pathways for users.

9
Sidewalk condition examples are below: 5 – Excellent
4 – Good
3 – Average
2 – Below Average

10
1 – Poor
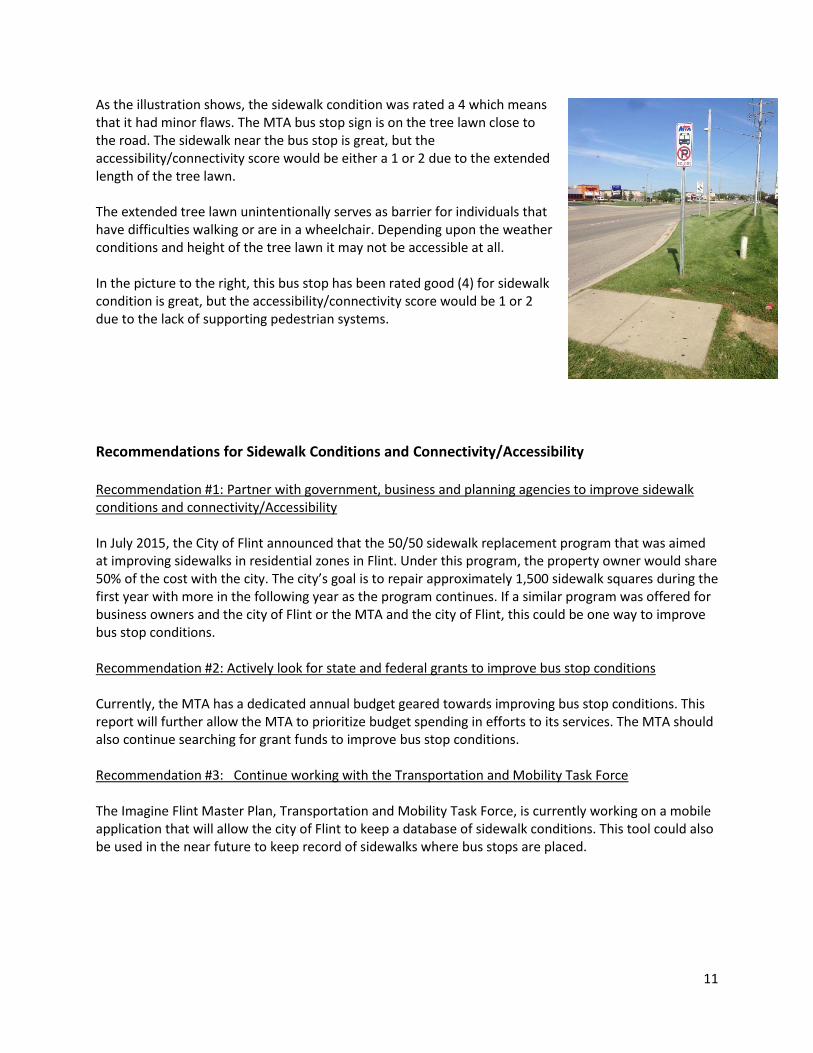
Major Findings: Connectivity/ Accessibility Generally, when sidewalk conditions were ranked average or better the connectivity and accessibility of the stopped were also rated closely to it. For sidewalks that were in good or excellent conditions, they were usually surrounded by similar sidewalks that provided good accessibility and connectivity for pedestrians. In areas where sidewalks were non-existent there were attempts to make the bus stop accessible with one or two slabs of concrete. This always wasn’t the case. There are some areas that have good sidewalks, but there are no accessible pathways for pedestrians. The picture below illustrates a sample bus stop:
11
As the illustration shows, the sidewalk condition was rated a 4 which means that it had minor flaws. The MTA bus stop sign is on the tree lawn close to the road. The sidewalk near the bus stop is great, but the accessibility/connectivity score would be either a 1 or 2 due to the extended length of the tree lawn. The extended tree lawn unintentionally serves as barrier for individuals that have difficulties walking or are in a wheelchair. Depending upon the weather conditions and height of the tree lawn it may not be accessible at all. In the picture to the right, this bus stop has been rated good (4) for sidewalk condition is great, but the accessibility/connectivity score would be 1 or 2 due to the lack of supporting pedestrian systems.
Recommendations for Sidewalk Conditions and Connectivity/Accessibility Recommendation #1: Partner with government, business and planning agencies to improve sidewalk conditions and connectivity/Accessibility In July 2015, the City of Flint announced that the 50/50 sidewalk replacement program that was aimed at improving sidewalks in residential zones in Flint. Under this program, the property owner would share 50% of the cost with the city. The city’s goal is to repair approximately 1,500 sidewalk squares during the first year with more in the following year as the program continues. If a similar program was offered for business owners and the city of Flint or the MTA and the city of Flint, this could be one way to improve bus stop conditions. Recommendation #2: Actively look for state and federal grants to improve bus stop conditions Currently, the MTA has a dedicated annual budget geared towards improving bus stop conditions. This report will further allow the MTA to prioritize budget spending in efforts to its services. The MTA should also continue searching for grant funds to improve bus stop conditions. Recommendation #3: Continue working with the Transportation and Mobility Task Force The Imagine Flint Master Plan, Transportation and Mobility Task Force, is currently working on a mobile application that will allow the city of Flint to keep a database of sidewalk conditions. This tool could also be used in the near future to keep record of sidewalks where bus stops are placed.
12
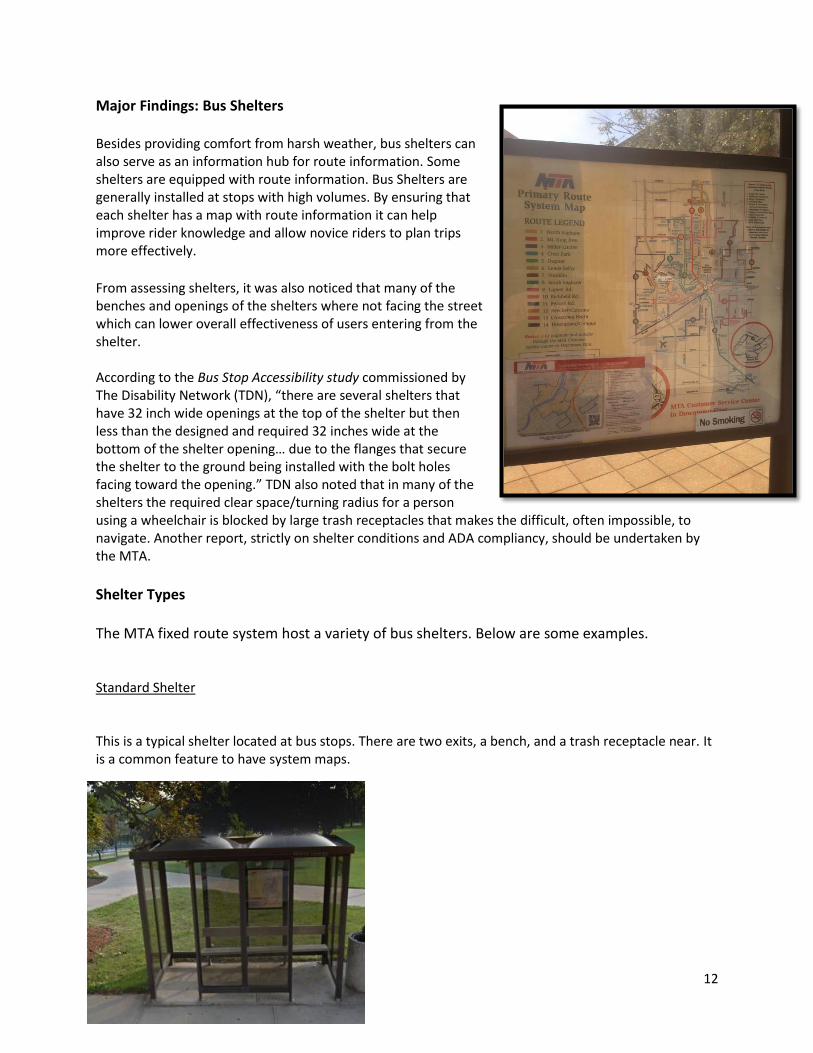
Major Findings: Bus Shelters Besides providing comfort from harsh weather, bus shelters can also serve as an information hub for route information. Some shelters are equipped with route information. Bus Shelters are generally installed at stops with high volumes. By ensuring that each shelter has a map with route information it can help improve rider knowledge and allow novice riders to plan trips more effectively.
From assessing shelters, it was also noticed that many of the benches and openings of the shelters where not facing the street which can lower overall effectiveness of users entering from the shelter. According to the Bus Stop Accessibility study commissioned by The Disability Network (TDN), “there are several shelters that have 32 inch wide openings at the top of the shelter but then less than the designed and required 32 inches wide at the bottom of the shelter opening… due to the flanges that secure the shelter to the ground being installed with the bolt holes facing toward the opening.” TDN also noted that in many of the shelters the required clear space/turning radius for a person using a wheelchair is blocked by large trash receptacles that makes the difficult, often impossible, to navigate. Another report, strictly on shelter conditions and ADA compliancy, should be undertaken by the MTA.
Shelter Types The MTA fixed route system host a variety of bus shelters. Below are some examples. Standard Shelter This is a typical shelter located at bus stops. There are two exits, a bench, and a trash receptacle near. It is a common feature to have system maps.

13
Mega Shelter
The Miller-Linden Route has a “mega shelter” at the Genesee Valley Shopping Center to support idle passengers. The shelter was rated excellent, as it almost appeared new. This is an ideal shelter as it provides ample space for all users. The shelter was also clear of debris, broken, glass, and graffiti. This shelter has been adopted by the Genesee Valley, through the Adopt-A-Shelter program. The Adopt-A-Shelter program allows an organization to assist the MTA with maintaining the condition shelters. Shelters with Amenities
In the pictures above, shelters that use solar powered panels to provide lighting during evening hours. By having shelters that provide light, it encourages transit during the dim lit hours of the day. Passengers will be able to view their surroundings when waiting for the bus.

14
Recommendation for Bus Shelters Recommendation #1: Provide a Primary Route System map at all bus stops with shelters. By providing a Primary Route System map at all bus stops with shelters, it will allow novice riders to plan trips more effectively. This could also include hours of operation and bus stop times as well. This type of information is essential all users, especially those that are not familiar with the primary route services. This shelter located at the University of Michigan-Flint, is one example of a Primary Route System map that should be located at all shelters. By amenities, such as powered lighting, extending size, and additional seating, the overall experience can be enhanced for transit users.
Recommendation #2: Create partnerships with organizations to adopt available shelters. Adopt a Shelter is a program that helps businesses, individuals and community organizations make a difference in their neighborhoods by "adopting" local bus shelters. Mass Transportation Authority staff make regular visits to shelters to make sure that they are in good repair and available for all riders, but we need your help. Those who adopt, whether it's a neighborhood group or an organization, will assist MTA's efforts by alerting the MTA to any special maintenance needs and reporting vandalism or suspicious activity to the proper authorities. Through the Adopt a Shelter program, partners helps keep area bus shelters safe, clean, and clear of ice and snow. By creating partnerships with organizations, in the long-term this should improve the condition the shelter. The Adopt-A Shelter program should be revamped and formalized to incentivize participation to engage community partners. For shelters currently adopted, there are plaques on the shelter with the organization name. Partnerships that have been successful in the past include: the Genesee Valley Mall, University of Michigan-Flint, and Mott Community College. Recommendation #3: Incorporate bus drivers in the maintenance process. Bus drivers are in constant contact with the road and bus stops. A formal form that is routinely turned in once per month with the condition of shelters on their assigned route should be established. When I was riding the bus a driver had told me that he called in to dispatch about a shelter’s glass being broken, weeks had past and it was still there. A formal process that would allow drivers to write down hazards and give it to the appropriate person would place more accountability for cleaning and repairing in a timely manner. This would also help keep an up to date inventory of shelters.

15
Recommendation #4: Consult with The Disability Network when acquiring and moving bus shelters
One of TDN’s recommendations for the MTA in their report is to incorporate accessibility training and accessibility reviews during design, implementation, and maintenance of bus stops and shelters. By consulting with TDN about accessibility issues, particularly bus shelters, it will decrease the likelihood of shelters being inaccessible.
1. i http://safety.fhwa.dot.gov/ped_bike/ped_transit/ped_transguide/ch3.cfm
2. ii https://www.denvergov.org/Portals/746/documents/HIA/HIA_Section%204.pdf
3. iii http://safety.fhwa.dot.gov/ped_bike/tools_solve/fhwasa13037/chap6.cfm