2015 care homes - knight frankcontent.knightfrank.com/research/548/documents/en/2015-3267.pdf ·...
TRANSCRIPT

2015
CARE HOMES TRADING PERFORMANCE REVIEW
HIGHLIGHTSOccupancy rates increase marginally to 88.3% maintaining the post-recession recovery
Average weekly fees rise to £675 and at a rate ahead of RPI inflation for the first time in 5 years
Staff costs equate to 62% of revenue, with notable increases in agency staff costs, further eroding profit margins
RESEARCH
2
2014/15 RESULTS AT A GLANCE
FOREWORD
2013/14 RESULTS AT A GLANCEAll care LFL annual
changePersonal
careLFL annual
changeCare with nursing
LFL annual change
Occupancy 87.6% 91.2% 86.6%
Average Weekly Fees £660 £566 £688
Staff Costs (% of income) 56.9% 55.1% 57.3%
EBITDARM (% income) 27.5% 29.2% 27.1%
Source: Knight Frank
OCCUPANCY AVERAGE WEEKLYFEES
STAFF COSTS(% OF INCOME)
EBITDARM(% INCOME)
ALL CARE PERSONAL NURSING
87.6% 91.2% 86.6% £660 £566 £688 56.9% 55.1% 57.3% 27.5% 29.2% 27.1%
ALL CARE PERSONAL NURSING ALL CARE PERSONAL NURSING ALL CARE PERSONAL NURSING
LFL ANNUAL CHANGE
OCCUPANCY AVERAGE WEEKLYFEES
STAFF COSTS(% OF INCOME)
EBITDARM(% INCOME)
ALL CARE PERSONAL NURSING
87.6% 91.2% 86.6% £660 £566 £688 56.9% 55.1% 57.3% 27.5% 29.2% 27.1%
ALL CARE PERSONAL NURSING ALL CARE PERSONAL NURSING ALL CARE PERSONAL NURSING
LFL ANNUAL CHANGE
OCCUPANCY AVERAGE WEEKLYFEES
STAFF COSTS(% OF INCOME)
EBITDARM(% INCOME)
ALL CARE PERSONAL NURSING
88.3% 90.4% 87.7% £675 £587 £699 61.9% 56.7% 63.1% 27.1% 29.5% 26.5%
ALL CARE PERSONAL NURSING ALL CARE PERSONAL NURSING ALL CARE PERSONAL NURSING
Source: Knight Frank Research
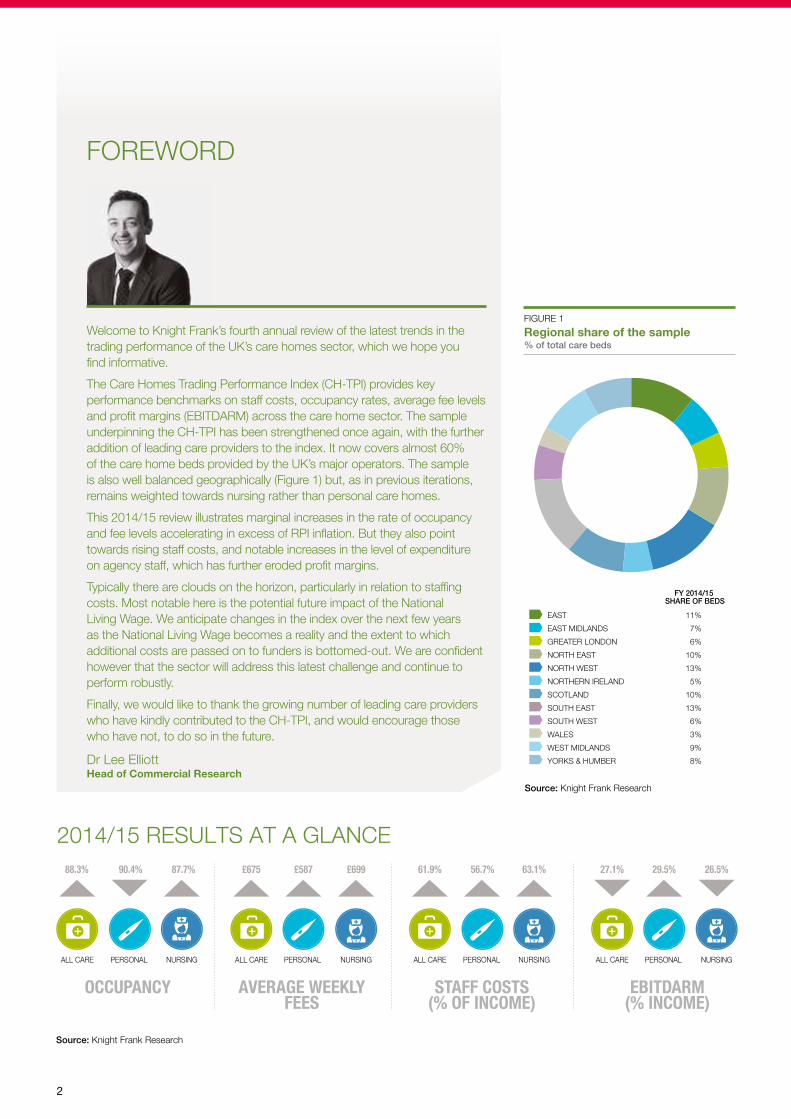
Welcome to Knight Frank’s fourth annual review of the latest trends in the trading performance of the UK’s care homes sector, which we hope you find informative.
The Care Homes Trading Performance Index (CH-TPI) provides key performance benchmarks on staff costs, occupancy rates, average fee levels and profit margins (EBITDARM) across the care home sector. The sample underpinning the CH-TPI has been strengthened once again, with the further addition of leading care providers to the index. It now covers almost 60% of the care home beds provided by the UK’s major operators. The sample is also well balanced geographically (Figure 1) but, as in previous iterations, remains weighted towards nursing rather than personal care homes.
This 2014/15 review illustrates marginal increases in the rate of occupancy and fee levels accelerating in excess of RPI inflation. But they also point towards rising staff costs, and notable increases in the level of expenditure on agency staff, which has further eroded profit margins.
Typically there are clouds on the horizon, particularly in relation to staffing costs. Most notable here is the potential future impact of the National Living Wage. We anticipate changes in the index over the next few years as the National Living Wage becomes a reality and the extent to which additional costs are passed on to funders is bottomed-out. We are confident however that the sector will address this latest challenge and continue to perform robustly.
Finally, we would like to thank the growing number of leading care providers who have kindly contributed to the CH-TPI, and would encourage those who have not, to do so in the future.
Source: Knight Frank Research
EAST 11%
EAST MIDLANDS 7%
GREATER LONDON 6%
NORTH EAST 10%
NORTH WEST 13%
NORTHERN IRELAND 5%
SCOTLAND 10%
SOUTH EAST 13%
SOUTH WEST 6%
WALES 3%
WEST MIDLANDS 9%
YORKS & HUMBER 8%
FY 2014/15 SHARE OF BEDS
FIGURE 1
Regional share of the sample % of total care beds
Dr Lee Elliott Head of Commercial Research

3
OCCUPANCY AND FEES
OccupancyThe overall care home occupancy rate increased from 87.6% to 88.3%. Occupancy rates have been recovering gradually over the past three years – having fallen relatively sharply during the height of the recession (Figure 2 ) – and are now at their highest level for six years.
Personal care homes continue to demonstrate stronger occupancy than nursing homes, with occupancy rates of 90.4% and 87.7%, respectively in FY 2014/15. The difference continues to be linked to a number of factors, namely: strong demand for privately funded care in personal care facilities, and the strengthening of demand for dementia care at homes without nursing.
Occupancy rates are unevenly
spread across the UK regions and
reflect a pattern broadly similar to
that shown in previous editions of
the CH-TPI (Figure 3). Greater London
has the highest level of occupancy
(90.2%). This is a simple function
of demography and high barriers to
market entry. At the other end of the
spectrum are the South West and
North East regions which continue
to show occupancy rates of 85.0%
and 83.8%, respectively. Low
occupancy rates in the North East
arise largely from continued pressure
on social care budgets.
Source: Knight Frank Research
The care home occupancy rate increased during FY 2014/15, rising from 87.6% to 88.3%.
FIGURE 3
Occupancy rates by region (FY 2014/15)
Source: Knight Frank Research
FIGURE 2
UK care home occupancy rate %
2014
2015
2013
2012
2011
2010
2009
2008
2007
2006
85%
86%
87%
88%
89%
90%
80%
82%
84%
86%
88%
90%
92%
94%
Gre
ater
Lo
ndo
n
Wal
es
No
rthe
rn Ir
elan
d
Sco
tland
No
rth
Wes
t
Wes
t M
idla
nds
Eas
t M
idla
nds
York
s &
Hum
ber
So
uth
Eas
t
Eas
t
So
uth
Wes
t
No
rth
Eas
t
All UK
Nursing careCare home withprofessionally qualifiednursing staff
Personal careResidential care homewith non-professionallyqualified care staff
Extra careRetirement housing, whereresidents live independentlywith care services attachedas required
Domiciliary careCare provided at theresident’s own home
ELDERLY CARE
CARE FACILITY
AT HOME
ELDERLY CARE PROVISION i
This report assesses care facilities with a bias towards nursing homes in our sample. Note that many facilities provide both nursing care and personal care on-site, and these
fall under Nursing in our analysis.
CARE HOMES TRADING PERFORMANCE REVIEW RESEARCH

4
Source: Knight Frank Research
Source: Knight Frank Research
FIGURE 4
Average weekly fees £ per week
FIGURE 5
Average weekly fees by region (FY 2014/15) £ per week
£400
£450
£500
£550
£600
£650
£700
£750
£800
£850
£900
PERSONAL CARE
NURSING
Sou
th E
ast
Gre
ater
Lon
don
Sou
th W
est
Eas
t
Wes
t M
idla
nds
Sco
tland
Eas
t M
idla
nds
Wal
es
Nor
th W
est
York
s &
Hum
ber
Nor
ther
n Ire
land
Nor
th E
ast
The CH-TPI reveals average weekly fee levels of £675 in FY 2014/15 for the UK as a whole. This is higher than last year’s figure of £660 per week – an increase of 2.3%. This is a further improvement on the 2.1% rise during 2013/14 and is also significantly above RPI inflation over the same period (0.9%).
In absolute terms, average weekly fees in 2014/15 remained much higher for nursing homes (at £699 per week) compared with personal care (at £587 per week).
The two types of care show a significant difference between the extent of fee increases, with personal care witnessing markedly higher growth compared with nursing homes. This divergence continues to reflect the bias towards self-funded care that is evident in personal care homes, where fee rises have reflected individuals’ ability to pay, rather than being dictated by local authority budgetary constraints.
On a regional basis, the UK’s southern regions lead the way in terms of the highest average fee levels (Figure 5). For nursing homes, the South East has the highest average fee levels, at £893 per week, followed by Greater London (£834
Average weekly feesper week). This again reflects the greater prevalence of private paying residents who provide the funding required to cover the higher staff costs and land values associated with these regions.
For nursing care, average fee levels are correspondingly lower in the northern regions of England, and significantly lower than the overall UK average of £699 per week. The North East continues to have the lowest average fees of any region, at £577 per week, driven by the private pay market being less prevalent here and local authority fees typically accounting for the majority of a care home’s revenues.
The regional ranking of fee rates for personal care is broadly in line with that of nursing homes. England’s southern regions again show the highest fees, while the northern regions have lower fees.
Nursing care’s ‘premium’ over personal care fees is also more pronounced in the South compared with elsewhere. In Greater London average nursing fees are 26% higher than personal care fees, compared with a difference of 16% for the majority of other UK regions.
AVERAGE WEEKLY FEES
AVERAGE ANNUAL WEEKLY FEE CHANGE (LFL)
Personal Care £566 2.9%
Care with Nursing £688 1.8%
All Care Homes £660 2.1%
2.5%
AVERAGE WEEKLY FEES
Personal Care £587 3.7%
Care with Nursing £699 1.6%
All Care Homes £675 2.3%
0.9%RPI inflation (FY 2014/15)
ANNUALCHANGE (LFL)
AVERAGEWEEKLY FEE
£400
£450
£500
£550
£600
£650
£700
ACTUALREAL TERMS (2006 PRICES)
2014
/15
2013
/14
2012
/13
2011
/12
2010
/11
2009
/10
2008
/09
2007
/08
2006
/07
CARE HOMES TRADING PERFORMANCE REVIEW RESEARCH
A
4
35
1
2
B
E
C
D
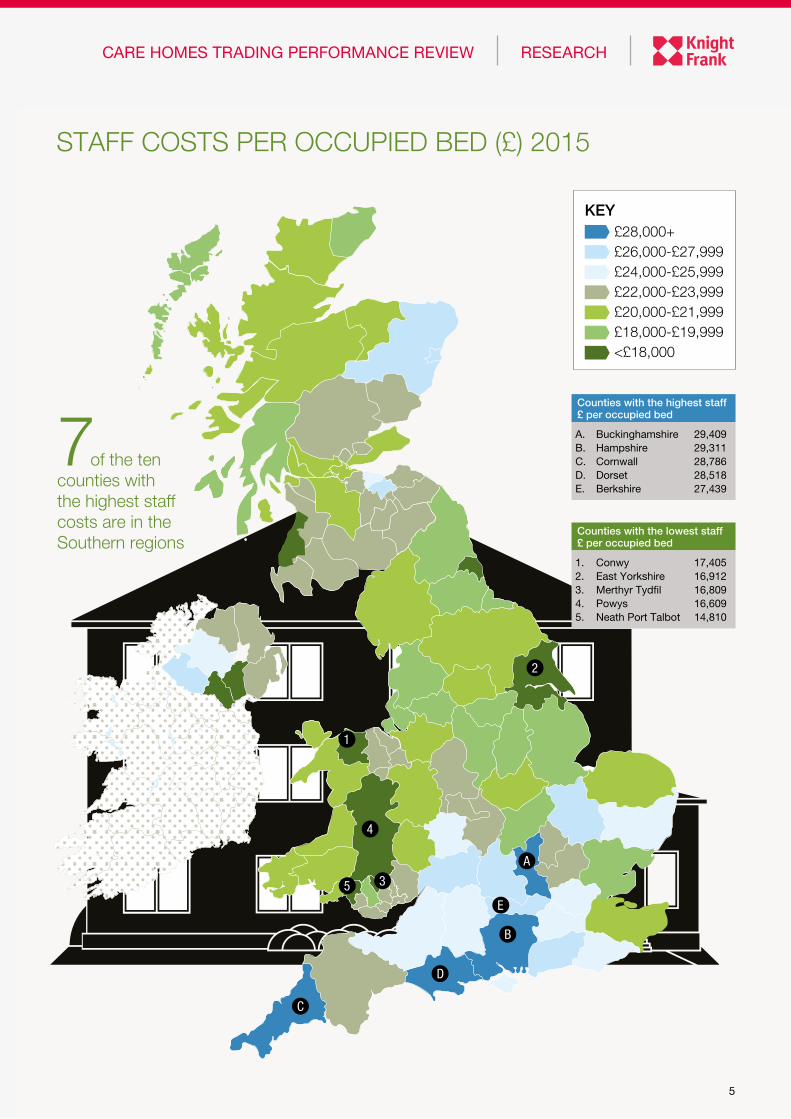
STAFF COSTS PER OCCUPIED BED (£) 2015
Counties with the highest staff £ per occupied bed
A. Buckinghamshire 29,409 B. Hampshire 29,311C. Cornwall 28,786D. Dorset 28,518E. Berkshire 27,439
Counties with the lowest staff £ per occupied bed
1. Conwy 17,405 2. East Yorkshire 16,9123. Merthyr Tydfil 16,8094. Powys 16,6095. Neath Port Talbot 14,810
7of the ten counties with the highest staff costs are in the Southern regions
5
£28,000+£26,000-£27,999£24,000-£25,999£22,000-£23,999£20,000-£21,999£18,000-£19,999<£18,000
KEY

6
Staff Costs FY 2014/15
Region Per resident p.a. As a % of revenueSouth East £25,527 57.3%
South West £25,084 61.5%
Greater London £24,189 57.7%
Scotland £22,478 64.6%
Northern Ireland £22,386 73.9%
West Midlands £22,268 63.8%
East £21,855 60.1%
Wales £20,926 66.1%
North West £19,556 63.4%
East Midlands £19,358 60.1%
Yorks & Humber £19,305 63.6%
North East £18,286 63.4%
All UK £21,756 61.9%
COSTSAverage staff costs amounted to £21,756 per resident for the FY 2014/15. Meanwhile, as a percentage of income, staff costs increased to 61.9%.
Staff costsCare home staff costs have followed an upward trend over the past five years. During 2014/15 staff costs increased from 57.6% to 61.9% of total income (Figure 6). The South East has the highest staff costs for both nursing care, averaging c. £25,857 per resident in FY 2014/15, and for the personal care sector, at an average of £21,749 per resident (Figure 7).
The differential between nursing and personal care, reflects the higher pay that qualified nurses receive compared with care staff at personal care homes. However, this differential varies markedly between UK regions, and is the lowest in Greater London, with staff costs per resident at nursing homes standing only 13% above those for personal care homes.
While staff costs in the relatively affluent South East are highest on a per resident basis, they are relatively low when considered as a proportion of total revenue. Staff costs as a percentage
of income are correspondingly higher elsewhere in the UK and it is these regions which are more exposed to upward pressures in staff costs, driven by labour shortages. Northern Ireland provides an example of this. While Northern Ireland’s staff costs are marginally higher than the UK average, they translate to the highest costs of any region as a proportion of revenue, standing at 74%, and considerably higher than the South East, at 57%.
Further headwinds are likely in terms of staffing costs, as the sector responds to the National Living Wage (NLW). The full impact is uncertain but will be felt strongest outside London and the South East. More concerning may be the accretive impact of the NLW across the care homes sector.
Agency staff costs as a proportion of total staff costs increased from 4.8% last year to 5.8% for the FY 2014/15, reflecting the growing difficulties with staff resourcing
“ Agency staff costs increased to 5.8% of total staff costs in 2014/15.”
Source: Knight Frank Research
Source: Knight Frank ResearchSource: Knight Frank Research
FIGURE 6
Staff costs As £ per resident (LHS) vs % of income (RHS)
FIGURE 7
Staff cost per resident £ per resident
£14,000
£15,000
£16,000
£17,000
£18,000
£19,000
£20,000
£21,000
£22,000
£23,000
2014
2013
2012
2011
2010
2009
2008
2007
2006
£ PER RESIDENTAS % OF INCOME
52%
53%
54%
55%
56%
57%
58%
59%
60%
61%
62%
63%
£0
£5,000
£10,000
£15,000
£20,000
£25,000
£30,000
PERSONAL CARE
NURSING
Sou
th E
ast
Sou
th W
est
Gre
ater
Lon
don
Wes
t M
idla
nds
Eas
t
Sco
tland
Wal
es
Nor
ther
n Ire
land
Eas
t M
idla
nds
York
s &
Hum
ber
Nor
th W
est
Nor
th E
ast
All UK
All UK

7
and retention. It should also be noted that reliance on agency staff is greater in nursing rather than personal care homes. There is also a notable degree of regional variation, with agency staff costs making up the highest share of overall staff costs in the Northern Ireland at 8.8%, and the lowest share in Wales, at only 3.3%.
Property costsFollowing the sharp rise in care home property costs last year, this year saw the cost per bed fall to £2,146 (Figure 8). The underlying trend in property costs in both nominal and real terms is upwards. While energy and water price rises have in recent years helped push property costs above the rate of inflation, last years’ significant increase was more closely associated with insurance costs and increased repair and maintenance costs, as catch-up capex was applied to the sector.
Property costs now equate to 6.1% of total income, having stood relatively stable at c. 5% during the years prior to 2010.
Food costsAverage food costs per resident in FY 2014/15 were 9% below the previous year. As last year, food costs per resident were highest in the South East during 2014/15 at 16% above the overall UK average, and lowest in the Wales and the North East, at 9.8% and 11.4%, respectively below the average. (Figure 9).
Source: Knight Frank Research Source: Knight Frank Research
FIGURE 8
Property cost per bed £ per bed
FIGURE 9
Food cost index (FY 2014/15) % difference from all UK
£1,000
£1,200
£1,400
£1,600
£1,800
£2,000
£2,200
£2,400
2014
2013
2012
2011
2010
2009
2008
2007
2006
NOMINALREAL TERMS (2006 PRICES)
-15
-10
-5
0
5
10
15
20
Sou
th E
ast
Sou
th W
est
Gre
ater
Lon
don
Eas
t
Wes
t Mid
land
s
York
s &
Hum
ber
Sco
tland
Nor
th W
est
Eas
t Mid
land
s
Nor
ther
n Ire
land
Wal
es
Nor
th E
ast
Property costsThese are the costs which relate to the day-to-day running and servicing of the property. They include utilities, council tax, insurance and repairs & maintenance, but exclude any rental obligations in the case of leased care homes.
The National Living WageSince 1998, the National Minimum Wage has been set by the Low Pay Commission based on their calculation of the highest level which would not adversely affect employment. In July 2015 the Chancellor effectively replaced the National Minimum Wage with a new National Living Wage for those aged 25 and over. This new rate would no longer be set with regard to employment, but would instead move towards a target 60 per cent of median income by 2020.
Sunnyview House, Leeds, Hadrian Healthcare
Typical Gracewell bedroom, Gracewell Healthcare
CARE HOMES TRADING PERFORMANCE REVIEW RESEARCH
i
TOTAL COSTS AS % OF INCOME
Nursing 75.4% 74.4% 71.6% 69.8% 71.2%
Personal Care 70.0% 68.1% 66.5% 70.2% 61.0%
< 40 Beds 40-59 Beds 60-79 Beds 80-99 Beds 100+ Beds

8
PROFITABILITYTrading performance is under pressure from rising costs but remains strongest in the South East and Greater London.
The profitability of the care homes sector continues to be under downward pressure. Despite slight improvements in occupancy rates, EBITDARM as a percentage of income has slipped from 27.5% in 2013/14 to 27.1% in the latest index (Figure 10). This margin erosion reflects the aforementioned increases in operating costs, and in particular the uplift in staffing costs.
In assessing the CH-TPI on the basis of care home registration type, a strong variation in performance is discernible. In absolute terms, EBITDARM for nursing care (£9,639 per occupied bed) is some 7% higher than for personal care homes (£8,995 per occupied bed). It should be noted, however, that personal care homes display higher profitability when expressed as a percentage of income, with margins at 29.5% compared with 26.5% for nursing homes. Once again this relates to both the type and cost of staffing required. The additional income received by nursing care homes is more
than offset by the cost of employing skilled nursing staff in a labour market which is chronically under supplied.
On a geographical basis, a southern bias is once again evident (Figure 11). The South East and Greater London strongly outperform the other regions of the UK in terms of profitability, with EBITDARM as a percentage of income standing at 32.5% and 31.1% respectively for FY 2014/15. This reflects the higher occupancy rates achieved in these regions, together with the greater prevalence of private pay residents who sustain higher fee levels.
Combining care home registration and geography also highlights marked variance across the sector. On a per bed basis, nursing homes in the South East and Greater London are more profitable than personal care homes, contributing to the overall UK trend (Figure 12). However, the inverse is true in less affluent regions such as the North East and Northern Ireland, essentially because these areas are more exposed
Source: Knight Frank Research Source: Knight Frank Research
FIGURE 10
EBITDARM as a % of incomeFIGURE 11
EBITDARM as a % of income (FY 2014/15)
23%
25%
27%
29%
31%
33%
35%
2013
/14
2014
/15
2012
/13
2011
/12
2010
/11
2009
/10
2008
/09
2007
/08
2006
/07
10%
15%
20%
25%
30%
35%
All UK
Sou
th E
ast
Gre
ater
Lon
don
Eas
t
Eas
t Mid
land
s
Sou
th W
est
Sco
tland
Wes
t Mid
land
s
York
s &
Hum
ber
Nor
th W
est
Nor
th E
ast
Wal
es
Nor
ther
n Ire
land
Bucklesham Grange, Hallmark Care Homes
EBITDARMEarnings before Interest, Tax, Depreciation, Amortisation, Rent and Management.
This is a particular measure of profitability which allows for direct like-for-like comparison between individual care homes, before costs of rent and management charges are accounted for.
“ Almost a third of care homes in the 2014/15 CH-TPI have EBITDARM in excess of 30%.”

9
CARE HOMES TRADING PERFORMANCE REVIEW RESEARCH
Source: Knight Frank Research
FIGURE 12
EBITDARM per bed (FY 2014/15) £ per bed
£2,000
£4,000
£6,000
£8,000
£10,000
£12,000
£14,000
£16,000
Sou
th E
ast
Gre
ater
Lon
don
Sou
th W
est
Eas
t
Eas
t M
idla
nds
Sco
tland
Wes
t M
idla
nds
Nor
th W
est
York
s &
Hum
ber
Wal
es
Nor
th E
ast
Nor
ther
n Ire
land
All UK
All UK
PERSONAL CARE
NURSING
Source: Knight Frank Research
FIGURE 13
Distribution of profit margins across the CH-TPI (FY 2014/15)
0% 5% 10% 15% 20% 25% 30% 35%
41%+
31-40%
21-30%
11-20%
0-10%
Pro
fit m
arg
in
% of CH-TPI Sample
Reuben Manor, Stockton-on-Tees, Silk Healthcare
to heightened nursing staff costs and tight budgetary controls on local authority care funding.
Significant variation in operating profit across the care home sector is clear. This variance is also in evidence when one assesses margin levels across our sample (Figure 13). Almost a third of the care homes assessed within the 2014/15 index are generating EBITDARM as a percentage of income in excess of 30%. Indeed, 9% of the homes assessed are generating profit margins of 40% or more. In contrast 14% of all care homes assessed are generating EBITDARM of less than 10%.

10
Our analysis of the 2014/15 CH-TPI data clearly demonstrates the effect of care home size on overall profitability, a variable which remains of interest to both prospective developers and operators. The data shows the optimal size of care home, in terms of overall profitability, is in the 80-99 size bed category. Average EBITDARM per bed in this 80-99 bed care home category stands at £11,303, which is 19% above the all index average and 34% higher than the weakest performing under 40 bed category.
While these results stem from a number of factors acting in combination, the
Profitability and care home sizemain driver relates to fee levels, which
stand at £729 per week in the 80-99 bed
category, or 8% higher than the all index
average (see below infographic).
Whilst the largest 100+ bed category
clearly illustrates the benefits of
economies of scale with the category
having the lowest staff cost per bed,
these efficiencies are also offset by
comparatively weak occupancy and fee
levels. This impacts profitability, with
EBITDARM per bed in this care home
category at £8,850 – or 7% below the all
index average.
“ Overall profitability remains highest in the 80-99 bed size category.”
Key Performance Indicators by size of care home (FY 2014/15)
Averageweekly fee
Occupancy Staff costper bed
EBITDARMper bed
£651
£657
£697
£729
£653
£675
< 40 beds
40-59 beds
60-79 beds
80-99 beds
100+ beds
All care homes
£8,40990.0% £21,292
89.2% £21,503 £8,868
87.3% £22,282 £10,370
87.6% £23,108 £11,303
86.5% £20,790 £8,850
88.3% £21,756 £9,500
Source: Knight Frank Research

11
CARE HOMES TRADING PERFORMANCE REVIEW RESEARCH
Within the last twelve months the UK healthcare arena has seen the resurgence of mergers and acquisitions; arguably back to the levels experienced before the collapse of Lehman Brothers Holdings in 2008. Healthcare continues to attract both domestic and international capital and is now firmly considered to be a core asset class.
However, this year’s announcement of the National Living Wage has caused angst in the sector and there is much anticipation of the Chancellor of the Exchequer’s approach to the National Living Wage in his Spending Review on Wednesday 25 November.
The National Living Wage is the next challenge we must face. The Healthcare sector has navigated around such obstacles in the past and it is unlikely to fetter additional inward investment in to the sector. This is in part due to the structural under supply of bedroom capacity which is further accentuated when one considers the vast amount of poor existing stock.
Knight Frank estimates it would cost circa £15bn to upgrade the 250,000 non en suite bedrooms to wet room status. There is a desperate need for new future proof facilities but the inflationary cost of raw materials has stymied many new build developments. The quality of the existing built environment remains a major concern but is further compounded by only circa 6,000 new care beds constructed per annum and an ageing population. It is a basic issue of supply and demand.
Our research shows a marginal increase in average occupancy to 88.3%. Interestingly the National Living Wage is likely to adversely impact care homes with less than 30 bedrooms. There are approximately 7,300 care homes that operate with less than 30 beds which have a very real chance of closing down in the near future as they will be unviable businesses. Should this happen then approximately 117,000 beds are at risk which will be devastating for owner operators but ironically possibly good news for the major providers who will benefit from an increase in occupancy due to the extra demand for beds. This will drive the further maturation of the sector towards corporate operators.
For the UK as a whole, the CH-TPI reveals average weekly fee levels of £675 in FY 2014/15, up 1.4% in real terms. Anecdotally we are aware of several local authorities agreeing to April 2016 fee uplifts of 5%, which is welcomed news.
“ The sustained robust performance of the UK care home sector will fuel new investment and deal announcements over the next 12 months.”
TRADING PERFORMANCE OUTLOOK
Notwithstanding the issue of the National Living Wage, appetite for UK healthcare fixed income, going concerns and development sites continues to attract global investors because of the sector’s defensive characteristics. Moreover, Knight Frank’s 2015 Care Homes Trading Performance Review demonstrates sustained robust performance. Given this, we anticipate increasing levels of new investors and deal announcements over the next twelve months.
JULIAN EVANS Head of Healthcare

Important Notice© Knight Frank LLP 2015 – This report is published for general information only and not to be relied upon in any way. Although high standards have been used in the preparation of the information, analysis, views and projections presented in this report, no responsibility or liability whatsoever can be accepted by Knight Frank LLP for any loss or damage resultant from any use of, reliance on or reference to the contents of this document. As a general report, this material does not necessarily represent the view of Knight Frank LLP in relation to particular properties or projects. Reproduction of this report in whole or in part is not allowed without prior written approval of Knight Frank LLP to the form and content within which it appears. Knight Frank LLP is a limited liability partnership registered in England with registered number OC305934. Our registered office is 55 Baker Street, London, W1U 8AN, where you may look at a list of members’ names.
COMMERCIAL RESEARCH Dr Lee Elliott Head of Commercial Research +44 20 7861 5008 [email protected]
HEALTHCARE Julian Evans FRICS Head of Healthcare +44 20 7861 1147 [email protected]
For the latest news, views and analysisof the commercial property market, visitknightfrankblog.com/commercial-briefing/
COMMERCIAL BRIEFING
Knight Frank Research Reports are available at KnightFrank.com/Research
European Quarterly Report - Q2 2015
RESEARCH
EUROPEAN QUARTERLYCOMMERCIAL PROPERTY OUTLOOK Q2 2015
OCCUPIER TRENDS INVESTMENT TRENDS MARKET INDICATORS
Global Cities Skyscrapers Report 2015
SKYSCRAPERS2015 REPORT
GLOBAL CITIES
RECENT MARKET-LEADING RESEARCH PUBLICATIONS
Central London Quarterly Q2 2015
CENTRAL LONDONQUARTERLY – OFFICES Q2 2015
RESEARCH
TAKE-UP WELL ABOVE THE LONG-TERM AVERAGE
SUPPLY CONTINUES TO TIGHTEN
YIELDS STEADY IN CORE MARKETS
Africa Report 2015
REAL ESTATE MARKETS IN A CONTINENT OF GROWTH AND OPPORTUNITY
RESEARCH
2015
AFRICA REPORT
Knight Frank Research provides strategic advice, consultancy services and forecasting to a wide range of clients worldwide including developers, investors, funding organisations, corporate institutions and the public sector. All our clients recognise the need for expert independent advice customised to their specific needs.
Front cover image: Wetherby Manor, Wetherby (Hadrian Healthcare)