2015 crop insurance update - amazon web...
TRANSCRIPT

2015 Crop Insurance Update South Dakota Corn Growers Meeting
Sioux Falls, South Dakota
RMA Associate Administrator Michael Alston
January 17, 2015
Crop Insurance and Farm Bill Overview
• General Overview Program Snapshot
• Farm Bill Implementation • Other Items of Interest
2

General Overview Program Snapshot
Nationwide 2012 2013 2014
Liability $117 B $124 B $109 B
Acres Insured 283 M 296 M 294 M
Total Premium $11.1 B $11.8 B $10 B
Indemnity (Claims Paid So Far) $17.4 B $12 B $5.5B
Loss Ratio 1.57 1.02 .55
4
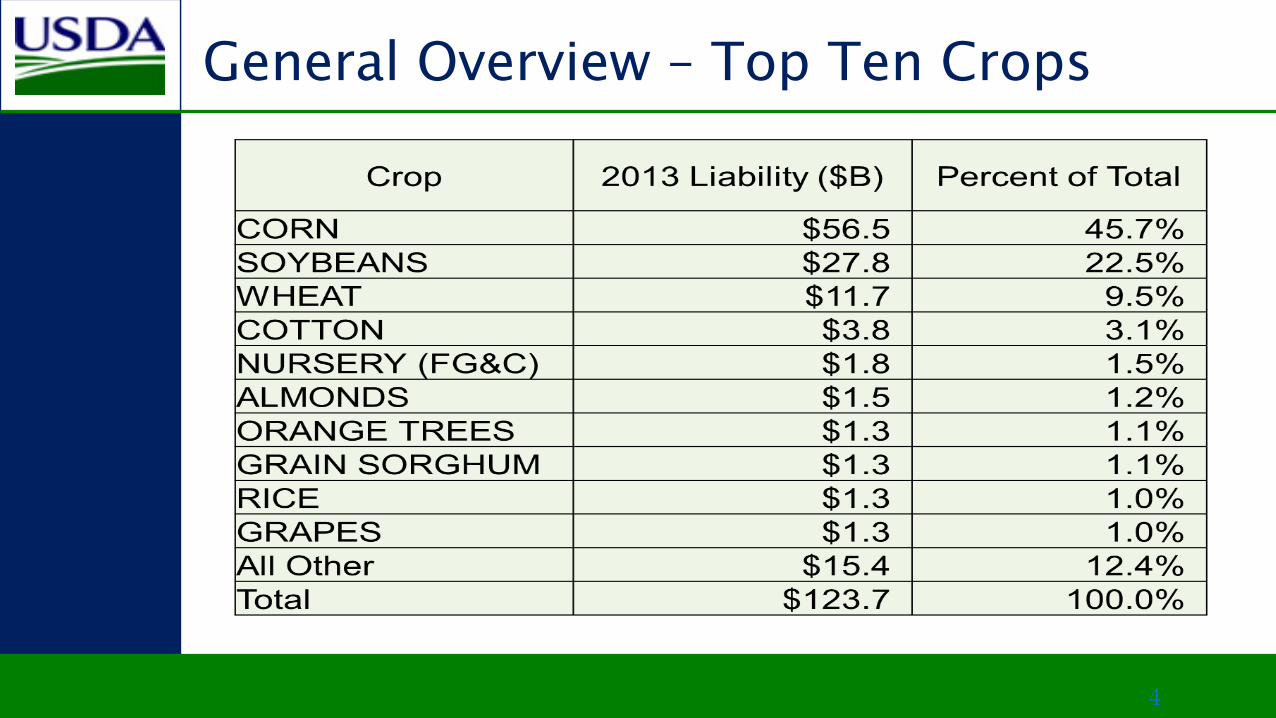
General Overview – Top Ten Crops

Year Policies Acres Liabilities ($) Premium Subsidy Indemnity Loss Ratio
2012
27,048
5,848,769
$3,072,014,396
$386,955,776
$266,177,184
$781,002,543
2.02
2013
27,813
5,995,585
$3,225,927,226
$449,733,708
$304,266,311
$179,064,552
.40
2014
27,908
5,576,373
$2,468,176,694
$382,645,826
$263,976,586
$72,025,819
.19
South Dakota Corn Policies
5

South Dakota – Soybean Policies
Year Policies Acres Liabilities Premium Subsidy Indemnity Loss Ratio
2012
24,728
4,559,181
$1,578,466,179
$171,315,337
$114,826,450
$258,032,202
1.51
2013
25,372
4,486,437
$1,641,011,911
$185,454,613
$123,335,723
$39,814,328
.21
2014
25,437
5,039,616
$1,657,414,707
$188,413,227
$126,711,229
$26,251,401
.14
6

2014 RMA Liabilities
7

General Overview - Program Growth
1.00
1.50
2.00
2.50
3.00
3.50
4.00
4.50
1999 2000 2001 2002 2003 2004 2005 2006 2007 2008 2009 2010 2011 2012 2013 2014
Factors Increasing Liability
Other
Price
Coverage Level
Acres (excl. PRF)
+ 14%
+ 61%
+ 11% + 14%
8

General Overview – Price Change 2014
Crop Price 2011 2012 2013 2014
Corn Projected $6.01 $5.68 $5.65 $4.62 Harvest $6.32 $7.50 $4.39 $3.49 Change 5% 32% -22% -24%
Soybeans Projected $13.49 $12.55 $12.87 $11.36 Harvest $12.14 $15.39 $12.87 $9.65 Change -10% 23% 0% -15%

2014 FARM BILL CHANGES & IMPLEMENTATION
10

Farm Bill Overview
• Conservation Compliance • Native Sod • Beginning Farmer/Rancher (BFR) • Enterprise Unit Subsidy • Enterprise Units for Irrigated/Non-Irrigated Acreage • Coverage Levels by Practice • Actual Production History (APH) Yield Exclusion • Supplemental Coverage Option (SCO) • Whole Farm Revenue Protection
11

Conservation Compliance
• In order to retain premium subsidy for all crop insurance policies, producers must have certification of compliance on file with USDA by June 1, 2015.
• Visit or call your local USDA Service Center if you are unsure of your compliance status.
• Information available: – Joint RMA/FSA/NRCS Fact sheet on RMA website – FAQ’s (WWW.RMA.USDA.GOV Farm Bill Page)
12
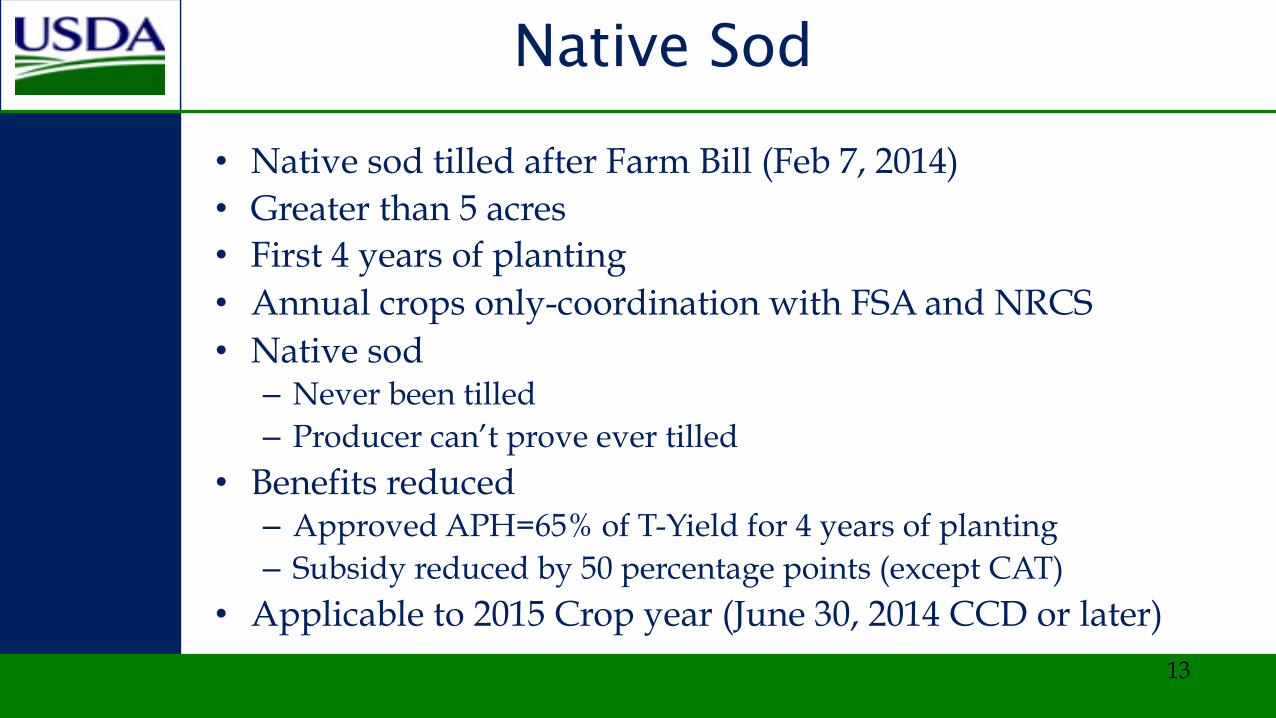
Native Sod
• Native sod tilled after Farm Bill (Feb 7, 2014) • Greater than 5 acres • First 4 years of planting • Annual crops only-coordination with FSA and NRCS • Native sod – Never been tilled – Producer can’t prove ever tilled
• Benefits reduced – Approved APH=65% of T-Yield for 4 years of planting – Subsidy reduced by 50 percentage points (except CAT)
• Applicable to 2015 Crop year (June 30, 2014 CCD or later)
13

Beginning Farmer/Rancher (BFR)
• Qualification – Not “actively operated or managed” any farm or ranch
with an interest in crop or livestock - 5 years – As individual or Substantial Beneficial Interest (SBI) holder – Regardless of insurance
• Do not Count – Under age 18 – Full-time active military duty – Post-secondary education
14

Beginning Farmer/Rancher (BFR)
• Benefits: – 10 additional percentage points in premium subsidy for buy-up
coverage • Example - subsidy is 48% + 10% = 58% total premium subsidy
– Waive administrative fee (CAT and buy-up) – Use other person’s production history if previous involvement on
farm – Yield substitution 80% of the T-Yield instead of 60%
• However, the actual yield must still be below 60% of the T-Yield to qualify
15

Enterprise Unit Subsidy
• Authorized as pilot by 2008 Farm Bill - made permanent in 2014 Farm Bill
• Same dollar subsidy as for basic and optional units – Results in subsidy increases of more than a third for most coverage levels
• Significant increases in enterprise units since 2008
16
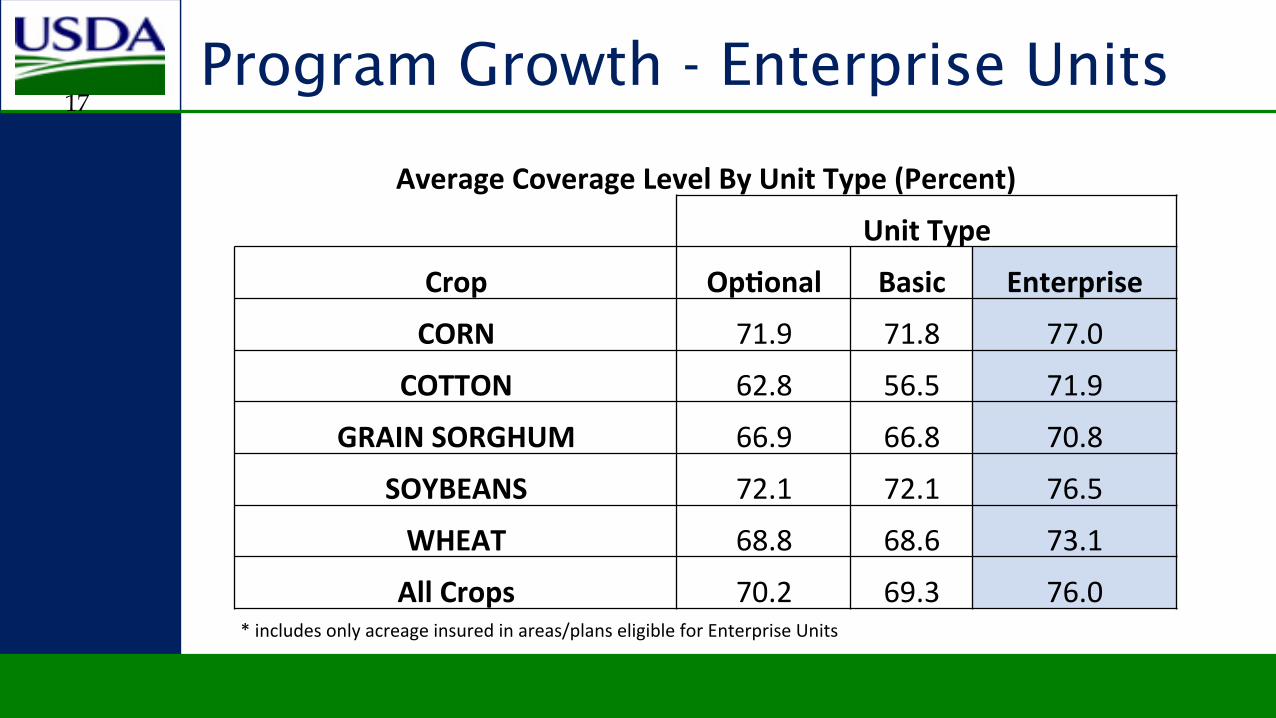
Program Growth - Enterprise Units
Average Coverage Level By Unit Type (Percent)
Unit Type
Crop Op9onal Basic Enterprise
CORN 71.9 71.8 77.0
COTTON 62.8 56.5 71.9
GRAIN SORGHUM 66.9 66.8 70.8
SOYBEANS 72.1 72.1 76.5
WHEAT 68.8 68.6 73.1
All Crops 70.2 69.3 76.0 * includes only acreage insured in areas/plans eligible for Enterprise Units
17
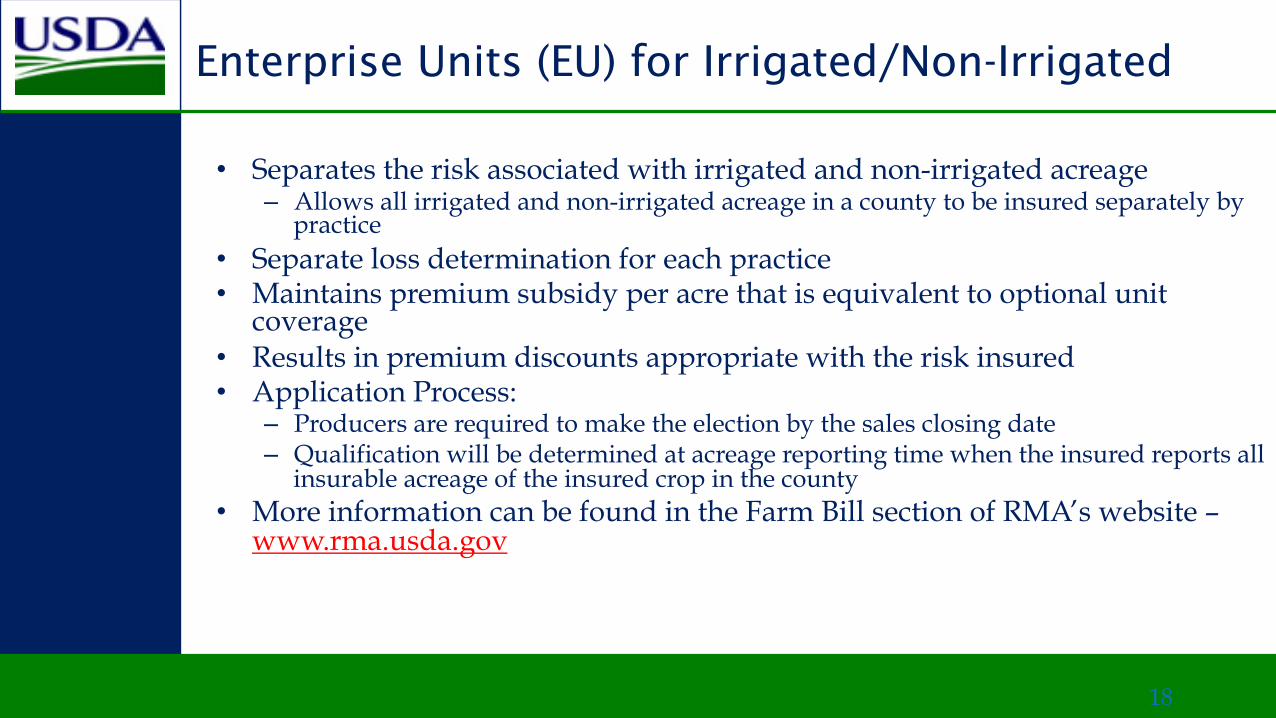
Enterprise Units (EU) for Irrigated/Non-Irrigated
• Separates the risk associated with irrigated and non-irrigated acreage – Allows all irrigated and non-irrigated acreage in a county to be insured separately by
practice • Separate loss determination for each practice • Maintains premium subsidy per acre that is equivalent to optional unit
coverage • Results in premium discounts appropriate with the risk insured • Application Process:
– Producers are required to make the election by the sales closing date – Qualification will be determined at acreage reporting time when the insured reports all
insurable acreage of the insured crop in the county • More information can be found in the Farm Bill section of RMA’s website –
www.rma.usda.gov
18

Coverage Levels by Practice
• Separate coverage level elections for buy-up coverage – All irrigated acreage of the crop in the county – All non-irrigated acreage of the crop in the county
• Must be elected by the sales closing date
19

Actual Production History Yield Exclusion
• Insured may exclude yields from APH
• Eligible Years - county yield is less than 50% of prior 10-year average
• To see which years are available for exclusion check the actuarial documents for your crop and county on the RMA website
• NOW AVAILABLE for THESE 2015 SPRING CROPS: CORN, SOYBEANS, SPRING WHEAT, COTTON, GRAIN SORGHUM, RICE, BARLEY, CANOLA, SUNFLOWERS, PEANUTS, and POPCORN
20
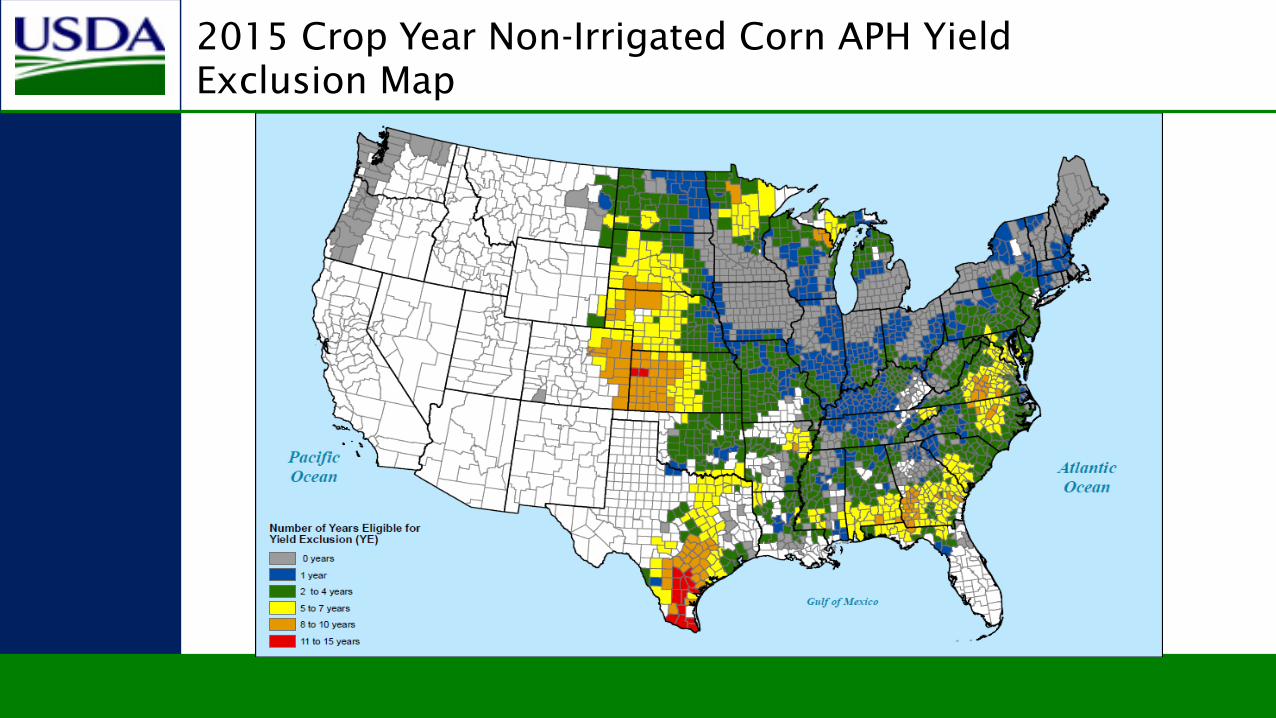
2015 Crop Year Non-Irrigated Corn APH Yield Exclusion Map

2015 Crop Year Irrigated Corn APH Yield Exclusion Map

2015 Crop Year Non-Irrigated Soybeans APH Yield Exclusion Map
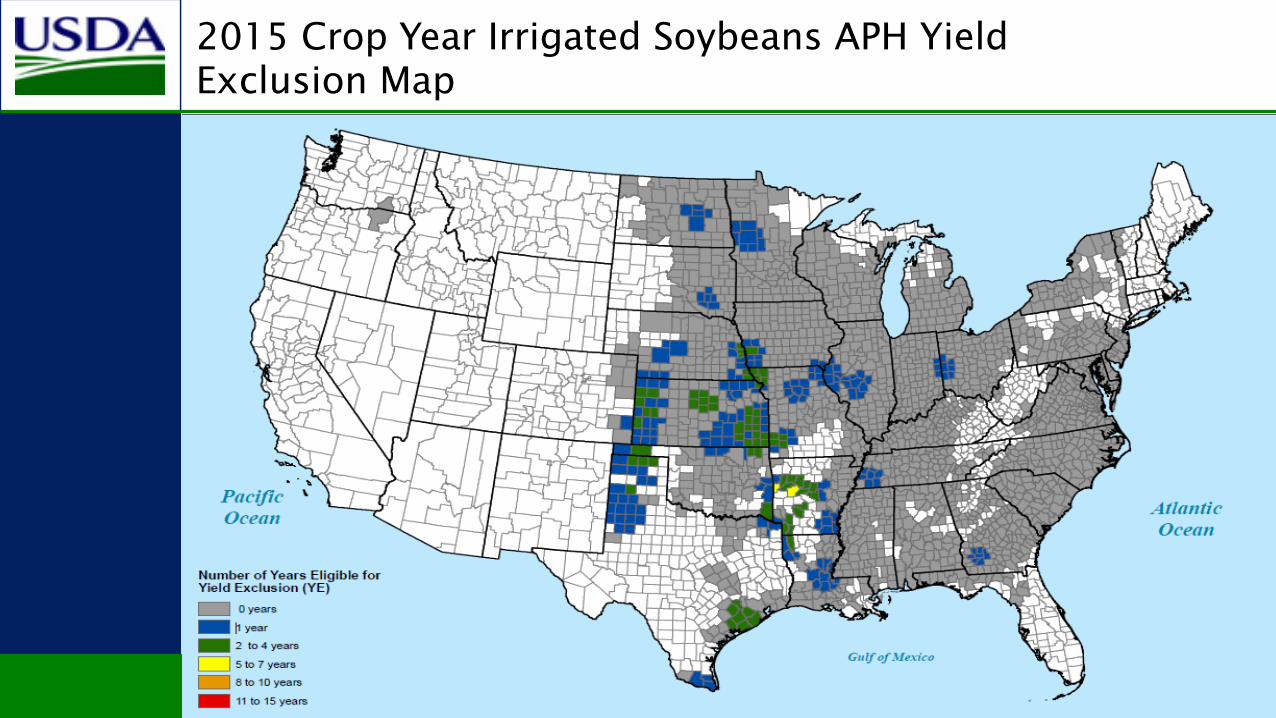
2015 Crop Year Irrigated Soybeans APH Yield Exclusion Map

2015 Crop Year Non-Irrigated Spring Wheat APH Yield Exclusion Map

2015 Crop Year Irrigated Spring Wheat APH Yield Exclusion Map
Supplemental Coverage Option (SCO)
• Area-based coverage for a portion of insurance policy deductible • Purchased with an underlying individual crop policy • Liability (max payout) based on the liability of the individual
underlying policy • 65% premium subsidy • Available in 2015: Corn, Barley, Soybeans, Cotton, Rice, Grain
Sorghum, and Wheat • Significant expansion planned for 2016
27

100%95%90%86%80%75%70%65%60%55%50%45%40%35%30%25%20%15%10%5%0%
SCO CoveragePercent of Expected Grower Revenue
Individual Revenue Policy (75% coverage)
SCO Revenue(86% to 75%)
Area-‐Based LossIndividual Loss
Example: Grower purchases an individual revenue policy, 75% coverage
SCO Example
28

2015 Crop Year Supplemental Coverage Option (SCO) Availability for Corn

2015 Crop Year Supplemental Coverage Option (SCO) Availability for Soybeans
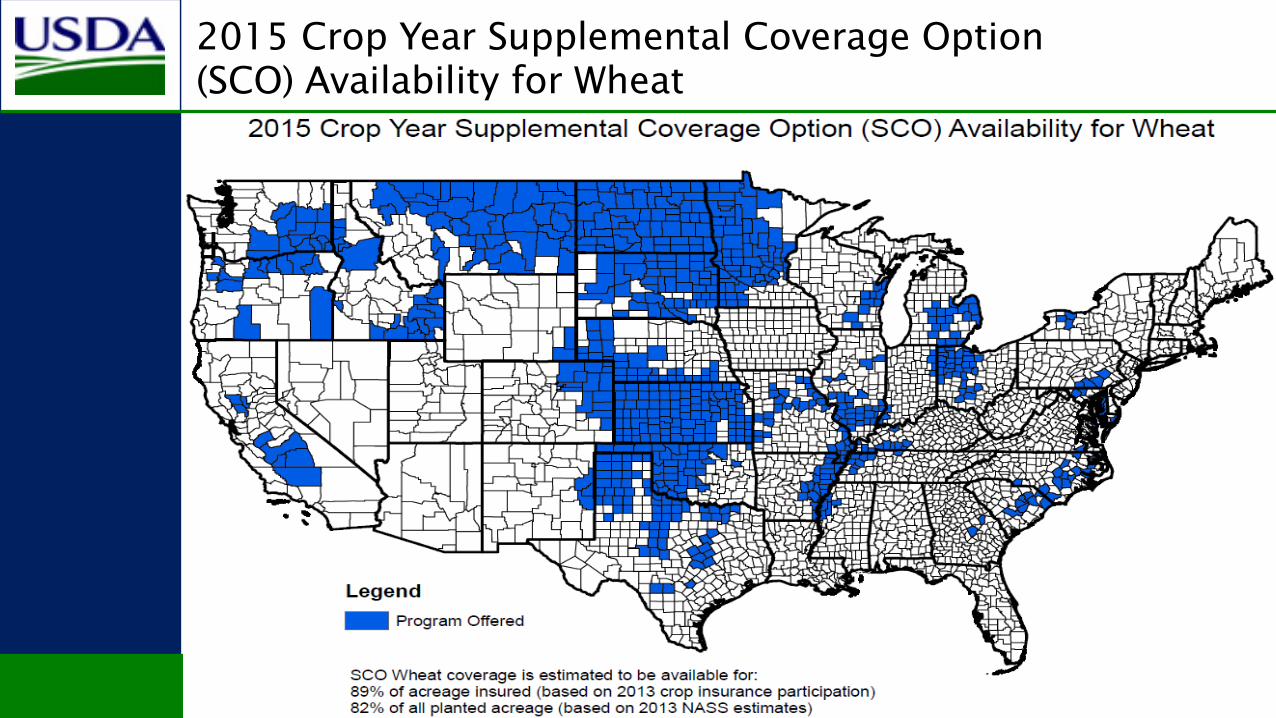
2015 Crop Year Supplemental Coverage Option (SCO) Availability for Wheat

Whole Farm Revenue Protection
Federal Crop Insurance Corporation Pilot Insurance Program Risk Management Agency
32
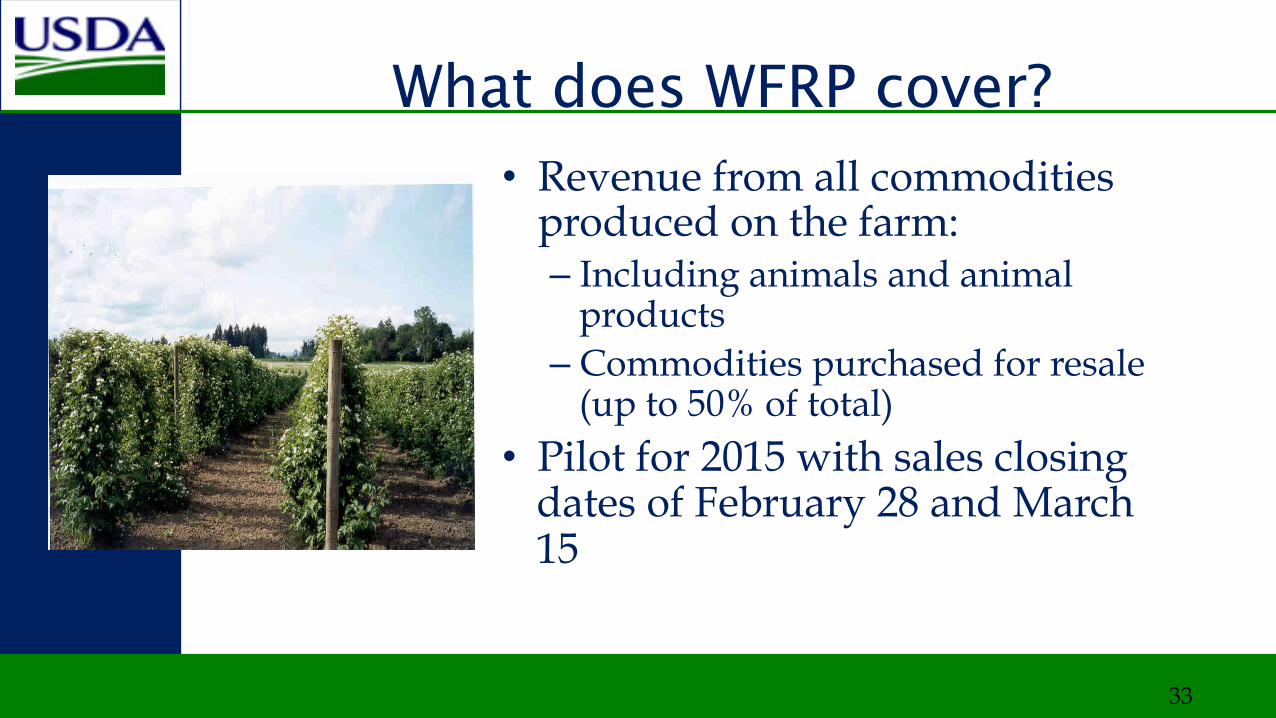
What does WFRP cover?
• Revenue from all commodities produced on the farm: – Including animals and animal
products – Commodities purchased for resale
(up to 50% of total) • Pilot for 2015 with sales closing
dates of February 28 and March 15
33

What Kinds of Farms Can Benefit from Whole Farm Revenue Protection? • Well-suited for: – Highly diverse farms – Farms with specialty or organic commodities – Farms selling to direct markets, specialty
markets, regional or local markets, and farm-identity preserved markets
• Available to all farms or ranches that qualify • There are some limits for qualification
34

What are the features of WFRP?
• Coverage levels 50-85% – 5% increments – Diversification of 3 commodities (commodity count)
required for 80% and 85% – No catastrophic level of WFRP available
• Historic revenue is adjusted to reflect farm expansion – Automatic indexing process accounts for farm growth
historically – Expanding operations provision allows for 10% growth
over historic average with insurance company approval

WFRP Premium Subsidy
36
WFRP Subsidy: Percentage of Total Premium Paid by Government Coverage Level 50% 55% 60% 65% 70% 75% 80% 85% Basic Subsidy-Qualifying Commodity Count: 1 67% 64% 64% 59% 59% 55% N/A N/A
Whole-Farm Subsidy-Qualifying Commodity Count: 2
80% 80% 80% 80% 80% 80% N/A N/A
Whole-Farm Subsidy-Qualifying Commodity Count: 3 or more
80% 80% 80% 80% 80% 80% 71% 56%
WFRP Subsidy: Percentage of Total Premium Paid by Government. / The commodity count is a calculated measure of Farm DiversificaNon

37

What causes a loss payment under WFRP?
• Natural causes of loss and decline in market price during the insurance year
• Taxes must be filed for the insurance year before loss calculation is made
• When revenue-to-count for the insurance year is lower than insured revenue, a loss payment will be made

Challenges Ahead?
Visit: www.rma.usda.gov
Thanks to All!
39