2015 economic studies common assumptions scope of …
TRANSCRIPT
M A Y 2 1 , 2 0 1 5 | W E S T B O R O U G H , M A
Wayne Coste
P R O J E C T M A N A G E R , E C O N O M I C P L A N N I N G
Planning Advisory Committee Meeting
2015 Economic Studies Common Assumptions Scope of Work - Draft
Outline
• Summary
• Stakeholder Input for 2015 Economic Studies
• Economic Study Metrics
• Economic Study Assumptions Affecting Energy Cost Results
• Assumptions – Demand – Development of the base network model – Resource modeling – Interchange modeling – Operating reserve – Fuel prices
2
Three 2015 Economic Study Requests
• Keene Rd. Interface (SunEdison) http://www.iso-ne.com/static-assets/documents/2015/04/a6_sun_edison_presentation_economic_study_keene_rd.pdf
• Impact of Offshore Wind Deployment on New England’s Wholesale Electricity Markets and Operations [Massachusetts Clean Energy Center ]
http://www.iso-ne.com/static-assets/documents/2015/04/a6_cec_presentation_economic_study_offshore_wind.pdf
• Impact of Maine Upgrades Identified in ISO-NE’s Strategic Transmission Analysis for Wind Integration [RENEW Northeast (RENEW)]
http://www.iso-ne.com/static-assets/documents/2015/04/a6_presentation_renew_strategic_transmission_analysis_wind_integration_economic_study_req.pdf
3
Summary
• The ISO will perform all three Economic Studies – The studies will be given priority by the ISO and Draft results to be
presented to PAC by late 2015 or early 2016 – Final reports completed after consultation with the PAC
• The studies will compare the performance of the future system with additional representative future system improvements – The study will not include detailed transmission planning analysis, such as
new system impact studies
• The results may be used to inform the region on the need for future – Market Efficiency Transmission Upgrades in the Keene Road area – Public Policy Transmission Upgrades facilitating the integration of wind
• Onshore wind resources in ME • Offshore wind resources in MA/RI
4
Stakeholder Input for 2015 Economic Studies
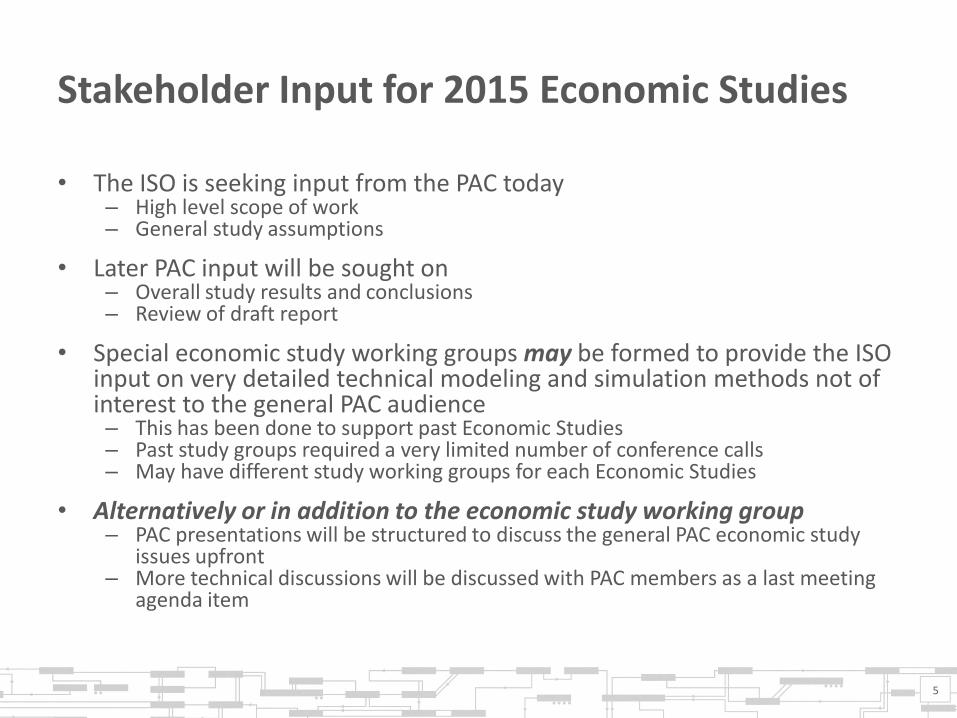
• The ISO is seeking input from the PAC today – High level scope of work – General study assumptions
• Later PAC input will be sought on – Overall study results and conclusions – Review of draft report
• Special economic study working groups may be formed to provide the ISO input on very detailed technical modeling and simulation methods not of interest to the general PAC audience – This has been done to support past Economic Studies – Past study groups required a very limited number of conference calls – May have different study working groups for each Economic Studies
• Alternatively or in addition to the economic study working group – PAC presentations will be structured to discuss the general PAC economic study
issues upfront – More technical discussions will be discussed with PAC members as a last meeting
agenda item
5
Economic Study Metrics
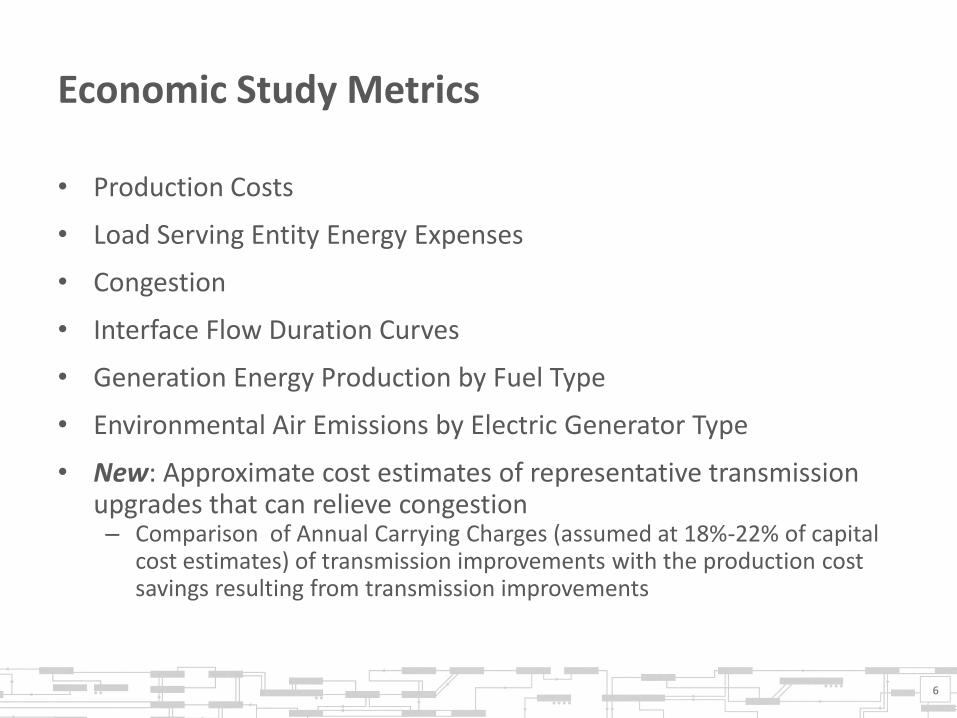
• Production Costs
• Load Serving Entity Energy Expenses
• Congestion
• Interface Flow Duration Curves
• Generation Energy Production by Fuel Type
• Environmental Air Emissions by Electric Generator Type
• New: Approximate cost estimates of representative transmission upgrades that can relieve congestion – Comparison of Annual Carrying Charges (assumed at 18%-22% of capital
cost estimates) of transmission improvements with the production cost savings resulting from transmission improvements
6

Economic Study Assumptions Affecting Energy Cost Results
• Demand forecasts
• Energy Efficiency growth rates
• Renewable development and integration
• Types and locations of new resource development
• Potential retirements
– Coal
– Oil
– Nuclear
• Fuel price
• Environmental emission allowance prices
7
Key Simulation Data
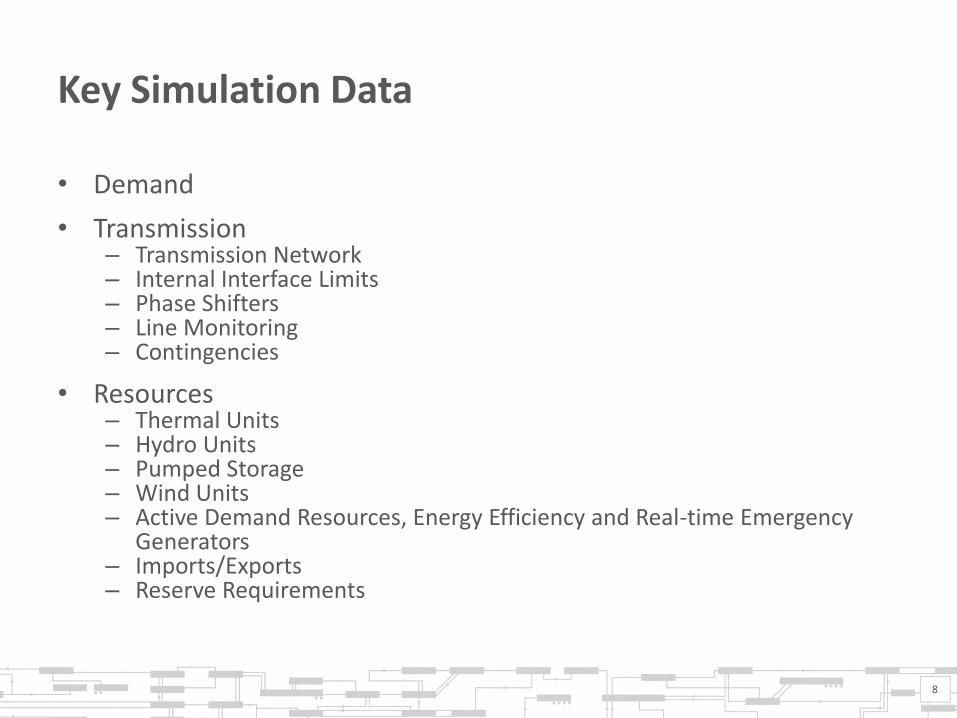
• Demand
• Transmission – Transmission Network – Internal Interface Limits – Phase Shifters – Line Monitoring – Contingencies
• Resources – Thermal Units – Hydro Units – Pumped Storage – Wind Units – Active Demand Resources, Energy Efficiency and Real-time Emergency
Generators – Imports/Exports – Reserve Requirements
8

9
APPENDIX SIMULATION METHODOLOGY Development of Base Model
Overview of Assumptions – Consistent with 2015 CELT
• Demand
– Net of Energy Efficiency (EE) and Photovoltaic (PV) – including forecasts
– Active Demand Resources (DR) treated as supply
– Hourly load profile based on 2006 weather (synchronized with wind data)
• Supply resources considered
– Results from Forward Capacity Auction #9
– Other Energy Only Resources
– Wind in the each study are specified by the economic study request
• Wind resource production modeled based on New England Wind Integration Study (NEWIS) data
11
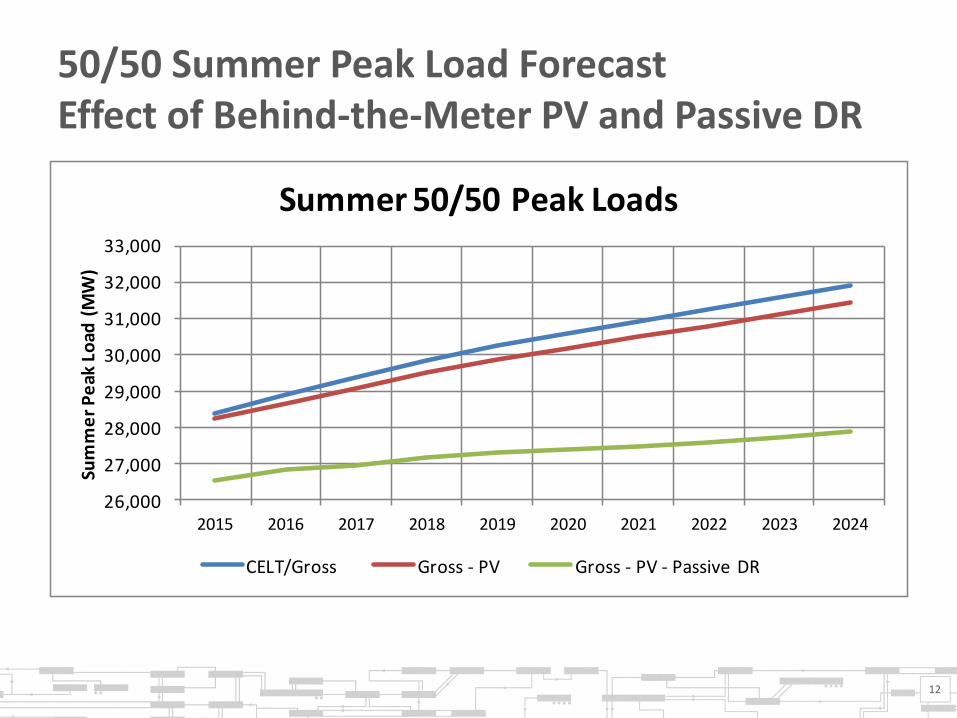
50/50 Summer Peak Load Forecast Effect of Behind-the-Meter PV and Passive DR
12
26,000
27,000
28,000
29,000
30,000
31,000
32,000
33,000
2015 2016 2017 2018 2019 2020 2021 2022 2023 2024
Sum
me
r P
eak
Lo
ad (
MW
)
Summer 50/50 Peak Loads
CELT/Gross Gross - PV Gross - PV - Passive DR
Network Modeling
• Modeling of Transmission Network – ISO-NE FERC 715 filling of summer case – Detailed modeling in ISO-NE region only – Representation for neighboring systems
• Detailed network modeling not required for NY, NB and HQ • Tie-line flows modeled by dummy resources at external nodes • Base flows based on historical line flows
13
Network Modeling (cont)
• Modeling of Internal Interface Limits – The latest ISO-NE estimated internal interface limit values reflected
• Modeling of transmission line – All 230 kV and 345kV circuits ISO-NE region are monitored
• Nearly 300 branches monitored • Includes transformers that step up to 230 kV and above
– Generator step-up (GSU) transformers are excluded • Ensure a generating plant output is not limited by GSU modeling
• Monitoring of Transmission Line – 115 kV and above lines in areas of concern as appropriate
• Maine for – Strategic Transmission Analysis – Wind Integration study – Keene Road study
• SEMA / RI for off-shore wind study
14
Network Modeling (cont)
• Modeling of contingencies – Modeled same contingencies as defined in previous GridView cases
• Based on 3 years of historical binding contingencies in Day-Ahead Market • 100 out of 160 frequently occurring identified and modeled
– Full set of transmission planning contingences (OP-19) not modeled
• Additional system contingencies identified by relevant needs assessments and solution studies
15
Thermal Units
• Points of interconnection for resources based on 2015 FERC 715 filing summer cases
• Existing thermal units – Simulation study production cost parameters: Heat rate curve, Start-up
cost, No-load cost and etc. – Primary and secondary fuel definition are based on 2015 CELT
• Operational limits assumed same as previous economic study – Minimum up time, Minimum down time and Start up time – Ramp rate limits
• Energy limits: assume no energy limits
• Future thermal units – Generic – Production cost parameters based on: unit type, technology and rating
16

Thermal Units (Cont.)
• Combined Cycle Units – Individual machines from a combined cycle plant are modeled
separately, connecting to different buses
• Outages – Thermal units derated to reflect the forced outages using Equivalent
Forced Outage Rate (EFOR) – Planned maintenance schedule will be developed and held constant
across cases
17

Hydro Units
• Hydro units modeled using – Hourly energy generation profiles – Used in previous economic studies
• Hydro units are assumed no maintenance outage
18
Pumped Storage Units
• Modeled in peak shaving mode – Pumping during off-peak hours – Generating during on-peak hours
• Pumped Storage physical parameters – Minimum pond size – Maximum pond size – Plant Capacity Factor – Based on assumptions used in previous studies
19

Wind Units
• Modeled as hourly resources, – Pre-defined using an hourly profile per RSP area – Same as used in previous economic studies
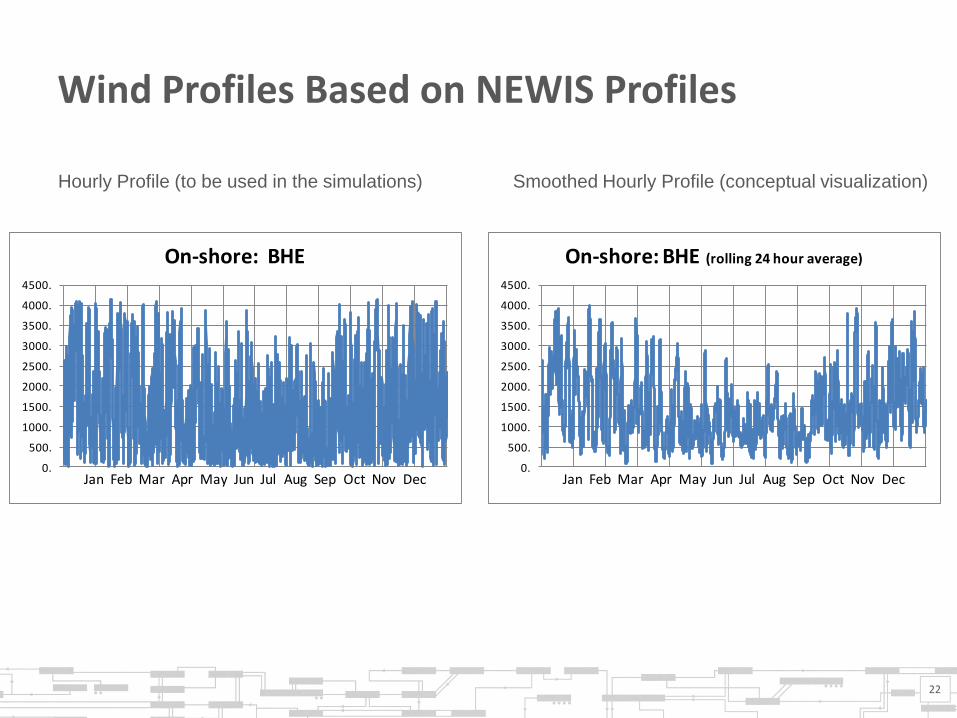
• Wind and hourly load profiles based on NEWIS data – ME-BHE (On-shore) – ME-CMP (On-shore) – NH (On-shore) – RI (Off-shore) – SEMA (Off-shore) – VT (On-shore) – WEMA (On-shore)
• Wind will be curtailed when transmission is constrained
20

Wind Profiles Based on NEWIS Profiles
21
Hourly Profile (to be used in the simulations) Smoothed Hourly Profile (conceptual visualization)
0.
50.
100.
150.
200.
250.
300.
350.
400.
450.
Jan Feb Mar Apr May Jun Jul Aug Sep Oct Nov Dec
Offshore: SEMA
0.
50.
100.
150.
200.
250.
300.
350.
400.
450.
Jan Feb Mar Apr May Jun Jul Aug Sep Oct Nov Dec
Offshore: SEMA (rolling 24 hour average)
Wind Profiles Based on NEWIS Profiles
22
Hourly Profile (to be used in the simulations) Smoothed Hourly Profile (conceptual visualization)
0.
500.
1000.
1500.
2000.
2500.
3000.
3500.
4000.
4500.
Jan Feb Mar Apr May Jun Jul Aug Sep Oct Nov Dec
On-shore: BHE
0.
500.
1000.
1500.
2000.
2500.
3000.
3500.
4000.
4500.
Jan Feb Mar Apr May Jun Jul Aug Sep Oct Nov Dec
On-shore: BHE (rolling 24 hour average)
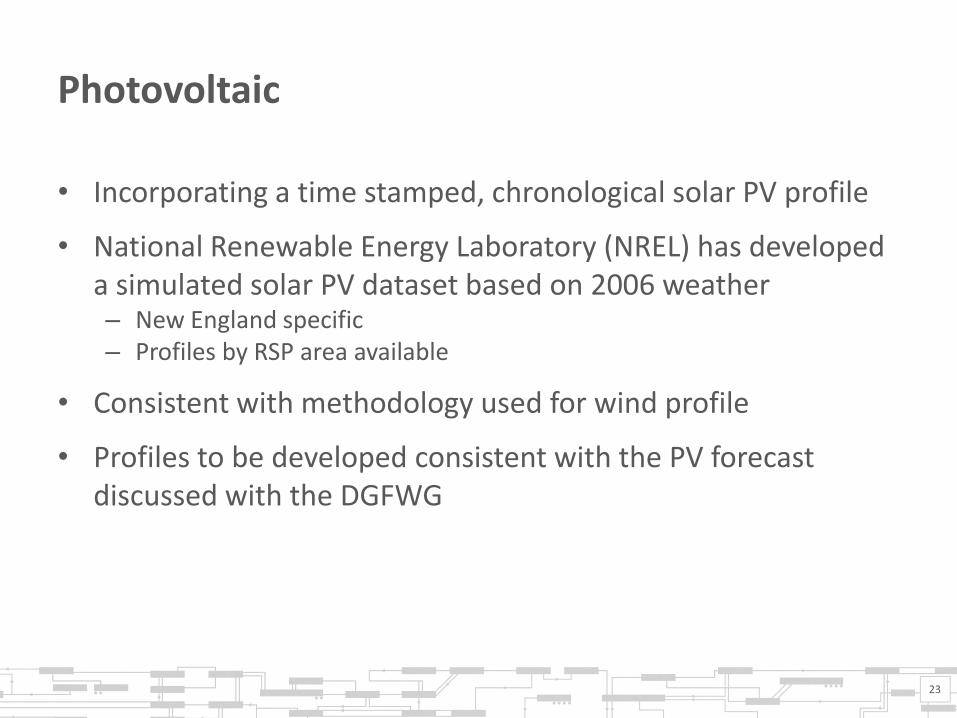
Photovoltaic
• Incorporating a time stamped, chronological solar PV profile
• National Renewable Energy Laboratory (NREL) has developed a simulated solar PV dataset based on 2006 weather – New England specific – Profiles by RSP area available
• Consistent with methodology used for wind profile
• Profiles to be developed consistent with the PV forecast discussed with the DGFWG
23

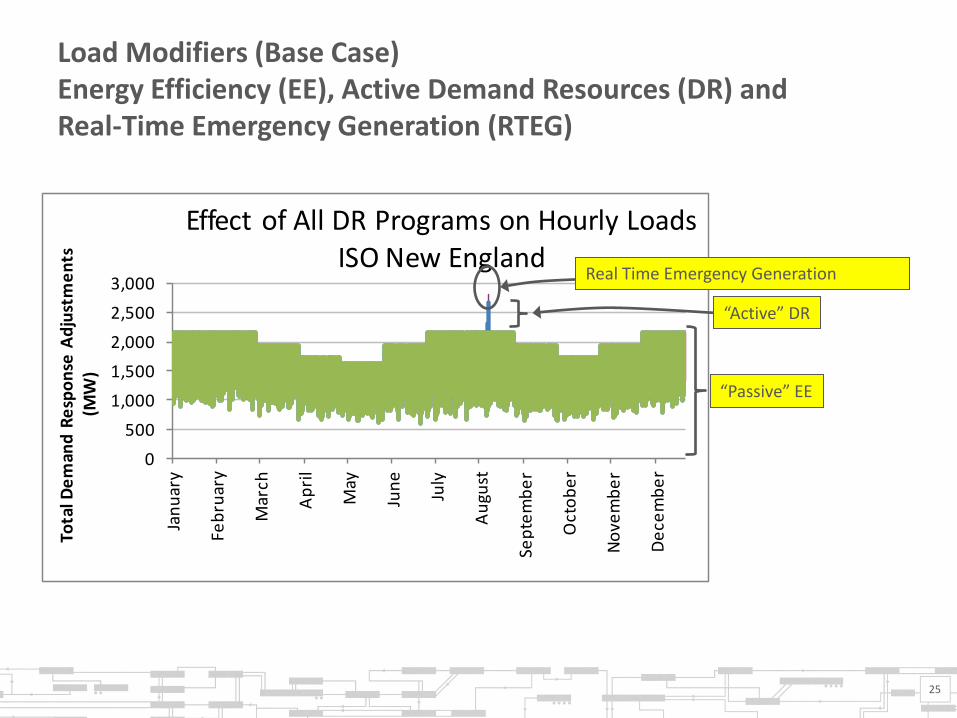
Demand Side Resources
• Active DR, EE and RTEG are modeled explicitly – Hourly profile for each category of demand side resource – FCA amounts used through capacity commitment periods
• Forecasts – The latest EE forecast through the year 2024 is reflected – Active DR and RTEG are held constant for years beyond capacity
commitment period (same as other FCM resources)
• Modeled the same as previous economic studies
24
0
500
1,000
1,500
2,000
2,500
3,000
Jan
uar
y
Feb
ruar
y
Mar
ch
Ap
ril
May
Jun
e
July
Au
gust
Sep
tem
be
r
Oct
ob
er
No
vem
be
r
De
cem
be
r
Tota
l De
man
d R
esp
on
se A
dju
stm
en
ts(M
W)
Effect of All DR Programs on Hourly LoadsISO New England
Load Modifiers (Base Case) Energy Efficiency (EE), Active Demand Resources (DR) and Real-Time Emergency Generation (RTEG)
25
“Passive” EE
Real Time Emergency Generation
“Active” DR
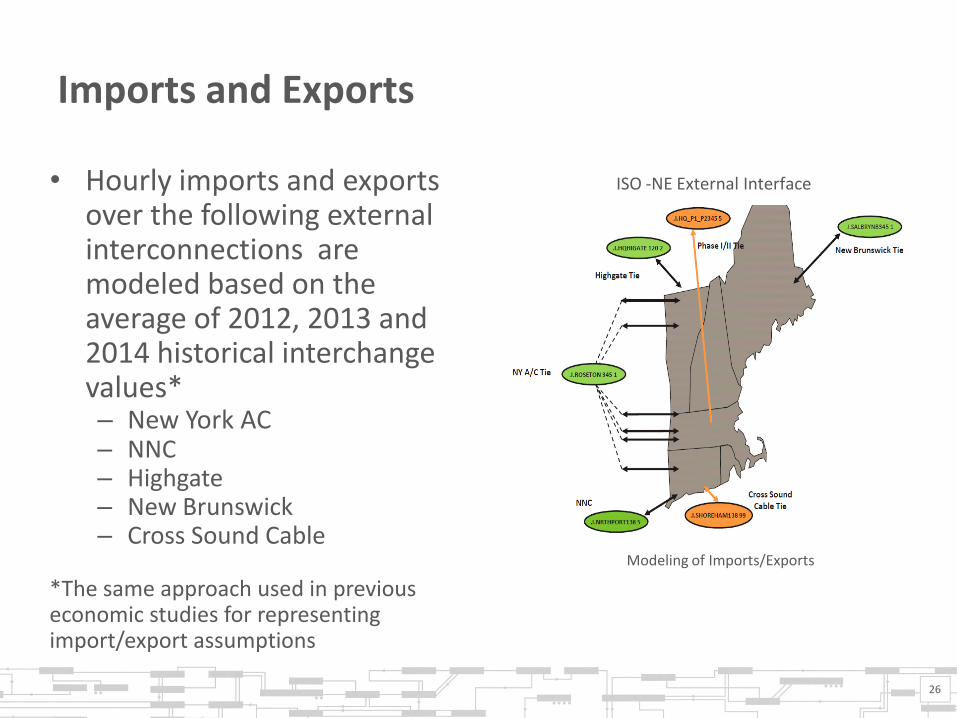
Imports and Exports
• Hourly imports and exports over the following external interconnections are modeled based on the average of 2012, 2013 and 2014 historical interchange values* – New York AC – NNC – Highgate – New Brunswick – Cross Sound Cable
*The same approach used in previous economic studies for representing import/export assumptions
26
Modeling of Imports/Exports
ISO -NE External Interface

Interchange Modeling
• Interchange with external areas will be based on: – Three year average
• 2012 • 2013 • 2014
– Monthly diurnal profiles – Five interchange profiles
• HQ Phase II • HQ Highgate • Maritimes • New York interconnection AC • New York interconnection DC
27

-2000
-1500
-1000
-500
0
1 2 3 4 5 6 7 8 9
10
11
12
Flo
w (
MW
)
Average Interchange - HQ Phase II Averaged Diurnal Profiles: 2012 - 2014
2012 2013 2014 Average
Quebec to New England: Phase II
28
Note: negative values represent imports; positive values represent exports.
-250
-200
-150
-100
-50
0
1 2 3 4 5 6 7 8 9
10
11
12
Flo
w (
MW
)
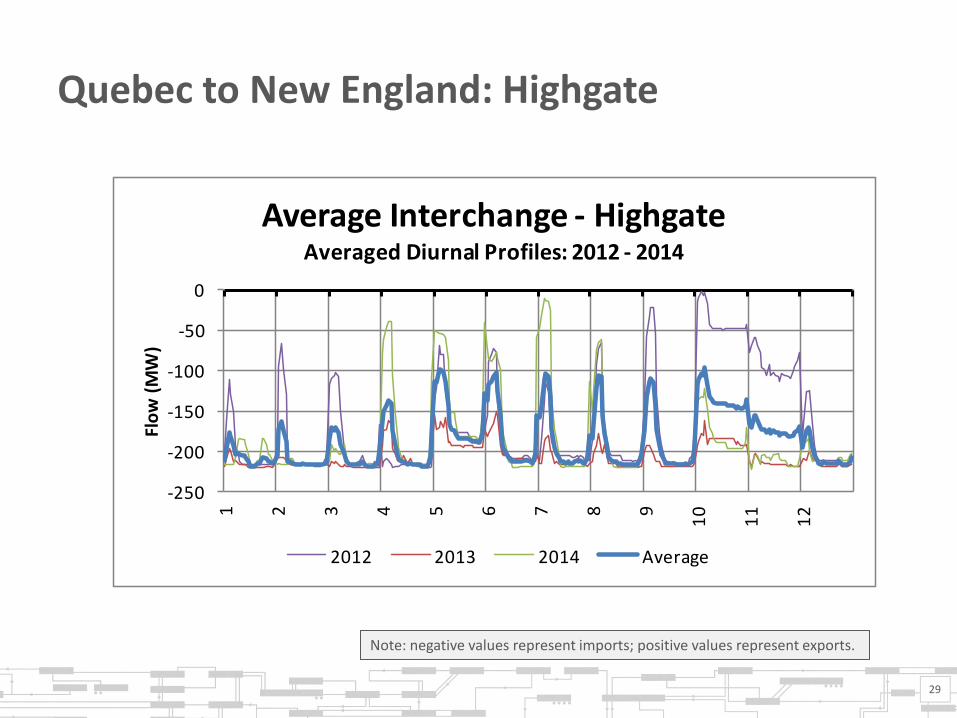
Average Interchange - HighgateAveraged Diurnal Profiles: 2012 - 2014
2012 2013 2014 Average
Quebec to New England: Highgate
29
Note: negative values represent imports; positive values represent exports.
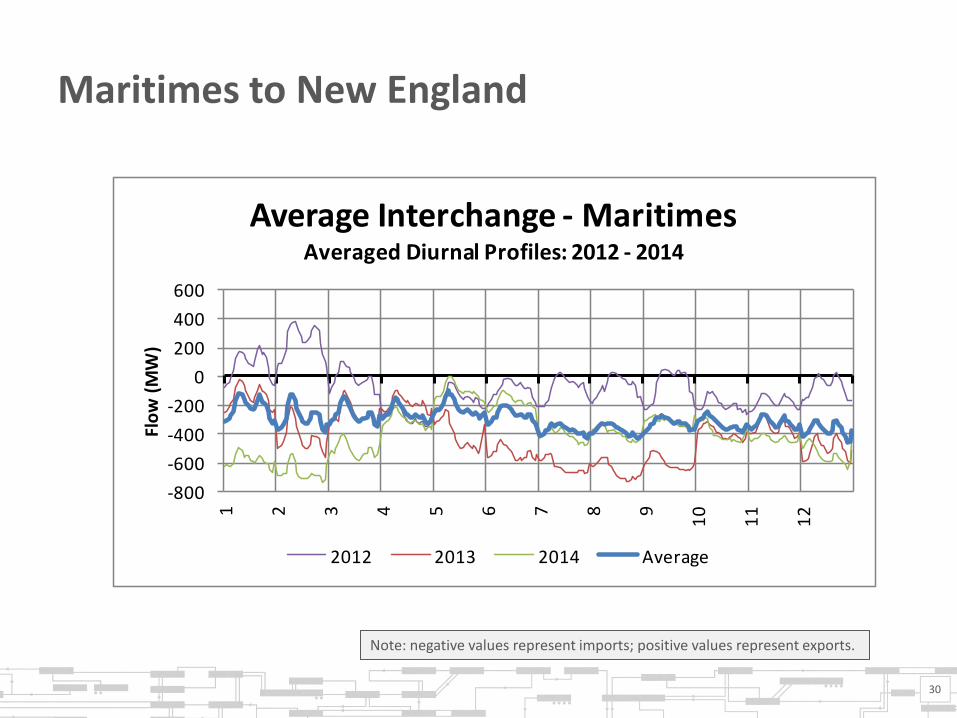
-800
-600
-400
-200
0
200
400
600
1 2 3 4 5 6 7 8 9
10
11
12
Flo
w (
MW
)
Average Interchange - MaritimesAveraged Diurnal Profiles: 2012 - 2014
2012 2013 2014 Average
Maritimes to New England
30
Note: negative values represent imports; positive values represent exports.

-1500
-1000
-500
0
500
1000
1 2 3 4 5 6 7 8 9
10
11
12
Flo
w (
MW
)
Average Interchange - New York ACAveraged Diurnal Profiles: 2012 - 2014
2012 2013 2014 Average
New England to New York - AC Interface
31
Note: negative values represent imports; positive values represent exports.

-100
0
100
200
300
400
1 2 3 4 5 6 7 8 9
10
11
12
Flo
w (
MW
)
Average Interchange - New York DC Averaged Diurnal Profiles: 2012 - 2014
2012 2013 2014 Average
New England to New York - DC Interface
32
Note: negative values represent imports; positive values represent exports.
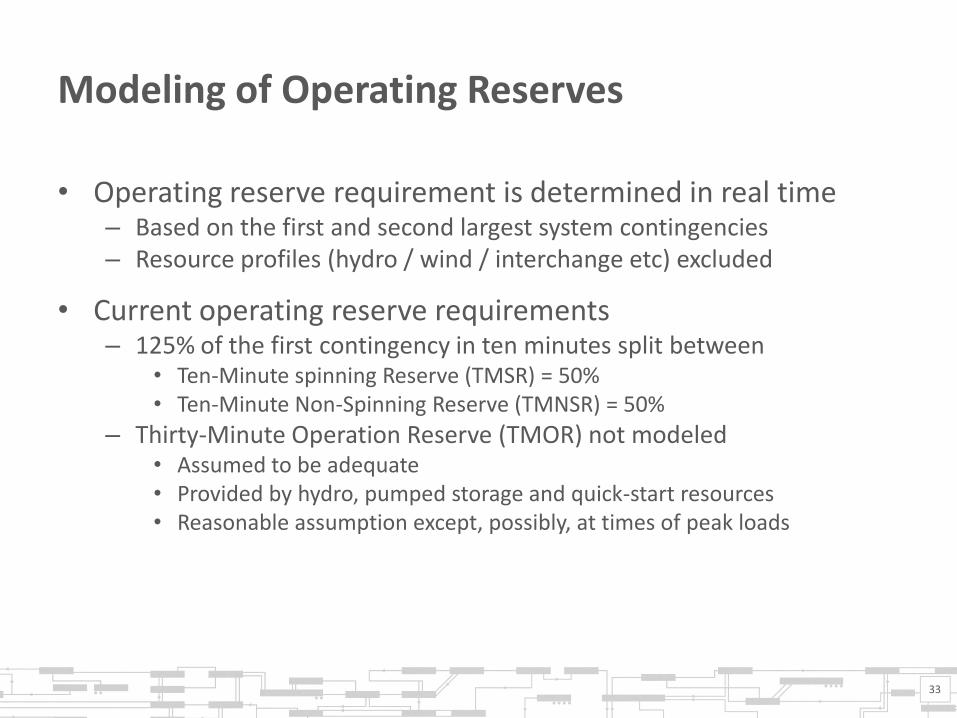
Modeling of Operating Reserves
• Operating reserve requirement is determined in real time – Based on the first and second largest system contingencies – Resource profiles (hydro / wind / interchange etc) excluded
• Current operating reserve requirements – 125% of the first contingency in ten minutes split between
• Ten-Minute spinning Reserve (TMSR) = 50% • Ten-Minute Non-Spinning Reserve (TMNSR) = 50%
– Thirty-Minute Operation Reserve (TMOR) not modeled • Assumed to be adequate • Provided by hydro, pumped storage and quick-start resources • Reasonable assumption except, possibly, at times of peak loads
33
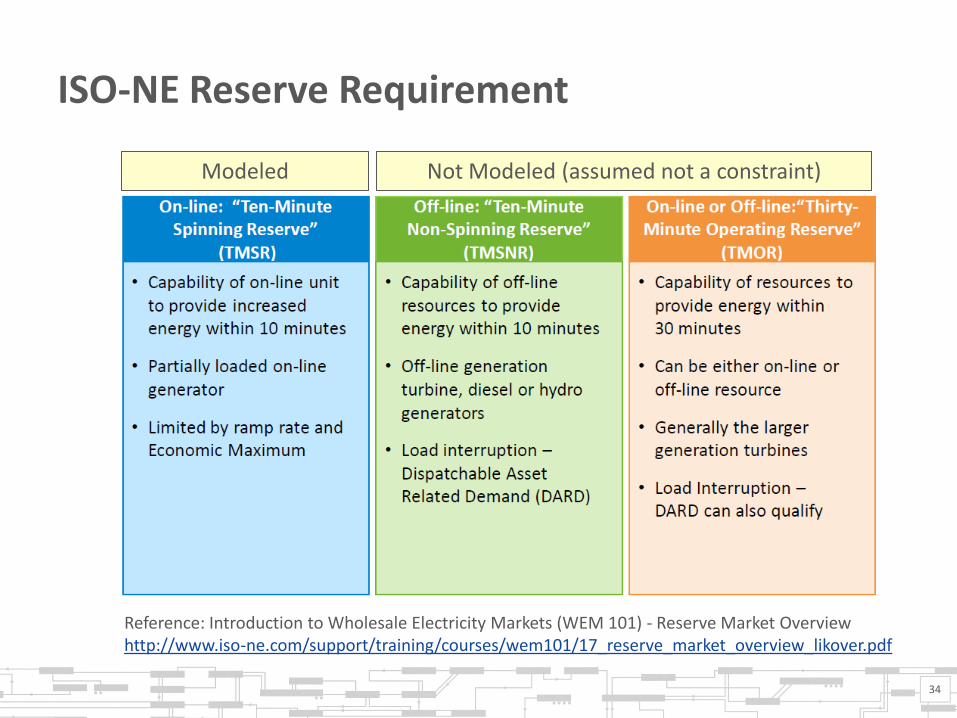
ISO-NE Reserve Requirement
34
Reference: Introduction to Wholesale Electricity Markets (WEM 101) - Reserve Market Overview http://www.iso-ne.com/support/training/courses/wem101/17_reserve_market_overview_likover.pdf
Modeled Not Modeled (assumed not a constraint)
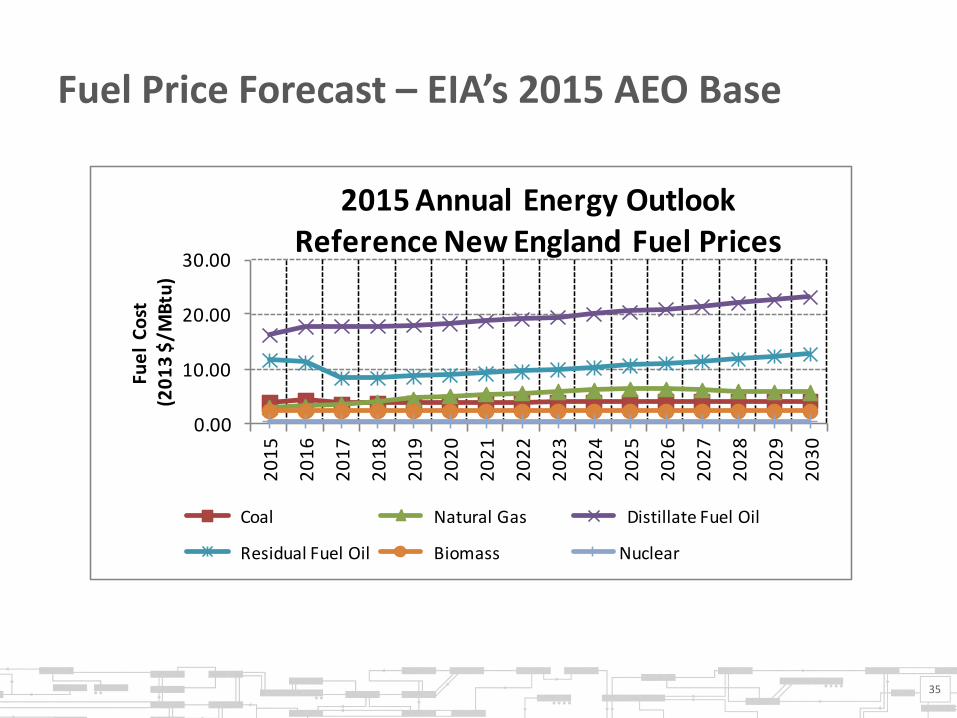
Fuel Price Forecast – EIA’s 2015 AEO Base
35
0.00
10.00
20.00
30.002
01
5
20
16
20
17
20
18
20
19
20
20
20
21
20
22
20
23
20
24
20
25
20
26
20
27
20
28
20
29
20
30
Fue
l C
ost
(2
01
3 $
/MB
tu)
2015 Annual Energy Outlook Reference New England Fuel Prices
Coal Natural Gas Distillate Fuel Oil
Residual Fuel Oil Biomass Nuclear
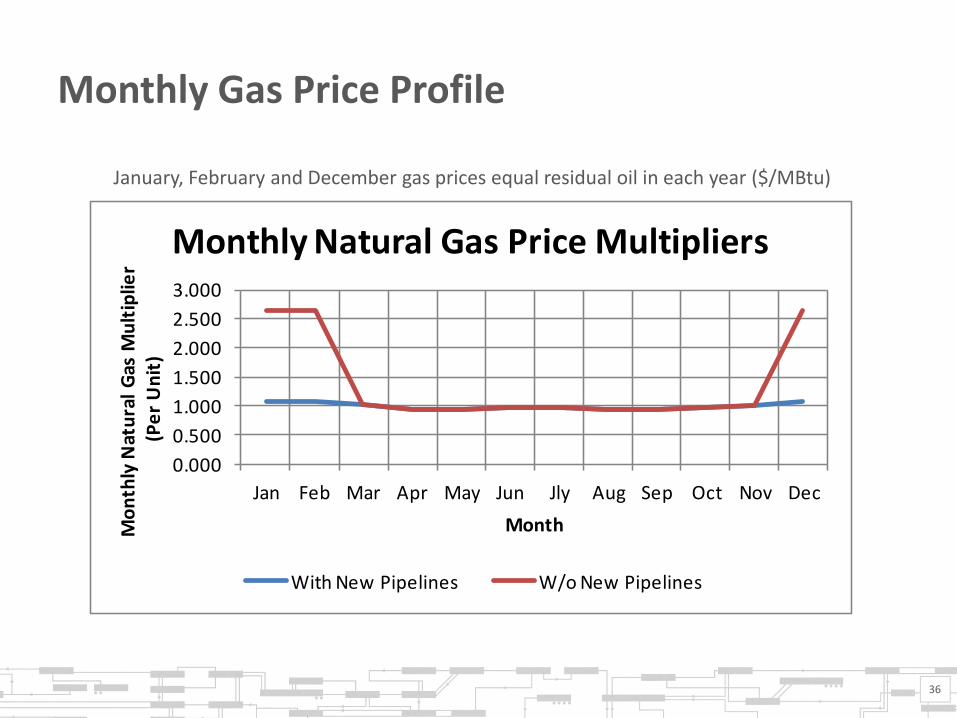
Monthly Gas Price Profile
36
0.000
0.500
1.000
1.500
2.000
2.500
3.000
Jan Feb Mar Apr May Jun Jly Aug Sep Oct Nov Dec
Mo
nth
ly N
atu
ral
Gas
Mu
ltip
lier
(Pe
r U
nit
)
Month
Monthly Natural Gas Price Multipliers
With New Pipelines W/o New Pipelines
January, February and December gas prices equal residual oil in each year ($/MBtu)

37