2015 edition wisdom of crowds enterprise planning market...
TRANSCRIPT

June 22, 2015 Dresner Advisory Services, LLC
2015 Edition
Wisdom of Crowds® Enterprise Planning Market Study
Licensed to Prophix

2015 Wisdom of Crowds® Enterprise Planning Market Study
Disclaimer
This report should be used for informational purposes only. Vendor and product selections should be made based on multiple information sources, face-to-face meetings, customer reference checking, product demonstrations, and proof-of-concept applications.
The information contained in all Wisdom of Crowds® Market Study Reports reflects the opinions expressed in the online responses of individuals who chose to respond to our online questionnaire and does not represent a scientific sampling of any kind. Dresner Advisory Services, LLC shall not be liable for the content of reports, study results, or for any damages incurred or alleged to be incurred by any of the companies included in the reports as a result of the content.
Reproduction and distribution of this publication in any form without prior written permission is forbidden.
http://www.dresneradvisory.com Copyright 2015 – Dresner Advisory Services, LLC
2

2015 Wisdom of Crowds® Enterprise Planning Market Study
Enterprise Planning: A Definition An enterprise planning system covers the methods of planning for the internal and external factors that affect an enterprise. This includes strategic, operational, and financial planning.
http://www.dresneradvisory.com Copyright 2015 – Dresner Advisory Services, LLC
3

2015 Wisdom of Crowds® Enterprise Planning Market Study
Introduction This year we celebrate the eighth anniversary of Dresner Advisory Services! Our thanks to all of you that have been with us along the way, encouraging and challenging us!
Since our founding in 2007, we have strived to offer a fresh, real-world, and alternative perspective on the Business Intelligence (BI) market. We hope that you agree that we not only have succeeded in doing so but also continue to “raise the bar”—offering increasingly compelling research and greater value with each successive year!
Since we published our first Wisdom of Crowds® Business Intelligence Market Study in 2010, we have continued to expand our research offerings to include a variety of important topics including: Location Intelligence, Advanced and Predictive Analytics, Cloud Computing and BI, Collaborative Computing and BI, Embedded BI, BI Emerging Technologies, and Small & Mid-Sized Enterprise BI. During 2015 we added to these topics with coverage for Enterprise Planning, End-User Data Preparation, and Big Data Analytics.
This publication marks our first annual “Flagship” Wisdom of Crowds Enterprise Planning Market Study. In this inaugural report we examine user perceptions, intentions and realities associated with enterprise planning. Building upon many of the time-tested processes and market models used in our Business Intelligence study (e.g., 33-dimension vendor rating model, customer experience, vendor credibility models) we offer unique insights and perspective into this important market.
In closing, we’re very excited about both the market and our ability to continue to add substantial perspective and value to it!
Thanks for your support!
Best,
Howard Dresner Chief Research Officer Dresner Advisory Services
http://www.dresneradvisory.com Copyright 2015 – Dresner Advisory Services, LLC
4

2015 Wisdom of Crowds® Enterprise Planning Market Study
Contents Enterprise Planning: A Definition ..................................................................................... 3
Introduction ..................................................................................................................... 4
Benefits of the Study ....................................................................................................... 7
Consumer Guide .......................................................................................................... 7
Supplier Tool ................................................................................................................ 7
External Awareness .................................................................................................. 7
Internal Planning ....................................................................................................... 7
About Howard Dresner and Dresner Advisory Services .................................................. 8
About Jim Ericson ........................................................................................................... 9
Survey Method and Data Collection .............................................................................. 10
Data Quality ............................................................................................................... 10
Vendor/Market Categories ............................................................................................ 11
Executive Summary ...................................................................................................... 13
Study Demographics ..................................................................................................... 15
Geography ................................................................................................................. 15
Functions ................................................................................................................... 16
Vertical Industries ...................................................................................................... 17
Organization Size ....................................................................................................... 18
Analysis and Trends ...................................................................................................... 20
Adoption of Enterprise Planning Software ................................................................. 20
Importance of Enterprise Planning Software .............................................................. 24
Functions Using Enterprise Planning ......................................................................... 29
Enterprise Planning Initiatives .................................................................................... 40
Frequency of Enterprise Planning and Forecasting ................................................... 46
Deployment Options for Enterprise Planning ............................................................. 55
Industry Capabilities ...................................................................................................... 62
Industry – Strategic Planning Features ...................................................................... 62
Industry – Financial Planning Features ...................................................................... 63
Industry – Operational Planning Features .................................................................. 65
http://www.dresneradvisory.com Copyright 2015 – Dresner Advisory Services, LLC
5
2015 Wisdom of Crowds® Enterprise Planning Market Study
Industry – Architectural Features ............................................................................... 66
Vendor Rankings ........................................................................................................... 68
Titan/ERP Enterprise Planning Vendors .................................................................... 69
Large Established Pure-Play Enterprise Planning Vendors ....................................... 69
Cloud Enterprise Planning Vendors ........................................................................... 69
Detailed Vendor Scores ............................................................................................. 70
Adaptive Insights Detailed Score ............................................................................ 71
Anaplan Detailed Score .......................................................................................... 72
Budget Maestro (Centage) Detailed Score ............................................................. 73
Host Analytics Detailed Score ................................................................................ 74
IBM Detailed Score ................................................................................................. 75
Infor Detailed Score ................................................................................................ 76
Oracle Detailed Score ............................................................................................. 77
Prophix Detailed Score ........................................................................................... 78
SAP Detailed Score ................................................................................................ 79
Tagetik Detailed Score ........................................................................................... 80
Additional Enterprise Planning Market Models .............................................................. 81
Customer Experience Model ...................................................................................... 81
Vendor Credibility Model ............................................................................................ 83
Appendix - The 2015 Wisdom of Crowds® Enterprise Planning Market Survey Instrument ..................................................................................................................... 85
Other Dresner Advisory Services Research Reports .................................................... 96
http://www.dresneradvisory.com Copyright 2015 – Dresner Advisory Services, LLC
6

2015 Wisdom of Crowds® Enterprise Planning Market Study
Benefits of the Study The Wisdom of Crowds® Enterprise Planning Market Study provides a wealth of information and analysis—offering value to both consumers and producers of enterprise planning technology and services.
Consumer Guide As an objective source of industry research, consumers use the Wisdom of Crowds® Enterprise Planning Market Study to understand how their peers leverage and invest in planning and related technologies.
Using our trademark 33-criteria vendor performance measurement system, users glean key insights into planning software supplier performance, enabling:
• Comparisons of current vendor performance to industry norms • Identification and selection of new vendors
Supplier Tool Vendor Licensees use the Wisdom of Crowds® Enterprise Planning Market Study in several important ways such as:
External Awareness - Build awareness for the planning market and supplier brand, citing Wisdom of
Crowds® Enterprise Planning Market Study trends and vendor performance - Create lead and demand-generation for supplier offerings through association with
Wisdom of Crowds® Enterprise Planning Market Study brand, findings, webinars, etc.
Internal Planning - Refine internal product plans and align with market priorities and realities as
identified in Wisdom of Crowds® Enterprise Planning Market Study - Better understand customer priorities, concerns, and issues - Identify competitive pressures and opportunities
http://www.dresneradvisory.com Copyright 2015 – Dresner Advisory Services, LLC
7

2015 Wisdom of Crowds® Enterprise Planning Market Study
About Howard Dresner and Dresner Advisory Services The Wisdom of Crowds® Enterprise Planning Market Study was conceived, designed and executed by Dresner Advisory Services, LLC—an independent advisory firm—and Howard Dresner, its President, Founder and Chief Research Officer.
Howard Dresner is one of the foremost thought leaders in business intelligence and performance management, having coined the term “Business Intelligence” in 1989. He
has published two books on the subject, The Performance Management Revolution—Business Results through Insight and Action (John Wiley & Sons, Nov. 2007) and Profiles in Performance—Business Intelligence Journeys and the Roadmap for Change (John Wiley & Sons, Nov. 2009). He lectures at forums around the world and is often cited by the business and trade press.
Prior to Dresner Advisory Services, Howard served as chief strategy officer at Hyperion Solutions and was a research fellow at Gartner, where he led its business intelligence research practice for 13 years.
Howard has conducted and directed numerous in-depth primary research studies over the past two decades and is an expert in analyzing these markets.
Through the Wisdom of Crowds® market research reports, we engage with a global community to redefine how research is created and shared. Other research reports include:
- “Flagship” Wisdom of Crowds Business Intelligence Market Study
- Advanced and Predictive Analytics
- Cloud Computing and Business Intelligence
- Collaborative Computing and Business Intelligence
- End User Data Preparation
- Mobile Computing and Business Intelligence
Howard (www.twitter.com/howarddresner) conducts a weekly Twitter “tweetchat” on Fridays at 1:00 p.m. ET. The hashtag is #BIWisdom. During these live events the #BIWisdom “tribe” discusses a wide range of topics.
You can find more information about Dresner Advisory Services at www.dresneradvisory.com. http://www.dresneradvisory.com Copyright 2015 – Dresner Advisory Services, LLC
8

2015 Wisdom of Crowds® Enterprise Planning Market Study
About Jim Ericson Jim Ericson is a research director with Dresner Advisory Services.
Jim has served as a consultant and journalist who studies end-user management practices and industry trending in the data and information management fields.
From 2004 to 2013 he was the editorial director at Information Management magazine (formerly DM Review), where he created architectures for user and industry coverage for hundreds of contributors across the breadth of the data and information management industry.
As lead writer he interviewed and profiled more than 100 CIOs, CTOs, and program directors in a 2010-2012 program called “25 Top Information Managers.” His related feature articles earned ASBPE national bronze and multiple Mid-Atlantic region gold and silver awards for Technical Article and for Case History feature
writing.
A panelist, interviewer, blogger, community liaison, conference co-chair, and speaker in the data-management community, he also sponsored and co-hosted a weekly podcast in continuous production for more than five years.
Jim’s earlier background as senior morning news producer at NBC/Mutual Radio Networks and as managing editor of MSNBC’s first Washington, D.C. online news bureau cemented his understanding of fact-finding, topical reporting, and serving broad audiences.
http://www.dresneradvisory.com Copyright 2015 – Dresner Advisory Services, LLC
9
2015 Wisdom of Crowds® Enterprise Planning Market Study
Survey Method and Data Collection As with all of our Wisdom of Crowds® market studies, we constructed a survey instrument to collect data and used social media and crowd-sourcing techniques to recruit participants.
We expanded data collection to include our own research community of over 3,000 organizations (versus 2,000 in 2014) as well as vendors’ customer communities.
Data Quality We carefully scrutinized and verified all respondent entries to ensure that the study includes only qualified participants.
http://www.dresneradvisory.com Copyright 2015 – Dresner Advisory Services, LLC
10

2015 Wisdom of Crowds® Enterprise Planning Market Study
Vendor/Market Categories For the purposes of this report, we utilize three different industry sub-categories in which to group vendors and analyze market behavior and direction. These include “Cloud,” “Large Established Pure-Play,” and “Titan/ERP” vendors.
Cloud vendors offer a pure, native cloud product offering versus traditional enterprise software. This category includes Adaptive Insights, Anaplan, and Host Analytics.
Large Established Pure-Play vendors predominately focus on planning and budgeting software and services, typically have been in business for 15 or more years, and have well-established customer bases and revenue streams. These include Centage (Budget Maestro), Prophix, and Tagetik.
Titans are the largest vendors, with extensive product and service offerings—including planning. In all cases, these vendors acquired planning vendors. Included in this category are IBM, Infor, Oracle, and SAP.
http://www.dresneradvisory.com Copyright 2015 – Dresner Advisory Services, LLC
11

2015 Wisdom of Crowds® Enterprise Planning Market Study
Executive Summary
http://www.dresneradvisory.com Copyright 2015 – Dresner Advisory Services, LLC
12

2015 Wisdom of Crowds® Enterprise Planning Market Study
Executive Summary • Enterprise planning software is currently well established with 73 percent adoption;
full participation is anticipated in future timeframes (see p. 21). • Current adoption lags most notably in healthcare; manufacturing reports the highest
current adoption at 77 percent (see p. 23) and by function (p. 34). • Though 90 percent say enterprise planning/budgeting is, at minimum, “important,”
respondents have a decidedly mixed view of its overall merits (see p. 24). • Not surprisingly, finance assigns the highest mean level importance to planning and
budgeting and is the leading user by function (see p. 25). • Large organizations place slightly greater emphasis on enterprise planning, but
mean importance is markedly consistent across organizations of different size (see p. 27).
• Industry rankings by importance of planning are somewhat at odds with industry adoption rates (i.e., healthcare high importance, low adoption) (see p. 28).
• Operations and sales have the highest 12-month adoption plans, followed by HR, marketing, strategic planning, and IT (see p. 29).
• Twelve-month enterprise planning growth in EMEA and North America will be strongest in the areas of sales and operations (see p. 32).
• Excluding finance, all organizations expect 10 to 15 percent 12-month growth in operations, sales, IT, HR, and marketing strategic planning use (see pp. 35-36).
• Retail and wholesale have the most aggressive 12-month adoption plans within finance, operations and sales (see p. 38).
• Thirty percent of healthcare respondents plan to extend strategic planning to marketing in the coming 12 months (see p. 39).
• Despite calls for flexible and responsive budgeting models, annual financial budgets top the list of enterprise planning initiatives (see pp. 40-43).
• Enterprise planning initiatives vary noticeably by vertical industry (see p. 44). • 2015 plans call for increased use of all six of the highest-prioritized initiatives (see p.
45). • Enterprise forecasting is most likely to be a monthly exercise, followed by quarterly;
planning and budgeting frequency is predominately annual (see pp. 46-54). • Organizations do not express an overwhelming preference among deployment
options for enterprise planning, but on-premises is most popular overall (see pp. 55-60).
• Current industry capabilities fully address most common feature requirements for strategic, financial, and operational planning (see pp. 62-65).
http://www.dresneradvisory.com Copyright 2015 – Dresner Advisory Services, LLC
13

2015 Wisdom of Crowds® Enterprise Planning Market Study
• Industry architectural plans are mostly mature, but deployment options are not universal; 25 percent of vendors have no plans for on-premises deployment (see p. 66).
http://www.dresneradvisory.com Copyright 2015 – Dresner Advisory Services, LLC
14

2015 Wisdom of Crowds® Enterprise Planning Market Study
Study Demographics Our 2015 survey base provides a rich cross-section of data across geographies, functions, organization size, and vertical industries. We believe that, unlike other industry research, this supports a more representative sample and better indicator of true market dynamics. We have constructed cross-tab analyses using these demographics to identify and illustrate important industry trends.
Geography Survey respondents represent a broad span of geographies. North America, which includes the United States, Canada, and Puerto Rico, represents the largest group with 64 percent of all respondents. EMEA accounts for 24 percent; Asia Pacific and Latin America make up the remainder of the sample (fig. 1).
Figure 1 – Geographies represented
64%
24%
9%
4%
0%
10%
20%
30%
40%
50%
60%
70%
North America Europe, Middle East, &Africa
Asia Pacific Latin America
Geographies Represented
http://www.dresneradvisory.com Copyright 2015 – Dresner Advisory Services, LLC
15

2015 Wisdom of Crowds® Enterprise Planning Market Study
Functions By function, finance represents the largest single group with about 30 percent of the sample (fig. 2). Information technology follows closely at 26 percent; executive management and the BICC are next-most represented. Less than 2 percent of respondents do not fall into our functional breakout.
Tabulating results across functions helps us develop analyses that reflect the differences and influence of different departments within organizations.
Figure 2 - Functions represented
29.6%
26.1%
13.4% 11.1%
5.5% 4.1% 3.5%
1.8% 1.7% 1.4% 1.8%
0.0%
5.0%
10.0%
15.0%
20.0%
25.0%
30.0%
35.0%
Functions Represented
http://www.dresneradvisory.com Copyright 2015 – Dresner Advisory Services, LLC
16

2015 Wisdom of Crowds® Enterprise Planning Market Study
Vertical Industries Technology, consulting, and manufacturing are the most represented industries in our study and collectively make up about one-third of the sample. Healthcare, financial services and retail/wholesale each account for 5 percent of the sample base.
Tabulating results across industries helps us develop analyses that reflect the maturity and direction of different business sectors.
Figure 3 - Vertical industries represented
14%
10%
8%
5% 5% 5%
4% 3% 3% 3%
3% 2% 2% 2% 2% 2% 2% 2% 2% 1% 1% 1% 1% 1% 1%
13%
0.0%
2.0%
4.0%
6.0%
8.0%
10.0%
12.0%
14.0%
16.0%
Tech
nolo
gy
Cons
ultin
g
Man
ufac
turin
g
Heal
thca
re
Fina
ncia
l ser
vice
s
Reta
il &
who
lesa
le
Educ
atio
n (H
ighe
r Ed)
Tran
spor
tatio
n
Tele
com
mun
icat
ions
Insu
ranc
e
Heal
th C
are
Busin
ess s
ervi
ces
Dist
ribut
ion
& lo
gist
ics
Ener
gy
Not
for p
rofit
Stat
e an
d lo
cal g
over
nmen
t
Cons
umer
pro
duct
s
Auto
mot
ive
Cons
truc
tion
Adve
rtisi
ng
Chem
ical
Fede
ral g
over
nmen
t
Food
, bev
erag
e an
d to
bacc
o
Biot
echn
olog
y
Util
ities
Oth
er
Vertical Industries Represented
http://www.dresneradvisory.com Copyright 2015 – Dresner Advisory Services, LLC
17

2015 Wisdom of Crowds® Enterprise Planning Market Study
Organization Size Participation is balanced across organizations of different size (global employee head count). Small organizations (1-100 employees) represent 24 percent of respondents, mid-size organizations (101-1,000) represent 29 percent, and large organizations (>1,000) make up the largest group with 47 percent (fig. 4).
Tabulating results by organization size reveals important differences in practices, planning, and maturity.
Figure 4 - Organization sizes represented
11% 13%
29%
10% 12%
6%
19%
0%
5%
10%
15%
20%
25%
30%
35%
1 - 25 26-100 101 - 1,000 1,001 - 2,000 2,001 - 5,000 5,001 - 10,000 More than10,000
Organization Sizes Represented
http://www.dresneradvisory.com Copyright 2015 – Dresner Advisory Services, LLC
18

2015 Wisdom of Crowds® Enterprise Planning Market Study
Analysis and Trends
http://www.dresneradvisory.com Copyright 2015 – Dresner Advisory Services, LLC
19

2015 Wisdom of Crowds® Enterprise Planning Market Study
Analysis and Trends
Adoption of Enterprise Planning Software At the highest level, our inaugural study finds that enterprise planning software is currently well established with 73 percent existing adoption (fig. 5). Furthermore, full participation among all study respondents is anticipated in future timeframes. By 2016, more than three-quarters of organizations will have adopted some kind of enterprise planning software. By experience, we assume that most adoption to date has taken place in the financial planning/budgeting arenas.
Figure 5 – Adoption of enterprise planning software
Adopted, 73%
Will adopt in 2015, 5%
Will adopt in 2016, 6%
Will adopt beyond 2016, 16%
Adoption of Enterprise Planning Software
http://www.dresneradvisory.com Copyright 2015 – Dresner Advisory Services, LLC
20

2015 Wisdom of Crowds® Enterprise Planning Market Study
More than 70 percent of respondents in Latin America, North America, and Asia Pacific have already adopted enterprise planning software (fig. 6). Asia Pacific notably trails in current adoption. Rates of planned expansion are similar across geographic regions; EMEA expects the greatest 12-month adoption, followed by North America and Asia Pacific.
Figure 6 – Adoption of enterprise planning software by geography
0%
10%
20%
30%
40%
50%
60%
70%
80%
90%
100%
Latin America North America Europe, MiddleEast, & Africa
Asia Pacific
Adoption of Enterprise Planning Software by Geography
Adopted
Will adopt in 2015
Will adopt in 2016
Will adopt beyond 2016
http://www.dresneradvisory.com Copyright 2015 – Dresner Advisory Services, LLC
21

2015 Wisdom of Crowds® Enterprise Planning Market Study
As we would expect, current adoption of enterprise planning software is higher among large organizations of 1,000 or more employees (fig. 7). Close to 80 percent of organizations with 1,000 to 10,000 currently use enterprise planning. Very large organizations (>10,000) expect 90 percent penetration by the end of 2016. In contrast, small organizations (1-100 employees) are less than 70 percent penetrated but are also most likely to adopt in 2015.
Figure 7 – Adoption of enterprise planning software by organization size
0%
10%
20%
30%
40%
50%
60%
70%
80%
90%
100%
1 - 100 100 - 1,000 1,000 - 10,000 10,000+
Adoption of Enterprise Planning Software by Organization Size
Adopted
Will adopt in 2015
Will adopt in 2016
Will adopt beyond 2016
http://www.dresneradvisory.com Copyright 2015 – Dresner Advisory Services, LLC
22

2015 Wisdom of Crowds® Enterprise Planning Market Study
Adoption rates for enterprise planning software vary by industry (fig. 8). Current and near-term adoption lag most notably in healthcare: only about half of healthcare respondents currently use enterprise planning and 30 percent have pushed adoption plans beyond 2016. Manufacturing (with a discipline of MRP systems deployed in the regular course of business) reports the highest current adoption at 77 percent. Retail and wholesale has below-average current adoption of 67 percent but also has the most aggressive future plans and will reach 90 percent adoption by the end of 2016.
Figure 8 - Adoption of enterprise planning software by selected vertical industry
0%
10%
20%
30%
40%
50%
60%
70%
80%
90%
100%
Adoption of Enterprise Planning Software by Selected Vertical Industry
Adopted
Will adopt in 2015
Will adopt in 2016
Will adopt beyond 2016
http://www.dresneradvisory.com Copyright 2015 – Dresner Advisory Services, LLC
23

2015 Wisdom of Crowds® Enterprise Planning Market Study
Importance of Enterprise Planning Software Though 90 percent of our survey base says that enterprise planning/budgeting is, at minimum, “important,” respondents have a decidedly mixed view of its overall merits (fig. 9). About 60 percent agree that the topic is very important or important. Slightly less than one-third of respondents say enterprise planning/budgeting is critical. It is somewhat surprising to find that almost 10 percent say enterprise planning/budgeting is only somewhat important or not important.
Figure 9 – Importance of enterprise planning/budgeting
Critical, 32.2%
Very important, 41.2%
Important, 17.2%
Somewhat important, 7.4%
Not important, 2.1%
Importance of Enterprise Planning/Budgeting
http://www.dresneradvisory.com Copyright 2015 – Dresner Advisory Services, LLC
24
2015 Wisdom of Crowds® Enterprise Planning Market Study
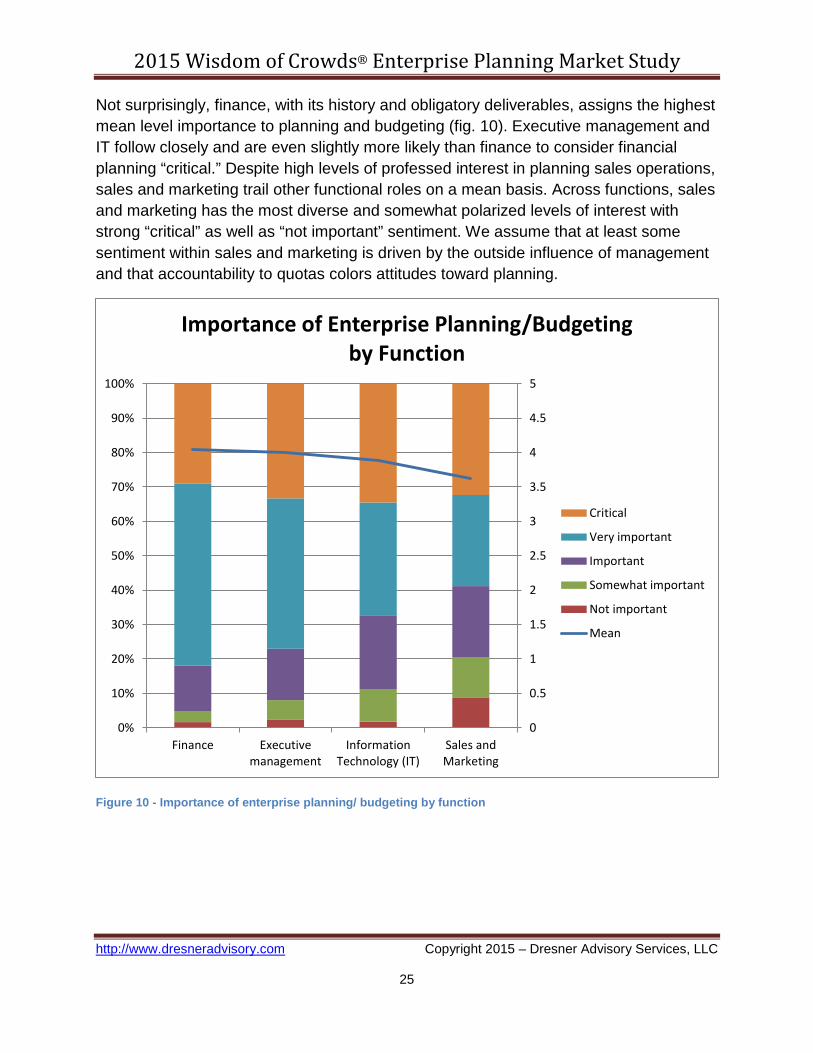
Not surprisingly, finance, with its history and obligatory deliverables, assigns the highest mean level importance to planning and budgeting (fig. 10). Executive management and IT follow closely and are even slightly more likely than finance to consider financial planning “critical.” Despite high levels of professed interest in planning sales operations, sales and marketing trail other functional roles on a mean basis. Across functions, sales and marketing has the most diverse and somewhat polarized levels of interest with strong “critical” as well as “not important” sentiment. We assume that at least some sentiment within sales and marketing is driven by the outside influence of management and that accountability to quotas colors attitudes toward planning.
Figure 10 - Importance of enterprise planning/ budgeting by function
0
0.5
1
1.5
2
2.5
3
3.5
4
4.5
5
0%
10%
20%
30%
40%
50%
60%
70%
80%
90%
100%
Finance Executivemanagement
InformationTechnology (IT)
Sales andMarketing
Importance of Enterprise Planning/Budgeting by Function
Critical
Very important
Important
Somewhat important
Not important
Mean
http://www.dresneradvisory.com Copyright 2015 – Dresner Advisory Services, LLC
25

2015 Wisdom of Crowds® Enterprise Planning Market Study
Across geographic regions, Latin American respondents assign the greatest importance to enterprise planning/budgeting (fig. 11). EMEA (traditionally characterized by long-term relationships and more conservative practices) ranks “critical” importance of planning well ahead of North American counterparts. Asia Pacific trails the mean and category overall. While we would expect variations on a country-by-country basis, importance across all geographic regions is well above 3.5, high to very high on weighted mean basis.
Figure 11 - Importance of enterprise planning/budgeting by geography
0
0.5
1
1.5
2
2.5
3
3.5
4
4.5
5
0%
10%
20%
30%
40%
50%
60%
70%
80%
90%
100%
Latin America Europe, MiddleEast, & Africa
North America Asia Pacific
Importance of Enterprise Planning/Budgeting by Geography
Critical
Very important
Important
Somewhat important
Not important
Mean
http://www.dresneradvisory.com Copyright 2015 – Dresner Advisory Services, LLC
26
2015 Wisdom of Crowds® Enterprise Planning Market Study
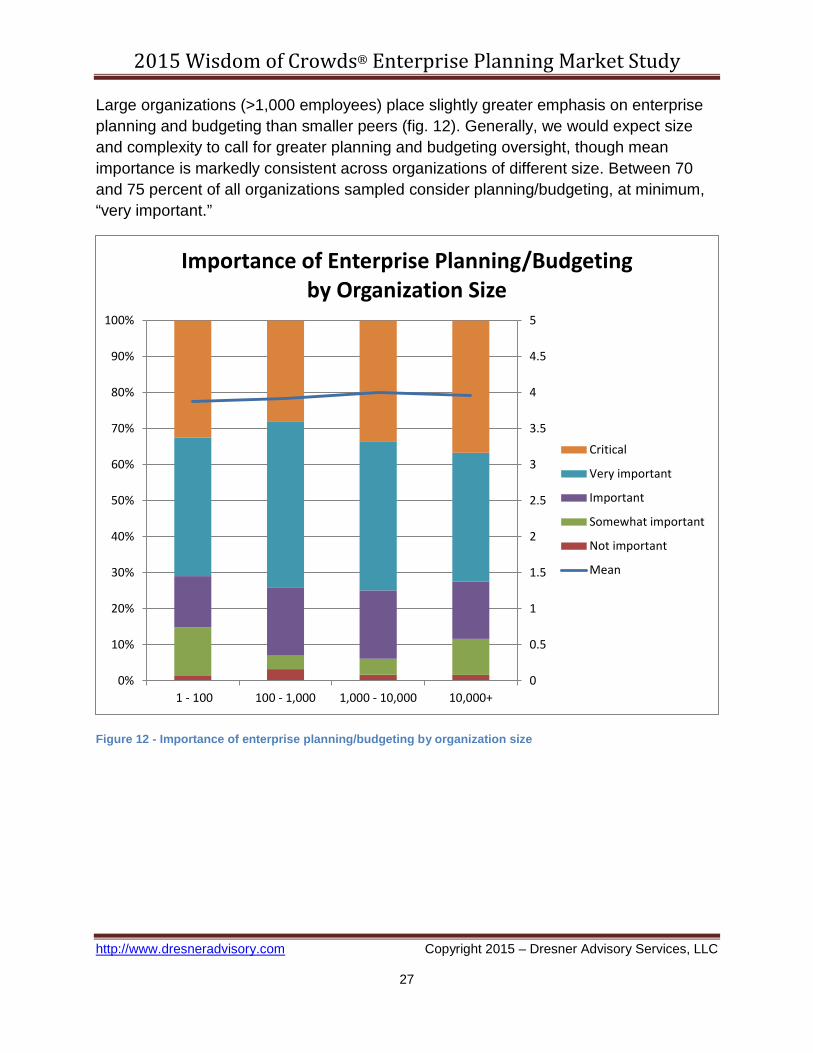
Large organizations (>1,000 employees) place slightly greater emphasis on enterprise planning and budgeting than smaller peers (fig. 12). Generally, we would expect size and complexity to call for greater planning and budgeting oversight, though mean importance is markedly consistent across organizations of different size. Between 70 and 75 percent of all organizations sampled consider planning/budgeting, at minimum, “very important.”
Figure 12 - Importance of enterprise planning/budgeting by organization size
0
0.5
1
1.5
2
2.5
3
3.5
4
4.5
5
0%
10%
20%
30%
40%
50%
60%
70%
80%
90%
100%
1 - 100 100 - 1,000 1,000 - 10,000 10,000+
Importance of Enterprise Planning/Budgeting by Organization Size
Critical
Very important
Important
Somewhat important
Not important
Mean
http://www.dresneradvisory.com Copyright 2015 – Dresner Advisory Services, LLC
27

2015 Wisdom of Crowds® Enterprise Planning Market Study
The perceived importance of enterprise planning/budgeting varies by industry; furthermore, industry rankings by importance are somewhat at odds with industry adoption rates. For example, financial services and transportation rank highly in current adoption (fig. 8, p. 22) but rank low in perceived importance (fig. 13 below). Likewise, the same charts show healthcare ranks low in adoption but applies the highest “critical” value to importance. One explanation for this discrepancy is that industries with entrenched planning/budgeting are more content by familiarity, and lesser penetrated industries are more likely to assign greater urgency due to gaps in planning and budgeting.
Figure 13 - Importance of enterprise planning/budgeting by selected vertical industry
0
0.5
1
1.5
2
2.5
3
3.5
4
4.5
5
0%
10%
20%
30%
40%
50%
60%
70%
80%
90%
100%
Importance of Enterprise Planning/Budgeting by Selected Vertical Industry
Critical
Very important
Important
Somewhat important
Not important
Mean
http://www.dresneradvisory.com Copyright 2015 – Dresner Advisory Services, LLC
28

2015 Wisdom of Crowds® Enterprise Planning Market Study
Functions Using Enterprise Planning Not surprisingly, finance, with its many cyclical reporting obligations, is the leading functional user of enterprise planning in organizations today with a 75 percent adoption rate (fig. 14). Operations, sensitive to continuity and business dynamics, is the second most frequent user at 45 percent, closely followed by sales at 44 percent, strategic planning (42 percent), IT (42 percent), and human resources (39 percent).
Figure 14 – Functions that use enterprise planning - today
0%
10%
20%
30%
40%
50%
60%
70%
80%
Functions That Use Enterprise Planning - Today
http://www.dresneradvisory.com Copyright 2015 – Dresner Advisory Services, LLC
29

2015 Wisdom of Crowds® Enterprise Planning Market Study
Figure 15 also measures the use of enterprise planning but by future plans only, with current users excluded. In this view, operations and sales have the highest 12-month adoption plans, followed by HR, marketing, strategic planning, and IT. Notably, more than 30 percent of organizations say they have “no plans” for sales or operations enterprise planning adoption. Supply chain, manufacturing, and R&D have comparatively lower future plans for new adoption and the highest levels of “no plans.”
Figure 15 - Functions that use enterprise planning – future plans
0% 10% 20% 30% 40% 50% 60% 70% 80% 90%
Finance
Operations
Sales
Strategic Planning Function
Information Technology (IT)
Human Resources
Marketing
Supply Chain
Manufacturing
Research and Development (R&D)
Functions That Use Enterprise Planning - Future Plans
Will use in 12 months Will use in 24 months No plans
http://www.dresneradvisory.com Copyright 2015 – Dresner Advisory Services, LLC
30

2015 Wisdom of Crowds® Enterprise Planning Market Study
Across all geographic regions, finance is again the most likely user of enterprise planning, though notably less so in Asia Pacific (fig. 16). Latin America reports the highest current sales and strategic planning use. In North America, operations, followed by IT, strategic planning, and sales are the next most likely users. EMEA has notably strong sales planning, IT, and HR components. Asia Pacific use trails all other geographies in all functions sampled.
Figure 16 - Functions that use enterprise planning by geography - today
0%
10%
20%
30%
40%
50%
60%
70%
80%
90%
Functions that Use Enterprise Planning by Geography - Today
North America Asia Pacific Latin America Europe, Middle East, & Africa
http://www.dresneradvisory.com Copyright 2015 – Dresner Advisory Services, LLC
31

2015 Wisdom of Crowds® Enterprise Planning Market Study
Figure 17 measures future functional use of enterprise planning across five roles with the current user base excluded. In this view, 12-month growth in EMEA and North America will be strongest in the areas of sales and operations. Twelve-month uptake of financial planning within operations will be strongest in Latin America and Asia Pacific. Latin America has the highest near-term adoption plans in all areas except IT, where Asia Pacific expects 25 percent growth.
Figure 17 - Functions that use enterprise planning by geography – future plans – part one
0%
5%
10%
15%
20%
25%
30%
35%
40%
Will
use
in 1
2 m
onth
s
Will
use
in 2
4 m
onth
s
No
plan
s
Will
use
in 1
2 m
onth
s
Will
use
in 2
4 m
onth
s
No
plan
s
Will
use
in 1
2 m
onth
s
Will
use
in 2
4 m
onth
s
No
plan
s
Will
use
in 1
2 m
onth
s
Will
use
in 2
4 m
onth
s
No
plan
s
Will
use
in 1
2 m
onth
s
Will
use
in 2
4 m
onth
s
No
plan
s
Finance Operations Sales Strategic PlanningFunction
InformationTechnology (IT)
Functions that Use Enterprise Planning by Geography - Future Plans - Part One
North America Asia Pacific Latin America Europe, Middle East, & Africa
http://www.dresneradvisory.com Copyright 2015 – Dresner Advisory Services, LLC
32

2015 Wisdom of Crowds® Enterprise Planning Market Study
Fig. 18 displays future plans for the five trailing areas of enterprise planning adoption excluding current users. Latin America (followed by Asia Pacific) again leads other regions in planned use of enterprise planning. North America and EMEA both plan less than 10 percent or have no future plans for all trailing categories in coming timeframes.
Figure 18 - Functions that use enterprise planning by geography – future plans – part two
0%10%20%30%40%50%60%70%80%90%
Will
use
in 1
2 m
onth
s
Will
use
in 2
4 m
onth
s
No
plan
s
Will
use
in 1
2 m
onth
s
Will
use
in 2
4 m
onth
s
No
plan
s
Will
use
in 1
2 m
onth
s
Will
use
in 2
4 m
onth
s
No
plan
s
Will
use
in 1
2 m
onth
s
Will
use
in 2
4 m
onth
s
No
plan
s
Will
use
in 1
2 m
onth
s
Will
use
in 2
4 m
onth
s
No
plan
s
Human Resources Marketing Supply Chain Manufacturing Research andDevelopment (R&D)
Functions that Use Enterprise Planning by Geography - Future Plans - Part Two
North America Asia Pacific Latin America Europe, Middle East, & Africa
http://www.dresneradvisory.com Copyright 2015 – Dresner Advisory Services, LLC
33
2015 Wisdom of Crowds® Enterprise Planning Market Study
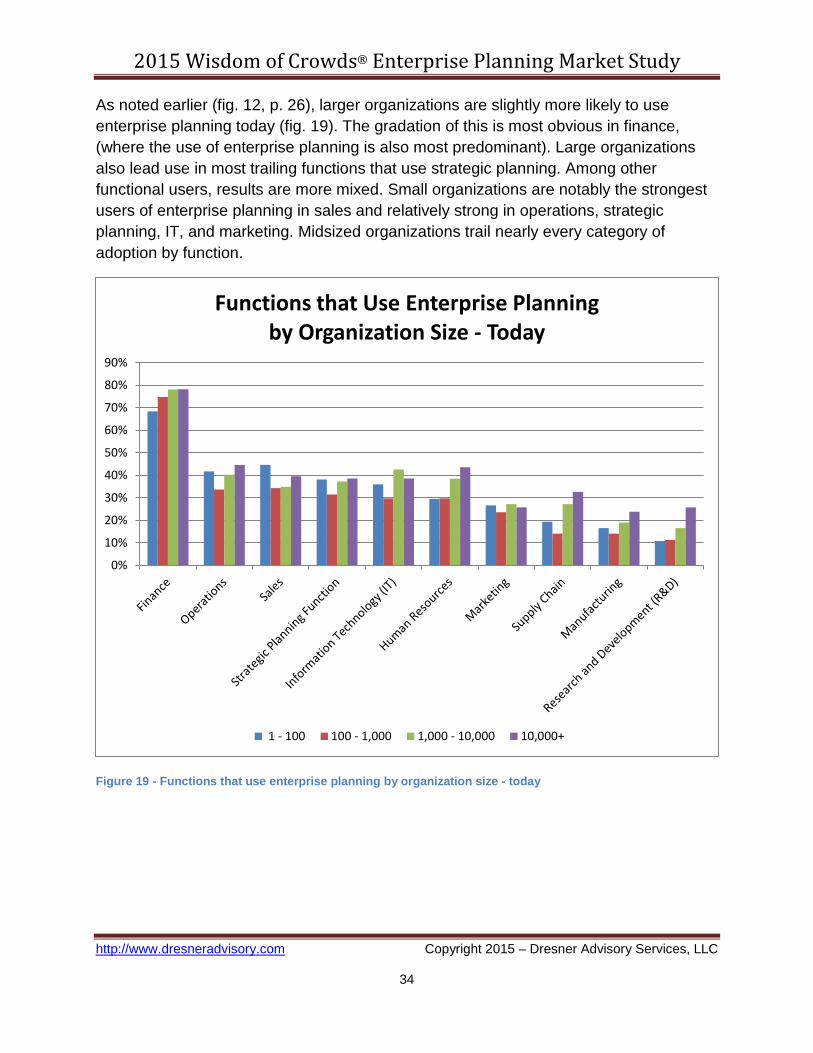
As noted earlier (fig. 12, p. 26), larger organizations are slightly more likely to use enterprise planning today (fig. 19). The gradation of this is most obvious in finance, (where the use of enterprise planning is also most predominant). Large organizations also lead use in most trailing functions that use strategic planning. Among other functional users, results are more mixed. Small organizations are notably the strongest users of enterprise planning in sales and relatively strong in operations, strategic planning, IT, and marketing. Midsized organizations trail nearly every category of adoption by function.
Figure 19 - Functions that use enterprise planning by organization size - today
0%
10%
20%
30%
40%
50%
60%
70%
80%
90%
Functions that Use Enterprise Planning by Organization Size - Today
1 - 100 100 - 1,000 1,000 - 10,000 10,000+
http://www.dresneradvisory.com Copyright 2015 – Dresner Advisory Services, LLC
34

2015 Wisdom of Crowds® Enterprise Planning Market Study
Fig. 20 displays future plans for the five leading functional users of enterprise planning adoption, by size of organization, excluding current users. Excluding finance (which is currently most penetrated) small, midsized, and large organizations uniformly expect between 10 and 15 percent 12-month growth in operations, sales and IT strategic planning use. Midsized and large organizations up to 10,000 employees are most likely to have no future plans for operations or sales planning components.
Figure 20 - Functions that use enterprise planning by organization size – future plans – part one
0%10%20%30%40%50%60%70%80%90%
Will
use
in 1
2 m
onth
s
Will
use
in 2
4 m
onth
s
No
plan
s
Will
use
in 1
2 m
onth
s
Will
use
in 2
4 m
onth
s
No
plan
s
Will
use
in 1
2 m
onth
s
Will
use
in 2
4 m
onth
s
No
plan
s
Will
use
in 1
2 m
onth
s
Will
use
in 2
4 m
onth
s
No
plan
s
Will
use
in 1
2 m
onth
s
Will
use
in 2
4 m
onth
s
No
plan
s
Finance Operations Sales Strategic PlanningFunction
InformationTechnology (IT)
Functions that Use Enterprise Planning by Organization Size - Future Plans - Part One
1 - 100 100 - 1,000 1,000 - 10,000 10,000+
http://www.dresneradvisory.com Copyright 2015 – Dresner Advisory Services, LLC
35
2015 Wisdom of Crowds® Enterprise Planning Market Study
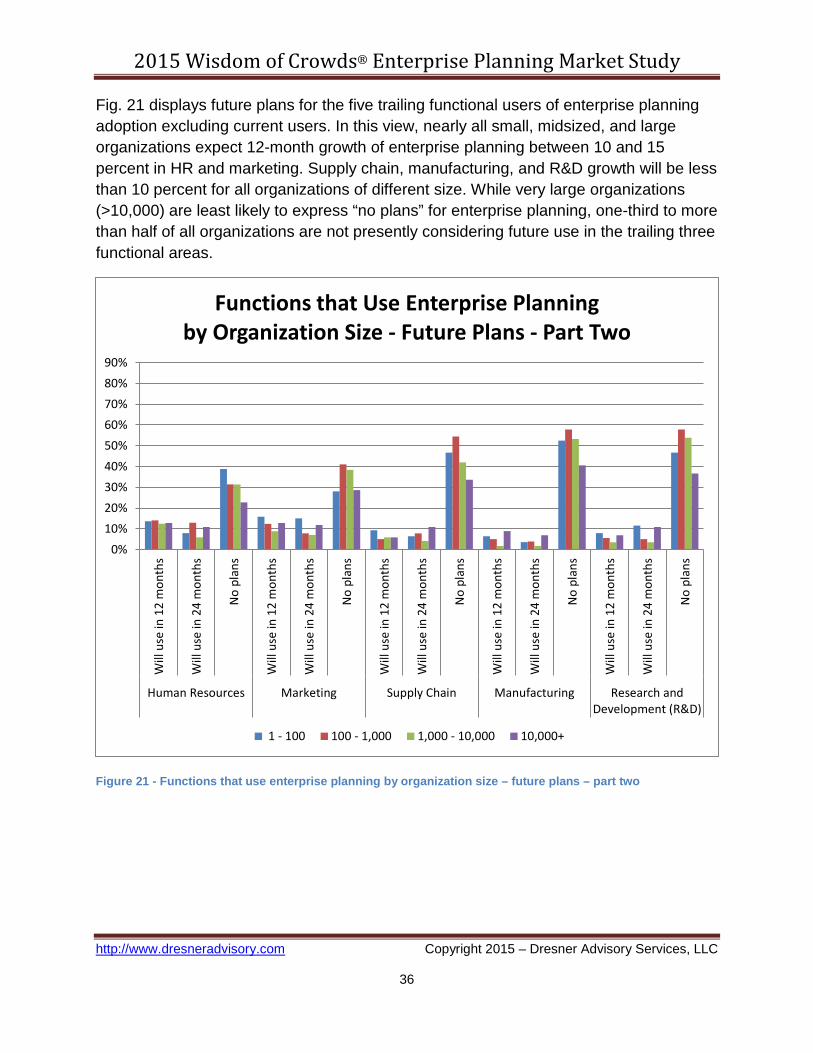
Fig. 21 displays future plans for the five trailing functional users of enterprise planning adoption excluding current users. In this view, nearly all small, midsized, and large organizations expect 12-month growth of enterprise planning between 10 and 15 percent in HR and marketing. Supply chain, manufacturing, and R&D growth will be less than 10 percent for all organizations of different size. While very large organizations (>10,000) are least likely to express “no plans” for enterprise planning, one-third to more than half of all organizations are not presently considering future use in the trailing three functional areas.
Figure 21 - Functions that use enterprise planning by organization size – future plans – part two
0%10%20%30%40%50%60%70%80%90%
Will
use
in 1
2 m
onth
s
Will
use
in 2
4 m
onth
s
No
plan
s
Will
use
in 1
2 m
onth
s
Will
use
in 2
4 m
onth
s
No
plan
s
Will
use
in 1
2 m
onth
s
Will
use
in 2
4 m
onth
s
No
plan
s
Will
use
in 1
2 m
onth
s
Will
use
in 2
4 m
onth
s
No
plan
s
Will
use
in 1
2 m
onth
s
Will
use
in 2
4 m
onth
s
No
plan
sHuman Resources Marketing Supply Chain Manufacturing Research and
Development (R&D)
Functions that Use Enterprise Planning by Organization Size - Future Plans - Part Two
1 - 100 100 - 1,000 1,000 - 10,000 10,000+
http://www.dresneradvisory.com Copyright 2015 – Dresner Advisory Services, LLC
36

2015 Wisdom of Crowds® Enterprise Planning Market Study
Across industries, the greatest number of enterprise planning users is again found in finance (fig. 22). In manufacturing, finance penetration is currently 84 percent; manufacturing also has the greatest number of users in sales, IT, and operations. Financial services reports the largest use by industry in human resources, operations, and marketing and also takes a strong IT presence. After finance, retail and wholesale report the most use, predictably in supply chain and sales. Education reports above-average HR, IT, and strategic planning use. Healthcare trails or is below average in all categories studied.
Figure 22 - Functions that use enterprise planning by industry – today
0%10%20%30%40%50%60%70%80%90%
Functions that Use Enterprise Planning by Industry - Today
Manufacturing Healthcare Financial services
Retail & wholesale Education (Higher Ed) Transportation
http://www.dresneradvisory.com Copyright 2015 – Dresner Advisory Services, LLC
37

2015 Wisdom of Crowds® Enterprise Planning Market Study
Fig. 23 displays future plans for five functional uses of enterprise planning across industries excluding current users. Retail and wholesale have the most aggressive 12-month adoption plans within finance, operations, and sales (all 20 percent or greater). Twenty percent of transportation respondents plan to extend finance and operations planning in the coming 12 months. A majority of respondents in both healthcare and education have no future plans for enterprise sales planning. About 15 percent of healthcare and retail and wholesale respondents see 12-month growth of enterprise planning for strategic planning and IT.
Figure 23 - Functions that use enterprise planning by industry – future plans – part one
0%10%20%30%40%50%60%70%80%90%
Will
use
in 1
2 m
onth
s
Will
use
in 2
4 m
onth
s
No
plan
s
Will
use
in 1
2 m
onth
s
Will
use
in 2
4 m
onth
s
No
plan
s
Will
use
in 1
2 m
onth
s
Will
use
in 2
4 m
onth
s
No
plan
s
Will
use
in 1
2 m
onth
s
Will
use
in 2
4 m
onth
s
No
plan
s
Will
use
in 1
2 m
onth
s
Will
use
in 2
4 m
onth
s
No
plan
sFinance Operations Sales Strategic Planning
FunctionInformation
Technology (IT)
Functions that Use Enterprise Planning by Industry - Future Plans - Part One
Manufacturing Healthcare Financial services
Retail & wholesale Education (Higher Ed) Transportation
http://www.dresneradvisory.com Copyright 2015 – Dresner Advisory Services, LLC
38

2015 Wisdom of Crowds® Enterprise Planning Market Study
Figure 24 displays future plans for the trailing five functional uses of enterprise planning across industries excluding current users. Notably, 30 percent of healthcare respondents expect to extend strategic planning to marketing in the coming 12 months. Retail and wholesale have above-average plans for greater use in marketing and supply chain. HR planning use will be extended by 10 to 15 percent in all measured industries except education.
Figure 24 - Functions that Use enterprise planning by industry – future plans – part two
0%10%20%30%40%50%60%70%80%90%
Will
use
in 1
2 m
onth
s
Will
use
in 2
4 m
onth
s
No
plan
s
Will
use
in 1
2 m
onth
s
Will
use
in 2
4 m
onth
s
No
plan
s
Will
use
in 1
2 m
onth
s
Will
use
in 2
4 m
onth
s
No
plan
s
Will
use
in 1
2 m
onth
s
Will
use
in 2
4 m
onth
s
No
plan
s
Will
use
in 1
2 m
onth
s
Will
use
in 2
4 m
onth
s
No
plan
s
Human Resources Marketing Supply Chain Manufacturing Research andDevelopment (R&D)
Functions that Use Enterprise Planning by Industry - Future Plans - Part Two
Manufacturing Healthcare Financial services
Retail & wholesale Education (Higher Ed) Transportation
http://www.dresneradvisory.com Copyright 2015 – Dresner Advisory Services, LLC
39

2015 Wisdom of Crowds® Enterprise Planning Market Study
Enterprise Planning Initiatives Despite much discussion and calls for more flexible and responsive budgeting models, annual financial budgets are solidly at the top of the list of enterprise planning initiatives in 2015 (fig. 25). Somewhat surprisingly, rolling forecasts are in second place, followed by cash flow forecasting, which is especially important to executive management. Strategic planning, revenue/demand planning and several more operational/departmental initiatives are considered, at minimum, very important to at least 50 to 60 percent or more of respondents. Modeling and statistical/analytic exercises are generally mid-tier or lower priorities in the scope of enterprise planning.
Figure 25 – Enterprise planning Initiatives
0% 20% 40% 60% 80% 100%
Annual financial budgets
Rolling forecasts (monthly, quarterly, etc.)
Cash-flow forecasting/planning
Strategic planning (3 to 5 years)
Revenue/demand planning
Linking strategic plans to annual budget
Headcount, salary, and compensation planning
Sales and operations planning
Bottom-up budgeting
Top-down planning
Balance sheet planning - financial instruments
Product or customer profitability analysis
Capital asset planning & budgeting
Project-based financial planning & budgeting
Optimize workforce plans and staffing to meet demand
Model and plan optimal sales territories & quotas
Transfer pricing analysis
Monte Carlo and other scenario analyses
Enterprise Planning Initiatives
Critical Very important Important Somewhat important Not important
http://www.dresneradvisory.com Copyright 2015 – Dresner Advisory Services, LLC
40
2015 Wisdom of Crowds® Enterprise Planning Market Study
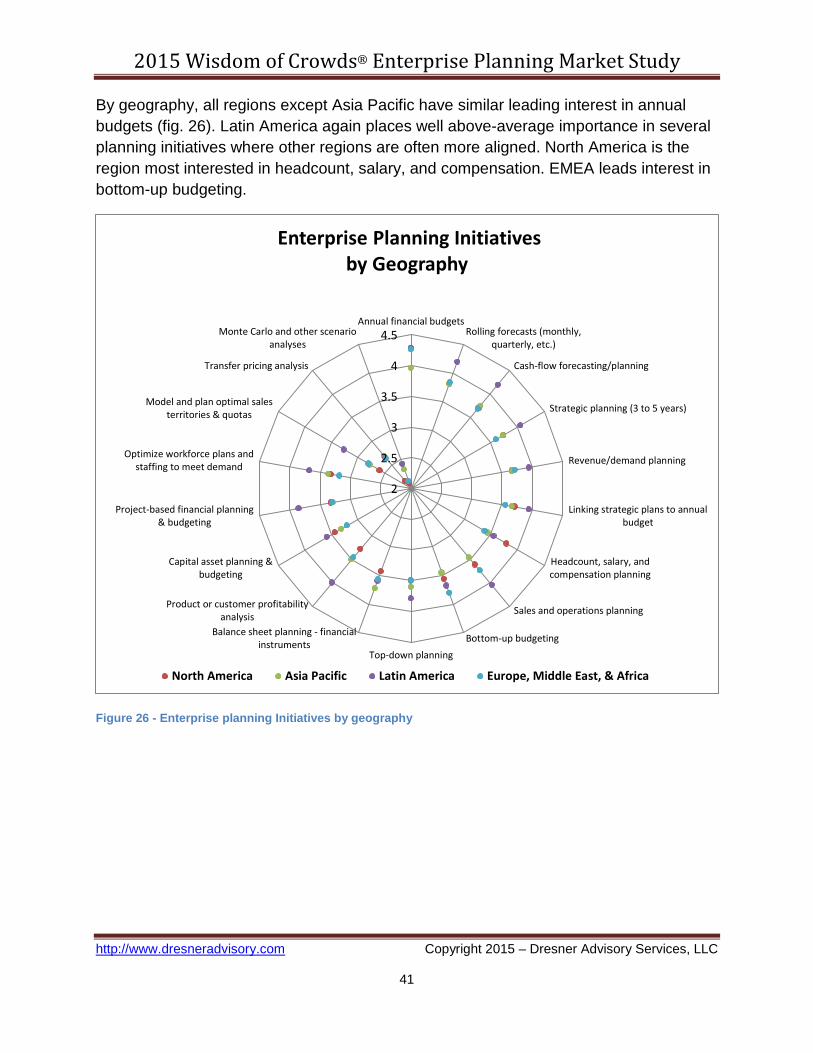
By geography, all regions except Asia Pacific have similar leading interest in annual budgets (fig. 26). Latin America again places well above-average importance in several planning initiatives where other regions are often more aligned. North America is the region most interested in headcount, salary, and compensation. EMEA leads interest in bottom-up budgeting.
Figure 26 - Enterprise planning Initiatives by geography
2
2.5
3
3.5
4
4.5Annual financial budgets
Rolling forecasts (monthly,quarterly, etc.)
Cash-flow forecasting/planning
Strategic planning (3 to 5 years)
Revenue/demand planning
Linking strategic plans to annualbudget
Headcount, salary, andcompensation planning
Sales and operations planning
Bottom-up budgetingTop-down planning
Balance sheet planning - financialinstruments
Product or customer profitabilityanalysis
Capital asset planning &budgeting
Project-based financial planning& budgeting
Optimize workforce plans andstaffing to meet demand
Model and plan optimal salesterritories & quotas
Transfer pricing analysis
Monte Carlo and other scenarioanalyses
Enterprise Planning Initiatives by Geography
North America Asia Pacific Latin America Europe, Middle East, & Africa
http://www.dresneradvisory.com Copyright 2015 – Dresner Advisory Services, LLC
41

2015 Wisdom of Crowds® Enterprise Planning Market Study
Interest in enterprise planning initiatives varies predictably by function (fig. 27). Finance has especially high interest in annual financial budgets, headcount/salary, revenue/demand planning, and bottom-up budgeting. Executive management unsurprisingly shows above-average interest in cash flow, linking strategic plans to budget, top-down planning, and product/customer profitability. Sales interest is strong in bespoke categories including sales planning, customer profitability, territories/quotas, and pricing analysis. Operations has the highest interest in project-based planning and workforce optimization. Balance sheet planning and project-based financial planning are predictably somewhat clustered as they are relevant to multiple functions.
Figure 27 - Enterprise planning Initiatives by function
11.5
22.5
33.5
44.5
5Annual financial budgets
Rolling forecasts (monthly,quarterly, etc.)
Cash-flow forecasting/planning
Strategic planning (3 to 5 years)
Revenue/demand planning
Linking strategic plans to annualbudget
Headcount, salary, andcompensation planning
Sales and operations planning
Bottom-up budgetingTop-down planning
Balance sheet planning -financial instruments
Product or customer profitabilityanalysis
Capital asset planning &budgeting
Project-based financial planning& budgeting
Optimize workforce plans andstaffing to meet demand
Model and plan optimal salesterritories & quotas
Transfer pricing analysis
Monte Carlo and other scenarioanalyses
Enterprise Planning Initiatives by Function
Sales and Marketing Executive management Information Technology (IT)
Finance Operations
http://www.dresneradvisory.com Copyright 2015 – Dresner Advisory Services, LLC
42

2015 Wisdom of Crowds® Enterprise Planning Market Study
Small, midsized, and large organizations all indicate uniformly high interest in annual financial budgets (fig. 28). Interest in rolling forecasts is likewise tightly clustered. Small organizations of 1-100 report significantly higher interest in (short term) cash flow forecasting/planning. Large organizations report the highest interest in strategic planning, revenue/demand planning, headcount, bottom-up and capital asset planning, as well as workforce optimization. Sales and operations planning are similarly important to organizations of different size.
Figure 28 – Enterprise planning Initiatives by organization size
1
1.5
2
2.5
3
3.5
4
4.5Annual financial budgets
Rolling forecasts (monthly,quarterly, etc.)
Cash-flow forecasting/planning
Strategic planning (3 to 5 years)
Revenue/demand planning
Linking strategic plans to annualbudget
Headcount, salary, andcompensation planning
Sales and operations planning
Bottom-up budgetingTop-down planning
Balance sheet planning -financial instruments
Product or customer profitabilityanalysis
Capital asset planning &budgeting
Project-based financial planning& budgeting
Optimize workforce plans andstaffing to meet demand
Model and plan optimal salesterritories & quotas
Transfer pricing analysis
Monte Carlo and other scenarioanalyses
Enterprise Planning Initiatives by Organization Size
1 - 100 100 - 1,000 1,000 - 10,000 10,000+
http://www.dresneradvisory.com Copyright 2015 – Dresner Advisory Services, LLC
43

2015 Wisdom of Crowds® Enterprise Planning Market Study
Enterprise planning initiatives vary noticeably by vertical industry (fig. 29). Retail and wholesale is a category leader in annual financial budgets, cash flow forecasting, headcount, and balance sheet planning. Healthcare shows notably higher-than-average interest in areas that include rolling forecasts, strategic planning, capital asset planning, project-based financial planning, and workforce optimization. Healthcare has lower-than-average interest in highly ranked areas that include annual budgets, cash flow forecasting, salary and compensation, sales planning, and customer profitability. Manufacturing has well above-average interest in revenue/demand planning, sales and operations planning, bottom up budgeting, and customer profitability analysis.
Figure 29 - Enterprise planning Initiatives by vertical industry
2.00
2.50
3.00
3.50
4.00
4.50Annual financial budgets
Rolling forecasts (monthly,quarterly, etc.)
Cash-flow forecasting/planning
Strategic planning (3 to 5 years)
Revenue/demand planning
Linking strategic plans to annualbudget
Headcount, salary, andcompensation planning
Sales and operations planning
Bottom-up budgetingTop-down planning
Balance sheet planning - financialinstruments
Product or customer profitabilityanalysis
Capital asset planning &budgeting
Project-based financial planning &budgeting
Optimize workforce plans andstaffing to meet demand
Model and plan optimal salesterritories & quotas
Transfer pricing analysis
Monte Carlo and other scenarioanalyses
Enterprise Planning Initiatives by Vertical Industry
Manufacturing Financial services Healthcare Retail & wholesale
http://www.dresneradvisory.com Copyright 2015 – Dresner Advisory Services, LLC
44

2015 Wisdom of Crowds® Enterprise Planning Market Study
Figure 30 depicts prioritized enterprise planning initiatives and the degree they are currently deployed or planned. While “adopted” initiatives reflect recent sentiment in initiatives deployed to date, future plans are more indicative of urgency and hot spots in new/planned use of enterprise planning. For example, more organizations plan rolling forecasts than have currently adopted them. 2015 plans (most likely to be budgeted and therefore most dependable) call for increased use of all six of the highest-prioritized initiatives as well as lesser priorities that include top-down planning, balance sheet budgeting, and more. Among plans pushed out to 2016, organizations plan especially for more sales operations, top down planning, and sales territory/quota planning. For the most part, planning beyond 2016 suggests lower-priority issues on the back burner.
Figure 30 - Enterprise planning Initiatives by adoption plans
2
2.5
3
3.5
4
4.5Annual financial budgets
Rolling forecasts (monthly,quarterly, etc.)
Cash-flow forecasting/planning
Strategic planning (3 to 5 years)
Revenue/demand planning
Linking strategic plans toannual budget
Headcount, salary, andcompensation planning
Sales and operations planning
Bottom-up budgeting
Top-down planning
Balance sheet planning -financial instruments
Product or customerprofitability analysis
Capital asset planning &budgeting
Project-based financialplanning & budgeting
Optimize workforce plans andstaffing to meet demand
Model and plan optimal salesterritories & quotas
Transfer pricing analysis
Monte Carlo and otherscenario analyses
Enterprise Planning Initiatives by Adoption Plans
Adopted In 2015 In 2016 Beyond 2016
http://www.dresneradvisory.com Copyright 2015 – Dresner Advisory Services, LLC
45

2015 Wisdom of Crowds® Enterprise Planning Market Study
Frequency of Enterprise Planning and Forecasting Figure 31 depicts the preferred organizational frequency of enterprise forecasting and planning/budgeting in a side-by-side comparative view. In this view we see that forecasting is most likely to be a monthly exercise, followed by quarterly. Planning and budgeting frequency is predominately annual, though more than 20 percent create monthly budgets, and another 20 percent revise quarterly. Despite the earlier emphasis noted on rolling forecasts, fewer than 10 percent of respondents create them. Weekly forecasts are in the 10 percent range while weekly budgets are only used by 6 percent of respondents. Less than 5 percent forecast or budget on a daily basis.
Figure 31 – Frequency of enterprise planning/budgeting and forecasting
0% 10% 20% 30% 40% 50% 60% 70% 80% 90% 100%
Forecasting
Planning/Budgeting
Frequency of Enterprise Planning/Budgeting and Forecasting
Daily Weekly Monthly Bi-annually Quarterly Annually Rolling basis
http://www.dresneradvisory.com Copyright 2015 – Dresner Advisory Services, LLC
46
2015 Wisdom of Crowds® Enterprise Planning Market Study
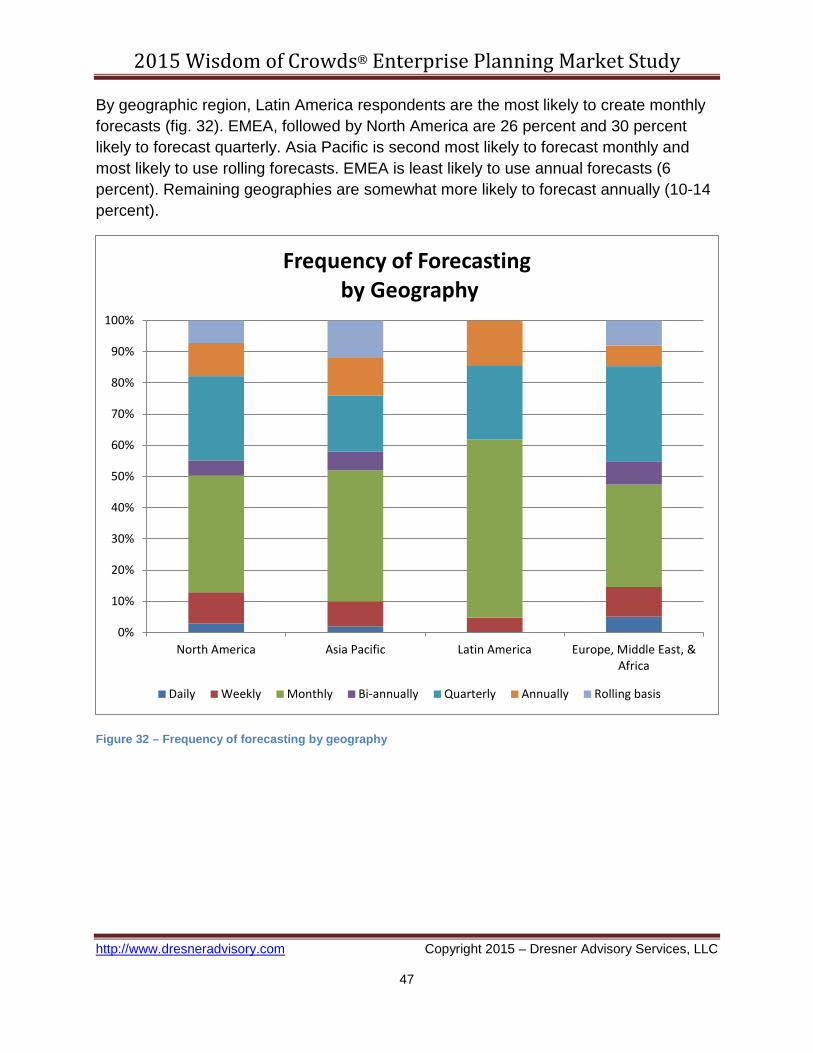
By geographic region, Latin America respondents are the most likely to create monthly forecasts (fig. 32). EMEA, followed by North America are 26 percent and 30 percent likely to forecast quarterly. Asia Pacific is second most likely to forecast monthly and most likely to use rolling forecasts. EMEA is least likely to use annual forecasts (6 percent). Remaining geographies are somewhat more likely to forecast annually (10-14 percent).
Figure 32 – Frequency of forecasting by geography
0%
10%
20%
30%
40%
50%
60%
70%
80%
90%
100%
North America Asia Pacific Latin America Europe, Middle East, &Africa
Frequency of Forecasting by Geography
Daily Weekly Monthly Bi-annually Quarterly Annually Rolling basis
http://www.dresneradvisory.com Copyright 2015 – Dresner Advisory Services, LLC
47

2015 Wisdom of Crowds® Enterprise Planning Market Study
Again by region, North America is the most prominent user of annual planning and budgets (fig. 33). Asia Pacific and Latin America are the greatest users of monthly budgets. Latin America and EMEA share a preference for relatively strong annual budget cycles. Quarterly budgets are slightly less frequent in North America than other regions and strongest again in Asia Pacific and Latin America.
Figure 33 - Frequency of enterprise planning/budgeting by geography
0%
10%
20%
30%
40%
50%
60%
70%
80%
90%
100%
North America Asia Pacific Latin America Europe, Middle East, &Africa
Frequency of Planning/Budgeting by Geography
Daily Weekly Monthly Bi-annually Quarterly Annually Rolling basis
http://www.dresneradvisory.com Copyright 2015 – Dresner Advisory Services, LLC
48
2015 Wisdom of Crowds® Enterprise Planning Market Study
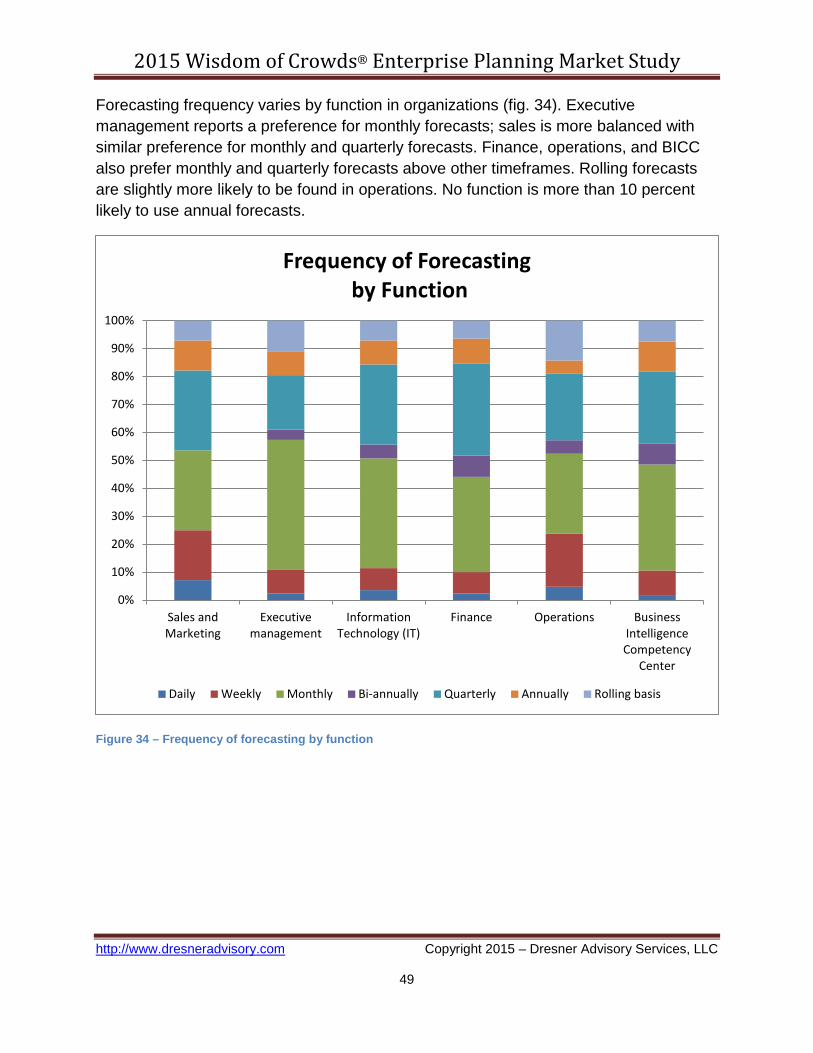
Forecasting frequency varies by function in organizations (fig. 34). Executive management reports a preference for monthly forecasts; sales is more balanced with similar preference for monthly and quarterly forecasts. Finance, operations, and BICC also prefer monthly and quarterly forecasts above other timeframes. Rolling forecasts are slightly more likely to be found in operations. No function is more than 10 percent likely to use annual forecasts.
Figure 34 – Frequency of forecasting by function
0%
10%
20%
30%
40%
50%
60%
70%
80%
90%
100%
Sales andMarketing
Executivemanagement
InformationTechnology (IT)
Finance Operations BusinessIntelligenceCompetency
Center
Frequency of Forecasting by Function
Daily Weekly Monthly Bi-annually Quarterly Annually Rolling basis
http://www.dresneradvisory.com Copyright 2015 – Dresner Advisory Services, LLC
49
2015 Wisdom of Crowds® Enterprise Planning Market Study
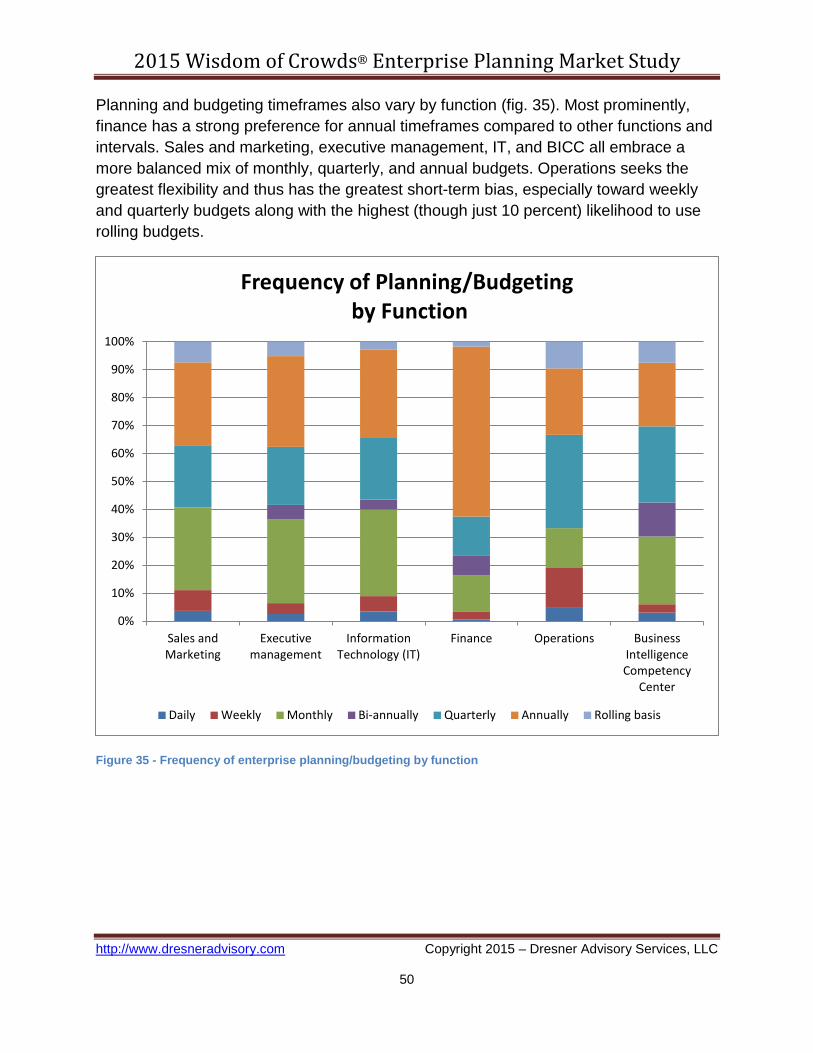
Planning and budgeting timeframes also vary by function (fig. 35). Most prominently, finance has a strong preference for annual timeframes compared to other functions and intervals. Sales and marketing, executive management, IT, and BICC all embrace a more balanced mix of monthly, quarterly, and annual budgets. Operations seeks the greatest flexibility and thus has the greatest short-term bias, especially toward weekly and quarterly budgets along with the highest (though just 10 percent) likelihood to use rolling budgets.
Figure 35 - Frequency of enterprise planning/budgeting by function
0%
10%
20%
30%
40%
50%
60%
70%
80%
90%
100%
Sales andMarketing
Executivemanagement
InformationTechnology (IT)
Finance Operations BusinessIntelligenceCompetency
Center
Frequency of Planning/Budgeting by Function
Daily Weekly Monthly Bi-annually Quarterly Annually Rolling basis
http://www.dresneradvisory.com Copyright 2015 – Dresner Advisory Services, LLC
50

2015 Wisdom of Crowds® Enterprise Planning Market Study
All organization sizes tend to rely mostly on a mix of monthly and quarterly forecasts (fig. 36). Very large organizations (>10,000) are the greatest users of monthly forecasts. Interestingly, the next largest quartile (1,000-10,000 employees) is least likely to forecast monthly and more likely to use quarterly forecasts. In the case of forecasting, daily, weekly, bi-annual, annual, and rolling intervals are infrequently used.
Figure 36 – Frequency of forecasting by organization size
0%
10%
20%
30%
40%
50%
60%
70%
80%
90%
100%
1 - 100 100 - 1,000 1,000 - 10,000 10,000+
Frequency of Forecasting by Organization Size
Daily Weekly Monthly Bi-annually Quarterly Annually Rolling basis
http://www.dresneradvisory.com Copyright 2015 – Dresner Advisory Services, LLC
51

2015 Wisdom of Crowds® Enterprise Planning Market Study
Small, midsized, and large organizations rely primarily on some mix of monthly, quarterly, and annual planning and budgeting (fig. 37). The two middle quartiles (100-1,000 and 1000-10,000) are considerably more likely than very small and very large peers to use annual budgets. Small organizations have the most balanced use of monthly, quarterly, and annual budgets. Very large organizations (>10,000) are more likely to balance monthly and annual budgets and are the greatest users of weekly planning.
Figure 37 - Frequency of enterprise planning/budgeting by organization size
0%
10%
20%
30%
40%
50%
60%
70%
80%
90%
100%
1 - 100 100 - 1,000 1,000 - 10,000 10,000+
Frequency of Planning/Budgeting by Organization Size
Daily Weekly Monthly Bi-annually Quarterly Annually Rolling basis
http://www.dresneradvisory.com Copyright 2015 – Dresner Advisory Services, LLC
52
2015 Wisdom of Crowds® Enterprise Planning Market Study
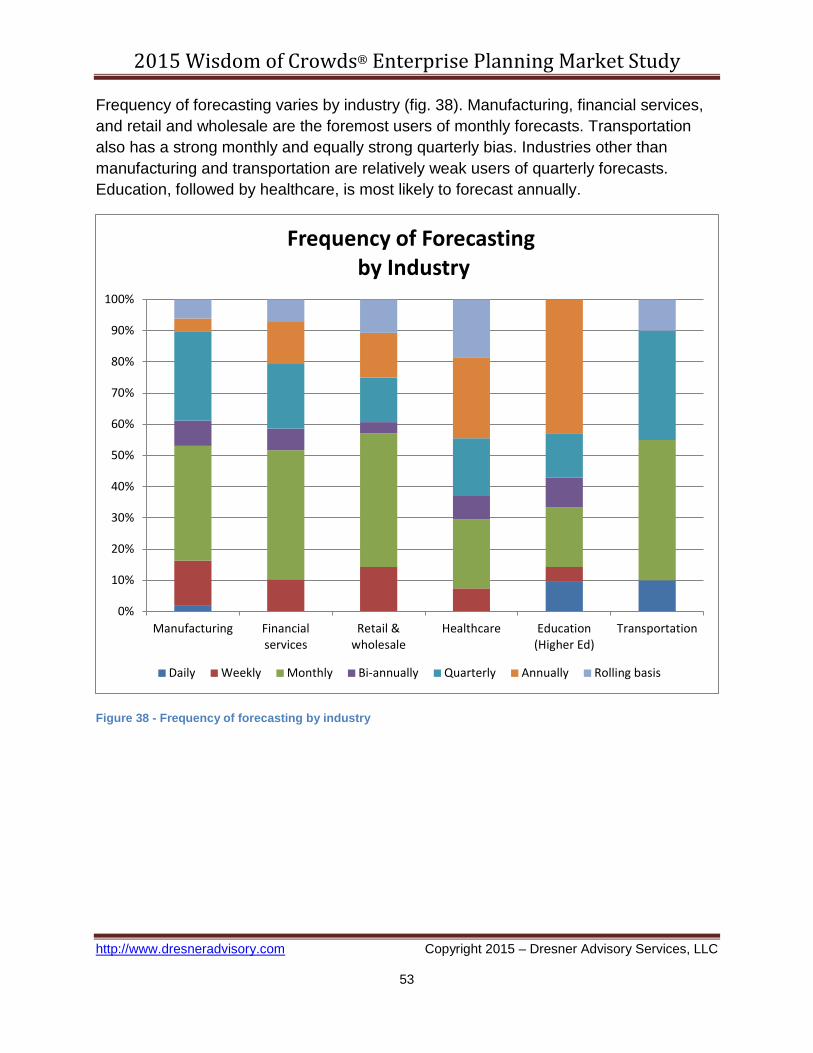
Frequency of forecasting varies by industry (fig. 38). Manufacturing, financial services, and retail and wholesale are the foremost users of monthly forecasts. Transportation also has a strong monthly and equally strong quarterly bias. Industries other than manufacturing and transportation are relatively weak users of quarterly forecasts. Education, followed by healthcare, is most likely to forecast annually.
Figure 38 - Frequency of forecasting by industry
0%
10%
20%
30%
40%
50%
60%
70%
80%
90%
100%
Manufacturing Financialservices
Retail &wholesale
Healthcare Education(Higher Ed)
Transportation
Frequency of Forecasting by Industry
Daily Weekly Monthly Bi-annually Quarterly Annually Rolling basis
http://www.dresneradvisory.com Copyright 2015 – Dresner Advisory Services, LLC
53
2015 Wisdom of Crowds® Enterprise Planning Market Study
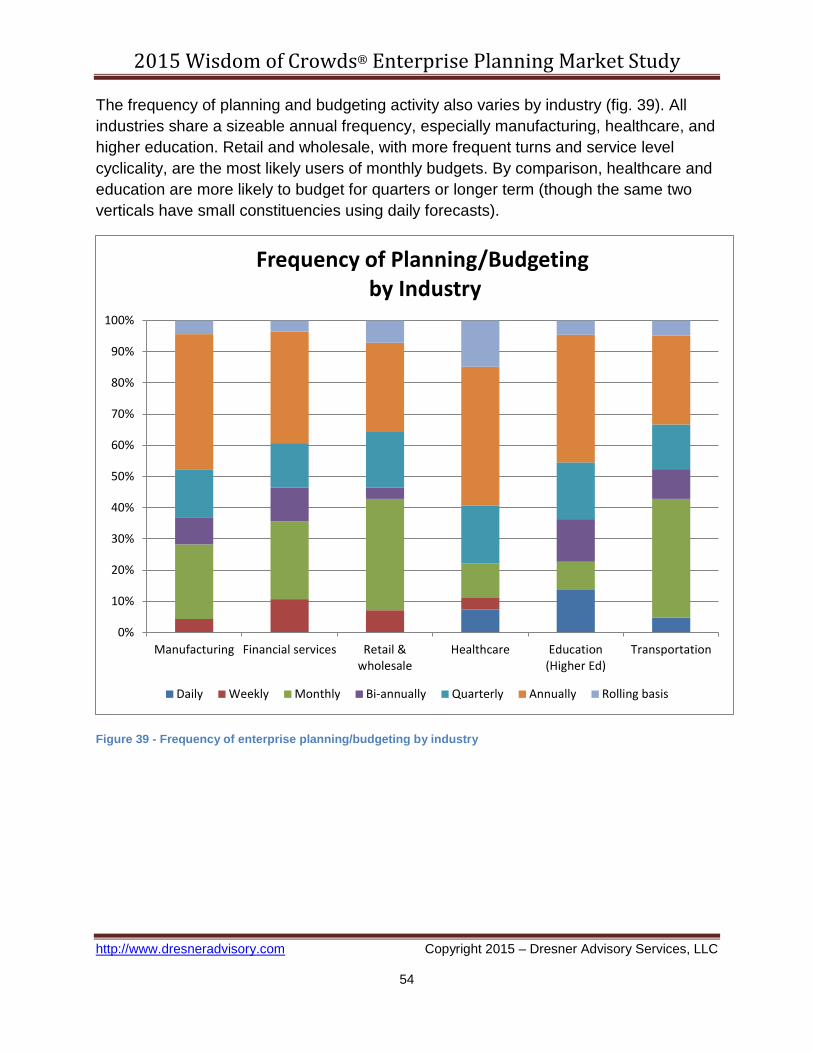
The frequency of planning and budgeting activity also varies by industry (fig. 39). All industries share a sizeable annual frequency, especially manufacturing, healthcare, and higher education. Retail and wholesale, with more frequent turns and service level cyclicality, are the most likely users of monthly budgets. By comparison, healthcare and education are more likely to budget for quarters or longer term (though the same two verticals have small constituencies using daily forecasts).
Figure 39 - Frequency of enterprise planning/budgeting by industry
0%
10%
20%
30%
40%
50%
60%
70%
80%
90%
100%
Manufacturing Financial services Retail &wholesale
Healthcare Education(Higher Ed)
Transportation
Frequency of Planning/Budgeting by Industry
Daily Weekly Monthly Bi-annually Quarterly Annually Rolling basis
http://www.dresneradvisory.com Copyright 2015 – Dresner Advisory Services, LLC
54

2015 Wisdom of Crowds® Enterprise Planning Market Study
Deployment Options for Enterprise Planning Organizations do not express a strong preference among deployment options for enterprise planning (fig. 40). The most popular model, on-premises deployment, is seen as critical by 23 percent of respondents and about half say on-premises is, at minimum, very important. All other models are, at minimum, important to between 40 and 60 percent of respondents. Though it trails somewhat, SaaS/cloud service is not a distant alternative to on-premises and is somewhat more preferable to hosted solutions. Interest in mobile reporting for enterprise planning is also noteworthy, resonating more so with externally focused roles (e.g., sales, executives).
Figure 40 – Deployment options for enterprise planning
0% 20% 40% 60% 80% 100%
On-premisess system
Mobile reporting
SaaS/cloud service
Unified CPM solution
Hosted solution
Mobile data entry
Modular CPM solution
Deployment Options for Enterprise Planning
Critical Very important Important Somewhat important Not important
http://www.dresneradvisory.com Copyright 2015 – Dresner Advisory Services, LLC
55

2015 Wisdom of Crowds® Enterprise Planning Market Study
By geography, North America reports less enthusiasm than other regions for nearly all deployment options for enterprise planning (fig. 41). The lone exception is in the area of SaaS/cloud systems, where EMEA trails North American (and Asia Pacific) interest. In fact, North American respondents are almost equally likely to embrace cloud as on-premises enterprise planning deployments. EMEA’s preference is clearly in the camp of on-premises systems and leads North America in most other deployment options. EMEA ranks both unified and modular CPM solutions ahead of cloud and more positively than other regions. Asia Pacific leads interest in mobile reporting and mobile data entry and reports above-average interest in cloud as well as on-premises.
Figure 41 - Deployment options for enterprise planning by geography
1
1.5
2
2.5
3
3.5
4
4.5
5
On-premisessystem
Mobile reporting SaaS/cloud service Unified CPMsolution
Hosted solution Mobile data entry Modular CPMsolution
Deployment Options for Enterprise Planning by Geography
North America Asia Pacific Europe, Middle East, & Africa Mean
http://www.dresneradvisory.com Copyright 2015 – Dresner Advisory Services, LLC
56

2015 Wisdom of Crowds® Enterprise Planning Market Study
Deployment preferences for enterprise planning vary noticeably by function (fig. 42). Perhaps most interesting, finance takes the weakest view of on-premises planning deployments and prefers SaaS/cloud deployment. Conversely, sales and marketing prefer on-premises to cloud deployment but also has above-average opinions of unified and modular CPM. Operations is the strongest advocate of on-premises deployment but has healthy interest in cloud and even more in hosted solutions. Executive management’s greatest interest is in mobile reporting followed by SaaS/cloud services. Management shares sales and marketing’s affinity for mobile data entry. IT expectedly has a distinct preference for on-premises over cloud deployment.
Figure 42 - Deployment options for enterprise planning by function
1
1.5
2
2.5
3
3.5
4
4.5
5
On-premisessystem
Mobile reporting SaaS/cloud service Unified CPMsolution
Hosted solution Mobile data entry Modular CPMsolution
Deployment Options for Enterprise Planning by Function
Sales and Marketing Executive management
Information Technology (IT) Finance
http://www.dresneradvisory.com Copyright 2015 – Dresner Advisory Services, LLC
57

2015 Wisdom of Crowds® Enterprise Planning Market Study
Small, midsized, and large organizations report different preferences for enterprise planning deployment options (fig. 43). Very large (>10,000) organizations have the highest regard for on-premises systems, though at 3.5 mean interest, this is not an exclusive preference. Very large organizations’ second-greatest interest is in mobile reporting followed by hosted solutions and mobile data entry. Small (1-100) organizations also prefer on-premises systems but have very substantial support for SaaS/cloud and hosted solutions. Small organizations are most likely to deploy mobile reporting and mobile data entry. Midsized (100-1,000) organizations are comparatively disinterested in cloud and hosted versus on-premises deployments.
Figure 43 - Deployment options for enterprise planning by organization size
1
1.5
2
2.5
3
3.5
4
On-premisesssystem
Mobile reporting SaaS/cloud service Unified CPMsolution
Hosted solution Mobile data entry Modular CPMsolution
Deployment Options for Enterprise Planning by Organization Size
1 - 100 100 - 1,000 1,000 - 10,000 10,000+ Mean
http://www.dresneradvisory.com Copyright 2015 – Dresner Advisory Services, LLC
58

2015 Wisdom of Crowds® Enterprise Planning Market Study
Deployment options for enterprise planning vary by vertical industry (fig. 44). Healthcare, with perhaps the greatest regulatory constraints of any industry, strongly prefers on-premises over cloud and hosted deployments and shows below-average interest in other areas. Financial services, also highly regulated, is about equally likely to choose an on-premises as a cloud deployment. Retail and wholesale has the second-greatest preference for on-premises deployment and has a slight preference for hosted over cloud deployment as second choice. Manufacturing is more likely to choose on-premises than cloud or hosted enterprise planning and has the strongest preference for a unified CPM solution.
Figure 44 - Deployment options for enterprise planning by vertical industry
1.00
1.50
2.00
2.50
3.00
3.50
4.00
4.50
5.00
On-premisess system Mobile reporting SaaS/cloud service Unified CPM solution Hosted solution
Deployment Options for Enterprise Planning by Vertical Industry
Manufacturing Financial services Retail & wholesale Healthcare Mean
http://www.dresneradvisory.com Copyright 2015 – Dresner Advisory Services, LLC
59

2015 Wisdom of Crowds® Enterprise Planning Market Study
Figure 45 compares adoption plans to the enterprise planning deployment options available. On-premises systems have high or the highest rankings for both current and planned adoption. However, we see that 12-month plans for SaaS/cloud deployment are slightly higher than similar plans for on-premises. This suggests that near term cloud momentum has overtaken on-premises, though the trend does not continue in 2016 and beyond. In 2016, mobile reporting, hosted solutions, and mobile data entry are all expected to see a boost in deployment. Both mobile topics also have momentum that will extend beyond 2016. Both unified (consolidated/statuary reporting/BI) and modular CPM deployments are expected to grow marginally in 2015 and 2016.
Figure 45 – Deployment options for enterprise planning by adoption plans
1
1.5
2
2.5
3
3.5
4
4.5
5
On-premisesssystem
Mobile reporting SaaS/cloud service Unified CPMsolution
Hosted solution Mobile data entry Modular CPMsolution
Deployment Options for Enterprise Planning by Adoption Plans
Adopted In 2015 In 2016 Beyond 2016 Mean
http://www.dresneradvisory.com Copyright 2015 – Dresner Advisory Services, LLC
60

2015 Wisdom of Crowds® Enterprise Planning Market Study
Industry and Vendor Analysis
http://www.dresneradvisory.com Copyright 2015 – Dresner Advisory Services, LLC
61

2015 Wisdom of Crowds® Enterprise Planning Market Study
Industry Capabilities
Industry – Strategic Planning Features For our study, we broke industry coverage into strategic, financial, and operational offerings from enterprise planning vendors (figs. 46-48). Figure 46 depicts strategic planning features currently available and planned for release through the vendor community studied. Current capabilities fully address most common feature requirements. All are covered by at least 80 percent of vendors until we reach mergers and acquisition analysis and Monte Carlo statistical simulations common to market-sensitive industries (i.e., energy, finance, and commodities trading).
Figure 46 – Industry – strategic planning features
0%
10%
20%
30%
40%
50%
60%
70%
80%
90%
100%
Industry - Strategic Planning Features
No plans
24 months
18 months
12 months
Today
http://www.dresneradvisory.com Copyright 2015 – Dresner Advisory Services, LLC
62

2015 Wisdom of Crowds® Enterprise Planning Market Study
Industry – Financial Planning Features Figure 47 depicts financial planning features currently available and planned for release through the vendor community studied. Here we see that feature offerings listed are currently available from 90 to 100 percent of vendors in all but a handful of cases. As with the previous chart, the graphic can serve as a feature key and checklist in the (mostly unlikely) event that a specific requirement (i.e., multi-language support) is lacking.
http://www.dresneradvisory.com Copyright 2015 – Dresner Advisory Services, LLC
63

2015 Wisdom of Crowds® Enterprise Planning Market Study
Figure 47 - Industry – financial planning features
0% 10% 20% 30% 40% 50% 60% 70% 80% 90% 100%
Allocations of revenue and costs based on fixed or dynamic variables
Automatic variance and exception reporting
Driver-based planning
Excel-based data entry
Export of budgets and plans to other systems and tools
Financial budgeting for revenues and expenses
Integration of historic data from GL and other source systems
Locking of submitted data and prevention of revisions unless authorized
Maintain an audit trail/log of all associated activity and changes
Multi-currency support
Rolling forecasts (e.g. weekly, monthly, quarterly, annual)
Textual annotations of input assumptions
Top-down planning
Automated forecasting based on historical data trends and patterns
Balance sheet planning & budgeting
Bottom-up budgeting
Breakback allocations across dimensions
Data validation at point of entry
Enable changes/revisions/modifications/approvals at various stages of the…
Support entry of unlimited levels of line-item detail
Users can enter financial and nonfinancial data in real time at summary…
Workflow for reviews and approvals, process status
Year-end projections and forecasting
Built-in financial intelligence (e.g. revenues, expenses, assets, liabilities,…
User-defined budgeting periodicity (e.g. daily, weekly, monthly, quarterly,…
Web data entry forms
Multi-language support
Pre-built asset and depreciation calculations
Support for financial eliminations and consolidations to meet GAAP and…
Task lists to guide casual users
Industry - Financial Planning Features
Today 12 months 18 months 24 months No plans
http://www.dresneradvisory.com Copyright 2015 – Dresner Advisory Services, LLC
64

2015 Wisdom of Crowds® Enterprise Planning Market Study
Industry – Operational Planning Features Figure 48 depicts operational planning features currently available and planned for release through the vendor community studied. All but two of the operational features in our key are currently supported by about 95 percent of the vendor community. Only workforce/staffing optimization and transfer pricing analysis are slightly below the 90 percent threshold and will be on par with other features in the coming 12 months.
Figure 48 - Industry – operational planning features
80%82%84%86%88%90%92%94%96%98%
100%
Industry - Operational Planning Features
No plans
24 months
18 months
12 months
Today
http://www.dresneradvisory.com Copyright 2015 – Dresner Advisory Services, LLC
65

2015 Wisdom of Crowds® Enterprise Planning Market Study
Industry – Architectural Features Figure 49 depicts architectural features currently available and planned for release through the vendor community studied. Here the feature sets are less fully penetrated across the vendor community but nonetheless represent considerable maturity. Most notable is the “no plans” documentation in the chart. In the area of cloud-specific deployment, for example, we see that 25 percent of the industry community has no plans for on-premises deployment. Likewise, 20 percent of vendors have no plans for modular suites of applications with multiple data repositories. Close to 20 percent will not offer hosted single-tenant enterprise planning. All of these constraints are directly relevant to the user preferences and deployment options discussed earlier in the study (pp. 54-59).
Figure 49 - Industry – architectural features
0%
10%
20%
30%
40%
50%
60%
70%
80%
90%
100%
Industry - Architectural Features
No plans
24 months
18 months
12 months
Today
http://www.dresneradvisory.com Copyright 2015 – Dresner Advisory Services, LLC
66
2015 Wisdom of Crowds® Enterprise Planning Market Study
Vendor Rankings
http://www.dresneradvisory.com Copyright 2015 – Dresner Advisory Services, LLC
67

2015 Wisdom of Crowds® Enterprise Planning Market Study
Vendor Rankings In this section we offer rankings of enterprise planning software vendors. We ranked vendors using 33 different criteria, on a five-point scale for each. Criteria covered sales /acquisition experience (8 criteria), value for price paid (1), quality and usefulness of product (12), quality of technical support (5), quality and value of consulting services (5), whether the vendor is recommended (1), and integrity (1). The result is a stacked ranking with an average score for all seven categories and an overall average score for each vendor.
As we explore vendor performance in more detail, it is important to understand the scale we used in scoring the industry and vendors:
• 5.0 = Excellent • 4.0 = Very good • 3.0 = Adequate • 2.0 = Poor • 1.0 = Very poor
Market segments include “Titans/ERP,” “Established Pure-Play,” and “Cloud.”
Within each segment, vendors have similar traits and, as a result, similar score-average ranges. So, while comparisons can (and no doubt will) be made between these sub-segment “peer groups,” they are not always reasonable comparisons.
Based on our scoring methodology, all vendors performed at a level that is considered more than “adequate” for all criteria categories.
Please note that “average score” is the mathematical mean of all items included in vendor ratings. Each column in the chart represents a scale consisting of varying numbers of items (for example, "sales" is a scale consisting of eight items, while "value for price paid” is one item). As such, each column is weighted differently (based upon the number of items represented and the number of respondents rating those items) in calculating the overall average rating. The average score cannot be calculated by simply averaging across the subscale scores.
http://www.dresneradvisory.com Copyright 2015 – Dresner Advisory Services, LLC
68

2015 Wisdom of Crowds® Enterprise Planning Market Study
Titan/ERP Enterprise Planning Vendors “Titans” (table 1) are the largest vendors with extensive product and service offerings—including enterprise planning. In all cases, these vendors have acquired planning vendors. Included in this category are Infor, IBM, Oracle, and SAP.
Table 1 –Titan/ERP Enterprise Planning Vendors—stacked rankings
Vendor Sales Value Product Support Consult Integrity Recommend Overall
Infor 4.14 3.96 3.96 4.19 4.20 4.54 4.69 4.24 IBM 3.95 4.07 3.67 3.91 4.08 4.15 4.20 4.00 Oracle 3.21 3.25 3.22 3.33 3.40 3.36 4.75 3.50 SAP 3.35 3.23 3.01 3.16 3.18 3.45 3.46 3.26
Large Established Pure-Play Enterprise Planning Vendors “Large Established Pure-Play” vendors (table 2) focus primarily upon planning software and services, have typically been in business for 15+ years, and have well-established customer bases and revenue streams. Several are publicly held. This category includes Prophix, Tagetik, and Centage (Budget Maestro).
Table 2 - Large Established Pure Play Enterprise Planning Vendors—stacked rankings
Vendor Sales Value Product Support Consult Integrity Recommend Overall
Prophix 4.51 4.12 4.27 4.29 4.33 4.65 5.00 4.45
Tagetik 4.20 4.18 3.88 4.27 4.20 4.43 4.80 4.28
Budget Maestro 3.94 3.62 3.51 4.04 4.02 4.05 4.40 3.94
Cloud Enterprise Planning Vendors “Cloud” Enterprise Planning vendors (table 3) offer a pure, native cloud product offering versus traditional enterprise software. This category includes Adaptive Insights, Anaplan, and Host Analytics.
Table 3 - Cloud Enterprise Planning Vendors—stacked rankings
Vendor Sales Value Product Support Consult Integrity Recommend Overall
Adaptive Insights 4.25 4.30 4.19 4.35 4.32 4.47 4.89 4.40 Anaplan 4.10 4.01 3.99 4.03 4.11 4.39 5.00 4.23 Host Analytics 4.02 3.63 3.71 3.64 3.64 4.04 4.67 3.94
After you review the stacked rankings of vendors, carefully examine the detailed, vendor-specific rankings for a more complete perspective and deeper understanding of individual vendors’ strengths and weaknesses.
http://www.dresneradvisory.com Copyright 2015 – Dresner Advisory Services, LLC
69

2015 Wisdom of Crowds® Enterprise Planning Market Study
Detailed Vendor Scores In this section, we offer detailed vendor scores. Using our 33-criteria evaluation model (table 4), we compare each vendor’s performance to its direct peer group and to the average for all vendors (all records in the study population).
The detailed criteria are below. We added “clock” position information to assist in locating specific scores.
Table 4 - Detailed vendor rating criteria
- Sales/acquisition experience (12 - 2 o’clock)
o Professionalism o Product knowledge o Understanding our
business/needs o Responsiveness o Flexibility/accommodation o Business practices o Contractual terms and
conditions o Follow-up after the sale
- Value for price (3 o’clock)
- Quality and usefulness of product
(3 - 7 o’clock) o Robustness/sophistication of
technology o Completeness of functionality o Reliability of technology o Scalability o Integration of components
within product o Integration with third-party
technologies o Overall usability o Ease of installation o Ease of administration
- Quality and usefulness of product (continued)
o Customization and extensibility
o Ease of upgrade/migration to new versions
o Online forums and documentation
- - Quality of technical support
(8 - 9 o’clock) o Professionalism o Product knowledge o Responsiveness o Continuity of personnel o Time to resolve problems
- Quality and value of consulting
services (9 - 10 o’clock) o Professionalism o Product knowledge o Experience o Continuity o Value
- Integrity (11 o’clock)
- Whether vendor is
recommended (12 o’clock)
http://www.dresneradvisory.com Copyright 2015 – Dresner Advisory Services, LLC
70

2015 Wisdom of Crowds® Enterprise Planning Market Study
Adaptive Insights Detailed Score
Figure 50 – Adaptive Insights detailed score
A member of the Cloud segment, Adaptive Insights is its leader. It is generally above peer and overall scores for most measures and is best in class for virtually all measures across sales, value, technology/product, technical support, consulting and integrity.
00.5
11.5
22.5
33.5
44.5
5Sales: Professionalism
Product knowledgeUnderstanding our…
ResponsivenessFlexibility/accommod…
Business practices
Contractual terms…
Follow up after the sale
Value
Product:Robustness/s…
Completeness of…
Reliability of…
Scalability
Integration of…Integration with third…
Overall usabilityEase of installationEase of administrationCustomization and…Ease of…
Online training,…
Support:Professionali…
Product knowledge
Responsiveness
Continuity of personnel
Time to resolve…
Consult:Professionalism
Product knowledge
Experience
ContinuityValue
IntegrityRecommend
Adaptive Insights Performance
Peer Overall Adaptive Insights
http://www.dresneradvisory.com Copyright 2015 – Dresner Advisory Services, LLC
71

2015 Wisdom of Crowds® Enterprise Planning Market Study
Anaplan Detailed Score
Figure 51 - Anaplan detailed score
A member of the Cloud market segment, Anaplan is generally in line with or above peer and overall averages. It is best in class for sales flexibility/accommodation, follow-up after the sale, product ease of installation, and customization and extensibility. It has a perfect recommend score.
00.5
11.5
22.5
33.5
44.5
5Sales: Professionalism
Product knowledgeUnderstanding our…
Responsiveness
Flexibility/accommod…
Business practices
Contractual terms…
Follow up after the sale
Value
Product:Robustness/s…
Completeness of…
Reliability of…
Scalability
Integration of…Integration with third…
Overall usabilityEase of installationEase of administrationCustomization and…Ease of…
Online training,…
Support:Professionali…
Product knowledge
Responsiveness
Continuity of personnel
Time to resolve…
Consult:Professionalis…
Product knowledge
Experience
Continuity
ValueIntegrity
Recommend
Anaplan Performance
Peer Overall Anaplan
http://www.dresneradvisory.com Copyright 2015 – Dresner Advisory Services, LLC
72

2015 Wisdom of Crowds® Enterprise Planning Market Study
Budget Maestro (Centage) Detailed Score
Figure 52 – Budget Maestro (Centage) detailed score
Budget Maestro (Centage) is a member of the Large Established Pure-Play market segment. Its scores are generally below peer and overall averages for most measures.
00.5
11.5
22.5
33.5
44.5
5Sales: Professionalism
Product knowledgeUnderstanding our…
Responsiveness
Flexibility/accommodati…
Business practices
Contractual terms and…
Follow up after the sale
Value
Product:Robustness/so…
Completeness of…
Reliability of technology
Scalability
Integration of…Integration with third…
Overall usabilityEase of installationEase of administrationCustomization and…Ease of…
Online training, forums…
Support:Professionalism
Product knowledge
Responsiveness
Continuity of personnel
Time to resolve problems
Consult:Professionalism
Product knowledge
Experience
Continuity
ValueIntegrity
Recommend
Budget Maestro Performance
Peer Overall Budget
http://www.dresneradvisory.com Copyright 2015 – Dresner Advisory Services, LLC
73

2015 Wisdom of Crowds® Enterprise Planning Market Study
Host Analytics Detailed Score
Figure 53 – Host Analytics detailed score
A member of the Cloud market segment, Host Analytics’ scores are generally below peer and overall averages for most measures.
00.5
11.5
22.5
33.5
44.5
5Sales: Professionalism
Product knowledgeUnderstanding our…
Responsiveness
Flexibility/accommodati…
Business practices
Contractual terms and…
Follow up after the sale
Value
Product:Robustness/sop…
Completeness of…
Reliability of technology
Scalability
Integration of…Integration with third…
Overall usabilityEase of installationEase of administrationCustomization and…Ease of…
Online training, forums…
Support:Professionalism
Product knowledge
Responsiveness
Continuity of personnel
Time to resolve problems
Consult:Professionalism
Product knowledge
Experience
Continuity
ValueIntegrity
Recommend
Host Analytics Performance
Peer Overall Host Analytics
http://www.dresneradvisory.com Copyright 2015 – Dresner Advisory Services, LLC
74

2015 Wisdom of Crowds® Enterprise Planning Market Study
IBM Detailed Score
Figure 54 - IBM detailed score
A member of the Titan/ERP segment, IBM’s scores are generally above peer and in line with or below overall averages for most measures. It is best in class for value and product ease of installation.
00.5
11.5
22.5
33.5
44.5
5Sales: Professionalism
Product knowledgeUnderstanding our…
Responsiveness
Flexibility/accommodation
Business practices
Contractual terms and…
Follow up after the sale
Value
Product:Robustness/sop…
Completeness of…
Reliability of technology
Scalability
Integration of…Integration with third…
Overall usabilityEase of installationEase of administrationCustomization and…Ease of…
Online training, forums…
Support:Professionalism
Product knowledge
Responsiveness
Continuity of personnel
Time to resolve problems
Consult:Professionalism
Product knowledge
Experience
Continuity
ValueIntegrity
Recommend
IBM Performance
Peer Overall IBM
http://www.dresneradvisory.com Copyright 2015 – Dresner Advisory Services, LLC
75

2015 Wisdom of Crowds® Enterprise Planning Market Study
Infor Detailed Score
Figure 55 - Infor detailed score
A member of the Titan/ERP market segment, Infor is its leader. It is best in class for virtually all measures across sales, value, technology/product, technical support, consulting, integrity, and recommend.
00.5
11.5
22.5
33.5
44.5
5Sales: Professionalism
Product knowledgeUnderstanding our…
Responsiveness
Flexibility/accommodati…
Business practices
Contractual terms and…
Follow up after the sale
Value
Product:Robustness/so…
Completeness of…
Reliability of technology
Scalability
Integration of…Integration with third…
Overall usabilityEase of installationEase of administrationCustomization and…Ease of…
Online training, forums…
Support:Professionalism
Product knowledge
Responsiveness
Continuity of personnel
Time to resolve problems
Consult:Professionalism
Product knowledge
Experience
Continuity
ValueIntegrity
Recommend
Infor Performance
Peer Overall Infor
http://www.dresneradvisory.com Copyright 2015 – Dresner Advisory Services, LLC
76
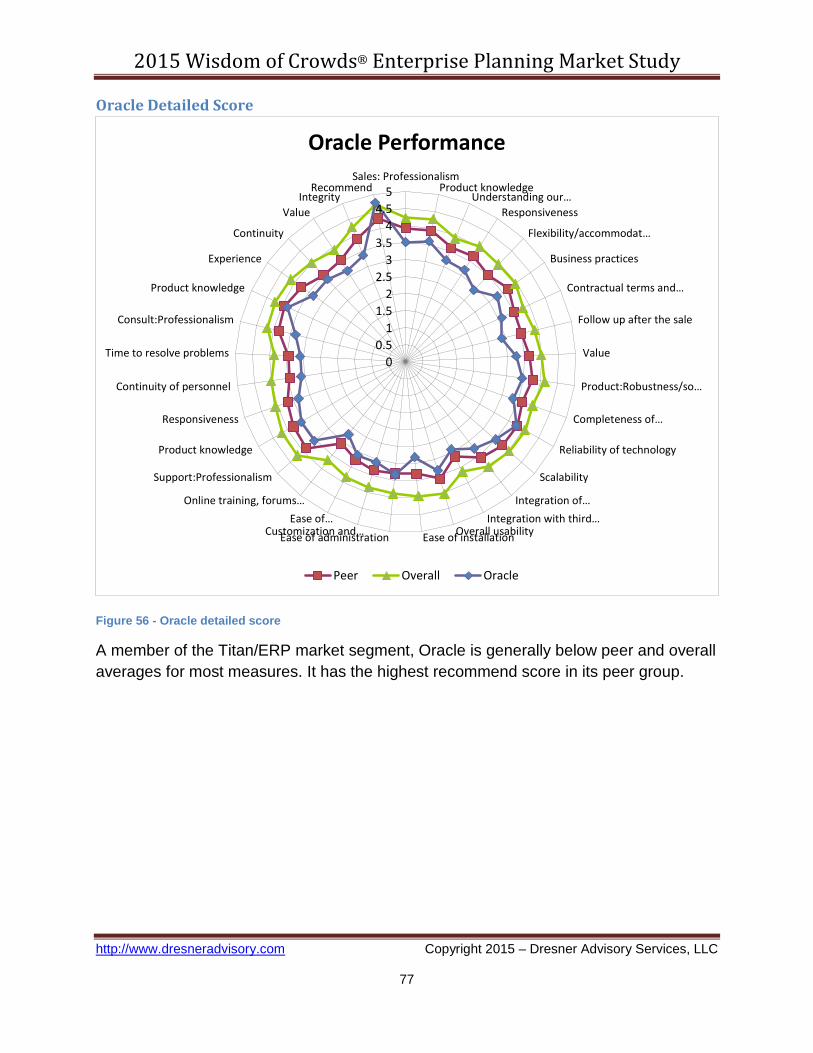
2015 Wisdom of Crowds® Enterprise Planning Market Study
Oracle Detailed Score
Figure 56 - Oracle detailed score
A member of the Titan/ERP market segment, Oracle is generally below peer and overall averages for most measures. It has the highest recommend score in its peer group.
00.5
11.5
22.5
33.5
44.5
5Sales: Professionalism
Product knowledgeUnderstanding our…
Responsiveness
Flexibility/accommodat…
Business practices
Contractual terms and…
Follow up after the sale
Value
Product:Robustness/so…
Completeness of…
Reliability of technology
Scalability
Integration of…Integration with third…
Overall usabilityEase of installationEase of administrationCustomization and…Ease of…
Online training, forums…
Support:Professionalism
Product knowledge
Responsiveness
Continuity of personnel
Time to resolve problems
Consult:Professionalism
Product knowledge
Experience
Continuity
ValueIntegrity
Recommend
Oracle Performance
Peer Overall Oracle
http://www.dresneradvisory.com Copyright 2015 – Dresner Advisory Services, LLC
77

2015 Wisdom of Crowds® Enterprise Planning Market Study
Prophix Detailed Score
Figure 57 - Prophix detailed score
A member of the Large Established Pure-Play market segment, Prophix is its leader. It scored above peer and overall averages and is best in class for virtually all measures across sales, value, technology/product, technical support, consulting services, and integrity. It has a perfect recommend score.
00.5
11.5
22.5
33.5
44.5
5Sales: Professionalism
Product knowledgeUnderstanding our…
Responsiveness
Flexibility/accommodati…
Business practices
Contractual terms and…
Follow up after the sale
Value
Product:Robustness/so…
Completeness of…
Reliability of technology
Scalability
Integration of…Integration with third…
Overall usabilityEase of installationEase of administrationCustomization and…Ease of…
Online training, forums…
Support:Professionalism
Product knowledge
Responsiveness
Continuity of personnel
Time to resolve problems
Consult:Professionalism
Product knowledge
Experience
Continuity
ValueIntegrity
Recommend
Prophix Performance
Peer Overall Prophix
http://www.dresneradvisory.com Copyright 2015 – Dresner Advisory Services, LLC
78

2015 Wisdom of Crowds® Enterprise Planning Market Study
SAP Detailed Score
Figure 58 - SAP detailed score
A member of the Titan/ERP segment, SAP’s scores are generally below peer and overall averages for most measures.
00.5
11.5
22.5
33.5
44.5
5Sales: Professionalism
Product knowledgeUnderstanding our…
Responsiveness
Flexibility/accommodation
Business practices
Contractual terms and…
Follow up after the sale
Value
Product:Robustness/sop…
Completeness of…
Reliability of technology
Scalability
Integration of…Integration with third…
Overall usabilityEase of installationEase of administrationCustomization and…Ease of…
Online training, forums…
Support:Professionalism
Product knowledge
Responsiveness
Continuity of personnel
Time to resolve problems
Consult:Professionalism
Product knowledge
Experience
Continuity
ValueIntegrity
Recommend
SAP Performance
Peer Overall SAP
http://www.dresneradvisory.com Copyright 2015 – Dresner Advisory Services, LLC
79

2015 Wisdom of Crowds® Enterprise Planning Market Study
Tagetik Detailed Score
Figure 59 - Tagetik detailed score
A member of the Large Established Pure-Play segment, Tagetik is generally in line with or above peer averages and above overall averages. It is best in class for value, support product knowledge, support continuity of personnel, and consulting product knowledge.
00.5
11.5
22.5
33.5
44.5
5Sales: Professionalism
Product knowledgeUnderstanding our…
Responsiveness
Flexibility/accommo…
Business practices
Contractual terms…
Follow up after the…
Value
Product:Robustness/…
Completeness of…
Reliability of…
Scalability
Integration of…Integration with…
Overall usabilityEase of installationEase of administrationCustomization and…Ease of…
Online training,…
Support:Professional…
Product knowledge
Responsiveness
Continuity of…
Time to resolve…
Consult:Professionali…
Product knowledge
Experience
Continuity
ValueIntegrity
Recommend
Tagetik Performance
Peer Overall Tagetik
http://www.dresneradvisory.com Copyright 2015 – Dresner Advisory Services, LLC
80

2015 Wisdom of Crowds® Enterprise Planning Market Study
Additional Enterprise Planning Market Models
For 2015 we developed two new models for examining and understanding the enterprise planning market. Using quadrants, we plotted aggregated user sentiment into x and y axes.
Customer Experience Model The customer experience model considers the real-world experience of customers working with planning products on a daily basis (fig. 101). For the x axis, we combined all vendor touch points–including the sales and acquisition process (8 measures), technical support (5 measures), and consulting services (5 measures)–into a single “sales and service” dimension. On the y axis, we plotted customer sentiment surrounding product, derived from the 12 product and technology measures used to rank vendors. On the resulting four quadrants we plotted vendors based on these measures.
The upper-right quadrant contains the highest-scoring vendors and is named “Overall Experience Leaders.” Due to the tight clustering of vendors, a key identifying them is located on the bottom of page 128. Technology leaders (upper-left quadrant) identifies vendors with strong product offerings but relatively lower services scores. Contenders (lower-left quadrant) would benefit from varying degrees of improvement to product, services, or both.
User sentiment surrounding outliers (outside of the four quadrants) suggests that significant improvements are required to product and services.
http://www.dresneradvisory.com Copyright 2015 – Dresner Advisory Services, LLC
81

2015 Wisdom of Crowds® Enterprise Planning Market Study
Figure 60 - Customer experience model
http://www.dresneradvisory.com Copyright 2015 – Dresner Advisory Services, LLC
82

2015 Wisdom of Crowds® Enterprise Planning Market Study
Vendor Credibility Model The vendor credibility model considers how customers “feel” about their vendor (fig. 102). The x axis plots perceived value for the price paid. The y axis combines the integrity and recommend measures, creating a “confidence” dimension. The resulting four quadrants position vendors based on these dimensions.
The upper-right quadrant contains the highest-scoring vendors and is named “Credibility Leaders.” Due to the tight clustering of vendors, a key identifying them is located on the bottom of page 130. Value Leaders (upper-left quadrant) identifies vendors with solid perceived value but relatively lower confidence scores. Contenders (lower-left quadrant) would benefit by working to improve customer value, confidence, or both.
User sentiment surrounding outliers (outside of the four quadrants) suggests that significant improvements are required to improve perceived value and confidence.
http://www.dresneradvisory.com Copyright 2015 – Dresner Advisory Services, LLC
83
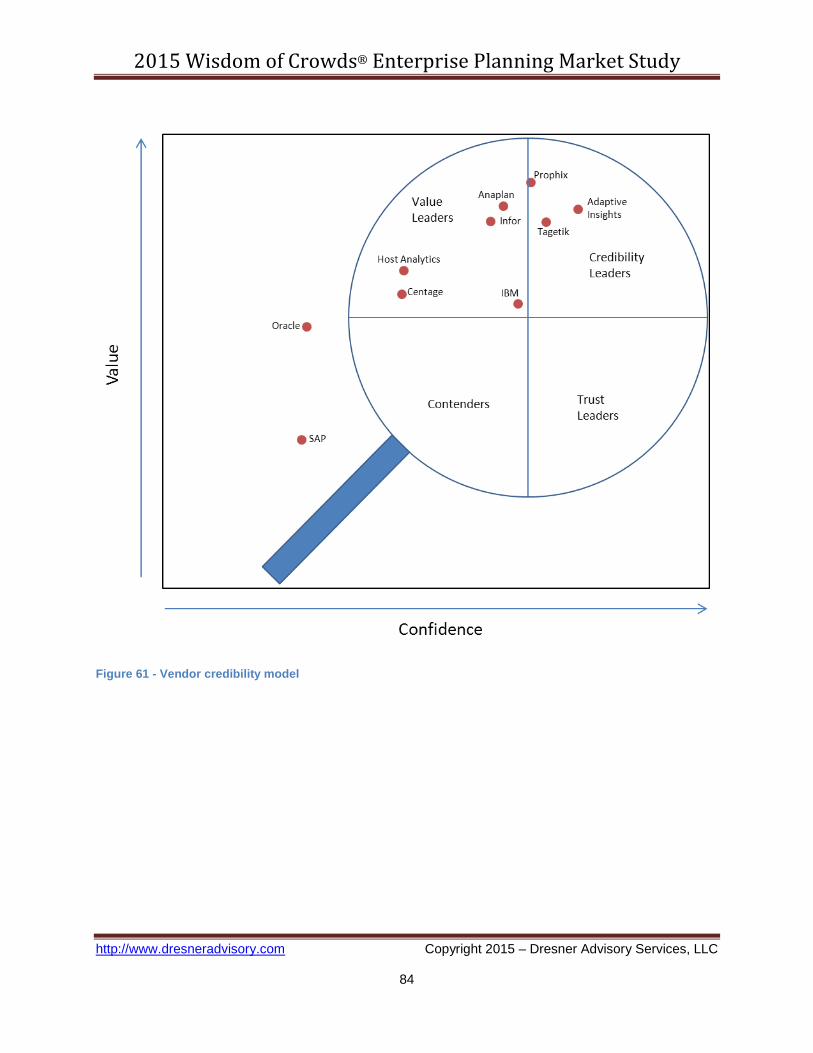
2015 Wisdom of Crowds® Enterprise Planning Market Study
Figure 61 - Vendor credibility model
http://www.dresneradvisory.com Copyright 2015 – Dresner Advisory Services, LLC
84

2015 Wisdom of Crowds® Enterprise Planning Market Study
Appendix - The 2015 Wisdom of Crowds® Enterprise Planning Market Survey Instrument
http://www.dresneradvisory.com Copyright 2015 – Dresner Advisory Services, LLC
85

2015 Wisdom of Crowds® Enterprise Planning Market Study
http://www.dresneradvisory.com Copyright 2015 – Dresner Advisory Services, LLC
86

2015 Wisdom of Crowds® Enterprise Planning Market Study
http://www.dresneradvisory.com Copyright 2015 – Dresner Advisory Services, LLC
87

2015 Wisdom of Crowds® Enterprise Planning Market Study
http://www.dresneradvisory.com Copyright 2015 – Dresner Advisory Services, LLC
88

2015 Wisdom of Crowds® Enterprise Planning Market Study
http://www.dresneradvisory.com Copyright 2015 – Dresner Advisory Services, LLC
89

2015 Wisdom of Crowds® Enterprise Planning Market Study
http://www.dresneradvisory.com Copyright 2015 – Dresner Advisory Services, LLC
90

2015 Wisdom of Crowds® Enterprise Planning Market Study
http://www.dresneradvisory.com Copyright 2015 – Dresner Advisory Services, LLC
91

2015 Wisdom of Crowds® Enterprise Planning Market Study
http://www.dresneradvisory.com Copyright 2015 – Dresner Advisory Services, LLC
92
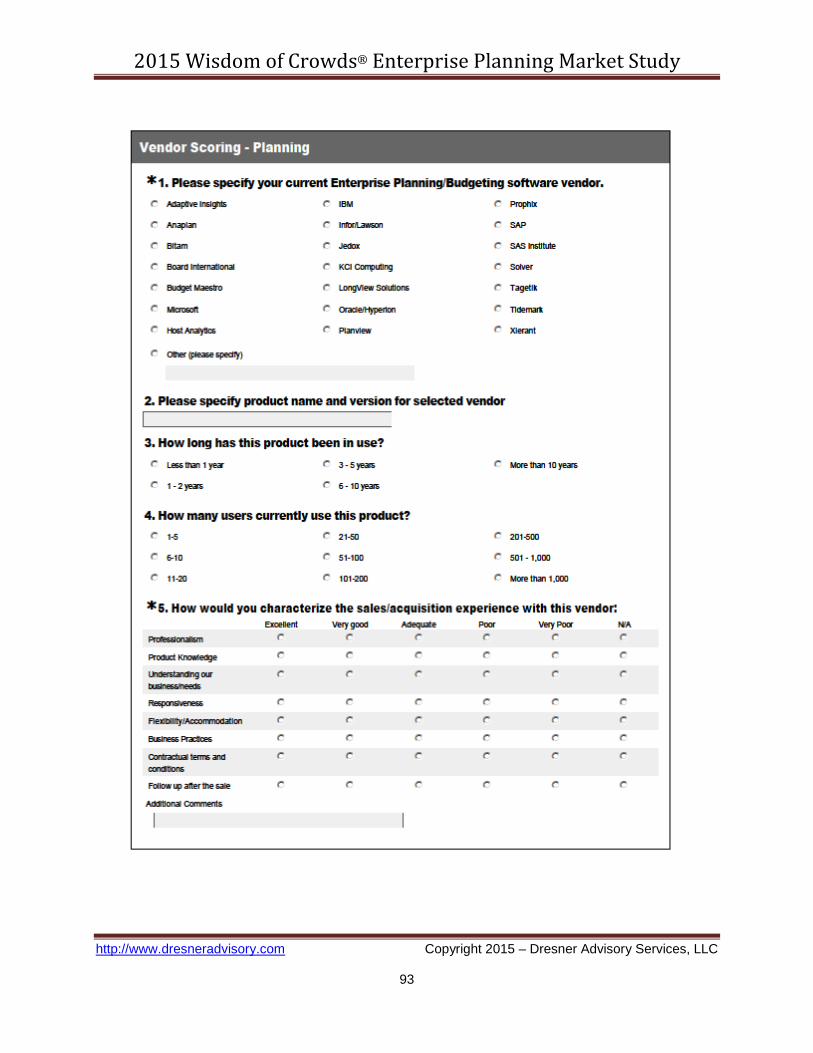
2015 Wisdom of Crowds® Enterprise Planning Market Study
http://www.dresneradvisory.com Copyright 2015 – Dresner Advisory Services, LLC
93

2015 Wisdom of Crowds® Enterprise Planning Market Study
http://www.dresneradvisory.com Copyright 2015 – Dresner Advisory Services, LLC
94

2015 Wisdom of Crowds® Enterprise Planning Market Study
http://www.dresneradvisory.com Copyright 2015 – Dresner Advisory Services, LLC
95

2015 Wisdom of Crowds® Enterprise Planning Market Study
Other Dresner Advisory Services Research Reports
- “Flagship” Wisdom of Crowds Business Intelligence Market Study - Advanced and Predictive Analytics - Business Intelligence Competency Center - Cloud Computing and Business Intelligence - Collaborative Computing and Business Intelligence - Embedded Business Intelligence - End User Data Preparation - Location Intelligence - Mobile Computing and Business Intelligence - Small and Mid-sized Enterprise Business Intelligence
http://www.dresneradvisory.com Copyright 2015 – Dresner Advisory Services, LLC
96