2015 ero budget 2014 budget 2015 v 2014 % change total
TRANSCRIPT

Analysis of 2015 Total ERO Enterprise Budget - Draft 1
Total ERO Enterprise Budget and Assessments The proposed 2015 budget for the Total ERO Enterprise1, inclusive of expenses and fixed asset expenditures, is $175.8M, which is an increase of $3.85M, 2.2%, from the 2014 budget. NERC and all Regions, except SERC, are proposing increases, ranging from 0.7% for SPP to 6% for MRO. SERC’s proposed budget is decreasing 3.7% primarily due to reductions in personnel expenses and fixed asset expenditures, as further explained below. WIRAB is proposing a 44% increase, with the percentage increase largely a reflection of its relatively small budget and the increase in costs driven by an increase in personnel to take over on reliability-related State-Provincial Steering Committee (SPSC) activities, monitoring two regional organizations WECC and Peak Reliability, as well as their Member Advisory Committees.
1 The ERO Enterprise consists of NERC, the eight Regional Entities and WIRAB.
Entity
2015
Budget
% of Total
ERO Budget 2014 Budget
% of Total
ERO Budget
Change
2015 v 2014 % Change
NERC 57,300,945 32.6% 56,390,097 32.8% 910,848 1.6%
FRCC 7,162,233 4.1% 6,794,932 4.0% 367,301 5.4%
MRO 10,328,687 5.9% 9,744,799 5.7% 583,888 6.0%
NPCC 14,778,540 8.4% 14,129,006 8.2% 649,534 4.6%
RFirst 18,756,763 10.7% 18,063,200 10.5% 693,563 3.8%
SERC 16,247,822 9.2% 16,877,288 9.8% (629,466) -3.7%
SPP RE 11,906,628 6.8% 11,823,629 6.9% 82,999 0.7%
TRE 11,983,702 6.8% 11,771,248 6.8% 212,454 1.8%
WECC 26,300,035 15.0% 25,638,085 14.9% 661,950 2.6%
WIRAB 1,013,581 0.6% 703,700 0.4% 309,881 44.0%
175,778,936 100.0% 171,935,984 100.0% 3,842,952 2.2%
Total Budget

Analysis of Draft 1 of the 2015 Total ERO Enterprise Budget 2
Preliminary 2015 assessments for the total ERO Enterprise are $163.6M, an increase of approximately $19.25M, or average of 13.4%.2 , with the proposed increases by region ranging from a reduction of 0.1% to an increase of 61.1%. As detailed in the following table, four factors impact the change in assessments: (1) the decline in the amount of penalties that offset assessments results in an increase of $4.1M, 2.8%; (2) the decline in the release of excess working capital and operating reserves increases assessments $7.7M, 5.3%; (3) the decline in other funding, primarily related to the end of grant funding in WECC, results in an increase of $3.6M, 2.5%; and (4) increase in the total ERO Enterprise and WIRAB budgets results in an increase of $3.8M, 2.7%. It is important to keep in mind that the information related to assessments is still preliminary. Additional penalties that are received by June 30, 2014 may lower assessments. Also, NERC and the Regions will refine their projected 2014 year end working capital and operating reserve balances to determine if additional excess reserves are available for release to offset assessments. The allocation of assessments between U.S., Canadian and Mexican has not been finalized and is impacted by penalty sanctions and by the allocation of compliance costs among the Canadian provinces. A table showing the change in assessments by country and by Region will be provided when final budget drafts are presented to the NERC Board for approval.
2 In the NERC PowerPoint overview accompanying the posting of NERC’s initial draft, the percentage change in assessments for the total ERO Enterprise on slide 13 was reported incorrectly to be 11.8%, due to dividing the increase of $19.251M by total 2015 assessments rather than dividing by the total 2014 assessments. The percentage changes by factor were correctly reported and when added together, (2.8% due to loss of penalties, 5.3% due to loss of excess reserves, 2.5% due to decrease in other funding, and 2.7% due to the increase in the budget), equal a total change of 13.4%, which was correctly reported on slide 14
2014 Budget 2015 Budget $ Change Change
($000's) ($000's) ($000's) % ($000's) % ($000's) % ($000's) % ($000's) %
NERC 51,401 54,252 2,851 5.5% 135 0.3% 1,725 3.4% 80 0.2% 911 1.8%
FRCC 5,488 6,238 750 13.7% 190 3.5% 192 3.5% 0.0% 367 6.7%
MRO 8,741 9,446 705 8.1% (239) -2.7% 359 4.1% 0.0% 584 6.7%
NPCC 13,612 14,078 466 3.4% (128) -0.9% (55) -0.4% 0.0% 650 4.8%
RFirst 15,160 18,522 3,362 22.2% 863 5.7% 1,805 11.9% 0.0% 694 4.6%
SERC 13,734 13,734 (1) 0.0% 313 2.3% 284 2.1% 32 0.2% (629) -4.6%
SPP 9,219 10,332 1,113 12.1% 97 1.0% 933 10.1% 0.0% 83 0.9%
TRE 10,509 10,500 (9) -0.1% (81) -0.8% (140) -1.3% (1) 0.0% 213 2.0%
WECC 15,631 25,175 9,544 61.1% 2,933 18.8% 2,419 15.5% 3,530 22.6% 662 4.2%
WIRAB 588 1,058 470 79.8% 0.0% 160 27.2% 0.0% 310 52.7%
144,085$ 163,336$ 19,251$ 13.4% 4,083$ 2.8% 7,683$ 5.3% 3,640$ 2.5% 3,843$ 2.7%
Factors Impacting the Change in Assessments CHANGE IN ASSESSMENTS BY ENTITY
Dec(inc) in Dec(Inc) in Release Dec(Inc) in Budget Inc(Dec)

Analysis of Draft 1 of the 2015 Total ERO Enterprise Budget 3
Total ERO Enterprise Budget by Program Overall, the consolidated ERO Enterprise budget reflects the ERO Enterprise’s allocation of resources and focus on the goals and objectives set forth in the Strategic Plan. Attachment 1 to this report shows the fully allocated budget for direct and indirect expenses and the expenditures for fixed assets by statutory program and the percentage of the total budget allocated to each program for NERC and the eight Regional Entities. This table does not include the WIRAB budget because their activities of providing an oversight and advisory role in the WECC Region are unique. Attachment 2 to this report shows the number of FTEs allocated to the direct statutory programs and to administrative services. Standards The total ERO Enterprise budget for the Standards Program area is $14.9M, an increase of $185.8k, 1.3%, over 2014. As a percent of total budget, the 2015 budget for the Standards Program area is increasing from 8.6% to 8.8%. The number of FTEs is decreasing by 2.26, 5.5%. As a percent of total budget, 5.7% of all FTEs have been allocated to the standards program in 2015, compared to 6.0% in 2014. NERC and all the regions, except Texas RE are reducing the number of FTEs in the Standards Program area in 2015. NERC’s reduction of 1.52 FTEs is due to a decrease in required resources to support standards development and the incorporation of a 6% attrition assumption, and reflects reorganization initiatives and increased efficiencies in connection with the transformation of NERC Reliability Standards to a “steady state”. Compliance Monitoring and Enforcement (CMEP)
CHANGE IN
REGIONAL ENTITY &
WIRAB
ASSESSMENTS
CHANGE IN
NERC
ASSESSMENTS
$ % $ $
FRCC 894,544 11.0% 749,781 144,763
MRO 889,676 7.3% 704,575 185,101
NPCC 822,291 4.1% 466,497 355,794
RFirst 3,953,582 15.3% 3,361,808 591,774
SERC 667,346 2.6% (893) 668,239
SPP 1,255,840 10.6% 1,113,042 142,798
TRE 204,237 1.4% (8,862) 213,099
WECC and WIRAB 10,563,416 42.1% 10,014,033 549,383
WIRAB 469,750 469,750 -
Total 19,250,932 16,399,981 2,850,951
% Change - NERC and Regional Entities Combined 13.4% 17.7% 5.5%
% Change for Total ERO 100.0% 85.2% 14.8%
CHANGE IN TOTAL ERO
ASSESSMENTS BY REGION

Analysis of Draft 1 of the 2015 Total ERO Enterprise Budget 4
The total ERO Enterprise budget for CMEP is $94.2M, an increase of $596k, 0.6% over 2014. As a percent of total budget, the 2015 CMEP budget is increasing from 54.7% to 55.2%. NERC’s budget for CMEP is increasing $771k, 4.9%, primarily due to the transfer of auditors from the Critical Infrastructure department to NERC’s Regional Entity Assurance and Oversight department to more closely align these personnel with other assurance and audit oversight functions, as well as reflect the separation of these activities and personnel from other activities and personnel which interact with the ES-ISAC. FRCC’s budget for CMEP is increasing $510k, 10.8%, due to the increase in FTEs attributed to work on the Organization Registration Program, implementation of Reliability Assurance Initiative (RAI), RAI associated updates to the Auditor Handbook, and support of ERO Enterprise IT application development projects supporting the CMEP function. The MRO and NPCC budgets for CMEP are increasing $297k, 4.4%, and $489k, 6.0%, respectively, primarily to add resources to support RAI. ReliabilityFirst’s budget for CMEP is increasing $1.3M, 9.4%, primarily due to staffing allocation increase of 2.75 FTEs in support of RAI activities. SERC, SPP RE, Texas RE, and WECC are decreasing their budgets for CMEP primarily based upon a variety of factors, including but not limited to a review of the resources required to support CMEP activities and to more properly align personnel with the program areas they currently support. Overall, the total number of CMEP FTES is decreasing by 15.0, 4.9%. Reliability Assessments and Performance Analysis (RAPA) The Total ERO Enterprise budget for RAPA is $36.0M, an increase of $2.6M, 7.7%, over 2014. As a percent of total budget, the 2015 RAPA budget is increasing from 19.5% to 21.1%. The number of FTEs in RAPA is increasing by 6.48, 7.2% and is driven by resource requirements associated with various risk identification, prioritization and assessment initiatives. NERC’s budget is increasing by 1.2M, 14.9% primarily due to the reallocation of FTEs in 2014 to support various reliability risk initiatives, for additional contract support related to vegetation research (FAC3)
and software application development. WECC’s budget is increasing by $1.3M, 13.8%, primarily due to enhanced Remedial Action Scheme (RAS) modeling as a result of findings in the Arizona-Southern California Outages on September 8, 2011: Causes and Recommendations report. The Texas RE budget is increasing by $409k, 28.2%, due to the inclusion of Situation Awareness in RAPA, which increased FTEs in the department by 1.75. MRO’s budget for RAPA is increasing $377k, 17.2%, due to additional FTEs to support activities related to the BES definition, new modeling, and the Protection System standards. FRCC’s budget is decreasing by $209k, 15.0%, due to the revised committee structure and combining multiple meetings into the new Regional Entity Committee and Compliance Forum. ReliabilityFirst and SERC budgets are decreasing as a result of various reorganization initiatives which resulted in a decrease of FTEs required to support this program area. Training, Education and Operator Certification The Total ERO Enterprise budget for Training, Education and Operator Certification (Training) is $8.9M, an increase of $1.0M, 12.7%, over 2014. As a percent of total budget, the 2015 Training budget is increasing from 4.6% to 5.2%. The number of FTEs is decreasing 0.28, 1.4%. WECC’s budget increased $808k, 117.3%, due to moving Compliance Outreach and Stakeholder Relations from Compliance to Training and the expectation that stakeholder outreach activities and initiatives will increase in 2015. Event Analysis NERC budgets and reports the expenses of Event Analysis in a separate department. The Regional Entities primarily include the costs associated with event analysis in RAPA. The Event Analysis Program at NERC is increasing $260k, 6.4%, primarily due to an increase in the allocation of indirect costs. As a percent of the total ERO Enterprise budget, the 2015 Event Analysis budget is increasing from 2.4% to 2.5%.

Analysis of Draft 1 of the 2015 Total ERO Enterprise Budget 5
Situation Awareness and Infrastructure Security (SAIS)
The total ERO Enterprise budget for Situation Awareness is decreasing $124k, 1.6%. As a percent of total budget, the 2015 SAIS budget is decreasing from 4.6% to 4.5%. NERC’s budget is decreasing by $882k, 19.2%, due to a reduction
in contract costs related to SAFNR and NERCnet. Texas RE’S budget is decreasing by $144k, 100%, due to inclusion of SAIS in the RAPA program beginning in 2015. SERC’s budget is increasing $660k, 57.6%, primarily due to the reclassification of 2.5 FTEs in 2014 from the RAPA program into the SAIS program to support events analysis work. Critical Infrastructure Department (CID) and ES-ISAC NERC budgets and reports activities supporting critical infrastructure protection initiatives and the ES-ISAC as a separate departments. The Regional Entities primarily budget and account for critical infrastructure resource support under the compliance function, which is also more in line with the regional entity responsibilities under their delegation agreements with NERC. NERC’s CID budget is decreasing $962K, 19.2%, in 2015 primarily due to the previously described reorganization which resulted in a transfer of auditors from the CID department to the NERC Regional Entity Assurance and Oversight department and the associated reduction of FTEs and indirect costs. The budget for the ES-ISAC is slightly higher in 2015, $95k, 2.3%. The budget for the ES-ISAC in this first draft of NERC’s budget does not include funding for NERC’s participation in CRISP or cost necessary to facilitate greater physical separation of the ES-ISAC in NERC’s Washington, DC office. Total ERO Enterprise Budget by Funding and Expense Category Total ERO Enterprise Funding The 2015 total funding requirement for the total ERO Enterprise is $171.2M, an increase of $11.6M, 7.3%, over 2014. Total funding requirements take into account funding from other sources such interest income and, in NERC’s case, outside funding which supports operator certification and testing programs, conference fees, etc. The increase is due to the proposed increase in the total budget and the $7.7M decrease in excess working capital and operating reserves that offset total funding requirement in 2014. The funding requirement for NERC, all the Regions except SERC, and WIRAB is increasing. SERC’s decrease is due to a reduction in the total budget, which is primarily related to a reduction in personnel costs, offset by a decrease in the release of excess working capital and operating reserves.3
3 The ‘Change’ in the total funding requirement for each entity as detailed in the Total Funding table corresponds to the first table on page 2 by adding the amounts reflected in the columns “Dec(Inc) in Release of Excess Reserves” and “Budget Inc(Dec)”.

Analysis of Draft 1 of the 2015 Total ERO Enterprise Budget 6
Total Personnel Expenses and Total FTEs Total 2015 personnel expenses for the ERO Enterprise are increasing $4.4M, 3.9%, over 2014 and the number of FTEs is increasing 4.5, 0.7%. The increase in Personnel Expenses is primarily due to modest increases in salaries expense for existing staff and projected market increases in the cost of employee benefit plans. NERC, NPCC and Texas RE are maintaining the same staffing level in 2015 as in 2014. FRCC, ReliabilityFirst, and WECC have modest increases of less than 2% in 2015. WIRAB is adding 1.1 FTEs to increase its focus on physical and cyber security of the grid and educate state and principal reps in Western Interconnection. SERC is reducing FTEs by 0.6%, keeping the current headcount but delaying hiring for certain open positions. SPP RE is reducing FTEs due to the elimination of an enforcement case manager position and a slight reduction in the use of shared staff. Consideration has also been given to the projected timing of hiring open positions..
Entity
2015
Budget
2014
Budget Change % Change
NERC 56,371,633 53,735,382 2,636,251 4.9%
FRCC 6,504,838 5,945,057 559,781 9.4%
MRO 9,821,019 8,877,944 943,075 10.6%
NPCC 14,423,378 13,828,880 594,498 4.3%
RFirst 19,016,592 16,517,918 2,498,674 15.1%
SERC 16,029,961 16,375,104 (345,143) -2.1%
SPP 10,743,665 9,727,456 1,016,209 10.4%
TRE 11,017,491 10,944,857 72,634 0.7%
WECC 26,300,035 23,219,139 3,080,896 13.3%
WIRAB 1,058,608 588,908 469,700 79.8%
171,287,220 159,760,645 11,526,575 7.2%
Total Funding

Analysis of Draft 1 of the 2015 Total ERO Enterprise Budget 7
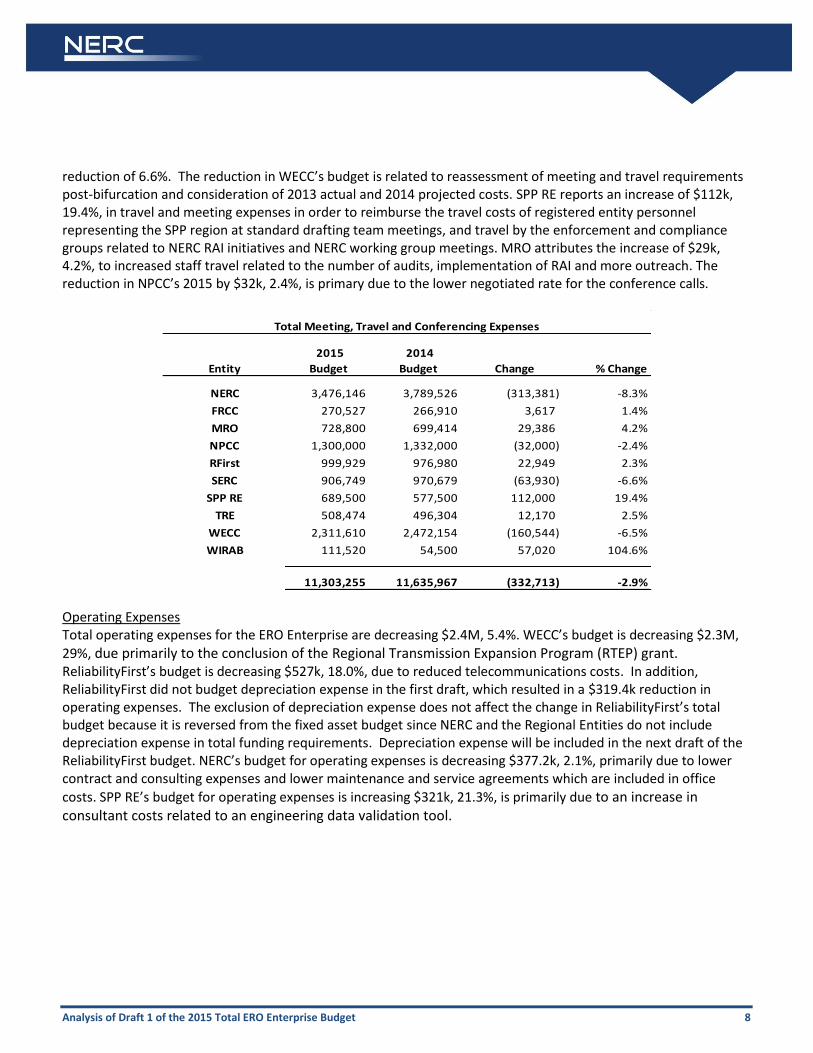
Total Meeting, Travel and Conferencing Expenses The total ERO Enterprise budget for meetings, travel and conferencing expenses is decreasing $332.7k, 2.9%. NERC has the most significant reduction of 8.3% attributed to lower travel costs due to various efficiency and cost reduction initiatives. SERC’s new office location has a large meeting space with intentions to schedule most meetings in-house or at a member’s facilities, substantially reducing the hotel hosting costs and resulting in a
Entity
2015
Budget
2014
Budget Change % Change
NERC 35,160,356 34,059,654 1,100,702 3.2%
FRCC 5,582,333 5,306,366 275,967 5.2%
MRO 7,352,260 6,898,834 453,426 6.6%
NPCC 8,929,242 8,850,160 79,082 0.9%
RFirst 15,175,232 14,386,100 789,132 5.5%
SERC 12,802,371 13,134,918 (332,547) -2.5%
SPP 4,818,695 4,912,177 (93,482) -1.9%
TRE 9,002,200 8,513,422 488,778 5.7%
WECC 17,278,550 15,773,971 1,504,579 9.5%
WIRAB 387,300 260,000 127,300 49.0%
116,488,539 112,095,602 4,392,937 3.9%
Total Personnel Expenses
Entity
2015
Budget
2014
Budget Change % Change
NERC 189.5 189.5 0.0 0.0%
FRCC 30.9 30.4 0.5 1.7%
MRO 42.5 40.8 1.8 4.3%
NPCC 36.9 36.9 0.0 0.0%
RFirst 72.2 72.0 0.2 0.3%
SERC 78.7 79.2 (0.5) -0.6%
SPP RE 32.8 33.9 (1.1) -3.2%
TRE 60.0 60.0 0.0 0.0%
WECC 137.5 135.0 2.5 1.9%
WIRAB 4.0 2.9 1.1 39.3%
684.9 680.4 4.5 0.7%
Total FTEs
Analysis of Draft 1 of the 2015 Total ERO Enterprise Budget 8
reduction of 6.6%. The reduction in WECC’s budget is related to reassessment of meeting and travel requirements post-bifurcation and consideration of 2013 actual and 2014 projected costs. SPP RE reports an increase of $112k, 19.4%, in travel and meeting expenses in order to reimburse the travel costs of registered entity personnel representing the SPP region at standard drafting team meetings, and travel by the enforcement and compliance groups related to NERC RAI initiatives and NERC working group meetings. MRO attributes the increase of $29k, 4.2%, to increased staff travel related to the number of audits, implementation of RAI and more outreach. The reduction in NPCC’s 2015 by $32k, 2.4%, is primary due to the lower negotiated rate for the conference calls.
Operating Expenses Total operating expenses for the ERO Enterprise are decreasing $2.4M, 5.4%. WECC’s budget is decreasing $2.3M,
29%, due primarily to the conclusion of the Regional Transmission Expansion Program (RTEP) grant. ReliabilityFirst’s budget is decreasing $527k, 18.0%, due to reduced telecommunications costs. In addition, ReliabilityFirst did not budget depreciation expense in the first draft, which resulted in a $319.4k reduction in operating expenses. The exclusion of depreciation expense does not affect the change in ReliabilityFirst’s total budget because it is reversed from the fixed asset budget since NERC and the Regional Entities do not include depreciation expense in total funding requirements. Depreciation expense will be included in the next draft of the ReliabilityFirst budget. NERC’s budget for operating expenses is decreasing $377.2k, 2.1%, primarily due to lower contract and consulting expenses and lower maintenance and service agreements which are included in office
costs. SPP RE’s budget for operating expenses is increasing $321k, 21.3%, is primarily due to an increase in consultant costs related to an engineering data validation tool.
Entity
2015
Budget
2014
Budget Change % Change
NERC 3,476,146 3,789,526 (313,381) -8.3%
FRCC 270,527 266,910 3,617 1.4%
MRO 728,800 699,414 29,386 4.2%
NPCC 1,300,000 1,332,000 (32,000) -2.4%
RFirst 999,929 976,980 22,949 2.3%
SERC 906,749 970,679 (63,930) -6.6%
SPP RE 689,500 577,500 112,000 19.4%
TRE 508,474 496,304 12,170 2.5%
WECC 2,311,610 2,472,154 (160,544) -6.5%
WIRAB 111,520 54,500 57,020 104.6%
11,303,255 11,635,967 (332,713) -2.9%
Total Meeting, Travel and Conferencing Expenses

Analysis of Draft 1 of the 2015 Total ERO Enterprise Budget 9
Fixed Assets (excluding the reversal of depreciation)4 The ERO Enterprise total fixed asset (capital) budget is increasing $1.6M, 33.9%. NERC’s $500.7k budget increase is related to funding requirements associated with a multiyear initiative to develop and implement software applications in support of common NERC and Regional Entity operations. FRCC’s budget is increasing $102k primarily due to the cost of enhancements to FRCC’s existing compliance software, increased physical and cyber security measures and planned replacement of old computer equipment. NPCC’s budget is increasing due to an upgrade to their back-up and document management systems. ReliabilityFirst’s budget is increasing due to purchase of furniture, replacement servers and the associated software. WECC’s $1.0 increase is related to RAS modeling. SERC’s budget is decreasing due to the completion of several projects in 2014.
4 Depreciation is reversed from fixed assets to eliminate the funding requirement that would otherwise be created due to the inclusion of depreciation expense in operating expenses.
Entity
2015
Budget
2014
Budget Change % Change
NERC 17,234,950 17,612,133 (377,183) -2.1%
FRCC 1,326,984 1,249,332 77,652 6.2%
MRO 2,431,827 2,247,051 184,776 8.2%
NPCC 4,939,219 4,494,705 444,514 9.9%
RFirst 2,401,602 2,928,553 (526,951) -18.0%
SERC 2,650,773 2,465,344 185,429 7.5%
SPP RE 1,826,245 1,505,100 321,145 21.3%
TRE 2,642,088 2,982,735 (340,647) -11.4%
WECC 5,726,317 8,067,584 (2,341,267) -29.0%
WIRAB 150,000 150,000 - 0.0%
41,330,005 43,702,537 (2,372,532) -5.4%
Total Operating Expenses

Analysis of Draft 1 of the 2015 Total ERO Enterprise Budget 10
Entity
2015
Budget
2014
Budget Change % Change
NERC 3,618,500 3,117,790 500,710 16.1%
FRCC 184,676 82,814 101,862 123.0%
MRO 336,800 370,500 (33,700) -9.1%
NPCC 222,000 108,000 114,000 105.6%
RFirst 180,000 91,000 89,000 97.8%
SERC 339,333 510,000 (170,667) -33.5%
SPP RE - - -
TRE 43,680 42,000 1,680 4.0%
WECC 1,458,445 445,487 1,012,958 227.4%
WIRAB - - -
6,383,434 4,767,591 1,615,843 33.9%
Increase(Decrease) in Fixed Assets - excluding Depreciation
Analysis of Draft 1 of the 2015 Total ERO Enterprise Budget 11
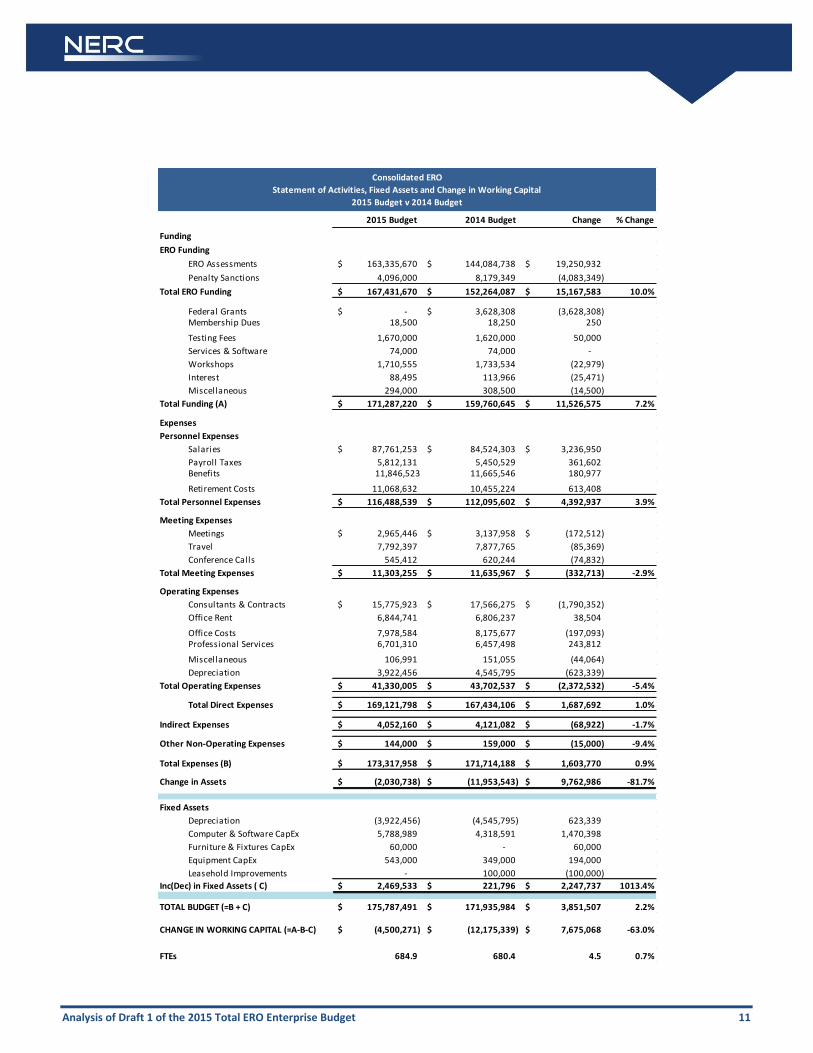
2015 Budget 2014 Budget Change % Change
Funding
ERO Funding
ERO Assessments 163,335,670$ 144,084,738$ 19,250,932$
Penalty Sanctions 4,096,000 8,179,349 (4,083,349)
Total ERO Funding 167,431,670$ 152,264,087$ 15,167,583$ 10.0%
Federal Grants -$ 3,628,308$ (3,628,308) Membership Dues 18,500 18,250 250
Testing Fees 1,670,000 1,620,000 50,000
Services & Software 74,000 74,000 -
Workshops 1,710,555 1,733,534 (22,979)
Interest 88,495 113,966 (25,471)
Miscellaneous 294,000 308,500 (14,500)
Total Funding (A) 171,287,220$ 159,760,645$ 11,526,575$ 7.2%
Expenses
Personnel Expenses
Salaries 87,761,253$ 84,524,303$ 3,236,950$
Payroll Taxes 5,812,131 5,450,529 361,602 Benefits 11,846,523 11,665,546 180,977
Retirement Costs 11,068,632 10,455,224 613,408
Total Personnel Expenses 116,488,539$ 112,095,602$ 4,392,937$ 3.9%
Meeting Expenses
Meetings 2,965,446$ 3,137,958$ (172,512)$
Travel 7,792,397 7,877,765 (85,369)
Conference Calls 545,412 620,244 (74,832)
Total Meeting Expenses 11,303,255$ 11,635,967$ (332,713)$ -2.9%
Operating Expenses
Consultants & Contracts 15,775,923$ 17,566,275$ (1,790,352)$
Office Rent 6,844,741 6,806,237 38,504
Office Costs 7,978,584 8,175,677 (197,093) Professional Services 6,701,310 6,457,498 243,812
Miscellaneous 106,991 151,055 (44,064)
Depreciation 3,922,456 4,545,795 (623,339)
Total Operating Expenses 41,330,005$ 43,702,537$ (2,372,532)$ -5.4%
Total Direct Expenses 169,121,798$ 167,434,106$ 1,687,692$ 1.0%
Indirect Expenses 4,052,160$ 4,121,082$ (68,922)$ -1.7%
Other Non-Operating Expenses 144,000$ 159,000$ (15,000)$ -9.4%
Total Expenses (B) 173,317,958$ 171,714,188$ 1,603,770$ 0.9%
Change in Assets (2,030,738)$ (11,953,543)$ 9,762,986$ -81.7%
Fixed Assets
Depreciation (3,922,456) (4,545,795) 623,339
Computer & Software CapEx 5,788,989 4,318,591 1,470,398
Furniture & Fixtures CapEx 60,000 - 60,000
Equipment CapEx 543,000 349,000 194,000
Leasehold Improvements - 100,000 (100,000)
Inc(Dec) in Fixed Assets ( C) 2,469,533$ 221,796$ 2,247,737$ 1013.4%
TOTAL BUDGET (=B + C) 175,787,491$ 171,935,984$ 3,851,507$ 2.2%
CHANGE IN WORKING CAPITAL (=A-B-C) (4,500,271)$ (12,175,339)$ 7,675,068$ -63.0%
FTEs 684.9 680.4 4.5 0.7%
Consolidated ERO
Statement of Activities, Fixed Assets and Change in Working Capital
2015 Budget v 2014 Budget

Comparison ‐ Draft 1 2015 to 2014 Business Plan and Budget ATTACHMENT 1Spending by Statutory ProgramFully Allocated Direct, Indirect and Fixed Assets
Total Standards Compliance RAPA TrainingEvent
Analysis Situation
AwarenessCritical
Infrastructure ES‐ISAC Total Standards Compliance RAPA TrainingEvent
Analysis Situation
AwarenessCritical
Infrastructure ES‐ISAC
NERC1 57,301$ 10,395$ 16,663$ 9,595$ 3,989$ 4,308$ 3,701$ 4,452$ 4,198$ 100.0% 18.1% 29.1% 16.7% 7.0% 7.5% 6.5% 7.8% 7.3%FRCC 7,162 423 5,212 1,182 322 ‐ 23 ‐ ‐ 100.0% 5.9% 72.8% 16.5% 4.5% 0.3%MRO 10,329 388 6,994 2,571 295 ‐ 80 ‐ ‐ 100.0% 3.8% 67.7% 24.9% 2.9% 0.8%NPCC 14,779 1,456 8,568 3,054 199 ‐ 1,501 ‐ ‐ 100.0% 9.9% 58.0% 20.7% 1.3% 10.2%RFirst 18,757 ‐ 14,858 2,673 959 ‐ 267 ‐ ‐ 100.0% 0.0% 79.2% 14.3% 5.1% 1.4%SERC 16,248 527 11,050 1,798 1,065 ‐ 1,807 ‐ ‐ 100.0% 3.2% 68.0% 11.1% 6.6% 11.1%SPP RE 11,907 115 8,657 3,002 88 ‐ 44 ‐ ‐ 100.0% 1.0% 72.7% 25.2% 0.7% 0.4%TRE2 11,984 607 9,009 1,857 511 ‐ ‐ ‐ ‐ 100.0% 5.1% 75.2% 15.5% 4.3% 0.0%WECC3 26,300 1,027 13,179 10,302 1,498 ‐ 295 ‐ ‐ 100.0% 3.9% 50.1% 39.2% 5.7% 1.1%
170,567$ 14,939$ 94,190$ 36,034$ 8,926$ 4,308$ 7,718$ 4,452$ 4,198$ 100.0% 8.8% 55.2% 21.1% 5.2% 2.5% 4.5% 2.6% 2.5%
1NERC budgets Event Analysis, Critical Infrastructure and ES‐ISAC separately. 2 In 2015, Texas RE combined Situation Awareness with RAPA.3 WECC will not have funding from federal grants in 2015
Total Standards Compliance RAPA TrainingEvent
Analysis Situation
AwarenessCritical
Infrastructure ES‐ISAC Total Standards Compliance RAPA TrainingEvent
Analysis Situation
AwarenessCritical
Infrastructure ES‐ISAC
NERC1 56,390$ 10,167$ 15,892$ 8,351$ 3,737$ 4,048$ 4,583$ 5,508$ 4,104$ 100.0% 18.0% 28.2% 14.8% 6.6% 7.2% 8.1% 9.8% 7.3%FRCC 6,795 410 4,702 1,391 272 ‐ 19 ‐ ‐ 100.0% 6.0% 69.2% 20.5% 4.0% 0.3%MRO 9,745 435 6,698 2,194 333 ‐ 84 ‐ ‐ 100.0% 4.5% 68.7% 22.5% 3.4% 0.9%NPCC 14,129 1,447 8,079 2,942 196 ‐ 1,464 ‐ ‐ 100.0% 10.2% 57.2% 20.8% 1.4% 10.4%RFirst 18,063 194 13,585 3,121 916 ‐ 246 ‐ ‐ 100.0% 1.1% 75.2% 17.3% 5.1% 1.4%SERC2 16,877 547 11,875 2,201 1,107 ‐ 1,147 ‐ ‐ 100.0% 3.2% 70.4% 13.0% 6.6% 6.8%SPP RE 11,824 79 8,663 2,757 279 ‐ 45 ‐ ‐ 100.0% 0.7% 73.3% 23.3% 2.4% 0.4%TRE 11,771 450 9,336 1,448 392 ‐ 144 ‐ ‐ 100.0% 3.8% 79.3% 12.3% 3.3% 1.2%WECC3 25,638 1,023 14,763 9,054 689 ‐ 108 ‐ ‐ 100.0% 4.0% 57.6% 35.3% 2.7% 0.4%
171,232$ 14,753$ 93,594$ 33,460$ 7,923$ 4,048$ 7,842$ 5,508$ 4,104$ 100.0% 8.6% 54.7% 19.5% 4.6% 2.4% 4.6% 3.2% 2.4%
1NERC budgets Event Analysis, Critical Infrastructure and ES‐ISAC separately. 2 SERC did not allocate $10,000 of indirect overhead expenses to the Statutory Programs because they are offset by interest income. As a result, the "Total" budget reflected above does not exactly match the total budgeted spend for expenses and fixed assets as reflected on the Statement of Activities and Capital Expenditures. 3 WECC's 2014 RAPA budget included $3,628,308 associated with federal grant activity.
Total Standards Compliance RAPA TrainingEvent
Analysis Situation
AwarenessCritical
Infrastructure ES‐ISAC Total Standards Compliance RAPA TrainingEvent
Analysis Situation
AwarenessCritical
Infrastructure ES‐ISAC
NERC 911$ 228$ 771$ 1,244$ 251$ 260$ (882)$ (1,056)$ 95$ 1.6% 0.1% 0.9% 1.9% 0.3% 0.3% ‐1.7% ‐2.0% 0.0%FRCC 367 14 510 (209) 49 4 5.4% ‐0.1% 3.6% ‐4.0% 0.5% 0.0%MRO 584 (47) 297 377 (38) (4) 6.0% ‐0.7% ‐1.0% 2.4% ‐0.6% ‐0.1%NPCC 650 9 489 112 3 37 4.6% ‐0.4% 0.8% ‐0.2% 0.0% ‐0.2%RFirst 694 (194) 1,273 (448) 43 20 3.8% ‐1.1% 4.0% ‐3.0% 0.0% 0.1%SERC (629) (19) (825) (403) (42) 660 ‐3.7% 0.0% ‐2.4% ‐2.0% 0.0% 4.3%SPP RE 83 36 (6) 245 (191) (1) 0.7% 0.3% ‐0.6% 1.9% ‐1.6% 0.0%TRE 212 156 (328) 409 119 (144) 1.8% 1.2% ‐4.1% 3.2% 0.9% ‐1.2%WECC 662 4 (1,585) 1,248 808 187 2.6% ‐0.1% ‐7.5% 3.9% 3.0% 0.7%
3,438$ 186$ 596$ 2,574$ 1,003$ 260$ (124)$ (1,056)$ 95$ 2.4% 0.1% 0.6% 1.6% 0.6% 0.2% ‐0.1% ‐0.6% 0.1%
2015 Business Plan and Budget ‐ Total Budget by Program ($000's) 2015 Business Plan and Budget ‐ % of Total Budget Allocated by Program
2014 Business Plan and Budget ‐ Total Budget by Program 2014 Business Plan and Budget ‐ % of Total Budget Allocated by Program
Variance ‐ 2015 to 2014 Business Plan and Budget ‐ Total Budget by Program ($000's) Variance ‐ 2015 to 2014 Business Plan and Budget ‐ % of Total Budget Allocated by Program
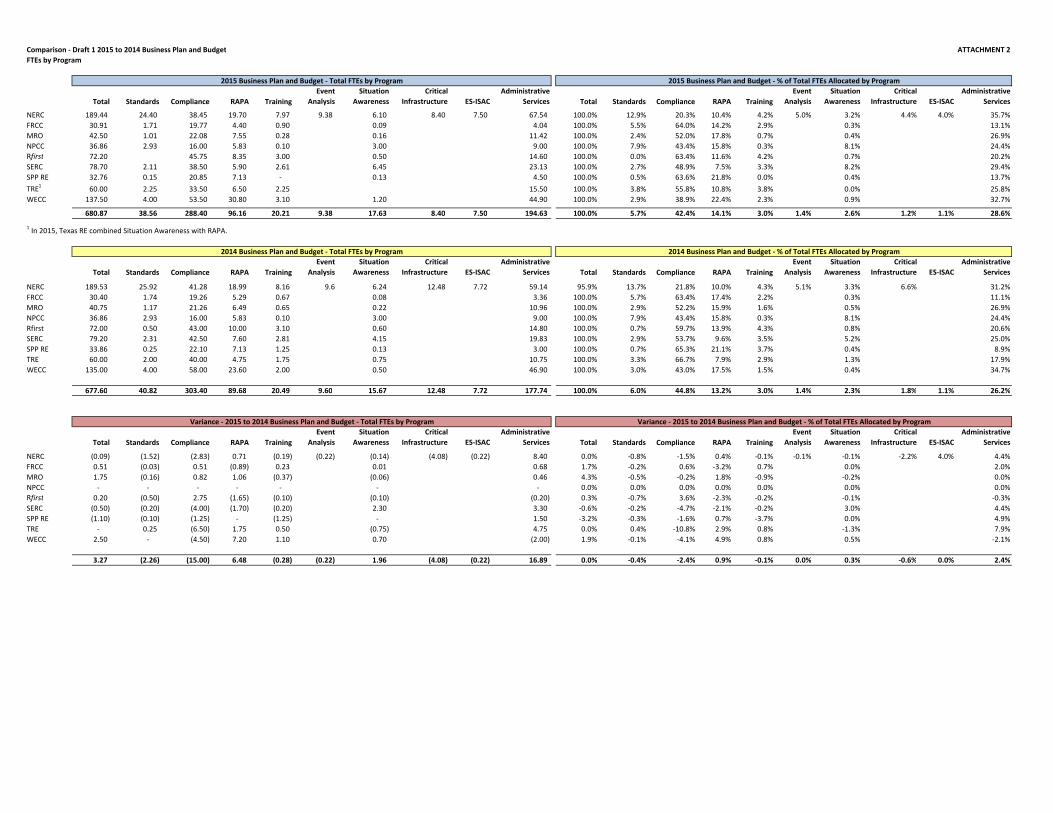
Comparison ‐ Draft 1 2015 to 2014 Business Plan and Budget ATTACHMENT 2FTEs by Program
Total Standards Compliance RAPA TrainingEvent
AnalysisSituation
AwarenessCritical
Infrastructure ES‐ISACAdministrative
Services Total Standards Compliance RAPA TrainingEvent
AnalysisSituation
AwarenessCritical
Infrastructure ES‐ISACAdministrative
Services
NERC 189.44 24.40 38.45 19.70 7.97 9.38 6.10 8.40 7.50 67.54 100.0% 12.9% 20.3% 10.4% 4.2% 5.0% 3.2% 4.4% 4.0% 35.7%FRCC 30.91 1.71 19.77 4.40 0.90 0.09 4.04 100.0% 5.5% 64.0% 14.2% 2.9% 0.3% 13.1%MRO 42.50 1.01 22.08 7.55 0.28 0.16 11.42 100.0% 2.4% 52.0% 17.8% 0.7% 0.4% 26.9%NPCC 36.86 2.93 16.00 5.83 0.10 3.00 9.00 100.0% 7.9% 43.4% 15.8% 0.3% 8.1% 24.4%Rfirst 72.20 45.75 8.35 3.00 0.50 14.60 100.0% 0.0% 63.4% 11.6% 4.2% 0.7% 20.2%SERC 78.70 2.11 38.50 5.90 2.61 6.45 23.13 100.0% 2.7% 48.9% 7.5% 3.3% 8.2% 29.4%SPP RE 32.76 0.15 20.85 7.13 ‐ 0.13 4.50 100.0% 0.5% 63.6% 21.8% 0.0% 0.4% 13.7%TRE1 60.00 2.25 33.50 6.50 2.25 15.50 100.0% 3.8% 55.8% 10.8% 3.8% 0.0% 25.8%WECC 137.50 4.00 53.50 30.80 3.10 1.20 44.90 100.0% 2.9% 38.9% 22.4% 2.3% 0.9% 32.7%
680.87 38.56 288.40 96.16 20.21 9.38 17.63 8.40 7.50 194.63 100.0% 5.7% 42.4% 14.1% 3.0% 1.4% 2.6% 1.2% 1.1% 28.6%
1 In 2015, Texas RE combined Situation Awareness with RAPA.
Total Standards Compliance RAPA TrainingEvent
AnalysisSituation
AwarenessCritical
Infrastructure ES‐ISACAdministrative
Services Total Standards Compliance RAPA TrainingEvent
AnalysisSituation
AwarenessCritical
Infrastructure ES‐ISACAdministrative
Services
NERC 189.53 25.92 41.28 18.99 8.16 9.6 6.24 12.48 7.72 59.14 95.9% 13.7% 21.8% 10.0% 4.3% 5.1% 3.3% 6.6% 31.2%FRCC 30.40 1.74 19.26 5.29 0.67 0.08 3.36 100.0% 5.7% 63.4% 17.4% 2.2% 0.3% 11.1%MRO 40.75 1.17 21.26 6.49 0.65 0.22 10.96 100.0% 2.9% 52.2% 15.9% 1.6% 0.5% 26.9%NPCC 36.86 2.93 16.00 5.83 0.10 3.00 9.00 100.0% 7.9% 43.4% 15.8% 0.3% 8.1% 24.4%Rfirst 72.00 0.50 43.00 10.00 3.10 0.60 14.80 100.0% 0.7% 59.7% 13.9% 4.3% 0.8% 20.6%SERC 79.20 2.31 42.50 7.60 2.81 4.15 19.83 100.0% 2.9% 53.7% 9.6% 3.5% 5.2% 25.0%SPP RE 33.86 0.25 22.10 7.13 1.25 0.13 3.00 100.0% 0.7% 65.3% 21.1% 3.7% 0.4% 8.9%TRE 60.00 2.00 40.00 4.75 1.75 0.75 10.75 100.0% 3.3% 66.7% 7.9% 2.9% 1.3% 17.9%WECC 135.00 4.00 58.00 23.60 2.00 0.50 46.90 100.0% 3.0% 43.0% 17.5% 1.5% 0.4% 34.7%
677.60 40.82 303.40 89.68 20.49 9.60 15.67 12.48 7.72 177.74 100.0% 6.0% 44.8% 13.2% 3.0% 1.4% 2.3% 1.8% 1.1% 26.2%
Total Standards Compliance RAPA TrainingEvent
AnalysisSituation
AwarenessCritical
Infrastructure ES‐ISACAdministrative
Services Total Standards Compliance RAPA TrainingEvent
AnalysisSituation
AwarenessCritical
Infrastructure ES‐ISACAdministrative
Services
NERC (0.09) (1.52) (2.83) 0.71 (0.19) (0.22) (0.14) (4.08) (0.22) 8.40 0.0% ‐0.8% ‐1.5% 0.4% ‐0.1% ‐0.1% ‐0.1% ‐2.2% 4.0% 4.4%FRCC 0.51 (0.03) 0.51 (0.89) 0.23 0.01 0.68 1.7% ‐0.2% 0.6% ‐3.2% 0.7% 0.0% 2.0%MRO 1.75 (0.16) 0.82 1.06 (0.37) (0.06) 0.46 4.3% ‐0.5% ‐0.2% 1.8% ‐0.9% ‐0.2% 0.0%NPCC ‐ ‐ ‐ ‐ ‐ ‐ ‐ 0.0% 0.0% 0.0% 0.0% 0.0% 0.0% 0.0%Rfirst 0.20 (0.50) 2.75 (1.65) (0.10) (0.10) (0.20) 0.3% ‐0.7% 3.6% ‐2.3% ‐0.2% ‐0.1% ‐0.3%SERC (0.50) (0.20) (4.00) (1.70) (0.20) 2.30 3.30 ‐0.6% ‐0.2% ‐4.7% ‐2.1% ‐0.2% 3.0% 4.4%SPP RE (1.10) (0.10) (1.25) ‐ (1.25) ‐ 1.50 ‐3.2% ‐0.3% ‐1.6% 0.7% ‐3.7% 0.0% 4.9%TRE ‐ 0.25 (6.50) 1.75 0.50 (0.75) 4.75 0.0% 0.4% ‐10.8% 2.9% 0.8% ‐1.3% 7.9%WECC 2.50 ‐ (4.50) 7.20 1.10 0.70 (2.00) 1.9% ‐0.1% ‐4.1% 4.9% 0.8% 0.5% ‐2.1%
3.27 (2.26) (15.00) 6.48 (0.28) (0.22) 1.96 (4.08) (0.22) 16.89 0.0% ‐0.4% ‐2.4% 0.9% ‐0.1% 0.0% 0.3% ‐0.6% 0.0% 2.4%
2015 Business Plan and Budget ‐ Total FTEs by Program 2015 Business Plan and Budget ‐ % of Total FTEs Allocated by Program
2014 Business Plan and Budget ‐ Total FTEs by Program 2014 Business Plan and Budget ‐ % of Total FTEs Allocated by Program
Variance ‐ 2015 to 2014 Business Plan and Budget ‐ Total FTEs by Program Variance ‐ 2015 to 2014 Business Plan and Budget ‐ % of Total FTEs Allocated by Program