2015 financial benchmarking report – law firms · production of a financial benchmarking report...
TRANSCRIPT

Ahead for business
A remarkable improvement in the health of the legal market
2015 Financial Benchmarking Report – Law Firms
Third survey

In 2014 the economy started to improve at a greater pace than previous years. This was particularly good news for legal firms associated with corporate work and residential property. As the legal sector recovers there could be further cash flow problems as legal firms will need more capital to finance growth. This is the third survey that tracks the financial data of small-to-medium-sized law firms in 2014 and represents significant analysis covering 339 firms from across the country.In addition to the benchmarking data, the report also incorporates some predictions as to how lawyers believe their firm will perform in 2015.To ensure that your legal firm outperforms the rest – read on…

F or a third year, NatWest has collaborated with Robert Mowbray in the production of a Financial Benchmarking report that
looks to explore, specifically, the performance of those legal firms operating in the SME space and with revenues below £35 million. Of the 339 firms contributing to this report, 146 reported revenue of less than £1.5 million and 193 firms reported revenue above this level.
Last year’s report was downloaded by almost 2,000 people and, in response to positive feedback, we have once again provided specific data covering larger firms with revenue in excess of £5 million. We have also incorporated predictive data representing anticipated performance in 2015; these figures were provided by some of the 400 delegates who attended our series of legal conferences in October 2014.
The report covers performance during the year-end 2014; arguably, the economy started to improve during this period at a greater pace than in previous years. This was good news for legal firms who witnessed an increase in matter starts associated with corporate work and residential property. Not surprisingly, this year’s report details a healthy improvement in both revenue and profit levels, but improvement in profit margin appears to be a harder nut to crack.
Despite economic and political challenges across the globe, lawyers are optimistic that the local landscape will remain positive for them during the course of 2015:
● 80% believe that fee income will grow, with 30% believing that revenue growth will reach 10% or beyond
● 69% believe that profit levels will improve, and 68% believe that chargeable hours will increase
● Operational efficiency still appears to be a challenge – only 40% of firms believe their profit margin will remain unchanged or will decrease
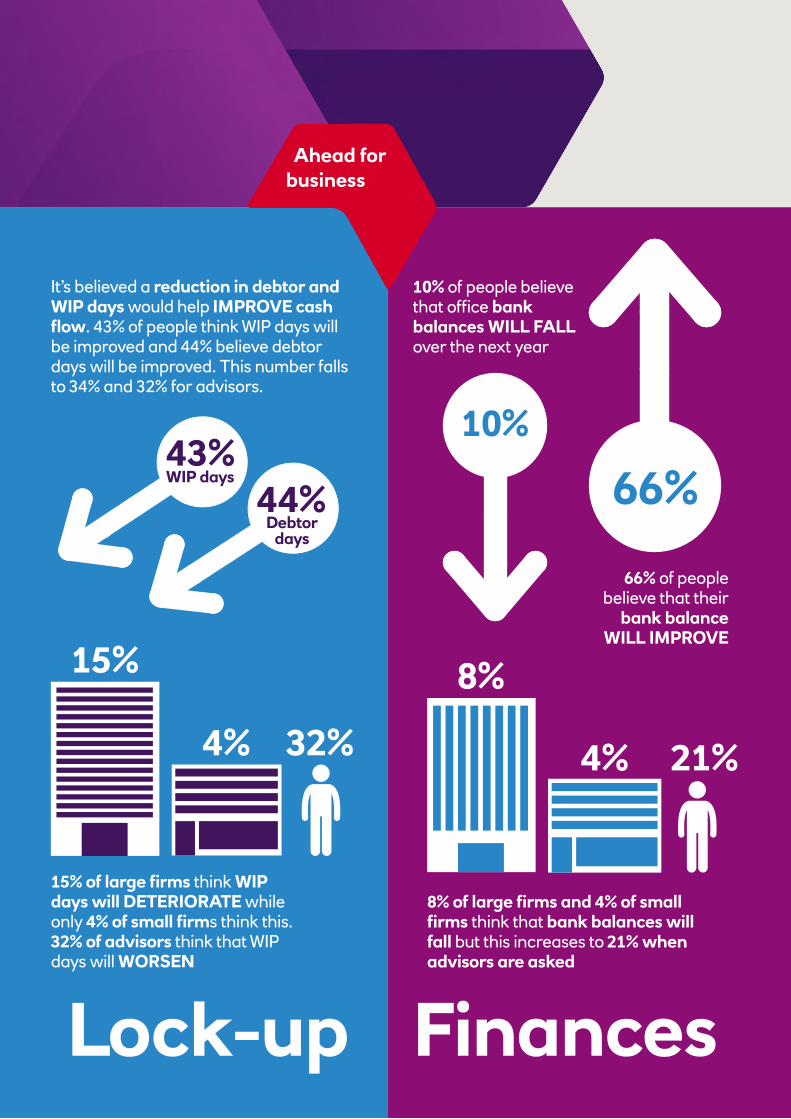
● Given that only 43% anticipate improved work in progress (WIP) days and 44% anticipate improved debtor days, many firms could face cash flow challenges associated with lock-up, despite increasing levels of work
In order to preserve financial stability, legal firms must stay in touch with their cash position, and cash budgeting is more important than profit budgeting.
Although risks associated with the economy may have diminished, risks associated with criminal activity have increased significantly over the last 12 months. Criminals know that legal firms carry large cash positions via client accounts. This represents a great opportunity for criminals to
try and compromise a firm’s security arrangement in respect of their electronic payment governance. Remember, NO bank will ever ask a customer to reveal their passwords or security codes.
We hope that this report will continue to assist those firms who have a desire to improve their financial performance and are motivated to understand how their firm compares against a national and regional peer group.
NatWest remains committed to assisting legal firms to develop a successful business, and it demonstrates that commitment by providing access to Relationship Managers who understand the Professional Services Sector and benefit from accredited training.
We would like to thank Robert Mowbray for sharing with us his sector knowledge and support in producing this report. If you have any comments about this report, or would like to discuss how the Bank can assist your legal business, please do not hesitate to contact me.
Steve ArundaleHead of Commercial Professional Sectors, NatWest, [email protected]
FOREWORD
OV E RV I E W
About the authorRobert Mowbray is a Chartered Accountant who has worked in, and for, professional firms for over 30 years. His involvement with law firms began in the late 1980s and quickly developed into a niche business. His book Maximising the profitability of law firms, published in the mid-1990s, was the first on law firm financials. He has been involved in a large number of surveys in the legal profession focusing on the financial health of firms, and he has worked on other surveys to research other aspects of law firm performance. He is also the author of Law firm finance & administration handbook – A practical guide for COFAs and finance professionals, the first book to be published on the role of compliance officers for finance and administration (COFAs).
Each year, Robert works with some 80 firms and helps them to improve their financial performance. He has assisted in many areas, including: improving the quantity and quality of time capture; improving the ability of fee earners to negotiate fees with clients and to introduce more creative fee arrangements; managing lock-up to improve cash flow; profit sharing arrangements which reward improved business performance; and strategic and business planning.
Robert has worked with around 1,000 law firms across more than 30 countries. His clients range from the global elite through to major regional firms, as well as many small firms and sole practitioners. He is an owner of Taylor Mowbray LLP – a niche business that focuses exclusively on law firms – which he runs with Janet Taylor, who is an authority on the SRA Accounts Rules.
3 L AW F I R M S F I N AN C I AL B E N C H M AR K I N G R E P O RT 2015

Fees● Median fees per fee earner were
£138,000 with a lower quartile figure of £104,000 and an upper quartile figure of £181,000. The median figure varies significantly by region – it reaches a high of £201,000 in London and a low of £108,000 in Scotland.
● Median fees per equity partner were £473,000, with the lower quartile point valued at £298,000 and the upper quartile point reaching £835,000.
● Fees have grown by 5% since last year which is considerably above inflation. Perhaps, surprisingly, this rate of increase is very consistent across all regions.
Lock-up● Median lock-up is 109 days
which reflects a slight increase from last year. The lower quartile point is 77 days and the upper quartile point is double at 153 days.
● As firms get larger, they find it increasingly difficult to manage lock-up: median lock-up for small firms is 91 days; for large firms, it is 125 days; and for very large firms, it reaches 132 days.
● When asked if work in progress (WIP) days will deteriorate next year, just 4% of small firms agree compared to 32% of advisors. It will be interesting to see whose prediction holds true next year.
Profits● Median profit per equity partner
(PEP) is £107,000. This is £20,000 higher than the equivalent figure reported in last year’s survey.
● At £71,000, the median PEP figure in small firms is less than half of the median figure in large firms at £148,000.
● The percentage increase in profits over last year is six times greater in small firms than in large firms.
● The median profit margin has increased to 24%, bringing it close to the long-term average of 25%. This suggests that the legal profession is emerging strongly from recession.
● The increase in profits has been driven mainly by staff recruitment. Median gearing was 2.88 last year and has increased by 18% to 3.41 this year. Meanwhile, annual recorded chargeable hours is unchanged at 1,000, which demonstrates that the growth is down to recruiting new fee earners rather than a rise in productivity. This is in line with the UK economy generally, which has also been creating new jobs without increasing productivity.
● Only 36% of firms claim to have detailed time-recording policies. Therefore it is not surprising that so much time goes unrecorded.
● If firms could perform at the upper quartile point for gearing, recorded hours, recovered rate and margin, they would achieve a PEP figure of £328,000.
● The median PEP figure is more than 50% higher in limited liability partnerships (LLPs) than it is in traditional partnerships.
Executive summary
The survey is a substantial review of law firms with fee income of up to £35 million. From across England, Wales and Scotland, 339 firms, employing 15,200 people, took part in the survey. Their combined total income was £1.14 billion
OV E RV I E W
Some interesting findings from the survey include:
Contents
Introduction p6
Fees p10
Profit p15
Lock-up p24
Finance p27
Conclusion p31
5 L AW F I R M S F I N AN C I AL B E N C H M AR K I N G R E P O RT 2015
Finance● Law firms remain cautious about
carrying debt and the median bank balance was £56,000.
● The spare capacity in the overdraft has a median figure of 11% of annual fees, with little variance in this number among firms that differ in size. This suggests that the median firm would run out of money in around 40 days if they received no further money from clients during that period.
● Client money balances are typically 153% of annual billings. The firms in the survey are holding over £1.5 billion in client deposits. It is clearly important that firms do everything possible to ensure that these funds are kept secure.
ALL
PH
OTO
GR
APH
Y: A
LAM
Y

INTRODUCTION2014 marked a turning point for the legal sector with performance generally improving. In certain regions, there have been unexpected shortages of residential and commercial property lawyers with a few years of experience which may not be surprising after the cutbacks of the last few years. This has led to demand exceeding supply, and the price pressure that existed over many legal services has started to ease.
Having said that, more firms have failed and entered into administration during this financial year. As the legal sector recovers, there could be further cash flow problems for firms as they will need more capital to finance their growing working capital requirements.
The more positive firms are now looking ahead and recognise that if they could increase fees by 10-15% without any real increase in expenses, then most of the additional fee income will equal pure profit, leading to a healthier bottom line. This can potentially be achieved through an improvement in fee earner productivity. It will mean focusing on: more effective capture of time worked; getting smarter and more confident with fee arrangements; and improving a firm’s ability to ensure that clients never get nasty surprises over fees. Achieving this may well require significant investment in training and systems.
With this being the survey’s third year, we were keen to continue with some of the reporting that has made previous editions so popular. We also wanted to introduce some new elements to give readers something extra to consider.
As before, the report is based on contributions from 339 firms using figures from their financial year-end in 2014. Firms are either described as ‘small’ (with less than £1.5 million annual fees) or ‘large’ (with more than £1.5 million annual fees).
The combined fee income of the firms in the survey is £1.14 billion, covering 1,807 equity partners, while the combined profits were £288 million. The information is broken down into a number of regions as there is a significant difference in the performance of law firms across
South West
By focusing on under-performing areas, it may be easier to make improvements
the UK. The performance of different sized firms is also analysed to see if it reveals an optimal size.
The report provides median, lower quartile (LQ) and upper quartile (UQ) figures. Firms want to be the best at everything but this is clearly unrealistic. Firms tend to promote their strengths and try to further improve on those, rather than focusing on under-performing areas where it may be easier to make improvements.
When looking at the tables, it is perhaps best to focus on the areas where your firm is currently below the upper quartile figure and to think about what needs to be done to generate better results.
The bulk of the information is historical as it relates to the most recently ended financial year. NatWest organises a series of conferences each autumn for its legal sector clients and contacts, and conference delegates in 2014 were asked to comment on how they thought they might perform in 2015. This predictive data is included within the survey. We have also differentiated between the opinions of law firms and those who are advising law firms. Next year, it will be interesting to see whether lawyers are better at financial forecasting than their advisors.
6 L AW F I R M S F I N AN C I AL B E N C H M AR K I N G R E P O RT 2015

South East 362016South West492821
Wales, Midlands, East of England834340
70North East, North West4723
Scotland512031
London 503515
TABLE 1.
1 Firms by location
339
TOTAL
193LARGE
TOTAL BUSINESSES 146SMALL
TABLE 2.
2 Firms by constitutionLLP
SOLE PRACTITIONER
312202
231424302322
TOTAL
503649837051
COMPANY
76713228
PARTNERSHIP
17London
1536South East
16South West
38Wales, Midlands, East of England
North East, North West
Scotland
2519
10136 33963130TOTAL
Table 2 shows the firms taking part in the survey by constitution. This is the first year where the most common type of law firm is a limited liability partnership (LLP). When we add those firms constituted as companies, we see that nearly two thirds of firms in the survey are now filing their accounts. This availability of data is important if firms want to continue to benchmark their performance against those firms which they consider to be their major competitors. This trend is even more marked at the top end of the legal market, where 49 out of the 50 largest firms based on fee income are now LLPs. Last year, 38% of the firms surveyed were LLPs compared to this year’s figure of 40%. Companies represented 13% of firms in the survey last year but this has increased to 19% this year. This may indicate that many firms are more easily run with a corporate structure than as a traditional partnership. With so many different firms, it is important that every firm reflects on what is likely to be the best structure for them in order to maximise performance.
Table 1 shows an analysis of the firms in the survey by region and by size. Three regions were
grouped together to form Wales, Midlands and East of England as there were not enough firms
from Wales (11 firms) and East of England (17 firms) for these regions to be analysed
separately. The survey has divided the firms into two sizes: those with annual fees of less than
£1.5 million are described as ‘small’, while those with fees in excess of £1.5 million are classified
as ‘large’. The tables contain an extra line of data for ‘very large’ firms with annual fees in excess of £5 million. In Table 1, these firms have then been subdivided into ‘small’, with annual fees between £5 million and £8 million, and ‘large’ with annual
fees in excess of £8 million. Elsewhere, the results for these very large firms have been
included in the figures for ‘large firms’, as in previous reports.
I N T RO D U CT I O N
7L AW F I R M S F I N AN C I AL B E N C H M AR K I N G R E P O RT 2015
63
TOTAL
35LARGE
VERY LARGE FIRMS 28SMALL
238 63815VERY LARGE FIRMS

Should profit sharing be linked to partner performance?
81%Believe that fees per fee earner will INCREASE
in 2015
Fees Profits
In larger firms, 37% of people think that fee income WILL GROW by more than 10%. The equivalent figure for small firms is just 24%
This figure is lower from advisors where 22% think fee growth will exceed 10%
37%
24%
Fee income is GROWING FASTER than fees per fee earner
35%
35% of large firms AGREE, while only 23% of small firms do
Large firms Small firmsPercent that believe profits per equity partner will INCREASE by at least 10%
34% 17% 11%Advisors
23%
36% of firms believe they have a detailed policy for time recording. In larger
firms this rises to 49%, while in smaller firms it drops to 20%
36% 20%49%
22%
All firms Large firms
Small firms
Predictions for 2015
Lock-up Finances
10%
66%
10% of people believe that office bank balances WILL FALL over the next year
66% of people believe that their
bank balance WILL IMPROVE
4%
8%
8% of large firms and 4% of small firms think that bank balances will fall but this increases to 21% when advisors are asked
15%
15% of large firms think WIP days will DETERIORATE while only 4% of small firms think this. 32% of advisors think that WIP days will WORSEN
It’s believed a reduction in debtor and WIP days would help IMPROVE cash flow. 43% of people think WIP days will be improved and 44% believe debtor days will be improved. This number falls to 34% and 32% for advisors.
43%44%
WIP days
Debtor days
4% 32% 21%
Ahead for business

SECTION 1
Fees
Key questions to consider1. What do we need to do to enable fee earners to become more productive?
2. Are we training our fee earners properly so that they maximise their fee earning potential?
3. Are we confident about our pricing, and can we charge more if we get the service right?

You can make more profit without increasing fees by controlling and cutting expenditure. This has been the focus in the majority of firms in the last few years, as fee income levels have generally fallen or remained fairly flat. For many legal businesses, now is the time to focus more on the growth of fee income to increase profits.
As noted in the Introduction, this may require a change in thinking because generating more income may require a firm to spend more on fee earners and on supporting overheads.
One of the widely used measures of performance in legal businesses is fees per
FEESfee earner because it demonstrates the level of income being generated. This can then be compared to the salary cost of the fee earner to determine the multiple of salary costs which the fees generated represent.
Good law firms have always talked about the need to achieve fees equal to three times salary costs when budgeting to achieve healthy profits. If this can be done and a further third is spent on overheads, then a healthy net profit of one third is earned for the equity partners.
If a multiple of three times salary cost is not achieved then it will be difficult to achieve the same level of profits. Clearly, if productivity can be increased and the multiple is higher than three then it should be possible to make even higher levels of profit than have been achieved in the past.
Generating more income may require a firm to spend more on fee earners
SECTION 1 F E E S
REGION SMALL LARGE TOTAL
LQ Median UQ LQ Median UQ LQ Median UQ
London 152 162 187 151 241 435 151 201 357
South East 112 124 135 119 135 162 116 130 152
South West 93 131 173 109 143 195 105 139 180
Wales, Midlands, East of England 79 109 153 112 132 167 100 125 159
North East, North West 95 124 175 123 169 209 105 155 188
Scotland 84 108 143 93 117 151 85 108 146
Total for all regions 93 121 160 114 151 222 104 138 181
Very large firms 127 155 253 111 172 251 118 170 251
TABLE 3.
3 Fees per fee earner (£000s)
Table 3 shows the fees generated per fee earner in the surveyed firms. Overall, the median figure was £138,000 which is only £2,000 more than the figure reported in the survey last year. This suggests that, so far, there has been very little improvement in productivity. It is no surprise to see that for small firms the median was £121,000, while for large firms the figure was £151,000. In very large firms, the median was £170,000. The difference between being upper quartile across all firms at £181,000 and the £104,000 achieved at the lower quartile point equates to a 74% difference.
Once again, there were very significant regional differences. The overall median in London was £201,000 while the equivalent figure in Scotland was £108,000. In all firms, it is important that there is constant measurement between the fees generated per fee earner with the salary cost of that fee earner. The danger is that as fees increase, the cost of the fee earners will grow at the same or an even faster rate and there will be no improvement in profitability.
11L AW F I R M S F I N AN C I AL B E N C H M AR K I N G R E P O RT 2015
Median fees are up 5%
5%

REGION SMALL LARGE TOTAL
LQ Median UQ LQ Median UQ LQ Median UQ
London 271 405 537 860 1,172 2,285 457 870 1,399
South East 237 364 423 425 540 786 340 439 637
South West 176 263 456 418 510 822 264 422 638
Wales, Midlands, East of England 220 283 451 455 548 780 269 457 619
North East, North West 201 303 417 559 1,086 1,824 369 616 1,347
Scotland 185 248 379 370 406 729 232 334 503
Total for all regions 196 299 455 448 662 1,123 298 473 835
Very large firms 595 853 1,439 605 953 2,019 593 871 1,717
TABLE 4.
4 Fees per equity partner (£000s)
Table 4 shows the fees generated per equity partner and there is considerable variation across the regions and across the different sizes of firm. The median figure across all firms was £473,000 compared to the median in the survey last year of £425,000 which shows a healthy 11% rise. Given that there has only been a small increase in fees per fee earner, this suggests that the majority of the rise has been generated by an increase in gearing. This is what firms tend to do when more revenue is generated. However, there is likely to be a greater impact on profitability if the additional fees were dealt with by the existing fee earners by focusing more on the productivity of existing fee earners. While the median figure is £473,000, the lower quartile figure is £298,000 and the upper quartile figure is £835,000 – nearly three times the figure achieved at the lower quartile point. It is important for firms to focus more on the billings of the equity partner and their team, rather than simply on the personal billings of the partner. If partners are too focused on achieving their own personal targets for billings, there is a risk that the team as a whole could fall short of its target.
The London figures were consistently higher than for other regions. The upper quartile figure for large firms in London, at more than £2 million, should be noted because this is even higher than the upper quartile figures achieved for the very large firms. At the other end of the spectrum, the lower quartile figures in the South West at £176,000 and in Scotland of £185,000 revealed a very significant difference in this measure between the best and the worst firms.
The median figure of £473,000 implied that gearing averages 3.43 since, as has already been stated in Table 3, the annual fees per fee earner were £138,000. The equivalent gearing figure in the survey last year was 2.88 so this shows an increase in gearing of about 19%. Fees per equity partner have therefore increased because of more fee earners, rather than increased productivity.
12 L AW F I R M S F I N AN C I AL B E N C H M AR K I N G R E P O RT 2015
Fees per equity partner is another useful measure. It combines the fees generated per fee earner with the number of fee earners working for each equity partner to calculate the revenue generated by the equity partner and their team, as shown in the following formula:
Fees per equity partner = Fees per fee earner x Gearing

REGION SMALL LARGE TOTAL
LQ Median UQ LQ Median UQ LQ Median UQ
London 96 111 118 97 102 115 97 104 116
South East 96 99 106 99 105 111 97 103 111
South West 92 102 112 97 106 113 95 104 113
Wales, Midlands, East of England 98 105 108 99 104 111 98 105 111
North East, North West 93 106 112 94 107 114 93 107 113
Scotland 98 101 111 100 109 124 98 105 114
Total for all regions 96 104 112 98 106 114 97 105 113
Very large firms 101 107 115 100 106 110 100 107 113
TABLE 5.
5 Fees as a % of previous year’s fees
SECTION 1 F E E S
Prior to the recent economic slowdown, historically it was true in many legal businesses that the profit for the year was often fairly close to the figure earned in bank interest. In other words, the law firm would cover its expenses with the fees earned and the profit would come from the premium interest earned on client account. The last few years have seen significant falls in transactional work which has resulted in law firms holding less client money. This, coupled with the fall in interest rates, has meant that the amount of interest being earned has fallen to very low levels compared to the past. This has also meant that numerous firms have had to look again at how they make money from legal services, and to become less reliant on the interest earned on client account.
13L AW F I R M S F I N AN C I AL B E N C H M AR K I N G R E P O RT 2015
What has happened to total fees since last year – has growth returned? Given that the survey is comparing figures achieved in a year ending in 2014 with a year ending in 2013, it would be expected that growth would now have returned. Larger increases may follow in later years once the economy is growing more strongly.
Table 5 shows what has happened to fee growth. Overall, the median figure shows growth of 5%, which is now running at a higher rate than inflation, suggesting that real growth has returned. In last year’s survey, the median growth rate was just 3% which roughly matched the inflation rate at that time.
While the overall median records growth of 5%, the lower quartile position showed a drop of 3% in fee income and the upper quartile position showed growth of 13%. The median growth rate for small firms was 4%, for large firms it was 6% and for very large firms it was 7%. It is difficult to explain why the larger firms are seeing more growth but it might be because they are better at business development and marketing, and are therefore picking up more of the available work. It could also be that they are simply more confident at pricing and billing work than the smaller firms.
Median growth rates of about 5% were seen across England and Wales but it is interesting to see that this rate of growth was the same across all regions. There certainly does not seem to be a notable difference between London and the rest of the country which might have been anticipated.

14 L AW F I R M S F I N AN C I AL B E N C H M AR K I N G R E P O RT 2014
Of the total delegates asked, 81% believe that fees per fee earner will increase next year and 80% believe that fees will increase. The confidence is the same on the two measures while the experience for this years’ survey is that fee income is growing faster than fees per fee earner.
In larger firms, 33% of people think that fee income will grow by over 10% next year while the equivalent figure is just 20% in small firms. The figure is even lower from the advisors, where just 22% think fee growth will exceed 10%.
Predictions from the NatWest
conferences – what will happen in
2015?
Fee income – % movements in 2015
FEES < £1.5 MILLIONFees per fee earner 0 0 4 12 69 14 0 Fee income 0 0 6 16 54 20 4
FEES > £1.5 MILLIONFees per fee earner 2 0 4 11 57 25 2 Fee income 2 0 4 13 44 33 4
ADVISORSFees per fee earner 0 0 11 16 59 14 0 Fee income 0 0 8 14 57 22 0
TOTALFees per fee earner 1 0 6 13 62 18 1Fee income 1 0 6 14 51 26 3
> -20 -10 to -20 -10 to 0 0 0 to 10 10 to 20 >20
At the autumn 2014 conferences, 62% of delegates anticipated that fees per fee earner would rise by 0-10% and 51% of delegates said that fee income would rise by 0-10%. These were good predictions, with fees per fee earner increasing by 1.5% and fee income increasing by 5%.
The predictions from the survey can be seen below.
REGION SMALL LARGE TOTAL
LQ Median UQ LQ Median UQ LQ Median UQ
London 0.06% 0.33% 1.63% 0.00% 0.09% 0.94% 0.00% 0.15% 0.96%
South East 0.14% 0.67% 1.44% 1.34% 2.41% 3.61% 0.42% 1.59% 3.20%
South West 0.11% 0.78% 1.57% 0.21% 0.73% 1.77% 0.20% 0.74% 1.63%
Wales, Midlands, East of England 0.16% 0.53% 1.20% 0.53% 1.21% 1.94% 0.21% 0.85% 1.54%
North East, North West 0.04% 0.27% 1.85% 0.02% 0.27% 1.24% 0.02% 0.27% 1.33%
Scotland 0.00% 0.22% 0.47% 0.06% 0.15% 0.57% 0.01% 0.19% 0.52%
Total for all regions 0.08% 0.40% 1.29% 0.06% 0.66% 1.55% 0.07% 0.51% 1.46%
Very large firms 0.16% 1.12% 2.02% 0.04% 0.28% 0.87% 0.04% 0.66% 1.39%
TABLE 6.
6 Interest received as a % of fees
Table 6 shows just how little was earned in interest. The median figure was 0.51% of fee income which is a slight increase on last year’s figure of 0.43%. Table 4 showed that fees per equity partner totalled £473,000 which suggests that the interest earned per partner at 0.51% of fee income would be just £2,412. The increase, although not large, tends to support the suggestion that volumes of transactions have increased and, with this, firms have been holding larger client account balances. The median figure in the South East at 1.59% was three times higher than the overall median figure – part of this was probably due to the higher property prices in the South East.

SECTION 2
Profit
Key questions to consider1. Have we benchmarked our performance against comparable firms and have we identified where we are below the upper quartile point?
2. Are we under-recording how we spend our time and therefore not showing clients the full extent of our efforts?
3. How can we get a better rate per hour for what we do, and do we understand creative fees?
4. Do we use matter planning tools which help us to understand the profitability of the work we are doing?
5. Do we have a clear strategy?

Profit is the most important measure because this is the money that is shared among the partners. It is amazing how many firms focus too much on fees and not enough on profit.
Historically, this is because firms have found it easier to measure fees billed than to calculate the profit earned for different types of work – both for individual matters and for different fee earners.
A common starting point is to look at the profit available for the equity partners as a percentage of fee income. The helpful rule of thumb has always been that good firms will make 33%, average firms will make 25%, and the figure for under-performing firms will be even lower.
REGION SMALL LARGE TOTAL
LQ Median UQ LQ Median UQ LQ Median UQ
London 18 30 42 22 28 40 20 28 42
South East 12 23 30 18 24 34 15 23 33
South West 18 26 33 13 24 32 16 25 33
Wales, Midlands, East of England 16 24 29 14 23 30 15 23 30
North East, North West 12 23 31 9 20 27 11 20 28
Scotland 17 26 36 21 28 33 18 26 35
Total for all regions 15 25 34 16 24 32 15 24 33
Very large firms 17 24 28 20 27 35 19 25 32
TABLE 7.
7 Profit as a % of fees
PROFIT
A better way of looking at profit is to calculate it as profit per equity partner (PEP). Some surveys now calculate profits per partner but as non-equity partners are not risk takers, and are effectively just higher paid fee earners, such a calculation is perhaps not as useful. Where the business in the survey is incorporated, we have assumed the number of shareholders to be the number of equity partners.
16 L AW F I R M S F I N AN C I AL B E N C H M AR K I N G R E P O RT 2015
Median PEP is up to £107k
107k
Table 7 provides some feedback on current performance. In total, the upper quartile score is 33%, the median figure is 24% and the lower quartile figure is 15%, compared to 31%, 23% and 12% last year. These numbers reinforce the validity of the traditional model and, as in previous reports, they demonstrate that five difficult years have not destroyed the legal profession. Instead, the profession is bouncing back and is delivering margins closer to the traditional norms. Now, the challenge is to improve margins still further. What is of more interest in Table 7 are the significant regional variations. While the overall median figure is 24%, in London it is 28%, in Scotland it is 26%, and in the North East & North West it is just 20%.
Small firms have a median margin of 25% while large firms have a median margin of 24%. The very large firms also have a median of 25%. So, it is interesting to note that the margin is fairly constant across all sizes of firm. This supports the view that the size of a firm is irrelevant to its ability to make profit. The priority is to make sure that all work is done in the most profitable way.

SECTION 2 P RO F I T
17L AW F I R M S F I N AN C I AL B E N C H M AR K I N G R E P O RT 2015
REGION SMALL LARGE TOTAL
LQ Median UQ LQ Median UQ LQ Median UQ
London 61 107 171 209 385 538 111 271 471
South East 38 59 128 112 145 184 56 119 163
South West 43 72 93 73 117 194 56 93 136
Wales, Midlands, East of England 42 71 105 72 126 187 54 86 137
North East, North West 41 69 108 60 180 353 49 112 259
Scotland 43 70 87 86 121 153 55 84 121
Total for all regions 42 71 108 82 148 264 55 107 190
Very large firms 105 174 362 160 233 521 131 210 438
TABLE 8.
8 Profit per equity partner (PEP) (£000s)
REGION SMALL LARGE TOTAL
LQ Median UQ LQ Median UQ LQ Median UQ
London 16 32 46 2 7 20 3 12 30
South East 8 16 37 1 3 6 2 5 16
South West 10 25 31 1 3 6 2 7 25
Wales, Midlands, East of England 6 18 33 1 3 5 2 5 25
North East, North West 8 16 49 1 8 46 3 11 48
Scotland 9 16 33 0 1 2 2 9 18
Total for all regions 9 18 36 1 3 10 2 8 26
Very large firms 1 2 6 0 1 2 0 1 5
TABLE 9.
9 Increase in profit per partner from 2013 (%)
Table 8 shows that the median profit per equity partner across all firms was £107,000 with small firms achieving a median of £71,000 and large firms achieving a median of £148,000. In last year’s survey, the median figure across all firms was £87,000 and the year before it was £90,000, so to burst through the £100,000 barrier is a sign of much improved trading conditions. Among very large firms, the smaller ones achieved a median of £174,000 while the larger ones achieved a median of £233,000. The difference between the largest firms (£233,000) and the smallest firms (£71,000) was more than three times per equity partner at the median level.
Not surprisingly, once again there was a very significant regional variance. The median figure for all firms was £107,000 but this dropped to £84,000 in Scotland and £86,000 in Wales, Midlands & East of England, and rose to £271,000 in London. The figure in the South East at £119,000 was only marginally higher than the figure in the North East & North West at £112,000. It is always interesting to look at the upper quartile figures to see what can be achieved. The figure for London at £471,000 is more than three times the figure of £136,000 in the South West and nearly four times the figure of £121,000 in Scotland.
There is considerable debate about the structure of law firms and whether one structure is better than another. We did calculate the median PEP figure for firms with different legal structures. The figure for LLPs is more than 50% higher than the comparable figure for traditional partnerships. The results are shown in the table on the right.
Legal Structure Median profit per equity partner (£000s)
Partnership 83
LLP 127
Company 97
Sole Practitioner 80
Total for all firms 107
Table 9 looks at how profits compared to the previous year’s. The overall median increase was 8%. Small firms have fared much better at 18%, while large firms have seen an increase of just 3%. The very large firms have seen an increase in profits of only 1%. Although firms would like their profits to rise more quickly, it is reassuring that they are going up faster than inflation and that they have stopped falling which was the case in the first couple of years after the slowdown. If overheads are now properly under control, then it is not unreasonable to expect to see some further significant increases in profits once steady growth is achieved in fee income. Fees were up by 5% but profits have only increased by 8%. If the increase in fees arose from an increase in productivity, then profits would rise at three to four times the rate of the increase in fees. This is why there needs to be more emphasis on productivity.
Variable 1: GearingThe first variable is referred to as either gearing or leverage. It is a number, representing the size of each team in the firm including the equity partner. So, if a partner manages two fee earners, they have gearing of three; if they manage five fee earners, they would have gearing of six. Clearly, the larger the team, the more it can bill and the more profit it can make. The reason why gearing is not normally a high number is to do with the complexity of the work. Only simple legal work can be done with huge gearing; more complicated work requires more supervision and experience.
Variable 2: Chargeable hoursThe second variable is the annual recorded chargeable hours per fee earner. If everyone is busy, and confident in recording their time, then the number will be high. If there is a shortage of work, or if people are slack over their time recording, then the recorded hours will be lower. It is not surprising that the firms who pay the most seem to get the most hours recorded. When the first two variables are multiplied together, you are calculating the annual hours generated by each partner through their team.
Understanding and benchmarking profitabilityAn example model:
SMALL FIRM PEP
= £96,000
LARGE FIRM PEP
= £504,000
GEARING
X
HOURS
X
RECOVERED RATE/HOUR
X
5.00
1,400
£240
30%
4.00
1,000
£120
20% XMARGIN
PEP
=
18 L AW F I R M S F I N AN C I AL B E N C H M AR K I N G R E P O RT 2015

Variable 3: Recovered rate per hourThe third variable is the recovered rate per hour billed. The higher this rate, the greater the profit margin. Clearly, complex work can demand a higher rate than routine tasks. Some firms like to break this variable down into the recorded rate and the percentage of this rate that has been billed. In other words:
Variable 4: Profit marginThe final variable is the profit margin. This is the percentage of the fee which ends up as net profit. It is the efficiency with which a firm turns fees into profit. If the firm is efficient, then the net profit margin will be high, whereas inefficiences can cause the margin to drop into negative figures. The numbers used in the example model opposite
REGION SMALL LARGE TOTAL
LQ Median UQ LQ Median UQ LQ Median UQ
London 1.50 2.50 3.00 2.89 4.20 7.17 2.15 3.88 5.55
South East 1.88 2.50 3.00 3.17 4.17 6.19 2.45 3.21 4.88
South West 1.33 2.00 2.55 2.37 3.75 6.50 2.00 2.55 4.50
Wales, Midlands, East of England 1.92 2.50 4.00 2.50 3.75 5.56 2.00 3.33 5.00
North East, North West 1.13 2.50 4.38 3.58 6.67 9.50 2.43 4.55 8.00
Scotland 1.75 2.00 3.50 2.72 4.39 5.31 2.00 2.80 4.94
Total for all regions 1.50 2.50 3.63 2.74 4.31 6.85 2.00 3.41 5.21
Very large firms 3.53 5.43 7.90 3.92 5.24 7.21 3.65 5.30 7.65
TABLE 10.
10 Gearing
Table 10 shows how gearing varies with size of firm and by region. The median figure for all firms was 3.41 compared with a figure of 2.88 in last year’s survey. This number is still lower than it might be but there has been a significant increase of 18% since last year. As work volumes pick up, many firms will need to focus on getting this variable back up to a more sensible figure as clients are not going to be willing to pay a partner to do the more routine work that needs to be done on a file. The figure should not however be increased until everyone is working at capacity as it is always better if additional work can be resourced with the existing fee earners, before recruiting new people.
It is particularly interesting to see that the median figure in small firms was 2.5, while in large firms it was significantly higher at 4.31. The figure became even higher in the very large firms where the median was 5.31. Once again, insight was gained into what might be possible if the upper quartile figures were reviewed. In large firms, the upper quartile figure was 6.85 but this varied regionally and went up to 9.5 in the North East & North West. This figure was nearly three times higher than the median for all firms at 3.41.
= XRecovered
rate per hour
Recorded rate per
hourRealisation
%
(With realisation % being the percentage of time recorded that can be billed)
show that to go from a PEP of about £100,000 to a PEP of about £500,000 does not require a fivefold increase in all of the variables. Relatively small increases in one or more of the variables can deliver very significant improvements in profitability. That is why firms should regularly benchmark against their competitors, so they can identify where improvements are most easily made.
The multiple of the first three variables determines the fees billed by the partner in the year.
Staffing ratios are important and all firms need the right mix of fee earning and non-fee earning staff. Traditionally, firms would have had about the same number of fee earners as support staff. In recent times, although there are fewer secretaries, firms have had to recruit new people in business development, information technology and other management roles. So, when all roles are considered, perhaps nothing has really changed. This is very different to large accountancy firms where fee earners account for 75% of the total head count.
SECTION 2 P RO F I T
19L AW F I R M S F I N AN C I AL B E N C H M AR K I N G R E P O RT 2015

REGION SMALL LARGE TOTAL
LQ Median UQ LQ Median UQ LQ Median UQ
London 38 50 62 43 58 68 41 55 66
South East 43 50 71 46 51 66 46 50 66
South West 45 50 64 35 47 58 37 50 60
Wales, Midlands, East of England 37 50 55 35 43 53 35 45 55
North East, North West 40 50 59 39 51 60 40 50 60
Scotland 34 50 65 53 64 77 38 55 67
Total 38 50 60 39 50 63 38 50 61
Very large firms 29 46 51 44 55 66 37 49 63
TABLE 10.
11 Fee earners as a % of total headcount
REGION SMALL LARGE TOTAL
LQ Median UQ LQ Median UQ LQ Median UQ
London 1,000 1,000 1,000 1,000 1,000 1,258 1,000 1,000 1,086
South East 754 985 1,007 810 1,000 1,000 800 1,000 1,000
South West 946 1,000 1,133 990 1,000 1,100 980 1,000 1,100
Wales, Midlands, East of England 775 930 1,000 857 964 1,000 822 945 1,000
North East, North West 953 1,000 1,039 941 1,000 1,000 938 1,000 1,000
Scotland 775 1,000 1,000 775 806 986 763 972 1,000
Total 833 1,000 1,000 900 1,000 1,007 880 1,000 1,000
Very large firms 919 985 1,125 970 1,000 1,156 948 1,000 1,156
Fees will only be maximised if fee earners are recording all of their time. If clients cannot see the effort which has been made, then they are unlikely to pay for this effort. Full time capture is the most basic thing for fee earners to do properly but most of them still massively under-record their time. Different firms have different working cultures but most fee earners are asked to work a minimum of 7.5 hours per day. When holidays (seven weeks including Bank Holidays) and weekends are taken into account, there are still 225 working days in a year so this suggests a capacity of 1,688 hours per year. Fee earners will spend time on business development, know-how and training, as well as having some sick days, but equally they may work additional hours either in or away from the office.
Table 11 provides an update on the relationship between fee earners and non-fee earners. Across all firms, 50% of people were fee earners, meaning that 50% were non-fee earners – this reinforces the traditional view of a 50/50 split. In the very large firms, 49% of people were fee earners, which would suggest that they have achieved no real economies of scale. There was no difference between small and large firms. There were significant regional variances, too. In London and Scotland, 55% were fee earners compared with Wales, Midlands & East of England at 45%.
20 L AW F I R M S F I N AN C I AL B E N C H M AR K I N G R E P O RT 2015
Table 12 shows the level of chargeable time being recorded and highlights that a considerable amount of time has been lost. The overall median figure of 1,000 hours per fee earner equates to 4.4 hours per working day. This does not tally with what most fee earners will tell you about working hard on client matters for most of every working day. There did not appear to be much regional variance in these figures and they were also very similar to last year. With increasing activity, it would have been expected that this figure would rise. A possible explanation is that the increase in gearing has held back the increase in hours, as it will take a certain period for new people to reach full capacity.TABLE 10.
12 Recorded chargeable hours per fee earner

REGION SMALL LARGE TOTAL
LQ Median UQ LQ Median UQ LQ Median UQ
London 156 163 192 135 203 393 139 180 317
South East 120 138 183 118 165 201 119 155 185
South West 91 139 175 104 142 168 102 142 171
Wales, Midlands, East of England 96 115 158 121 142 187 111 134 176
North East, North West 82 131 162 127 171 223 106 158 200
Scotland 121 143 163 121 130 158 119 143 165
Total for all regions 99 143 172 122 156 211 114 150 191
Very large firms 124 167 217 140 187 255 134 180 245
13 Recovered rate per hour (£)
Table 13 shows the recovered rate per hour. The median recovered rate for all firms was £150 which represented an increase of £10 on the figure in last year’s survey. If the realisation rate was 80%, which is a common figure, this implies a headline rate of £188 with a further £38 discount at the point of billing. There was some variance by region, with a London median figure of £180 while in Wales, Midlands & East of England that figure was £134. Small firms had a median figure of £143 while large firms had a median of £156. The figure for very large firms was higher again at £180, but it is surprising to see that the median for the largest firms was only £187. The explanation may be that very large firms have much higher levels of gearing as seen in Table 10. As gearing increases, the average rate per hour is always likely to fall.
TABLE 14.
14 Profit per equity partner (PEP) (£000s) (using upper quartile benchmarks for all regions )
SMALL LARGE TOTAL
LQ Median UQ LQ Median UQ LQ Median UQ
Gearing 1.50 2.50 3.63 2.74 4.31 6.85 2.00 3.41 5.21
Hours 833 1,000 1,000 900 1,000 1,007 880 1,000 1,000
Recovered rate (£) 99 143 172 122 156 211 114 150 191
Margin % 15 25 34 16 24 32 15 24 33
Total PEP (£000s) 19 89 212 48 161 466 30 123 328
Very large firms
Gearing 3.53 5.43 7.90 3.92 5.24 7.21 3.65 5.30 7.65
Hours 919 985 1,125 970 1,000 1,156 948 1,000 1,156
Recovered rate (£) 124 167 217 140 187 255 134 180 24
Margin % 17 24 28 20 27 35 19 25 32
Total PEP (£000s) 68 214 540 106 265 744 88 238 693
Clients continue to put all suppliers, including their law firms, under pressure on fees. Indeed, commercial clients are often better at negotiating fees than solicitors, many of whom have never really had to negotiate hard on fees until relatively recently. There continues to be significant push back on charging hourly rates, and clients and the courts are looking for more certain and creative ways of charging. It seems unlikely that this price pressure is going to disappear any time soon.
SECTION 2 P RO F I T
21L AW F I R M S F I N AN C I AL B E N C H M AR K I N G R E P O RT 2015

Table 14 calculates what the PEP figure would be for different sized firms if they achieved lower quartile, median or upper quartile performance for each of the four drivers of profitability. While it is difficult to be the best at everything they do, firms should be able to achieve upper quartile performance in all areas. The table shows that achieving upper quartile performance will deliver a PEP figure about 10 times larger than what would be achieved at the lower quartile level in all sizes of firm.
Similar calculations can be done by region. For all firms with upper quartile performance, the PEP would be as seen in Table 15 below. Most firms would look at these PEP figures and wonder how they could achieve such a result; the answer lies in the four variables that provide this result. As every firm is different, the result might be achieved with a slightly different mix of the four variables to reflect the nature of the clients and the work being undertaken. The table demonstrates that in most regions, if all of the four variables are at the upper quartile point then the PEP will be close to £300,000. The figure in London was driven significantly higher because much higher rates can, in turn, deliver a higher margin.
REGION
Gearing Hours recorded Margin (%) PEP (£000s)
London 5.55 1,086 317 42 802
South East 4.88 1,000 185 33 298
South West 4.50 1,100 171 33 279
Wales, Midlands & East of England 5.00 1,000 176 30 264
North East, North West 8.00 1,000 200 28 448
Scotland 4.94 1,000 165 35 285
Total for all regions 5.21 1,000 191 33 328
TABLE 11.
15 PEP with upper quartile performance (£000s)Recovered
rate (£)
The predictions made in the autumn of 2013 for 2014 showed that the most likely outcome was a 0–10% increase in PEP, gearing, hours, recovered rate and margin. If the gearing, hours, recovered rate and margin had all increased by 0-10%, then the PEP would almost certainly have increased by a far larger percentage. The reality in 2014 is that gearing has increased by 18%, hours have remained unchanged, rates have increased by 6% and the margin by 1%.The predictions from the autumn 2014 conferences for 2015 are shown opposite. The predictions are very similar to those made last year and, once again, there seems to be more confidence that hours will go up, rather than rates, which was not what actually happened in 2014.
22 L AW F I R M S F I N AN C I AL B E N C H M AR K I N G R E P O RT 2015

The table highlights that large firms were far more confident about significant increases in profit than small firms. 34% of large firms believed that profits per equity partner would increase by more than 10% while the figure in small firms was half of that at 17%. Advisors are even more pessimistic about the future, with only 11% believing that profit per equity partner would increase by more than 10%. The fact that large firms have more confidence in their ability to increase profits substantially is interesting – in Table 9, we saw that small firms recorded a median increase in profits of 18% which was six times higher than the figure for large firms at 3%.
Delegates at the NatWest conference were asked whether they had a detailed time recording policy which gave fee earners detailed advice on exactly how all time should be recorded. The lack of this type of policy is one of the main reasons for the under-recording of time. The survey showed that, in total, only 36% of firms believed that they have a detailed policy. In larger firms this rose to 49%, while the figure was just 20% in smaller firms. Without full and consistent time recording, firms are likely to produce misleading data. They may also struggle to bill clients fairly, and to understand the true profitability of the work being undertaken.
Another issue which will impact on profits over a longer period of time is whether there is a detailed business plan in place covering the next three to five years. Budgets are there to manage performance over the next 12 months but it is important to plan over longer periods, too. As the economy improves, it will be important for firms to make the right strategic decisions if they are to maximise their returns from this growth. Across all firms, 90% claimed to have a detailed business plan with little difference recorded between small and large firms.
It is important that all partners are motivated to deliver marginal increases in profit. This is going to be achieved more easily if profits are shared in line with partner performance. It was interesting to see that just 29% of firms felt that profit sharing was linked to partner performance. In small firms this dropped to 23%, and in large firms it was 35%. Perhaps this is an area that firms could review in the future?
Predictions from the NatWest
conferences – what will happen in
2015?
FEES < £1.5 MILLIONProfit per equity partner 0 0 8 29 46 15 2Gearing 0 0 8 40 48 4 0Hours 0 0 2 33 55 8 2Recovered rate 0 2 0 47 43 8 0Margin 0 0 4 26 50 20 0
FEES > £1.5 MILLIONProfit per equity partner 2 2 2 17 44 28 6Gearing 0 7 0 38 44 5 5Hours 0 0 4 28 54 14 0Recovered rate 2 0 4 27 56 13 0Margin 0 0 4 27 56 13 0
ADVISORSProfit per equity partner 0 3 14 19 54 8 3Gearing 0 11 24 32 30 3 0Hours 0 0 8 21 59 10 3Recovered rate 0 0 15 51 33 0 0Margin 0 3 22 46 30 0 0
TOTALProfit per equity partner 1 1 7 22 47 18 4Gearing 0 6 9 37 42 4 2Hours 0 0 4 28 56 11 1Recovered rate 1 1 6 41 46 6 0Margin 0 1 8 32 47 12 0
Profit & profit drivers – % movements in 2014> -20 -10 to -20 -10 to 0 0 0 to 10 10 to 20 > 20
SECTION 2 P RO F I T
23L AW F I R M S F I N AN C I AL B E N C H M AR K I N G R E P O RT 2015

SECTION 3
Lock-up
Key questions to consider1. Given that clients don’t want nasty shocks when they are billed, why do we wait so long before we talk about money?
2. Do fee earners have the necessary management information available to manage lock-up?
3. Are the appropriate ‘carrots and sticks’ in place to deliver improved lock-up?

SECTION 3 LO C K-U P
17 Debtor daysREGION SMALL LARGE TOTAL
LQ Median UQ LQ Median UQ LQ Median UQ
London 18 38 67 44 68 101 34 58 99
South East 27 42 56 32 38 49 31 39 53
South West 25 30 50 29 44 61 26 44 59
Wales, Midlands, East of England 36 49 68 36 49 66 35 49 67
North East, North West 28 43 71 31 52 88 29 50 80
Scotland 28 39 58 47 64 79 33 47 70
Total for all regions 27 42 65 34 50 80 30 47 73
Very large firms 41 52 96 46 75 91 44 68 94
REGION SMALL LARGE TOTAL
LQ Median UQ LQ Median UQ LQ Median UQ
London 21 56 66 25 58 106 23 57 101
South East 25 29 51 22 55 72 23 48 65
South West 27 49 58 33 64 100 27 55 85
Wales, Midlands, East of England 33 50 88 49 65 103 36 55 102
North East, North West 25 48 68 63 116 223 42 82 169
Scotland 20 42 55 48 54 73 25 49 69
Total for all regions 27 47 70 41 67 115 31 55 98
Very large firms 51 76 95 32 62 98 38 67 97
ABLE 15.
16 Work in progress (WIP) days
Table 16 shows the amount of WIP days being carried in firms. This is a measure of how long it takes from the recording of an hour to the billing of that hour. The total median figure was 55 days (up from 52 days last year) while the lower quartile position was 31 days and upper quartile performance was 98 days. It is interesting to see how performance worsens as firms get larger: the median for small firms was 47 days, and for both large and very large firms it was 67 days. There was also some variance by region – the South East led the way at 48 days while firms in the North East & North West took 82 days.
The figures were consistently higher than last year so firms need to act now. When work volumes pick up, there is a tendency to focus on finding the resources to get the work done, placing less focus on managing billing and WIP.
25L AW F I R M S F I N AN C I AL B E N C H M AR K I N G R E P O RT 2015
109days
Lock-up is up two days to 109 days
LOCK-UP
The vast majority of legal firms fail to manage lock-up effectively, and consequently provide far too much credit to clients. This, in turn, can potentially generate cash flow problems. Having said that, lawyers are naturally cautious
and do not like borrowing money. The result of all of this is that firms will often require considerable capital from the partners, and there will need to be some delay between generating profits and those profits being distributed to the partners.
If cash flow could be improved, there is likely to be less pressure on the firm and lower levels of capital would be required.

FEES < £1.5 MILLIONWIP Days 0 2 2 47 39 8 2Debtor Days 0 2 8 43 31 10 6
FEES > £1.5 MILLIONWIP Days 0 0 15 42 26 17 0Debtor Days 0 0 20 30 26 20 4
ADVISORSWIP Days 0 8 24 34 29 5 0Debtor Days 0 0 26 42 24 8 0
TOTALWIP Days 0 3 13 41 31 11 1Debtor Days 0 1 17 38 27 13 4
REGION SMALL LARGE TOTAL
LQ Median UQ LQ Median UQ LQ Median UQ
London 49 99 130 96 148 173 85 132 170
South East 73 103 107 57 91 128 63 91 115
South West 49 56 106 87 105 139 60 91 125
Wales, Midlands, East of England 80 98 143 103 119 153 89 112 150
North East, North West 76 99 124 109 189 341 89 128 228
Scotland 57 81 106 98 120 148 66 96 127
Total for all regions 62 91 124 91 125 175 77 109 153
Very large firms 105 127 164 106 144 170 106 132 170
TABLE 17.
18 Total lock-up days (WIP + debtor days)
Table 17 provides feedback on debtor days. This is a measure of how many days it takes to get a bill paid from date of issue. The median figure was 47 days which is the same as last year; it fell to 30 days at the lower quartile level and rose to 73 days at the upper quartile level. Once again, it is interesting to see how the larger firms are less successful at managing this: the median for small firms is 42 days, for large firms 50 days, and for very large firms 68 days. While the very large firms tend to be more profitable than smaller firms, they are not as successful at managing cash flow – possibly because more people need to be managed. Perhaps more time needs to be spent training fee earners on what they should be doing to manage cash flow more effectively, and how to get clients to settle their bills?
Table 18 provides statistics on total lock-up figures. This measures in days how long it takes from a fee earner recording an hour, to the cash being received from the client. We see that the total median figure was 109 days which is an increase of two days from last year. For small firms the figure was 91 days, for large firms it was 125 days and for very large firms it was 132 days. This evidence confirms that larger firms struggle to manage cash flow compared to smaller firms. All fee earners need to think about what they can do with their clients to increase money on account, to accelerate billing and to take a more active role in credit control.
Predictions from the NatWest
conferences – what will happen in
2015?
Lock-up – % movements in 2015> -20 -10 to -20 -10 to 0 0 0 to 10 10 to 20 > 20
A reduction in debtor and WIP days would be a positive thing and could help to improve cash flow. The way the question was posed, a positive score is measured as an improvement. Across the whole survey, 43% of people thought that WIP days would improve and 44% believed that debtor days would improve. It is interesting to note that these numbers fell to 34% and 32% respectively from the advisors. This shows that advisors have less confidence in firms being able to improve their lock-up than the firms themselves. Just 4% of small firms thought that WIP days would deteriorate compared to 15% of large firms. Among advisors, 32% thought that WIP days would worsen.
26 L AW F I R M S F I N AN C I AL B E N C H M AR K I N G R E P O RT 2015

SECTION 4
Finance
Key questions to consider1. Do we have sufficient capital to run the business now, and will we need more capital if the firm grows again?
2. Is it time to look again at our legal structure and how capital is to be retained within the firm?
3. Is it right that we aim to fully distribute profits?
4. Do we need to reconsider how quickly new partners are asked to contribute capital and how quickly departing partners can extract their capital?

Firms fail when they run out of money. Not making a profit is unlikely to cause the sudden collapse of a firm but running out of money can cause immediate failure. All firms should therefore monitor their bank balance at all times, and prepare regular cash flow forecasts to make
FINANCE
REGION SMALL LARGE TOTAL
LQ Median UQ LQ Median UQ LQ Median UQ
London 4 38 76 -174 221 511 -19 71 427
South East 7 36 179 175 407 819 25 187 564
South West -11 20 112 -41 146 240 -17 35 195
Wales, Midlands, East of England -16 31 97 -222 1 250 -64 25 168
North East, North West 4 60 135 2 88 309 2 70 277
Scotland -22 4 71 4 78 504 -3 18 131
Total for all regions -3 26 113 -49 125 430 -11 56 240
Very large firms -105 240 574 0 352 1,599 -4 244 979
TABLE 18.
19 Year-end bank balance (£000s)
REGION SMALL LARGE TOTAL
LQ Median UQ LQ Median UQ LQ Median UQ
London 6 11 20 4 10 20 6 10 20
South East 7 13 27 9 13 22 8 13 24
South West 5 8 18 7 14 20 6 13 19
Wales, Midlands, East of England 7 14 20 4 10 15 6 11 16
North East, North West 5 19 31 5 12 20 4 13 23
Scotland 3 7 18 6 10 14 5 8 15
Total for all regions 6 12 21 5 11 18 6 11 19
Very large firms 8 11 17 8 10 18 8 10 17
TABLE 19.
20 Capacity in overdraft as a % of fees
Table 20 looks at the capacity to borrow more money, compared to annual fees, when considering the year-end office account balance and the overdraft facility available. It is interesting to note that the median figure, at 11% of fee income, represented about 40 days of income (compared to 33 days last year). The lower quartile point was about 22 days and the upper quartile point represented about 69 days of income. This highlights how quickly and easily many firms could become insolvent if their lock-up deteriorates by relatively small amounts.
sure that they can live within their agreed bank facilities. Although banks make money out of lending to businesses, they are unlikely to lend to firms on the verge of collapse. Law firms have always been fairly prudent and do not feel comfortable with too much debt. Table 19 shows the year-end bank balance of firms, where the median figure in total tells us there was £56,000 in the bank (compared to £20,000 last year). There was some regional variance here, too: the South East figure was £187,000 and the figure in Scotland was just £18,000.
28 L AW F I R M S F I N AN C I AL B E N C H M AR K I N G R E P O RT 2015
36%Borrowing as a percentage of capital is down to 36%

Firms can become less reliant on bank finance if more partner capital is introduced and retained. One way of benchmarking partner capital is to express it as a percentage of annual fees.
In Table 18, we saw that the median firm had total lock-up of 109 days – this could be financed by having partner capital equal to 30% of fees.
Banks are more comfortable where the percentage of borrowings against partner equity is lower, and where the partners can demonstrate that they clearly have a level of personal financial commitment to the firm.
SECTION 4 F I N AN C E
REGION SMALL LARGE TOTAL
LQ Median UQ LQ Median UQ LQ Median UQ
London 2 15 25 19 31 42 14 27 41
South East 10 21 41 13 27 37 13 26 39
South West 12 20 34 19 34 43 16 28 42
Wales, Midlands, East of England 14 22 36 17 24 30 16 23 33
North East, North West 26 34 47 15 27 40 16 29 40
Scotland 19 40 57 27 30 35 21 32 45
Total for all regions 14 26 44 16 28 39 16 27 40
Very large firms 19 27 37 26 32 42 23 28 41
TABLE 20..
21 Partner capital as a % of fees
REGION SMALL LARGE TOTAL
LQ Median UQ LQ Median UQ LQ Median UQ
London 0 0 73 4 13 44 0 11 45
South East 0 14 50 2 36 58 1 32 56
South West 0 3 28 3 36 87 0 26 57
Wales, Midlands, East of England 13 39 68 17 49 116 15 41 104
North East, North West 0 33 67 5 37 96 2 34 76
Scotland 12 39 98 40 73 128 27 52 111
Total for all regions 0 26 65 11 38 100 2 36 79
Very large firms 33 51 90 11 45 118 18 45 105
TABLE 21.
Bank borrowings as a % of real partner 22
29L AW F I R M S F I N AN C I AL B E N C H M AR K I N G R E P O RT 2015
Table 21 below shows the position for firms and the overall median figure was 27%. On this measure, Scottish firms had more capital than in any other region at 32% of annual fees.
In terms of size of firm, small firms had a median figure of 26%, large firms had a median of 28% and very large firms had a median of 28%. These results were in line with the higher levels of lock-up seen in larger firms in Table 18.
Table 22 shows the percentage of bank borrowings (including borrowed partner capital) as a percentage of real partner capital. The lower quartile figure for small firms was 0%, equivalent to no debt, while the median figure for all firms was 36%. The median figure of 36% was down from 41% in the previous year and could suggest that capital accounts are being restored, with a strategy to retain profits, which would be a good thing. The upper quartile figure for large firms in Scotland was 128%, showing borrowings which are in excess of real partner capital.
Firms in this position should think again about their facilities, the amount of capital being provided by the partners and the ability of the firm to manage lock-up. Their bank may become less happy to provide so much finance in future.

Many firms carry significant client account balances. While this money does not belong to the firm, a firm has been able to earn premium interest on such money held in general client account over and above what the individual clients would have got had their money been held in client account.
There have been some significant thefts from client accounts in recent months and all firms should be looking again at what they have done to best minimise the risk of this happening to them. Organised crime gangs are operating more sophisticated ‘phishing’ and ‘vishing’ attacks on law firms who are known to have significant cash balances.
REGION SMALL LARGE TOTAL
LQ Median UQ LQ Median UQ LQ Median UQ
London 44 119 355 11 40 255 12 62 301
South East 279 399 534 128 285 414 215 341 458
South West 175 234 367 75 131 188 89 174 261
Wales, Midlands, East of England 90 241 350 109 183 270 99 201 305
North East, North West 22 219 493 4 42 168 5 65 264
Scotland 71 142 275 12 65 219 31 136 236
Total for all regions 83 219 394 23 126 259 37 153 314
Very large firms 6 85 199 20 61 134 12 64 160
TABLE 22.
Client bank balance as a % of fees (£000s)
Table 23 shows the client bank balance at the year-end as a percentage of annual fees. The median figure for smaller firms at 219% was nearly double the median figure for larger firms at 126%. In the South East, the upper quartile figure for smaller firms was 534%, representing 5.3 years of fee income. The median figure for all firms was 153% with regional variances – these peaked at 341% in the South East while the North East & North West had the lowest median figure of 65%. Given that the survey covers firms with combined fees of £1.14 billion, this suggests that if client money balances are 153% of fees, then the client money held will be valued at about £1.74 billion.
zero +0-10% +10-20% >20%
Predictions from the NatWest
conferences – what will happen in
2015?
Firms’ bank balance – % movements in 2015 -10 to -20
FEES < £1.5 MILLIONBank balance 0 0 4 20 49 20 6
FEES > £1.5 MILLIONBank balance 0 2 6 20 39 26 7
ADVISORSBank balance 0 5 16 32 30 16 0
TOTALBank balance 0 2 8 24 40 21 5
Only 10% of people believed that office bank balances would fall over the next year and 66% believed that their bank balance would improve. This prediction conflicts with the predictions on lock-up where there was little confidence of there being any real improvement. It is still possible for firms to improve their bank balances by slowing down distributions, retaining profits and by asking partners for additional capital.
When asked if bank balances would fall, 4% of small firms and 8% of large firms agreed but this increased to 21% among advisors. Perhaps advisors better understand the financial impact on firms when work volumes and lock-up increases?
The returns in recent years have been considerably lower because of long-term low interest rates but this might change in the future. The amount of money held is also an indicator of how busy a firm might be and with what value of transactions.
> -20 -10 to 0 0 0 to 10 10 to 20 > 20
30 L AW F I R M S F I N AN C I AL B E N C H M AR K I N G R E P O RT 2015
23

We have already detailed how important it is for all firms to benchmark themselves against their peers in order to assess how well they are performing and to identify how financial performance can be improved.
We hope that this report provides the robust data required to undertake effective benchmarking, and that it offers practical advice on how to interpret the outputs and implement strategies to deliver improved financial performance.
To aid you in this objective, the following table gives you the ability to examine your own firm’s performance on a comparative basis against the upper quartile (UQ) output across total firms.
For some, the results may be worrying but will hopefully motivate the implementation of an action plan. For others, this exercise will serve to simply endorse the business plan and operational model already in place.
Conclusion
Research and methodologyWe analysed the financial data, representing the performance of 339 legal firms operating in the small-to-medium enterprise (SME) space, employing 15,200 people in total (including 1,807 partners), and covering year-end 2014. The total for all regions in each table represents the aggregate figure for all participating firms, across all regions. Further
details of the methodology of this report are available on request.
For the purposes of this report, those firms with fees of less than £1.5 million are described as ‘small’, while those with fees in excess of £1.5 million are described as ‘large’. The report also refers to ‘very large’ firms, those with fees in excess of £5 million.
UQ FIRM’S RATIO ACTIONS REQUIRED
Fees per equity partner (£000s) 835
Fees per fee earner (£000s) 181
Profit as % of fees (%) 33
Profit per equity partner (£000s) 190
Chargeable hours (per year) 1,000
Recovered rate per hour (£s) 191
LQ FIRM’S RATIO ACTIONS REQUIRED
WIP days 31
Debtor days 30
Total lock-up (days) 77
By phone: 020 7672 1917 Calls may be recorded. Call charges may vary. By email at [email protected]
Want to know more?If you have any comments on the contents of this report or would like to have a discussion on any aspect of the legal profession more generally please contact:
Steve Arundale, Head of Commercial Professional Sectors, NatWest

DISCLAIMERThe author, Robert Mowbray, is a chartered accountant who has worked for professional firms for more than 30 years. Opinions expressed in this publication are those of the author and not necessarily those of NatWest or the publisher. The contents of this document are indicative and are subject to change without notice. This document is intended for your sole use on the basis that before entering into this, and/or any related transaction, you will ensure that you fully understand the potential risks and return of this, and/or any related transaction, and determine it is appropriate for you given your objectives, experience, financial and operational resources, and other relevant circumstances. You should consult with such advisors as you deem necessary to assist you in making these determinations. NatWest will not act as your advisor or owe any fiduciary duties to you in connection with this, and/or any related transaction, and no reliance may be placed on NatWest for advice or
recommendations of any sort. NatWest makes no representations or warranties with respect to the information and disclaims all liability for any use you or your advisors make of the contents of this document. NatWest and its affiliates, connected companies, employees or clients may have an interest in financial instruments of the type described in this document and/or related financial instruments. Such interest may include dealing, trading, holding, acting as market-makers in such instruments and may include providing banking, credit and other financial services to any company or issuer of securities or financial instruments referred to herein. National Westminster Bank plc. Registered office: 135 Bishopsgate, London EC2M 3UR. Registered in England No. 929027. NatWest are authorised by the Prudential Regulation Authority and regulated by the Financial Conduct Authority and the Prudential Regulation Authority. A Royal Bank of Scotland Group company.