2015 full year results presentation€¦ · 2015 full year results presentation 24 february 2016 ....
TRANSCRIPT

2015 Full Year Results Presentation 24 February 2016

Contents
• Overview of 2015 results
• 2015 financial and operational performance
• Outlook for 2016
• Dividend
• Investor information
2 © Copyright NZX Ltd. 2016
This full year results presentation should be read in conjunction with the management commentary
on NZX’s 2015 results which provides further comments on many areas covered in the presentation.

Overview of 2015 results
3 © Copyright NZX Ltd. 2016

2015 Business Highlights
• Lower level of IPO activity offset in 2015 by:
- Higher than expected levels of secondary capital raising – up 435.9% over 2014
- Strong growth in trading and clearing volumes – number of trades up 12.0% over 2014
• Good progress in broadening the market
- Substantial growth in the debt market including the listing of $5.6B in LGFA debt in November 2015
- Dairy derivative market gathering significant momentum – lots traded up 111.5% over 2014
- First listing on the NXT market – focus on developing a small cap pipeline
• Capital markets continued to operate in a fair, orderly and transparent manner
- No required actions from the FMA’s annual General Obligations Review
- 100% uptime for both trading and clearing systems
• Retention of Electricity Authority contracts
- Extended at least 8 years, protecting significant value
- Reduction in margin on core contracts offset by contracted development for systems upgrade
• Required reinvestment in the capital markets business complete
- Direct expenses down by 0.8% over 2014
© Copyright NZX Ltd. 2016 4
Markets - Capital and Energy

2015 Business Highlights
• Executed against our strategy of increasing exposure to the high growth funds management sector
- Acquisition of SuperLife, results of which have met expectations
▪ SuperLife FuM growth 14.1%1
▪ KiwiSaver FuM growth 22.3%1
▪ Member growth 1.5%1
- Enabled launch of 16 new ETFs in 2015 (18 in total since December 2014) across all major asset
classes
▪ 23 ETFs now available to investors on NZX; FuM (excluding SuperLife) up 15.0%1
▪ SuperLife KiwiSaver scheme now offers 46 different fund options
- Acquisition of Apteryx, a next generation wrap platform for fund managers and advisors, which has
significant growth potential
▪ Current funds under administration $1.3B
▪ Estimated target market size up to $100B
• In addition to the acquisitions, significant investment in the funds services business in 2015
- $0.5m in establishment costs associated with the launch of new funds and fund manager licensing
- Apteryx did not achieve breakeven in 2015
© Copyright NZX Ltd. 2016 5
Funds Services
1. Excludes transfer of funds/members from smartkiwi to SuperLife KiwiSaver Scheme

2015 Business Highlights
• Agri results disappointing, reflecting very difficult market conditions in New Zealand and shift in grain
trading patterns in Australia
- NZ publishing revenues down by 9.9% as a result of both a difficult rural environment and the
structural decline in print publishing revenues
- Data information and analysis revenues up 11.4% which includes the acquisition of iFarm in May
2015
- Grain trading revenues down by 29.9% due to lower volumes of grain being traded in the first part of
the 2015/16 harvest
• Cost base of the business reduced accordingly and remains under close review
- Direct expenses down 5.0%
- Closure of one publication, Young Country, in July 2015
• At a group level
- Ralec costs, $3.1M in 2015, remain a drain on earnings, accounting for all of the increase in
corporate (non-business unit) costs. Trial scheduled for May 2016
- Realisation of significant value from sale of Link NZ shareholding
© Copyright NZX Ltd. 2016 6
Agri (NZ and Aus) and Other

2015 reported results
© Copyright NZX Ltd. 2016 7
2015
$m
2014
$m
Change
Total revenue 73.2 65.2 12.2%
Operating expenses (48.6) (40.6) 19.7%
EBITDA 24.6 24.6 (0.1%)
Depreciation and amortisation (7.0) (5.5) 27.3%
Net finance income 0.2 0.1 95.4%
Gain on disposal of Link NZ 11.8 - NM
Associate earnings 0.4 0.7 (38.9%)
Tax (6.1) (6.8) (10.7%)
Net profit after tax 23.9 13.1 82.1%

Impact of Link disposal
© Copyright NZX Ltd. 2016 8
2015
$m
2014
$m
Change
Reported net profit after tax 23.9 13.1 82.1%
Less gain on disposal of Link NZ 11.8 - NM
Net profit excluding Link gain 12.1 13.1 (8.0%)
Cents per
share
Cents per
share
Reported earnings per share 9.1 5.1 78.4%
Less gain on disposal of Link 4.5 - NM
EPS excluding Link gain 4.6 5.1 (9.8%)

Impact of acquisitions
© Copyright NZX Ltd. 2016 9
2015
$m
Less
Acquisitions
2015 excl
acquisitions
2014
$m
Change
Total revenue 73.2 7.1 66.1 65.2 1.4%
Operating expenses (48.6) (5.0) (43.6) (40.6) 7.4%
EBITDA 24.6 2.1 22.5 24.6 (8.5%)
Depreciation & amortisation (7.0) (1.2) (5.8) (5.5) 5.5%
Net finance income 0.2 (0.4) 0.6 0.1 500.0%
Gain on Link NZ 11.8 - 11.8 - NM
Associate earnings 0.4 - 0.4 0.7 (38.9%)
Tax (6.1) (0.2) (5.9) (6.8) (13.2%)
Net profit after tax 23.9 0.3 23.6 13.1 80.2%

2015 Financial and Operational Performance
10 © Copyright NZX Ltd. 2016

11
2015 Revenue Summary
© Copyright NZX Ltd. 2016
2015
$m
2014
$m
Change
Securities information 10.5 10.4 1.5%
Listing fees 13.4 13.2 1.8%
Other issuer services 0.8 1.0 (24.0%)
Securities trading 5.0 4.4 12.5%
Participant services 3.5 3.5 1.4%
Securities clearing 5.4 4.7 15.3%
Dairy derivatives 0.7 0.3 169.3%
Market operations 10.6 11.6 (8.6%)
Total Markets 49.9 49.1 1.8%
Funds Services 10.7 2.7 293.4%
Commodities trading 0.9 1.2 (29.9%)
Agri information 11.7 12.2 (4.2%)
Total Agri Information 12.6 13.4 (6.6%)
Total revenue 73.2 65.2 12.2%

Listing fees
© Copyright NZX Ltd. 2016 12
Shift from IPOs to new debt listings and secondary capital raisings
$0.0B
$5.0B
$10.0B
$15.0B
$20.0B
$25.0B
$30.0B
'03 '04 '05 '06 '07 '08 '09 '10 '11 '12 '13 '14 '15
Source: NZX Data
$0.0B
$1.0B
$2.0B
$3.0B
$4.0B
$5.0B
$6.0B
$7.0B
$8.0B
$9.0B
$10.0B
$11.0B
'03 '04 '05 '06 '07 '08 '09 '10 '11 '12 '13 '14 '15
Secondary Capital Raised New Capital Listed
2015 revenue $0.8m 2015 revenue $3.9m
Equity
Debt
6 9 3 6 7 1 1 10 2 1 2 IPOs
Equity
Debt
16 5

$0B
$10B
$20B
$30B
$40B
$50B
2011 2012 2013 2014 2015
Value Traded
0
200
400
600
800
1,000
1,200
1,400
1,600
2011 2012 2013 2014 2015
Number of Trades (000’s)
Trading and clearing
13
39.6%
5.9%
21.8%
Change over prior year
32.0%
© Copyright NZX Ltd. 2016
9.8% -17.2%
Approximately 30% of 2015 securities trading revenue was value based fees
Trading volumes continue to grow; rise in value traded
19.1%
12.0%

© Copyright NZX Ltd. 2016 14
Dairy Derivatives
Strong growth trajectory continues
0
50,000
100,000
150,000
200,000
250,000
Jan Feb Mar Apr May Jun Jul Aug Sep Oct Nov Dec
2011
2012
2013
2014
2015
Cumulative Dairy Derivatives traded (# lots)
• 3 new clearing
participants in 2015
• Launch of fresh milk
futures planned for
2016, subject to
regulatory approvals

15
$6.0M $5.9M $5.7M
$5.3M $5.4M
$0.7M
$1.6M
$2.4M $2.6M
$1.4M
$.0M
$1.0M
$2.0M
$3.0M
$4.0M
$5.0M
$6.0M
$7.0M
$8.0M
$9.0M
2011 2012 2013 2014 2015
Development
Contract
Market Operations
Energy consulting revenues declined, contractual revenues steady
© Copyright NZX Ltd. 2016
Energy Revenue
• 2015 development
work included
Extended Reserves
Manager project,
completion of
Settlements &
Prudential
Securities and
various other minor
projects
• 2014 development
work included
Financial
Transmission
Rights, Settlements
& Prudential
Securities and
Dispatchable
Demand projects
Funds services
© Copyright NZX Ltd. 2016 16
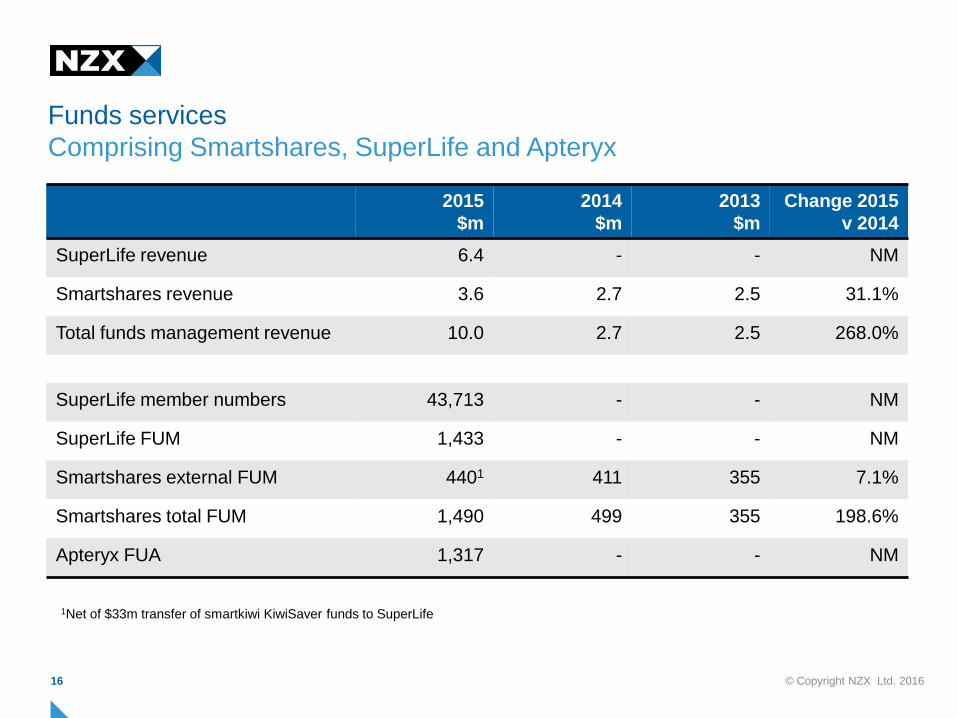
Comprising Smartshares, SuperLife and Apteryx
2015
$m
2014
$m
2013
$m
Change 2015
v 2014
SuperLife revenue 6.4 - - NM
Smartshares revenue 3.6 2.7 2.5 31.1%
Total funds management revenue 10.0 2.7 2.5 268.0%
SuperLife member numbers 43,713 - - NM
SuperLife FUM 1,433 - - NM
Smartshares external FUM 4401 411 355 7.1%
Smartshares total FUM 1,490 499 355 198.6%
Apteryx FUA 1,317 - - NM
1Net of $33m transfer of smartkiwi KiwiSaver funds to SuperLife

Funds Under Management
0
200
400
600
800
1,000
1,200
1,400
1,600
SuperLife External SmartShares FuM
Asset Allocation $M
Property / Other
Equities - Global
Equities - NZ
Fixed Income
Cash
© Copyright NZX Ltd. 2016 17
SuperLife and Smartshares
0
200
400
600
800
1,000
1,200
1,400
1,600
SuperLife SuperLife
FuM $M
KiwiSaver
Other
Super
ETFs
Other

Agri information
© Copyright NZX Ltd. 2016 18
Advertising revenues impacted by cyclical factors
Period of drought
600
700
800
900
1,000
1,100
1,200
1,300
1,400
1,500
-20.0%
-15.0%
-10.0%
-5.0%
0.0%
5.0%
10.0%
15.0%
20.0%
25.0%
Q1 Q2 Q3 Q4 Q1 Q2 Q3 Q4 Q1 Q2 Q3 Q4 Q1 Q2 Q3 Q4
Advertising revenue change v PCP (LHS) GDT Price Index (RHS)
2012 2013 2014 2015

CGX Volumes
-
100,000
200,000
300,000
400,000
500,000
600,000
700,000
800,000
1 2 3 4 5 6 7 8 9 10 11 12 13 14 15 16 17 18 19 20 21 22 23 24 25 26 27 28 29 30 31 32 33 34 35 36 37 38 39 40 41 42 43 44 45 46 47 48 49 50 51 52
Cumulative Tonnes Traded by Harvest
2008/09
2009/10
2010/11
2011/12
2012/13
2013/14
2014/15
2015/16
© Copyright NZX Ltd. 2016 19
Slow start to 2015/16 harvest due to low grain prices
Week

20
2015 operating expenses summary
© Copyright NZX Ltd. 2016
2015
$m
2014
$m
Change
Gross personnel costs 27.7 22.3 24.6%
Less staff capitalisation (1.6) (0.3) 552.6%
Net personnel costs 26.1 22.0 18.5%
IT costs 6.2 5.8 7.1%
Professional fees 5.6 3.4 62.9%
Marketing, print and distribution 3.5 3.8 (7.3%)
Fund expenditure 2.3 1.1 114.5%
Other expenses 4.9 4.5 8.8%
Total operating expenditure 48.6 40.6 19.7%

Expense growth driven by acquisitions, Ralec fees
• Cost growth reflects the investment in the expansion of the funds services business and the ongoing
costs associated with the Ralec litigation
- Total growth in operating expenses of $8.0m
▪ $5.0m from the acquisition of SuperLife and Apteryx
▪ $2.1m from increased Ralec fees1
▪ $1.2m due to the launch of 16 new ETFs during 2015 reflected in higher funds expenses
• Underlying expense growth (excluding acquisitions and Ralec fees) of $0.9m equates to 2.2% growth
on 2014
- Direct expenses were down 0.8% in Markets and 5.0% in the Agri businesses
© Copyright NZX Ltd. 2016 21
Underlying cost growth 2.2%
1. Total Ralec related costs were $3.1m in 2015 compared to $1.0m in 2014. The trial is set down for May 2016.

22
Results by business area
© Copyright NZX Ltd. 2016
2015 Markets
$m
Funds
$m
Agri
$m
Corporate
$m
Group
$m
Revenue 49.9 10.7 12.6 - 73.2
Direct expenses 12.4 9.0 11.5 15.7 48.6
EBITDA 37.5 1.7 1.1 (15.7) 24.6
2014 Markets
$m
Funds
$m
Agri
$m
Corporate
$m
Group
$m
Revenue 49.1 2.7 13.4 - 65.2
Direct expenses 12.5 2.0 12.1 14.0 40.6
EBITDA 36.6 0.7 1.3 (14.0) 24.6
15/14 % change Markets
%
Funds
%
Agri
%
Corporate
%
Group
%
Revenue 1.8% 293.4% (6.6%) - 12.2%
Direct expenses (0.8%) 350.0% (5.0%) 12.1% 19.7%
EBITDA 2.5% 142.9% (15.4%) (12.1%) (0.1%)

2016 Outlook
© Copyright NZX Ltd. 2016

Outlook for 2016 Revenues
24
Business Area Outlook
Markets • Capital raising
• Trading and clearing
Currently in a period of high volatility which has:
• Increased trading volumes thus far in 2016, but it is unclear what
the medium-term impact of the current global markets correction
will have on the NZ market
• Created some uncertainty around what is a positive IPO pipeline
versus 2015
Secondary capital raisings likely to return to a more normal profile
after an elevated year in 2015 due to dual-listed bank’s capital raising
• Annual listing fees
• Participant services
• Securities data
• Stable outlook across these revenue lines, recent takeover activity
will impact only at the margin
• Listing fees reviewed at half year
• Lower growth than prior year which benefitted from one-off audit
activity
• Dairy derivatives • Growth expected to continue, though recent decline in dairy
commodity price volatility has seen growth rate moderate from very
high levels of 2015
• Launch of a fresh milk futures (subject to regulatory approvals)
unlikely to have an impact in 2016 year
• Market operations • New EA contract pricing becomes effective in 2016. Results in
similar total revenue to 2015 levels, though with additional systems
refresh work included within the contract
• Current expectation is for similar levels of consulting activity to
2015 © Copyright NZX Ltd. 2016

Outlook for 2016 Revenues
25
Business Area Outlook
Funds Services • SuperLife
• Smartshares
• Growth potentially impacted by declining equity markets, as significant
proportion of revenue based on % of FUM fees
• Net funds inflow however is expected to maintain current trends
• Full year of revenues from new ETFs launched in 2015. Targeting
similar underlying growth in external FUM within these funds as last
year
• Apteryx • Full year of revenue from existing contracts
Agri • Data
• Publications
• Agri data growth trend from 2015 expected to continue
• Volume of advertising in publications currently supressed by lack of
sector confidence due to low dairy and other commodity prices.
Expected to persist for the remainder of 2016
• Grain trading • After two harvests where most of the crop was sold early in the harvest,
the 2015/16 harvest is being sold more slowly as a result of lower
market prices. This suits Clear Grain’s offering and is expected to
underpin growth in volume in 2016 relative to 2015
© Copyright NZX Ltd. 2016

Outlook for 2016 Expenses
26
Area Outlook
Personnel costs • Full year of Apteryx costs. Further investment in development and operational
capability would be required if a new major client is secured
• Additional energy development/testing resource to deliver EA system
enhancements
• Growth in salary rates at or below CPI
• Increase in staff capitalisation expected, reflecting progression of BaNCS upgrade,
EA development work and a full year of Apteryx
IT costs
• Moderate growth associated with Apteryx and other development and corporate
activities
Professional fees • Current estimate of Ralec fees through to the end of the trial is $2.5m to $3.0m
• Other professional fees anticipated to be in line with 2015 levels as FMCA transition
costs offset the absence of fund launch costs that were incurred in 2015
Marketing, print and
distribution
• Increase in marketing costs expected to promote funds management products
Fund expenses • Full year of funds costs on the 16 new ETFs launched in 2015. These are largely
fixed, hence incremental revenues result in margin expansion
Other expenses • Full year of Apteryx costs
• Other costs in line with 2015
© Copyright NZX Ltd. 2016
Outlook
• Based on the factors outlined on the previous three slides, NZX expects FY 2016 EBITDA to be in the
range of $22.5m to $26.5m. This is subject to market outcomes, particularly with respect to IPOs,
secondary capital raising, trading and clearing volumes for equities and derivatives and grain trading
volumes
• Guidance assumes no material adverse events, significant one-off expenses or major accounting
adjustments
• It also assumes no acquisitions or divestments
© Copyright NZX Ltd. 2016 27
Summary
© Copyright NZX Ltd. 2016 28
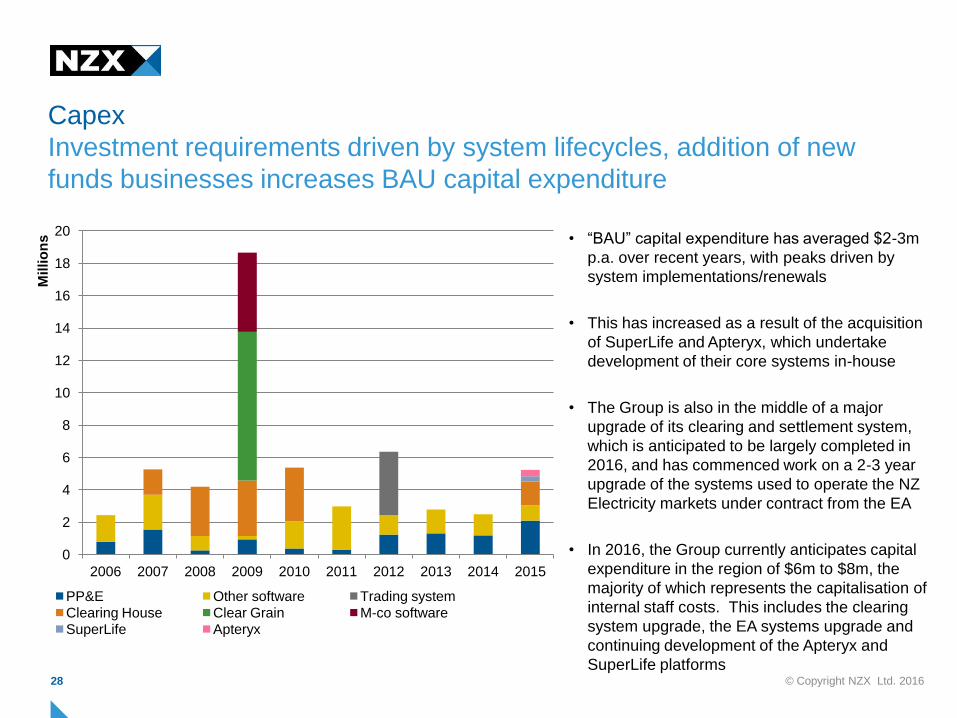
• “BAU” capital expenditure has averaged $2-3m
p.a. over recent years, with peaks driven by
system implementations/renewals
• This has increased as a result of the acquisition
of SuperLife and Apteryx, which undertake
development of their core systems in-house
• The Group is also in the middle of a major
upgrade of its clearing and settlement system,
which is anticipated to be largely completed in
2016, and has commenced work on a 2-3 year
upgrade of the systems used to operate the NZ
Electricity markets under contract from the EA
• In 2016, the Group currently anticipates capital
expenditure in the region of $6m to $8m, the
majority of which represents the capitalisation of
internal staff costs. This includes the clearing
system upgrade, the EA systems upgrade and
continuing development of the Apteryx and
SuperLife platforms
Capex
Investment requirements driven by system lifecycles, addition of new
funds businesses increases BAU capital expenditure
0
2
4
6
8
10
12
14
16
18
20
2006 2007 2008 2009 2010 2011 2012 2013 2014 2015
Millio
ns
PP&E Other software Trading system
Clearing House Clear Grain M-co software
SuperLife Apteryx

Dividend
29 © Copyright NZX Ltd. 2016

2H 2015 Dividend
• Final 2015 dividend of 3.0 cents declared. Takes total distributions for 2015 to 6.0 cents,
unchanged from 2014
• Dividend to be fully imputed
• To be paid on 30 March 2016 for holdings as at 16 March 2016
30 © Copyright NZX Ltd. 2016

Investor information
31 © Copyright NZX Ltd. 2016

Investor Information
32
• Final dividend of 3.0 cents per share fully imputed declared
• Record date 16 March 2016 and payment date 30 March 2016
• NZX full financial reports available to download at:
http://nzxgroup.com/investor-centre/reports-information
For more information please contact:
Tim Bennett Bevan Miller Kate McLaughlin
CEO CFO Head of Communications
E-Mail [email protected] [email protected] [email protected]
Mobile: +64 27 518 5526 +64 21 276 7359 +64 27 533 4529
www.nzx.com
© Copyright NZX Ltd. 2016