2015 gt fda elmendorf - adas and sdi-title
TRANSCRIPT

2015 Georgia Tech Annual
Fault & Disturbance Analysis Conference
April 27-28, 2015 Atlanta, GA
-- 1 --
Automated Disturbance Analytics And
System-wide Dashboard Insights Using
Open Source Software

-- 2 --
Automated Disturbance Analytics and System-wide
Dashboard Insights Using Open Source Software
Fred L. Elmendorf
Grid Protection Alliance
Chattanooga, TN USA
Abstract— Power companies have invested huge sums of
money in building out their substation infrastructure with
current technology devices and the supporting communications
systems to integrate and operate new devices and data gathering
systems. The challenge created by an increasing number of
intelligent electronic devices (IEDs) producing data, and the
resulting increased volume of data to be managed and analyzed
makes it impossible for a human fully understand the operational
health of the fleet of reporting devices, or to extract all the value
from the data that is being recorded. Economic pressures are
reducing the available staff to analyze data, and customers are
demanding better performance and power quality (PQ). With
greater volumes of data and decreased staff, automated
disturbance analytic systems are becoming ever more critical.
An open source software (OSS) approach maximizes
investments and facilitates industry wide collaboration to meet
the challenge.
Existing desktop tools are not designed for dynamic, real-
time, system-wide reporting, and typically, analysis engineers
and staff are so overwhelmed with data that only the most
critical events can be explored in any detail. Employing state of
the art technologies to aggregate data from the entire fleet of
reporting devices, and positioning that data in a highly
optimized database allows new value to be extracted from the
existing data. An open source ‘dashboard’ presentation of
information related to the entire population of reporting devices,
regardless of the type of device or manufacturer, can quickly
identify and alert on significant events or conditions.
This paper will provide a brief update on the growth and
benefits of OSS for the electric power industry, and a follow-up
to last year’s paper ‘The BIG Picture – A Look at Automated
Systems for Disturbance Analytics using Open Source
Software’. Fleet-wide techniques will be explored that can
move disturbance data analysis from reactive ‘firefighting’ to a
near-real-time understanding that facilitates proactive decisions.
Specific data management, aggregation, and positioning
techniques that make up an effective data layer to support a
responsive and scalable dashboard solution will be presented,
and system-wide insights facilitated by this approach will be
discussed. Whether you choose to use OSS in facing the
automated disturbance analysis challenge or not, this paper will
give you a better understanding of the complexity of the
challenge, and prepare you to make more informed solution
decisions. The paper will conclude with a case study of an
Electric Power Research Institute (EPRI) sponsored open source
power quality (PQ) dashboard funded by a number of major
utilities. The Open PQ Dashboard is currently in beta testing,
and has being deployed at the Tennessee Valley Authority
(TVA), Dominion Virginia Power, and Georgia Transmission
Corporation for further evaluation, testing and extension.
Keywords—power quality, dashboard, open source
software, disturbance analytics
I. GROWTH AND BENEFITS OF OSS
OSS has received a lot of attention already this year as
Microsoft continues with new contributions and provides blog
posts and online “how to” training videos. Microsoft is just one
example of a major, historically proprietary IT company that has
embraced OSS in a huge way. 2015 also marks the ninth year
that Black Duck Software has conducted a comprehensive cross-
industry survey to assess the future of open source, and in a
recent webcast they included these three points:
OSS is becoming a more important part of the software
ecosystem
The use of OSS is critical strategy for commercial
companies
The OSS business model has been validated
There is no longer a question regarding OSS as a possible
solution. It should be evaluated on an equal basis with
proprietary offerings. All software should be evaluated on
quality, security, and features whether OSS or proprietary, but
visibility of the source code, and community involvement give
OSS potential advantages in these areas. A recent EPRI white
paper provides a fresh perspective on OSS, lists some of their
important OSS projects, and presents the results of an electric
-- 3 --
utility specific OSS survey conducted in late 2014. The initial
survey results support the observation that OSS is still not well
understood within U.S. electric power companies.
Additional benefits of OSS that are particularly valuable in
the relatively small electric utility industry include:
Lower total cost of ownership
Reduced time to deployment
Stimulates innovation
Encourages and facilitates collaboration
Results from the 2015 Future of Open Source Survey
conducted by Black Duck Software were presented in a webinar
on April 16, 2015i. Figure 1 below shows examples of a few
recent OSS related presentations and activities.
Figure 1. OSS Collage
II. FOLLOW-UP: “THE BIG PICTURE - …”
Leveraging the benefits of OSS and continuing to encourage
the use of industry standards over the past year has yielded many
improvements in automated disturbance analytic systems.
Following is an update on the gaps identified in “The Big Picture
– A Comprehensive Look at Automated Systems for
Disturbance Analytics using Open Source Software”ii.
Data Retrieval – The ever increasing demand for more
information on the health and operation of the power system is
driving continuous growth in the communications
infrastructure. While the rate of change varies widely from one
company to another, overall it is improving. With regard to
automated near-real-time disturbance analytics, having this data
highway available is the first step. Managing the traffic on the
data highway is the next critical step in the process and at this
point it is still a patchwork of proprietary vendor supplied
systems. An OSS solution to isolate the analytic processes from
the proprietary uniqueness of reporting devices offers potential
value to all of the players. The OSS approach is good for
vendors because data from their device becomes more valuable
if there are fewer barriers to its use and it is more readily
incorporated into new applications with new audiences. It’s also
good for power companies because they can extract more value
from their installed devices, and have more flexibility in
choosing new hardware solutions. Many vendors and utilities
have expressed interest in an OSS solution, but at this time it has
not been accomplished.
Data Quality – OSS projects are underway to address a
number of data quality and availability issues. In one
application a large historical data set is analyzed to determine
the normal operating range for any trended value. Once the
normal operating range is established, each new data point is
compared to the range and appropriate alarms and notifications
are generated when the range is exceeded. New work for this
year will address missing data, latched values, engineering
reasonableness, and possibly others.
Analytics - Automated fault distance calculations continue
to be enhanced. Ongoing work funded through Dominion
Virginia Power, EPRI, Georgia Transmission Corporation, and
TVA, has added a sixth single-ended distance calculation
method and a native E-Max DFR format parser, and additional
work this year will add double-ended fault distance calculation
and breaker timing analysis and reporting. Additional analytics
under consideration are capacitor bank and other substation
equipment health, and cataloging and reporting on transient
events. The existing OSS data layer is capable of automatically
performing any analytics appropriate for disturbance or trending
data recorded in PQDIF, COMTRADE, or native E-Max DFR
formats.
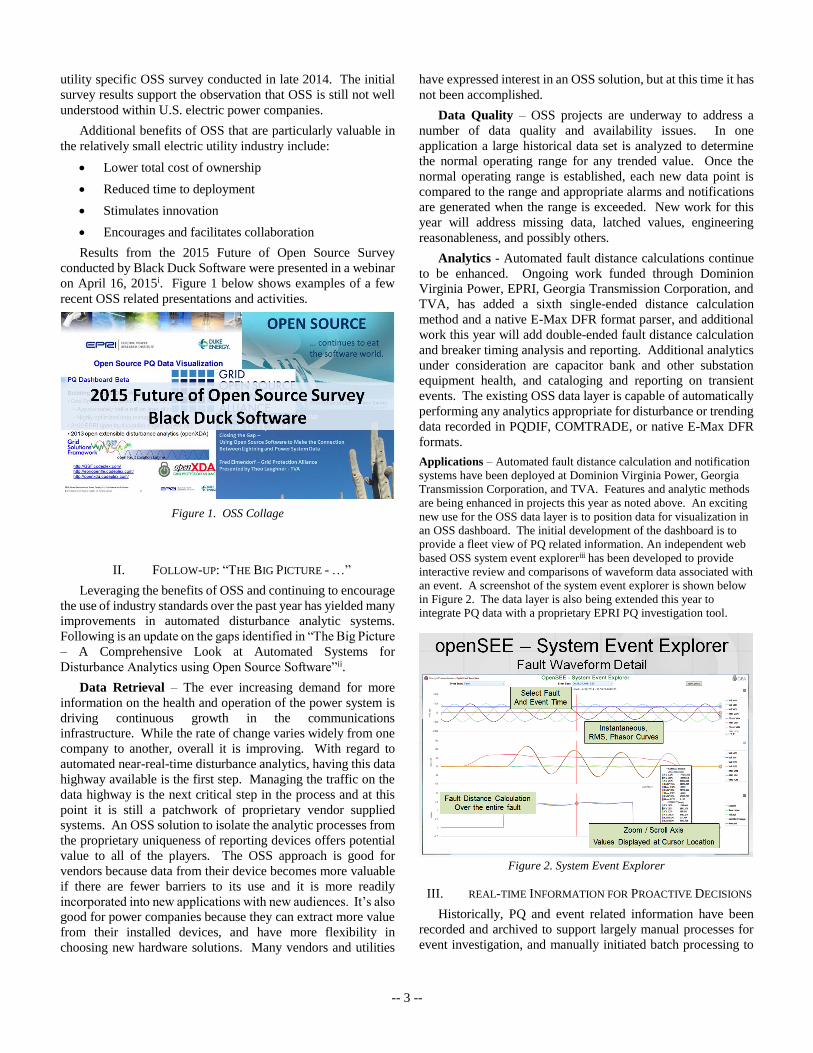
Applications – Automated fault distance calculation and notification
systems have been deployed at Dominion Virginia Power, Georgia
Transmission Corporation, and TVA. Features and analytic methods
are being enhanced in projects this year as noted above. An exciting
new use for the OSS data layer is to position data for visualization in
an OSS dashboard. The initial development of the dashboard is to
provide a fleet view of PQ related information. An independent web
based OSS system event exploreriii has been developed to provide
interactive review and comparisons of waveform data associated with
an event. A screenshot of the system event explorer is shown below
in Figure 2. The data layer is also being extended this year to
integrate PQ data with a proprietary EPRI PQ investigation tool.
Figure 2. System Event Explorer
III. REAL-TIME INFORMATION FOR PROACTIVE DECISIONS
Historically, PQ and event related information have been
recorded and archived to support largely manual processes for
event investigation, and manually initiated batch processing to

-- 4 --
produce reports of trending data. Typically this data has only
been reviewed to produce periodic reports or to investigate
events that are known to have caused system or customer issues.
Automated real-time processes are capable of analyzing and
categorizing information from every event record or trending
file. In this context, real-time means as soon as the data is
available. Data retrieval processes dictate the ‘real-time’
periodicity and lag time. Data from network connected devices
can be analyzed to produce reports and notifications within
seconds from the time of the event.
IV. EFFECTIVE DATA LAYER
PQ and disturbance data is available from many different
types of devices and different manufacturers. As mentioned
previously, this presents a challenge in retrieving the data from
field devices, and it also presents a challenge in analyzing the
data. Through the extension of a 2012 EPRI OSS project to
prove the concept of automated fault location at the enterprise
level, an open source data layeriv has been developed to address
these challenges.
The data layer consists of:
• An automated back office service (Windows OS)
• Input parsers for event and trending data
– PQDIF
– IEEE COMTRADE
– EMAX native file format
• Output: database, emails, etc.
• Data sources:
– Power quality (PQ) monitors
– Digital fault recorders (DFRs)
– Other information systems
A logical overview of the automation platform is shown below
in Figure 3.
Figure 3. Logical Overview
A physical overview of the automation platform is shown
below in Figure 4.
Figure 4. Physical Overview
V. SYSTEM-WIDE INSIGHTS
Using the data layer and presentation tools that have been
developed using OSS as previously described in this paper, it is
now possible to draw data together from many disparate data
sources, and present it in a system-wide context. The initial PQ
Dashboard uses this technique to convey information through a
combination of geographic, grid, histogram, and tabular
visualization panels to present a ‘one shot visual’. This ‘one
shot’ approach assists the user in comprehending the
information represented in very large volumes of data.
Additional functionality is being added in current projects that
will facilitate system wide visualization of any trended quantity
overlaid with power system representations. For example, a heat
map of system-wide minimum voltage could be displayed with
a system single line.
VI. PQ DASHBOARD CASE STUDY
In 2014 EPRI initiated a project to use the open source
extensible disturbance analytics platform (openXDA) to provide
the data layer for an OSS PQ Dashboard. The Open PQ
Dashboardv is currently in beta status, and one of the tasks to be
completed this year is to produce a stable, easily deployable,
maintainable version 1.0. Additional tasks in the project will
provide greatly enhanced geographic displays, add new data
quality and availability alarming and reporting, and other
features as budget and schedule allow. The Open PQ Dashboard
has been deployed at two utilities with a third deployment
scheduled in June, 2015. Because of the OSS nature of the Open
PQ Dashboard and the openXDA, additional features and
functions are being added through independent projects that all
benefit the code base. Some of the features that have been added
through other projects include much more flexible time controls
and application navigation, the inclusion of new tabs for ‘Faults’
and ‘Breaker Timing’, and optimization of code for

-- 5 --
responsiveness. An additional EPRI project is underway that
uses the openXDA to integrate PQ data with EPRI’s popular PQ
Investigator tool, and displays the results through the PQ
Dashboard.
An example of the EVENTS tab with the PQ Dashboard in
the Map view is shown below in Figure 5.
Figure 5. PQ Dashboard Events with Map
An example of the EVENTS tab with the PQ Dashboard in
the Grid view is shown below in Figure 6.
Figure 6. PQ Dashboard Events with Grid
An example of the TRENDING tab with the PQ Dashboard in the
Map view is shown below in Figure 7.
Figure 7. PQ Dashboard Trends with Map
An example of the TRENDING tab with the PQ
Dashboard in the Grid view is shown below in Figure 8.
Figure 8. PQ Dashbaord Trends with Grid
VII. SPAWNING NEW TOOLS
The automated analytic functions provided through the
openXDA and the fleet wide visualizations available through the
PQ Dashboard allow the user to quickly understand events or
changes on the system while positioning the relevant data for
detailed analysis. As mentioned earlier, an OSS system event
explorer (openSEE) has been developed to facilitate this detailed
analysis. When openXDA is configured to produce automated
email notifications for fault distance calculations, a link to
openSEE can be imbedded in the email so that a user can
instantly view the waveforms associated with the fault in an
interactive web environment. Additionally, openSEE is directly
available through the PQ Dashboard and allows the user
seamlessly examine the associated waveforms. openSEE is one
example of new analysis tools that can further leverage the
power of the OSS tools described in this paper.
Figure 9. openSEE with Phasor chart
The frameworks are in place, and real-world experience
demonstrates that it is now possible to develop robust, extensible
software systems that can achieve automated disturbance
analytics and system-wide dashboard insights using an OSS
development strategy.

-- 6 --
i2015 Future of Open Source
https://www.blackducksoftware.com/future-of-open-source ii The Big Picture
http://www.slideshare.net/FredElmendorf/2014-georgia-tech-
fda-pres-asda-using-oss-37239423
iii openSEE-System Event Explorer
http://opensee.codeplex.com iv openXDA http://openxda.codeplex.com v Open Power Quality Dashboard
http://sourceforge.net/projects/epriopenpqdashboard/