2015 interim results · 2015-08-20 · the presentation may contain some forward-looking...
TRANSCRIPT

2015 Interim Results
August 2015
1

The context of the presentation shall not constitute any offer to buy
or sell any securities, or constitute the base on which any contract or
commitment shall be relied. The presentation may contain some
forward-looking statements, potential investors should be aware that
real performances may be materially different from the forward-
looking statements.
The context of the presentation has not been verified by independent
third parties, and their fairness, accuracy and completeness shall not
be guaranteed and should not be relied upon. The information
contained here should be interpreted based on the prevailing
circumstances. No update has been or shall be made to reflect any
material changes post the completion of this presentation. None of
the employees, agents and advisors of our Company shall be
responsible for the context of the presentation at any time, and they
shall not be held liable for any losses resulted in from the using of the
presentation.
Disclaimer
2

Table of Content
Financial Performance
Business Review
Future Development
1
2
3
3

1 Financial Performance

5
Jun 30, 2015 Jun 30, 2014
Assets
Inventories 437 401
Trade and other receivables 214 234
Cash and cash equivalents 405 218
Time deposits 338 734
PP&E 648 607
Others 823 443
Total assets 2,865 2,637
Liabilities
Trade and other payables 207 199
Short term borrowings 539 467
Others 190 68
Total liabilities 936 734
Shareholders’ equity 1,929 1,903
(RMB million)
1H2015 1H2014
Sales revenue 786 883
Growth rate (10.9%) 6.1%
Gross profit 489 547
Gross margin 62.2% 61.9%
SG&A expenses 356 366
Other income / gain – net 5 7
Operating profit 138 188
Operating margin 16% 21.3%
Net profit for the year 100 140
Growth rate -28.5% 9.1%
Net profit margin 12.7% 15.8%
Income Statement and Balance Sheet
6
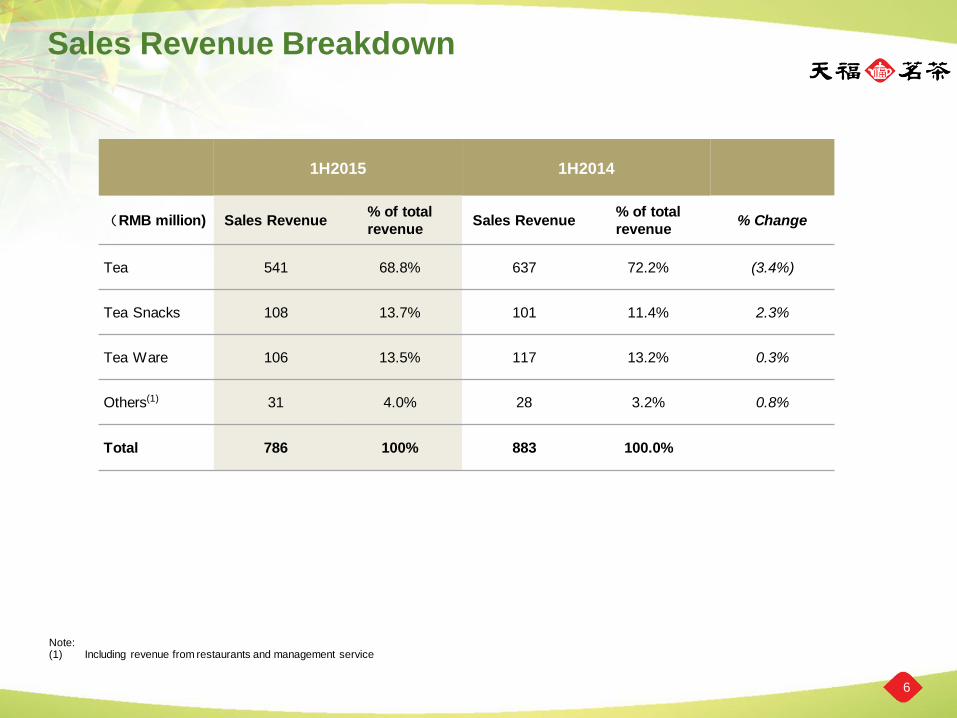
Sales Revenue Breakdown
Note: (1) Including revenue from restaurants and management service
1H2015 1H2014
(RMB million) Sales Revenue % of total
revenue Sales Revenue
% of total
revenue % Change
Tea 541 68.8% 637 72.2% (3.4%)
Tea Snacks 108 13.7% 101 11.4% 2.3%
Tea Ware 106 13.5% 117 13.2% 0.3%
Others(1) 31 4.0% 28 3.2% 0.8%
Total 786 100% 883 100.0%

7
Stable Revenue and Net Profit
Sales Revenue Net Profit (RMB million) (RMB million)
786
883
700
750
800
850
900
950
1000
1H2015 1H2014
100
140
110
115
120
125
130
135
140
145
150
155
160
1H2015 1H2014

8
Gross Profit Operating Profit
Continuous Level of Profitability
(RMB million) (RMB million)
489
547
450
470
490
510
530
550
570
590
1H2015 1H2014
138
188
150
160
170
180
190
200
210
220
1H2015 1H2014
1H2015 1H2014

9
Effective Operating Cost Control
Distribution Costs Administrative Expenses (百万元人民币) (百万元人民币)
Employee Compensation (百万元人民币)
Net Interest Income (百万元人民币)
261 237 253
29.5% 29.4% 32.2%
-50.00%
-30.00%
-10.00%
10.00%
30.00%
50.00%
0
100
200
300
400
500
1H2014 2H2014 1H2015
分销成本 占销售比率
106 99 103
12.0% 12.3% 13.1%
(10.0%)
(5.0%)
0.0%
5.0%
10.0%
15.0%
20.0%
0
50
100
150
200
1H2014 2H2014 1H2015
行政开支 占销售比率
5
10
7
0
2
4
6
8
10
12
1H2014 2H2014 1H2015
151 135 143
17.1% 16.8% 18.2%
(20.0%)
(10.0%)
0.0%
10.0%
20.0%
0
50
100
150
200
250
300
1H2014 2H2014 1H2015
人力成本 占销售比率
(RMB million)

10
Stable Working Capital Efficiency
Average Inventory Days Average Account Receivable Days Average Account Payable Days
(Turnover Days) (Turnover Days) (Turnover Days)
97
106
1H2015 1H2014
64
68
1H2015 1H2014
221
1H2015 1H2014

Strong Cash Flow and Payout Ratio
11
(百万元人民币)
Operating Cash Flow Capital Expenditure
Free Cash Flow Payout Ratio
(百万元人民币)
(百万元人民币)
50% 50%
1H2014 1H2015
152
181
1H2014 1H2015
112
60
1H2014 1H2015
40
1H2014 1H2015

2 Business Review
12

Nationwide Sales Network
Tenfu maintains a large nationwide multi-channel sales and distribution network
Nationwide distribution network Retail network breakdown by store type
Store count by type (as of Jun 30, 2015)
Self-operated retail outlets and retail points
Third-party operated retail outlets and retail points
Xinjiang
Tibet
Qinghai Gansu
Beijing
Shandong Shanxi
Hebei
Jilin
Heilongjiang
Inner Mongolia
Henan Jiangsu Xiaxi
Ningxia
Anhui
Sichuan
Yunnan
Guizhou
Hubei
Hunan
Zhejiang
Fujian
Guangdong
Guangxi
Hainan
Jiangxi
Shanghai
Liaoning
Tianjin
Chongqing 44 21
21 4 6 6
11 9 80 13
7 3
79 28
41 12 12 6
26 19 20 10
24 4
20 8 47 72
102 48
47 40 47 14
26 11
17 16
29 18
12
8
3
29 45 56 29
24 15
27 5
3
18 6
1
11
Self –operated retail outlets and retail points
Third-party operated retail outlets and retail points
13
1
5

14
Multi-Category: balanced portfolio and tea varieties to cater to different consumer needs
Multi-Brand: cater to multiple channels and consumers with different levels of purchasing power
Revenue segment by product
Sell private label tea and tea products to consumers through
direct ownership as well as third party retail outlets
Sell tea products to consumers through
hypermarkets and online platform
Revenue by sales channel
“Tea-Department-Store” Model Continuous execution of the multi-category and multi-brand product strategies
2014 1H2015
TenXi’s TEA
Tea69%
Tea ware13%
Tea snacks14%
Others4%
56.8
6.5 1.7
1
29.9
4.1
1H2015
Retail
Hypermarkets
E-commerce
Funnew Spot
Wholesale
Others
Tea72%
Tea ware13%
Tea snacks12%
Others3%

3 Future Development
15

Development and Expansion
Set up Xiamen Daily Plus Food Beverage Management Co., Ltd., a joint venture with Ten Ren Tea (Hong
Kong) Limited, to engage in catering management, beverage production, sales and wholesale of pre-
packaged food
Entered a joint venture agreement with Rise General Trading LLC, in June 2015 to undertake wholesale,
blending, packaging and trading of tea in the Middle East; with potential to replicate and develop globally
Adjustment and focus to further develop mid to low-range, accessible products, as opposed to previous
weight given to high-end products
Successful expansion of facility in Zhangzhou ensures the optimisation of production and storage to meet
with demand; acquisition opportunities also help with competitiveness of procurement costs
Ranked #1 in the “2013 Chinese Tea Industry Top 100 Award”
Tenfu mooncakes won the title of “China’s Famous Pastry” at the “2014 Chinese Mooncake Cultural
Festival”
Designated for the fifth time, as a recognised enterprise, to participate as sponsors for the APEC
meetings in 2014
Business Outlook and Plan
Major Achievements
16

Successful Development of Funnew Spot Tea
Stores
Advantageous Marketing
Expand the domestic network mainly through franchisees
As at June 2015, Funnew Spot has 126 stores in over 50 cities
in China, including Xiamen, Quanzhou, Chengdu, Wuhan,
etc.
Funnew Spot is an extension of the existing Tenfu business,
further showcasing the Tenfu retail-chain business model
nationwide Tenfu’s existing position
leverages entry into the tea drink industry
The tea drink industry has a
high growth rate and potential Funnew Spot products are
easily made popular, suited for nationwide replication and
expansion “Customers come first”; Funnew
Spot recognizes customer feedback and projects a fresh,
youthful image
Products
Funnew Spot promotes the principles of “natural” and “healthy”, offering a
variety of tea drinks, baked goods, ice cream, etc. to consumers
Focuses on providing high quality and unique products
Leverages Tenfu’s retail experience, thereby providing support and
uniformity in employee training and
standardized marketing campaigns
17
Focus on development of online sales channels
Strengthen tea sales network coverage
Extension of existing tea business through the online platform, penetrating all city tiers
and injecting Tenfu brand awareness Unique online promotion methodology to
attract the younger customer base Online sales channels has great market
potential and rapid growth Since inception of e-commerce platform, it
has accountef to nearly 2% of sales
revenue Being the social media era, we utilise the
online platform and mobile phone culture to further acquaint ourselves with consumers,
and better analyse the customer base