2015 iwa specialist group on lake and reservoir management ... · on lake and reservoir management...
TRANSCRIPT

2015 IWA Specialist Group
on Lake and Reservoir
Management Tour
Paul Gantzer, Ph.D., P.E.
Mark Mobley, P.E.

Carvins Cove
Spring Hollow Falling Creek
Parameter
Surface Area 0.61 km2
(150 acres) 2.5 km2
(1100 acres) 0.28 km2
(69 acres) 0.12 km2
(29 acres)
Volume 120,000 Ml (3200 x 106 gal) 231,000 Ml (6200 x 106 gal) 1700 Ml (430 x 106 gal) 310 Ml (90 x 106 gal)
Max Depth 62 m (200 ft) 23 m (70 ft) 15 m (50 ft) 9.3 m (30 ft)
Production 30 MLD (8 MGD) 114 MLD (30 MGD) X X 7.5 MLD (2 MGD)
Spring Hollow Carvins Cove Beaver Dam Falling Creek
Western Virginia Water Authority

Spring Hollow Water Treatment Plant
1.
1. Clarification/Filtration
2.
2. GAC/Fluoridation
3.
3. Chemical Storage
4. Backwash Decant Tanks
4. 4.
5.
5. Clearwell
Reservoir (O2 & ClO2
added)

Spring Hollow Water Treatment Unit
Upflow
Clarifiers Gravity
Filters

Carvins Cove
Water Treatment Plant
1. Aerators
2. Coagulation
3. Flocculation
4. Sedimentation
5. Filtration
6. Disinfection
2 3 4
5
6
1
Pre-Treatment (ClO2)
Hypolimnetic
Oxygenation

Falling Creek Water Treatment Plant
Aeration Flocculation
Tube Settlers
Filtration
Coagulant
Addition

Crystal Spring Water Treatment Plant
• 5 units (1.2 MGD each)
• 102 modules per unit
• Microfiltration
• Chlorine and Fluoride addition post filtration
• Spring source – 3.5 MGD consistently

1
2
4
5
6
3
7 8
1 2
4 3
6 5
7
8
Background
SHR
3408
CCR
2440
0
1000
2000
3000
4000
Jan-99 Jan-00 Jan-01 Jan-02 Jan-03 Jan-04 Jan-05 Jan-06 Jan-07 Jan-08 Jan-09
Pro
file
s C
oll
ecte
d _

1996 Bob Benninger
Roanoke County Utility Department (RCUD)
Mark Mobley
Tennessee Valley Authority (TVA) John Little
Virginia Tech (VT)
Conference Beer

1997 • Spring Hollow Reservoir
• 3000 ft line diffuser
• Two 75 Hp Ingersol Rand air compressor
• SCFM ?

1997 (Aeration)
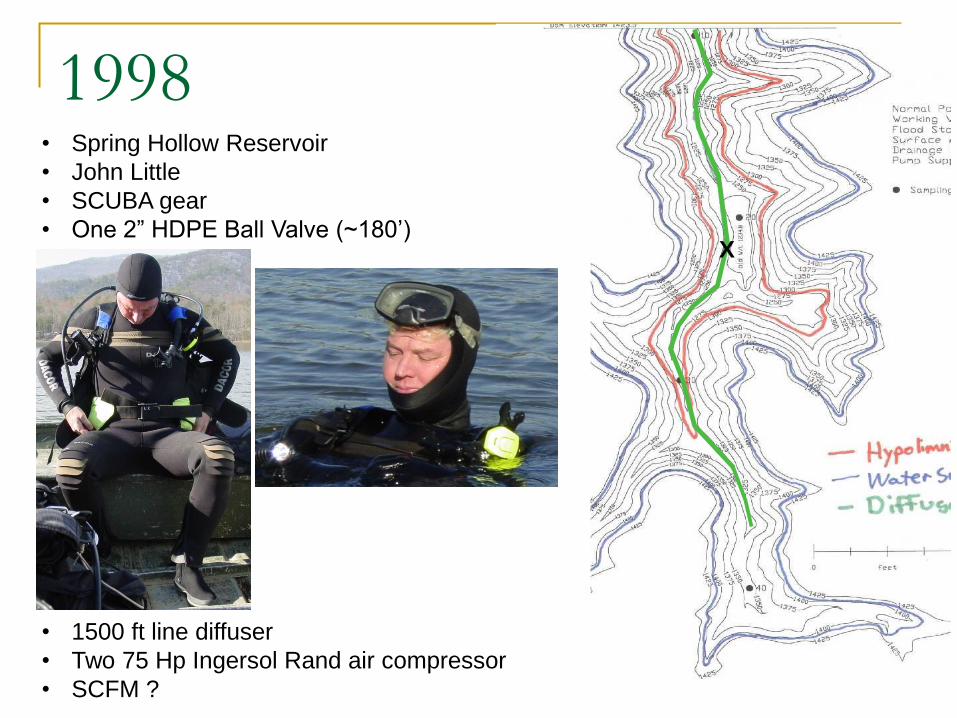
1998
X
• Spring Hollow Reservoir
• John Little
• SCUBA gear
• One 2” HDPE Ball Valve (~180’)
• 1500 ft line diffuser
• Two 75 Hp Ingersol Rand air compressor
• SCFM ?

1998 (Aeration)

1999 • Spring Hollow Reservoir
• 1500 ft line diffuser
• Two 75 Hp Ingersol Rand air compressor
• SCFM ?

1999 (Aeration) 10
5
15
20
25
35
30
Station
10 20 30 35 25 15 5 20 & 25
Aver
age
Sta
tion D
iffe
rence
-2
-1
0
1
2

2000 • Spring Hollow Reservoir
• Professor on Sabbatical
• $1000

2000 (Aeration)
375
380
385
390
395
400
405
410
0 5 10 15 20
Dissolved Oxygen (mg/L) Temperature (C)
Ele
vati
on (
m)
YSI Data
Profiles
Hydrolab Data
Profiles
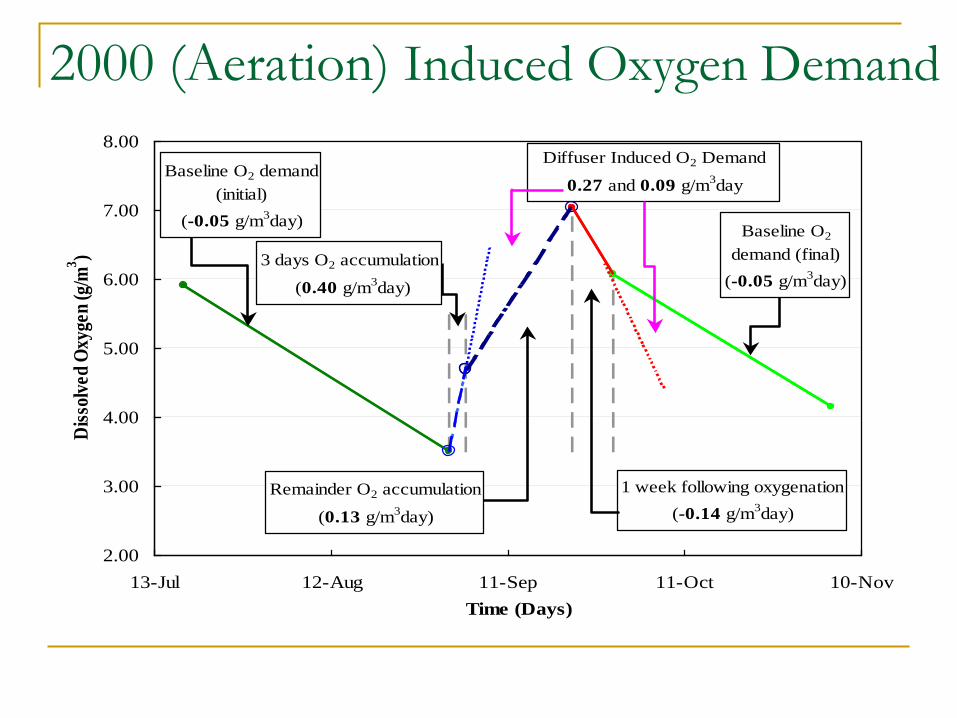
Baseline O2 demand
(initial)
(-0.05 g/m3day)
3 days O2 accumulation
(0.40 g/m3day)
Remainder O2 accumulation
(0.13 g/m3day)
1 week following oxygenation
(-0.14 g/m3day)
Baseline O2
demand (final)
(-0.05 g/m3day)
2.00
3.00
4.00
5.00
6.00
7.00
8.00
13-Jul 12-Aug 11-Sep 11-Oct 10-Nov
Time (Days)
Dis
solv
ed O
xyge
n (g
/m3)
Diffuser Induced O2 Demand
0.27 and 0.09 g/m3day
2000 (Aeration) Induced Oxygen Demand
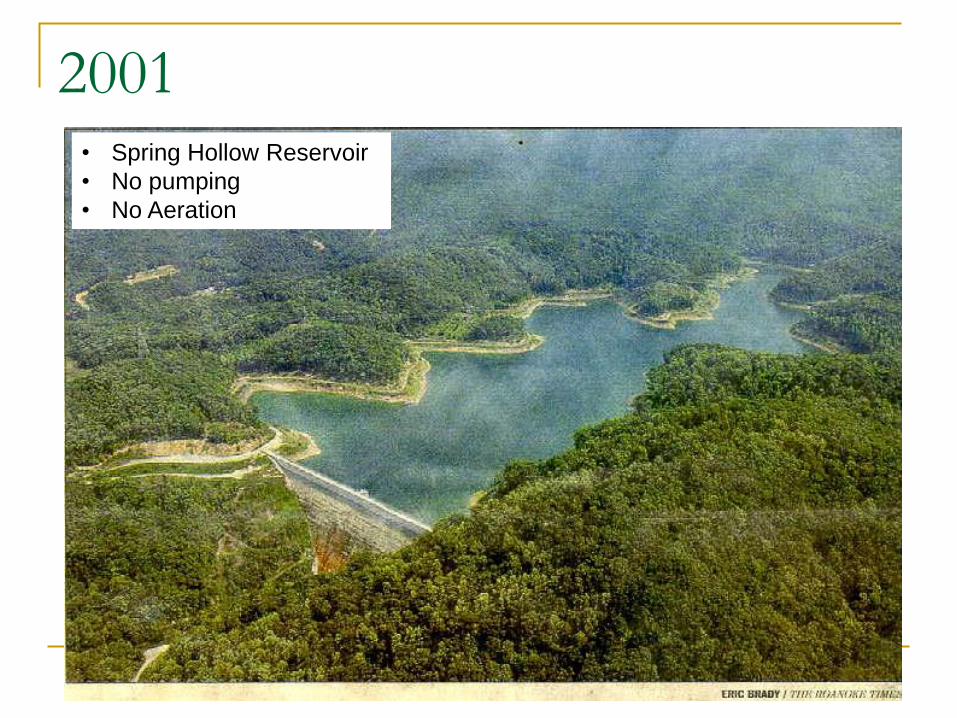
2001 • Spring Hollow Reservoir
• No pumping
• No Aeration

2001 Background DO Demand
370
380
390
400
410
420
Ele
vation (
m)
200 220 240 260 280 300 320 340
Julian Day (2001)
370
375
380
385
390
395
400
405
410
415
420
425
0.0
1.0
2.0
3.0
4.0
5.0
6.0
8.0
10.0
12.0
14.0
16.0

1996
2001
2002
June
July
Augu
st
Septe
mber
Octo
ber
2002 • Spring Hollow Reservoir
• Replace 2” floater w/3”
• Orifice in “T”
• Upgrade to LOx

2002
Line diffuser
upgrades

2003 (LOx vs Air)
Air
8.45 mg/l
9.24 mg/l
4400 kg
15 days
48 Nm3 h-1
(28 SCFM)
O2
8.32 mg/l
12.60 mg/l
6300 kg
12 days
14 Nm3 h-1
(8 SCFM)
Gas
Start DO
Final DO
DO add
Duration
Flow
Flow
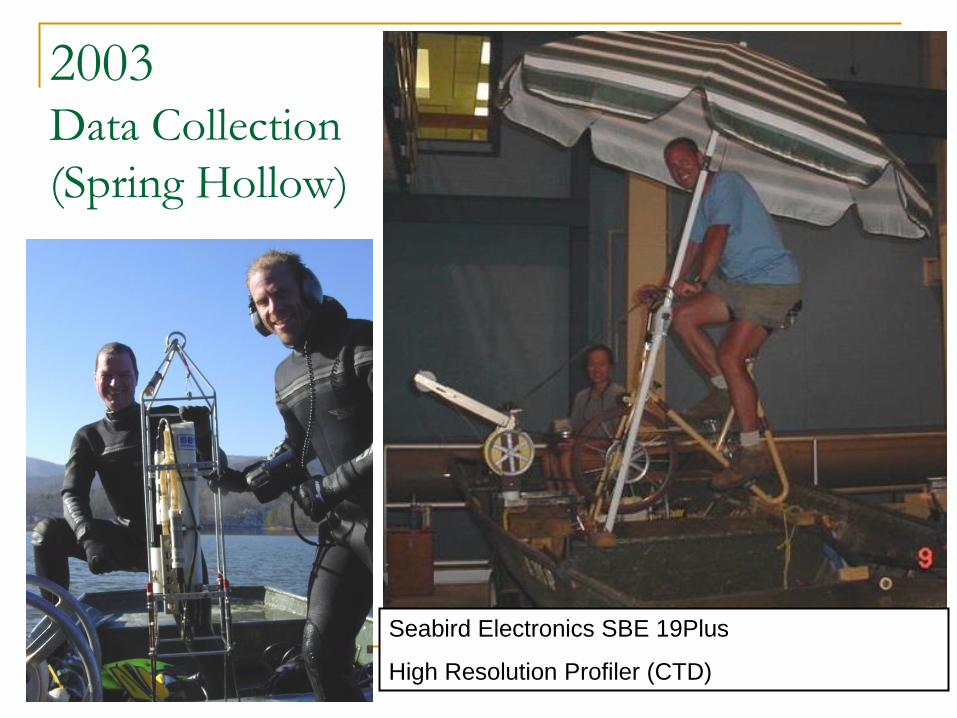
2003 Data Collection
(Spring Hollow)
Seabird Electronics SBE 19Plus
High Resolution Profiler (CTD)

2003 (Spring Hollow Data)
368
372
376
380
384
388
Ele
vation (
m)
165 175 185 195 205 215 225 235 245
Distance (m)
165 170 175 180 185 190 195 200 205 210 215 220 225 230 235 240 245
368
370
372
374
376
378
380
382
384
386
388
390
0.0
1.0
2.0
3.0
4.0
5.0
Idealized Plume Modeled Plume
8-Jun 28-Jun 18-Jul 7-Aug 27-Aug 16-Sep 6-Oct 26-Oct 15-Nov
Date
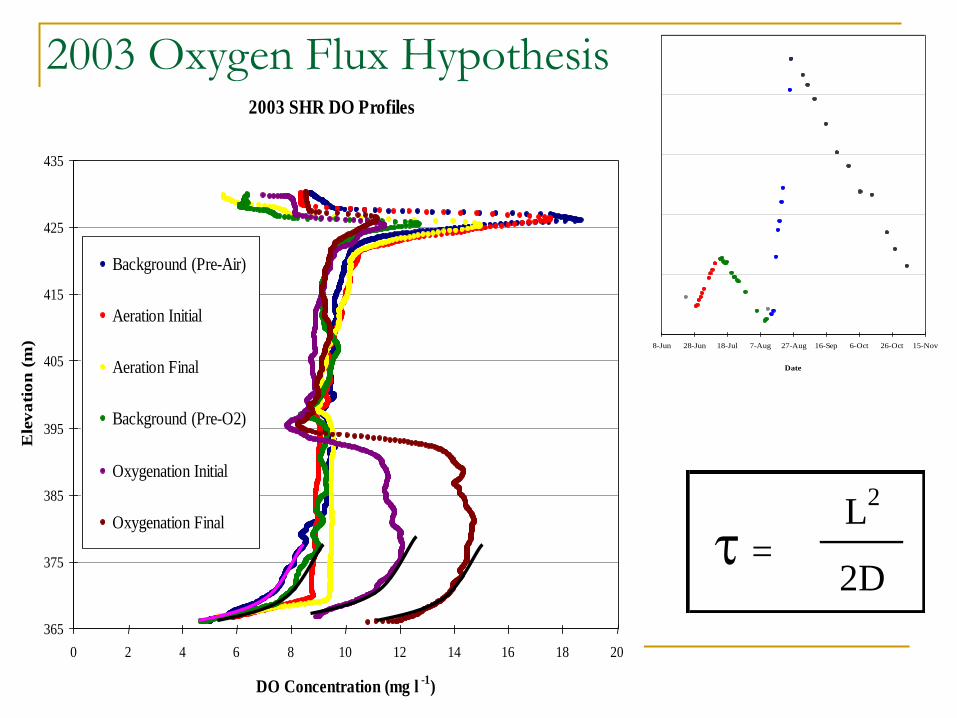
2003 SHR DO Profiles
365
375
385
395
405
415
425
435
0 2 4 6 8 10 12 14 16 18 20
DO Concentration (mg l -1
)
Ele
va
tio
n (
m)
Background (Pre-Air)
Aeration Initial
Aeration Final
Background (Pre-O2)
Oxygenation Initial
Oxygenation Final
2003 Oxygen Flux Hypothesis
L2
2D =

Hypolimnion Temperature
Air O
N
Air O
FF
O2 O
N
O2 O
FF
4.0
4.5
5.0
5.5
6.0
6.5
7.0
19-May 8-Jun 28-Jun 18-Jul 7-Aug 27-Aug 16-Sep 6-Oct 26-Oct
Date
Tem
per
atu
re (
C)
0.008 C d-1
0.073 C d-1
0.007 C d-1
0.020 C d-1
0.004 C d-1
2003 (Induced Mixing Hypothesis)
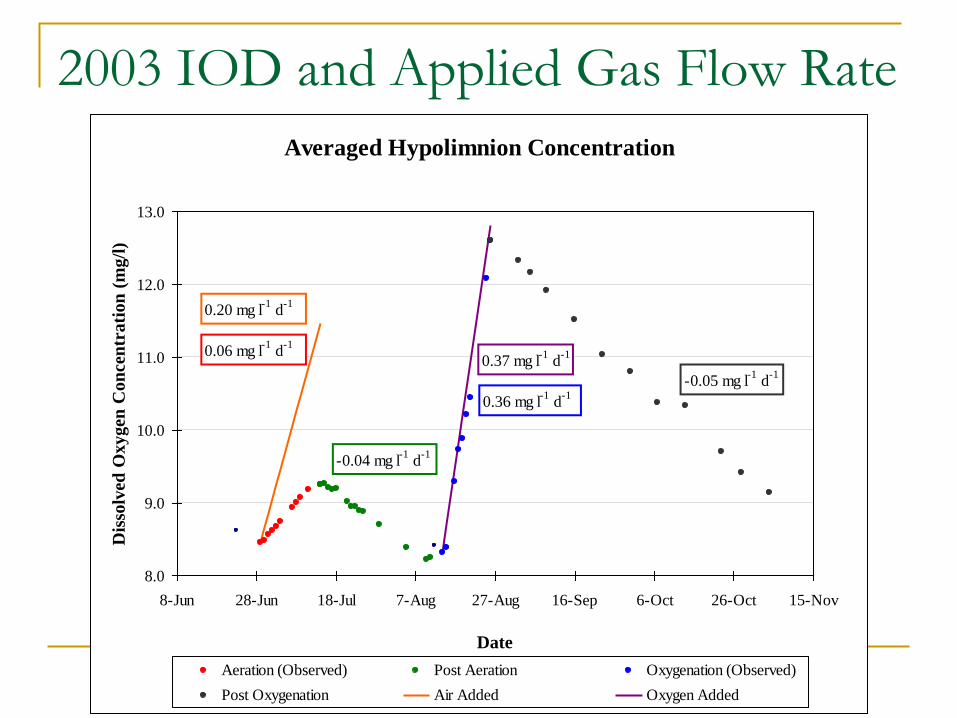
Averaged Hypolimnion Concentration
8.0
9.0
10.0
11.0
12.0
13.0
8-Jun 28-Jun 18-Jul 7-Aug 27-Aug 16-Sep 6-Oct 26-Oct 15-Nov
Date
Dis
solv
ed O
xygen
Con
cen
trati
on
(m
g/l
)
Aeration (Observed) Post Aeration Oxygenation (Observed)
Post Oxygenation Air Added Oxygen Added
0.20 mg l-1
d-1
0.06 mg l-1
d-1
-0.04 mg l-1
d-1
0.37 mg l-1
d-1
0.36 mg l-1
d-1
-0.05 mg l-1
d-1
2003 IOD and Applied Gas Flow Rate
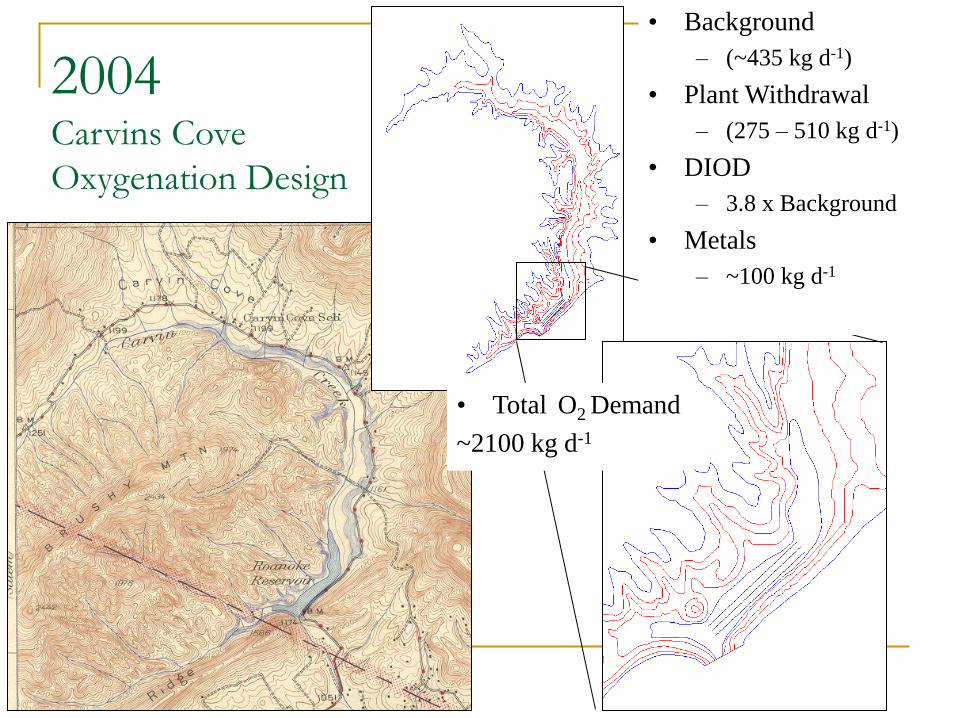
2004 Carvins Cove
Oxygenation Design
• Background
– (~435 kg d-1)
• Plant Withdrawal
– (275 – 510 kg d-1)
• DIOD
– 3.8 x Background
• Metals
– ~100 kg d-1
• Total O2 Demand
~2100 kg d-1

2005 • Carvins Cove Reservoir
• 4000 ft line diffuser (2 x 2000 ft)
• 9000 gallon LOx tank
• 40 SCFM

2005 Carvins
Cove
HOS install

2005 (Oxygenation) Carvins Cove 2005 DO Profiles (July 31 - November 3)
Diffuser Operational / Water Column Stratified
1090
1100
1110
1120
1130
1140
1150
1160
1170
0 1 2 3 4 5 6 7 8 9 10
DO (mg/l)
Ele
vati
on
(ft
)
31-Jul
1-Aug
8-Aug
15-Aug
25-Aug
29-Aug
5-Sep
12-Sep
22-Sep
6-Oct
13-Oct
20-Oct
27-Oct
3-Nov

2006 • Carvins Cove Reservoir
• 4000 ft line diffuser (2 x 2000 ft)
• 9000 gallon LOx tank
• 40 SCFM
• Test water column response to
oxygenation
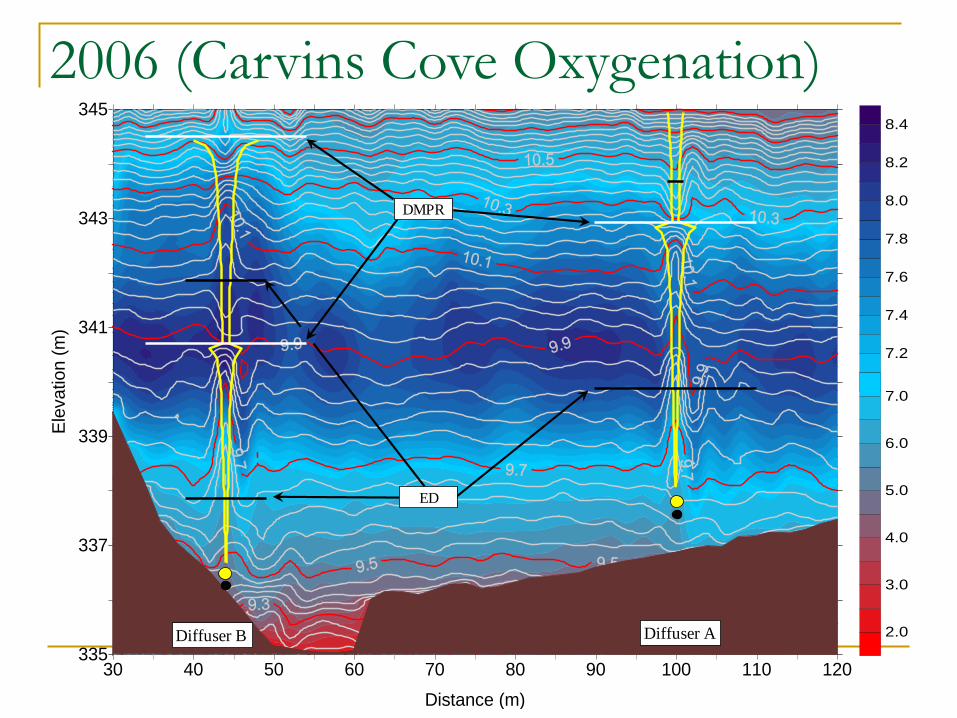
2006 (Carvins Cove Oxygenation)
335
337
339
341
343
345
Ele
vation (
m)
Ele
va
tio
n (
m)
30 40 50 60 70 80 90 100 110 120
Distance (m)
7.2
7.4
7.6
7.8
8.0
8.2
8.4
2.0
3.0
4.0
5.0
6.0
7.0
DMPR
ED
Diffuser ADiffuser B

June 6, 2006
2006
(Carvins Cove
Oxygenation)
June 1, 2006 (Increased flow 15 to 40 SCFM)
x
x x
x
x
x
x

2006 Carvins Cove Diffuser Operation (Off / On)
Diffuser Off
Diffuser On
0
0.2
0.4
0.6
0.8
1
1-Jun 22-Jun 13-Jul 3-Aug 24-Aug
Date (2006)
Man
gan
ese
Co
nce
ntr
atio
n, M
n (
mg
l -1)
_
344.4 m (1130 ft) 341.4 m (1120 ft) 338.3 m (1110 ft)

2006
335
338
341
344
347
351
354
Ele
vation (
m)
1100
1110
1120
1130
1140
1150
1160
Ele
vation (
ft)
0.0
2.0
4.0
6.0
8.0
10.0
12.0
1-Jun 1-Jul 1-Aug 1-Sep 1-Oct 1-Nov
Date (2006)
344.4 m
341.1 m
338.3 m

2007 (Oxygenation) HODmass and Applied Gas Flow Rate
SHR 2003 - 2007
CCR 2005 - 2007
SHR
y = 6x + 50
R2 = 0.9
CCR
y = 22x + 420
R2 = 0.9
0
500
1000
1500
2000
2500
3000
3500
0 20 40 60 80 100 120
Oxygen Flow Rate (NCMH)
HO
Dm
ass
(k
g d
ay -1
) _

2007 O2 Penetration
into Sediment (CCR)
adapted from Bryant et al. 2011
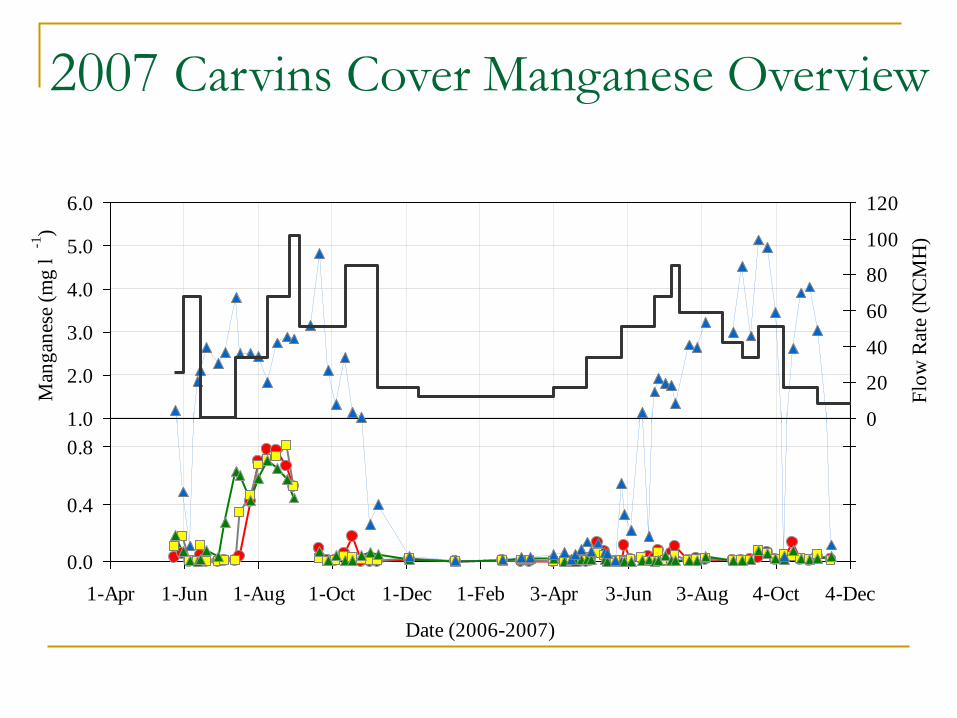
2007 Carvins Cover Manganese Overview
0.0
0.4
0.8
1-Apr 1-Jun 1-Aug 1-Oct 1-Dec 1-Feb 3-Apr 3-Jun 3-Aug 4-Oct 4-Dec
Date (2006-2007)
_
0
40
80
_
1.0
2.0
3.0
4.0
5.0
6.0
Man
gan
ese
(mg
l -1
)_
0
20
40
60
80
100
120
Flo
w R
ate
(NC
MH
) _

2008 - 2010
Jan-00 Jan-01 Jan-02 Jan-03 Jan-04 Jan-05 Jan-06 Jan-07
36529 36712 36895 37078 37261 37444 37627 37810 37993 38176 38359 38542 38725 38908 39091 39274
336
340
344
348
352
356
Ele
vation (
m)
0.0
0.1
0.3
0.4
0.5
1.0
1.5
2.0
2.5
3.0
Off (Jun 15, 06)
On(Jul 12, 06)
Diffuser InstalledAug 1, 05
Jan-00 Jan-01 Jan-02 Jan-03 Jan-04 Jan-05 Jan-06 Jan-07
336
340
344
348
352
356
Ele
vation (
m)
36600 36800 37000 37200 37400 37600 37800 38000 38200 38400 38600 38800 39000 39200 39400 0.0
0.1
0.5
1.0
2.0
3.0
4.0Off (Jun 15, 06)
On(Jul 12, 06)
Diffuser InstalledAug 1, 05
Iron Manganese

2008 - 2010
Operational
Impact on Mn
755 kg/day
917 kg/day
830 kg/day
975 kg/day
1126 kg/day
0
2,000,000
4,000,000
6,000,000
8,000,000
10,000,000
12,000,000
2004 2005 2006 2007 2008 2009 2010
Year
Oxygen
Del
iver
ed (
SC
F)
_
$2,246 Avg
$47,171 Total
$1,912 Avg
$55,434 Total
$2,134 Avg
$64,029 Total
$2,482 Avg
$52,116 Total
$3,067 Avg
$42,932 Total
0.0
0.2
0.4
0.6
0.8
1.0
1.2
1.4
Jan-06 Jan-07 Jan-08 Jan-09 Jan-10 Jan-11
Mn C
once
ntr
atio
n (
mg l -1
)
_
1140 1130 1120 1110
0
0.5
1
1.5
2
2.5
3
3.5
Jan-01 Jan-02 Jan-03 Jan-04 Jan-05 Jan-06 Jan-07 Jan-08 Jan-09 Jan-10 Jan-11 Jan-12
Date
Man
gan
ese,
Mn (
mg l -1
) _
Bottom Total Mn Bottom Soluble Mn Hypolimnion Total Mn Hypolimnion Soluble Mn
Gantzer Water Resources Engineering, LLC
Re-oxygenate Continuous

2008 – 2010
Spring Hollow
O2 depletion rate
over time

2011 Falling Creek
Hybrid Design
Problems:
• Algae
• Mn, Fe, PO4
• Hypolimnetic Anoxia
• Detritus / Metalimnetic minimum
Solutions:
• Deeper epilimnion
• Raise DO > 5 mg/l
• Hypolimnetic Oxygenation
• Zone aerate/oxygenate
170 200 230 260 290 320 3501200
1220
1240
1260
1280
1300
1320
1340
1360
2001
Algae
50 80 110 140 170 200 230 260 290 320
1200
1220
1240
1260
1280
1300
1320
1340
1360
1997
0.0
1.0
2.0
3.0
4.0
5.0
6.0
7.0
8.0
9.0
10.0
11.0
12.0
13.0
14.0
15.0
Detritus
Anoxia

Withdrawal
Elevations
2011 Falling Creek Hybrid Design Destrat
SS
Depth (m) Elevation (m) Elevation (ft) cum MG % Total Volume
0.1 506.9 1663.0
0.4 506.6 1662.0 81.6
0.7 506.3 1661.0 72.3 0.89
1.0 506.0 1660.0 63.6 0.78
1.3 505.7 1659.0 55.7 0.68
1.6 505.4 1658.0 48.4 0.59
1.9 505.1 1657.0 41.9 0.51
2.3 504.7 1656.0 36.1 0.44
2.6 504.4 1655.0 30.9 0.38
2.9 504.1 1654.0 26.5 0.32
3.2 503.8 1653.0 22.7 0.28
3.5 503.5 1652.0 19.5 0.24
3.8 503.2 1651.0 16.8 0.21
4.1 502.9 1650.0 14.4 0.18
4.4 502.6 1649.0 12.2 0.15
4.7 502.3 1648.0 10.2 0.13
5.0 502.0 1647.0 8.5 0.10
5.3 501.7 1646.0 7.1 0.09
5.6 501.4 1645.0 5.8 0.07
5.9 501.1 1644.0 4.7 0.06
6.2 500.8 1643.0 3.8 0.05
6.5 500.5 1642.0 3.0 0.04
6.8 500.2 1641.0 2.3 0.03
7.1 499.9 1640.0 1.7 0.02
7.4 499.6 1639.0 1.2 0.01
7.7 499.3 1638.0 0.8 0.01
8.0 499.0 1637.0 0.4 0.01
8.3 498.7 1636.0 0.2 0.00
8.7 498.3 1635.0 0.1 0.00
9.0 498.0 1634.0 0.0 0.00
9.3 497.7 1633.0 0.0 0.00
Destratify
Oxygenate
Transition
90%
1 (10)%

2012 Falling
Creek Install /
Testing
Buoyancy
Lines
• Pump Inlet
• Oxygenation out
• Destrat
• Conduit (fiber optics)
1. Conduit
2. Chemical Feed
3. Destrat
1 2
3
Saturation
chamber Destrat
(Air supply)
PSA
(O2 supply) Pump
controller

2012 Falling Creek Oxygenation
(SSS)
• Submersible pump
w/ VFD (60 GPM/50 psi)
• Saturation chamber
• O2 supply (PSA)*
• Uniform discharge
header (250 ft)
• 32 SCFH (.53 SCFM)
• 65 psia 90% Purity
• 25 kg/d (Background DO demand 5 kg/d)
*
Centrox

2012 Falling Creek Diffused Air Mixing, aka VEMmer (+ Chemical Feed)
• Dual elevation (5 meter
or 1.5’ above bottom)
• 750 ft long with 90ft
ON/OFF sections
• Chemical feed 9 GPM
• One (1 GPM) nozzle per destrat section
497
499
501
503
505
507
0.0 5.0 10.0 15.0 20.0 25.0 30.0
Temperature (deg C) and DO (mg/l)
Ele
vati
on
(m
) _
497
499
501
503
505
507
-25 -20 -15 -10 -5 0 5 10 15 20 25
Plume Width (m)
Ele
vati
on
(m
) _
Temp_C DO_mg/l TPLUME COMG B ED DMPR
Gantzer Water Resources Engineering, LLC
DT 2 ºC 12 SCFM
~95 MGD 18 Hours
KAESER: SX-7.5 SIGMA Profile Rotary Screw Air
Compressor 28 cfm @ 125 psig
Station
10 20 30 35 25 15 5 20 & 25
Av
erag
e S
tati
on
Dif
fere
nce
-2
-1
0
1
2
Baseline O2 demand
(initial)
(-0.05 g/m3day)
3 days O2 accumulation
(0.40 g/m3day)
Remainder O2 accumulation
(0.13 g/m3day)
1 week following oxygenation
(-0.14 g/m3day)
Baseline O2
demand (final)
(-0.05 g/m3day)
2.00
3.00
4.00
5.00
6.00
7.00
8.00
13-Jul 12-Aug 11-Sep 11-Oct 10-Nov
Time (Days)
Dis
solv
ed O
xyge
n (g
/m3)
Diffuser Induced O2 Demand
0.27 and 0.09 g/m3day
370
380
390
400
410
420
Ele
vation (
m)
200 220 240 260 280 300 320 340
Julian Day (2001)
370
375
380
385
390
395
400
405
410
415
420
425
0.0
1.0
2.0
3.0
4.0
5.0
6.0
8.0
10.0
12.0
14.0
16.0
2003 SHR DO Profiles
365
375
385
395
405
415
425
435
0 2 4 6 8 10 12 14 16 18 20
DO Concentration (mg l -1
)
Ele
va
tio
n (
m)
Background (Pre-Air)
Aeration Initial
Aeration Final
Background (Pre-O2)
Oxygenation Initial
Oxygenation Final
330
335
340
345
350
355
360
6.0 11.0 16.0 21.0 26.0 31.0Temperature (C)
Ele
vat
ion (
m)
_
330
335
340
345
350
355
360
0.0 1.0 2.0 3.0 4.0 5.0 6.0 7.0 8.0 9.0 10.0
Dissolved Oxygen (mg l -1
)
Ele
vat
ion (
m)
_
31-Jul 1-Aug 8-Aug 15-Aug 29-Aug 5-Sep 22-Sep 13-Oct 3-Nov
336
340
344
348
352
Ele
vation (
m)
0 200 400 600 800 1000 1200 1400 1600 1800
Distance (m)
Carvins Cove Reservoir June 6, 2006
Withdrawal Elevation
344.4
347.5
DMPR
ED
Diffuser-B
Diffuser-A
Horizontal Spreading
Diffuser Off
Diffuser On
0
0.2
0.4
0.6
0.8
1
1-Jun 22-Jun 13-Jul 3-Aug 24-Aug
Date (2006)
Man
gan
ese
Co
nce
ntr
atio
n, M
n (
mg
l -1)
_
344.4 m (1130 ft) 341.4 m (1120 ft) 338.3 m (1110 ft)
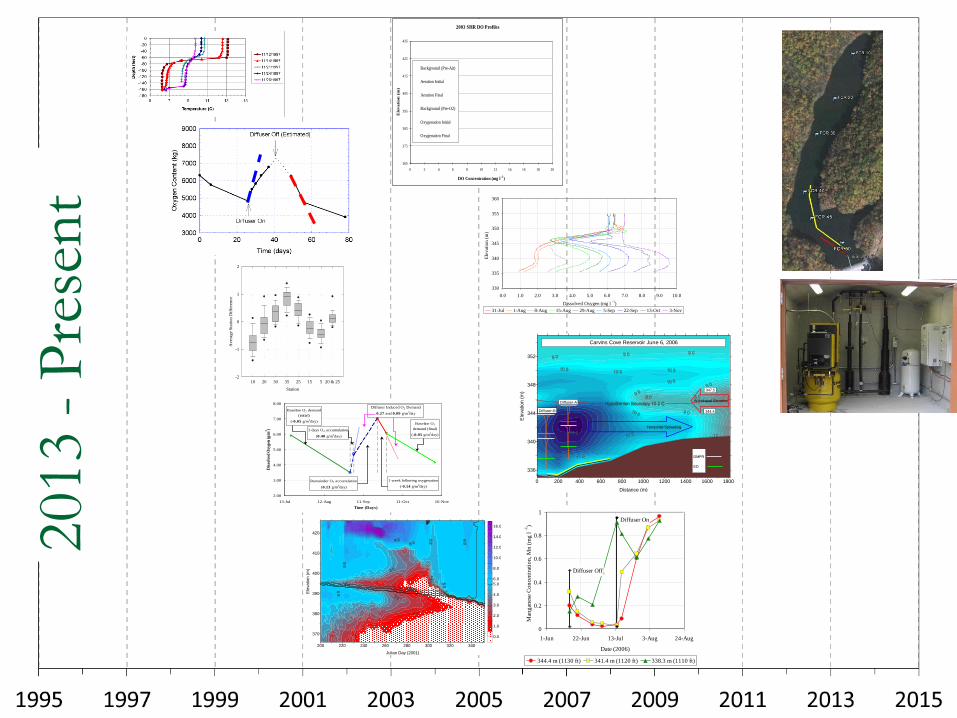
2013 -
Pre
sen
t