2015 labor day report: annual report on the state of montana’s economy barbara wagner chief...
TRANSCRIPT
2015 Labor Day
Report:
Annual Report on the State of Montana’s Economy
Barbara WagnerChief Economist
Labor Arbitration ConferenceOctober 8, 2015
Fairmont, MT

Today’s Agenda
1. Overview of Montana’s Economic Performance
2. Worker Shortage Ahead
3. Some Stats on Unions
4. Potentially Helpful Tools

Montana’s Economic Growth ContinuesU.S. and Montana Personal Income Growth
Source: Bureau of Economic Analysis 3
9th fastest growth over five years

1 2 3 4 1 2 3 4 1 2 3 4 1 2 3 4 1 2 3 4 1 2 3 4 1 2 3 4 1
2008 2009 2010 2011 2012 2013 2014 2015
-3%
-2%
-1%
0%
1%
2%
3%
4%
USMT
Personal Income by Quarter
Source: Bureau of Economic Analysis

1 2 3 4 1 2 3 4 1 2 3 4 1 2 3 4 1 2 3 4 1 2 3 4 1 2 3 4 1
2008 2009 2010 2011 2012 2013 2014 2015
-3%
-2%
-1%
0%
1%
2%
3%
4%
USMT
Fiscal Cliff
Fed Gov.Shutdown
Personal Income by Quarter
Source: Bureau of Economic Analysis

1 2 3 4 1 2 3 4 1 2 3 4 1 2 3 4 1 2 3 4 1 2 3 4 1 2 3 4 1
2008 2009 2010 2011 2012 2013 2014 2015
-3%
-2%
-1%
0%
1%
2%
3%
4%
USMT
Oil Price Slide
Personal Income by Quarter
Source: Bureau of Economic Analysis

Oil Price Decline Slowed Employment Growth, but Not Wage Growth
Source: Quarterly Census of Employment and Wages, BLS and MT DLI

Employment and Labor Force Expanding

Employment and Labor Force Expanding
Job growth of over
2,000 jobs per
month in 2015
2004
2005
2006
2007
2008
2009
2010
2011
2012
2013
2014
2015
Esti
mat
ed
-5%
-4%
-3%
-2%
-1%
0%
1%
2%
3%
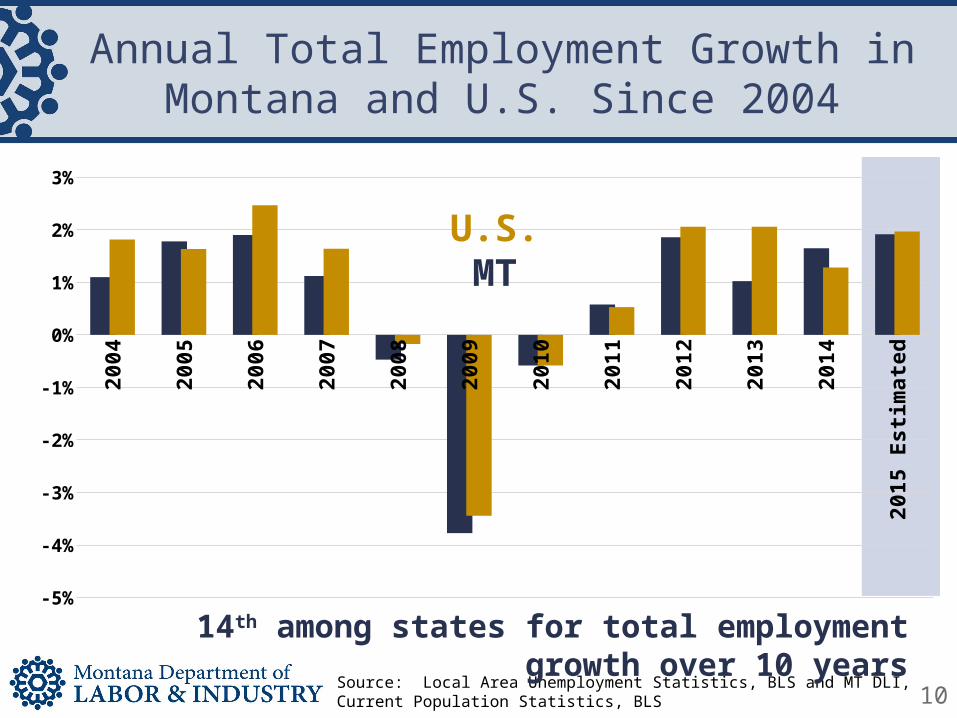
Annual Total Employment Growth in Montana and U.S. Since 2004
U.S.MT
Source: Local Area Unemployment Statistics, BLS and MT DLI, Current Population Statistics, BLS 10
14th among states for total employment growth over 10 years
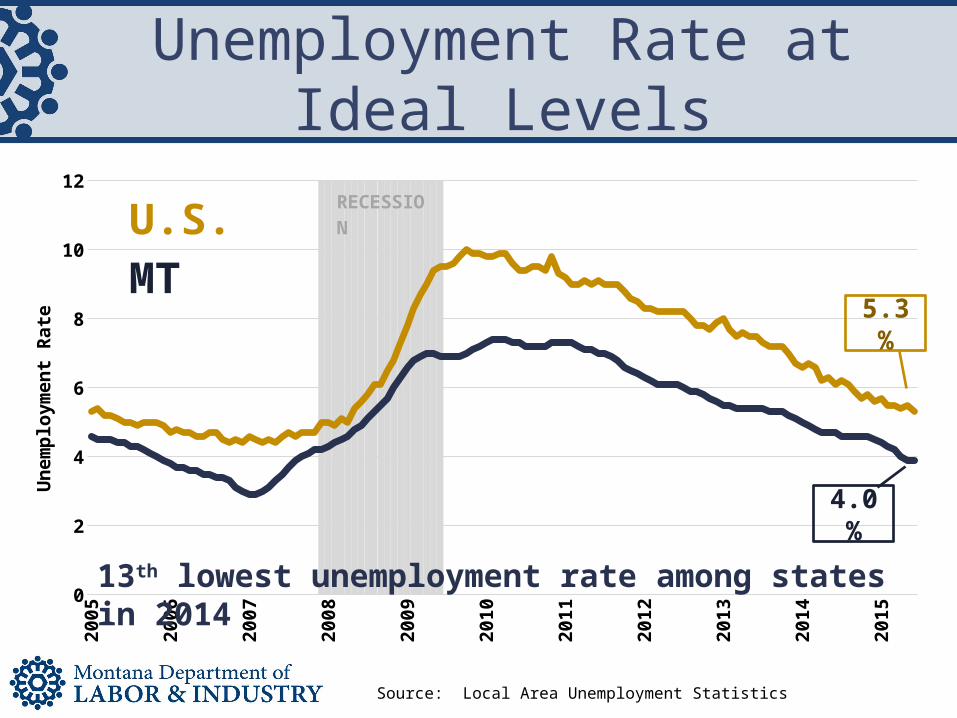
Unemployment Rate at Ideal Levels
Source: Local Area Unemployment Statistics
2005
2006
2007
2008
2009
2010
2011
2012
2013
2014
2015
0
2
4
6
8
10
12
0
1
Une
mpl
oym
ent R
ate
U.S.MT
RECES-SION
5.3%
4.0%
13th lowest unemployment rate among states in 2014

Unemployment Rate at Ideal Levels
Source: Local Area Unemployment Statistics
2005
2006
2007
2008
2009
2010
2011
2012
2013
2014
2015
0
2
4
6
8
10
12
0
1
Une
mpl
oym
ent R
ate
U.S.MT
RECES-SION
4.0%
Normal Unemployment Range

Strong Wage GrowthMontana Average Annual Wages
2009 2010 2011 2012 2013 2014$32,000
$33,000
$34,000
$35,000
$36,000
$37,000
$38,000
$39,000
$40,000
0.0%
0.5%
1.0%
1.5%
2.0%
2.5%
3.0%
3.5%
4.0%
$34,596
$35,791
$37,096$37,575
$38,874
Ave
rage
Ann
ual W
age
Gro
wth
Rat
e
MT Average WageWage Growth
Source: Quarterly Census of Employment and Wages

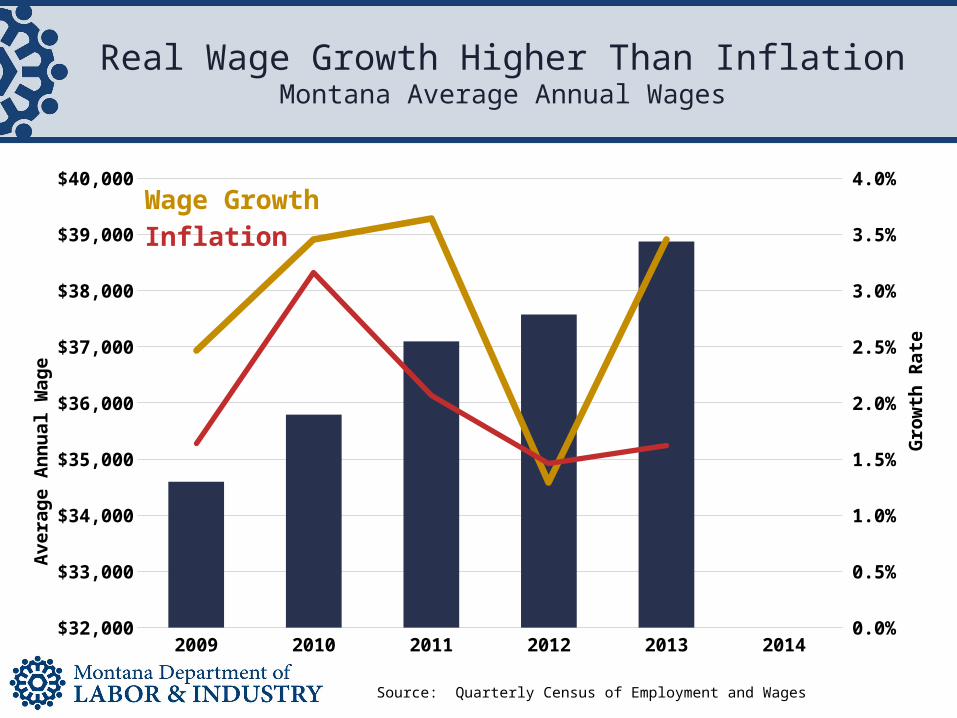
Real Wage Growth Higher Than InflationMontana Average Annual Wages
2009 2010 2011 2012 2013 2014$32,000
$33,000
$34,000
$35,000
$36,000
$37,000
$38,000
$39,000
$40,000
0.0%
0.5%
1.0%
1.5%
2.0%
2.5%
3.0%
3.5%
4.0%
Ave
rage
Ann
ual W
age
Gro
wth
Rat
e
Wage GrowthInflation
Source: Quarterly Census of Employment and Wages

Real Wage Growth Higher Than InflationMontana Average Annual Wages
2009 2010 2011 2012 2013 2014$32,000
$33,000
$34,000
$35,000
$36,000
$37,000
$38,000
$39,000
$40,000
0.0%
0.5%
1.0%
1.5%
2.0%
2.5%
3.0%
3.5%
4.0%
Ave
rage
Ann
ual W
age
Gro
wth
Rat
e
REAL WAGE GROWTHWage GrowthInflation
Source: Quarterly Census of Employment and Wages

Montana Wages and Income Low Compared to NationMontana Income and Compensation as Percent of U.S. (2005 Dollars)
19291932
19351938
19411944
19471950
19531956
19591962
19651968
19711974
19771980
19831986
19891992
19951998
20012004
20072010
201350%
60%
70%
80%
90%
100%
110%
120%
Inco
me/
Wag
es a
s Pe
rcen
t of U
.S.
Source: Bureau of Economic Analysis, Bureau of Labor Statistics, analysis by MT DLI
Per Capita IncomeCompensation
Wages

Real Montana Wage Growth by Ownership
2010 2011 2012 2013 2014
-6.0%
-4.0%
-2.0%
0.0%
2.0%
4.0%
6.0%
State GovernmentLocal Government
PrivateFederal Government

Strong Wage Growth in All Regions of State
Source: Quarterly Census of Employment and Wages, MT Dept. of Labor and Industry

Take Away Points
• Montana’s economy is doing pretty awesome.
– 5th fastest wage growth over five years• Wage growth driven by private sector
– 5th fastest GDP growth over five years
– 7th fastest personal income growth over five years
– 13th lowest unemployment rate last year

Job Growth Over Last Year By Industry
Trade
Education and Health Care
Construction
Manufacturing
Leisure Activities
Government
Agriculture
Transportation
Financial Activities
Mining and Utilities
Business Services
Other
(1,000) (500) - 500 1,000 1,500
Source: Quarterly Census of Employment and Wages, MT Dept. of Labor and Industry
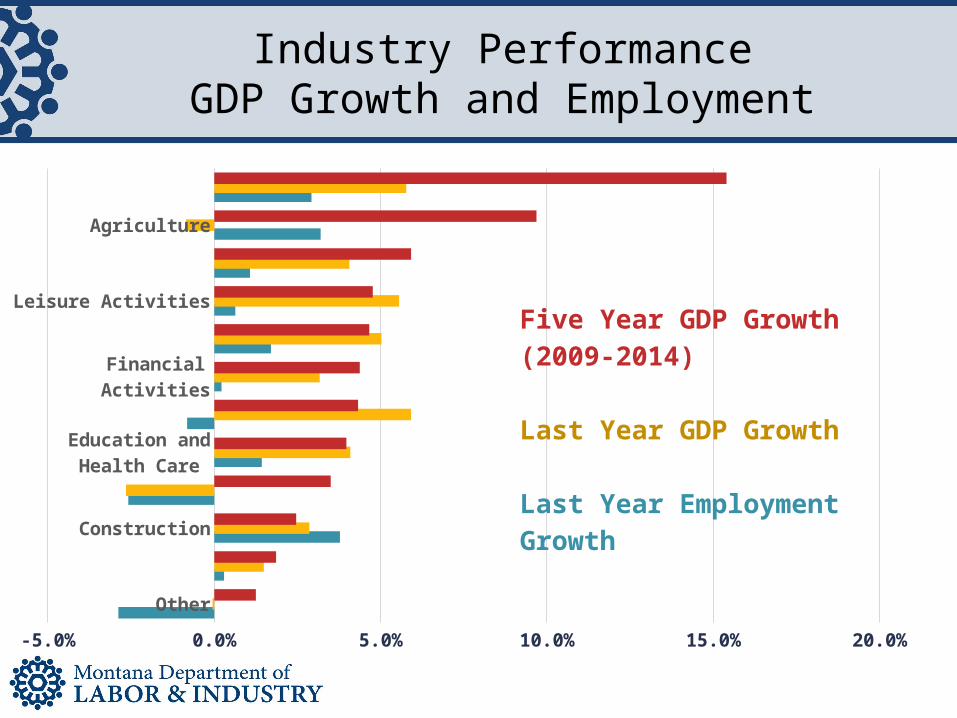
Industry PerformanceGDP Growth and Employment
Other
Government
Construction
Mining and Utilities
Education and Health Care
Business Services
Financial Activities
Trade
Leisure Activities
Transportation
Agriculture
Manufacturing
-5.0% 0.0% 5.0% 10.0% 15.0% 20.0%
Five Year GDP Growth (2009-2014)
Last Year GDP Growth
Last Year Employment Growth
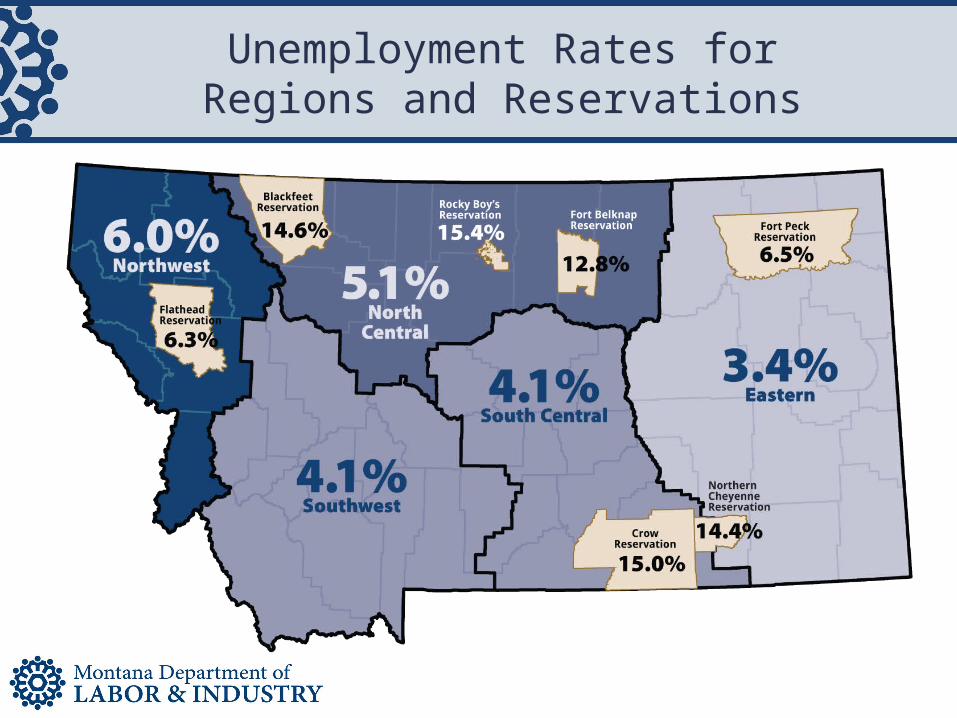
Unemployment Rates forRegions and Reservations
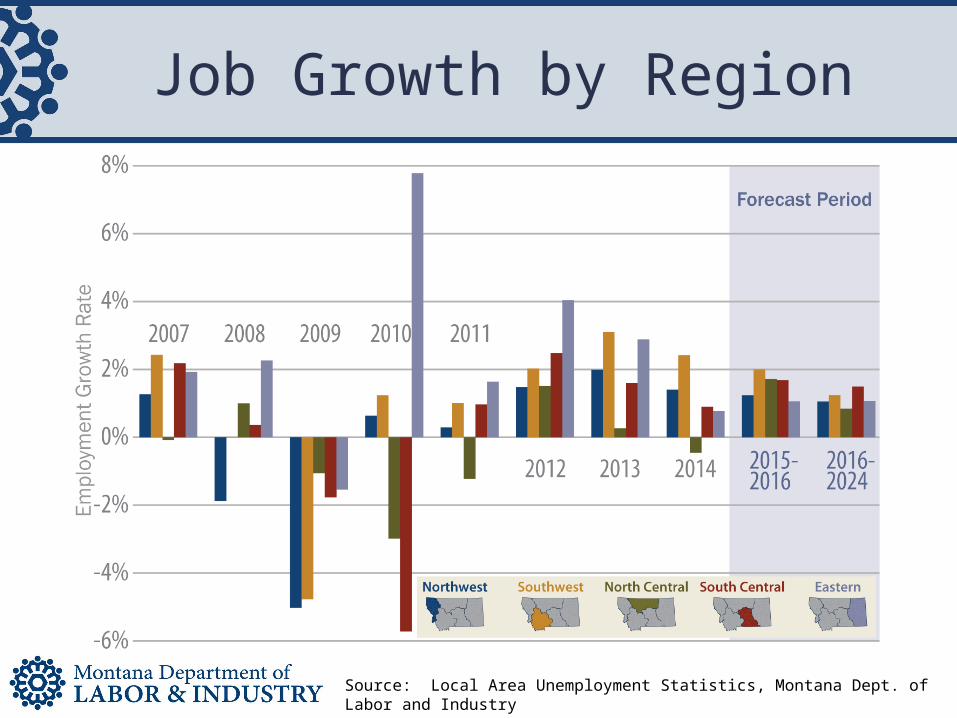
Job Growth by Region
Source: Local Area Unemployment Statistics, Montana Dept. of Labor and Industry

Reservation AreasPercent Employment Change over Prior Year
Blackfeet Crow Flathead Fort Belknap Fort Peck Northern Cheyenne
Rocky Boy
-8%
-6%
-4%
-2%
0%
2%
4%
6%
8%
2011 2012 2013 2014 2015 Estimated
Source: Local Area Unemployment Statistics for Reservation Areas, Montana Dept. of Labor and Industry

South Central Region and Cascade CountyEmployment Change over Prior Year
2010 2011 2012 2013 2014
-7%
-6%
-5%
-4%
-3%
-2%
-1%
0%
1%
2%
3%
Cascade CountyNorth Central RegionMontana
Source: Local Area Unemployment Statistics, Montana Dept. of Labor and Industry
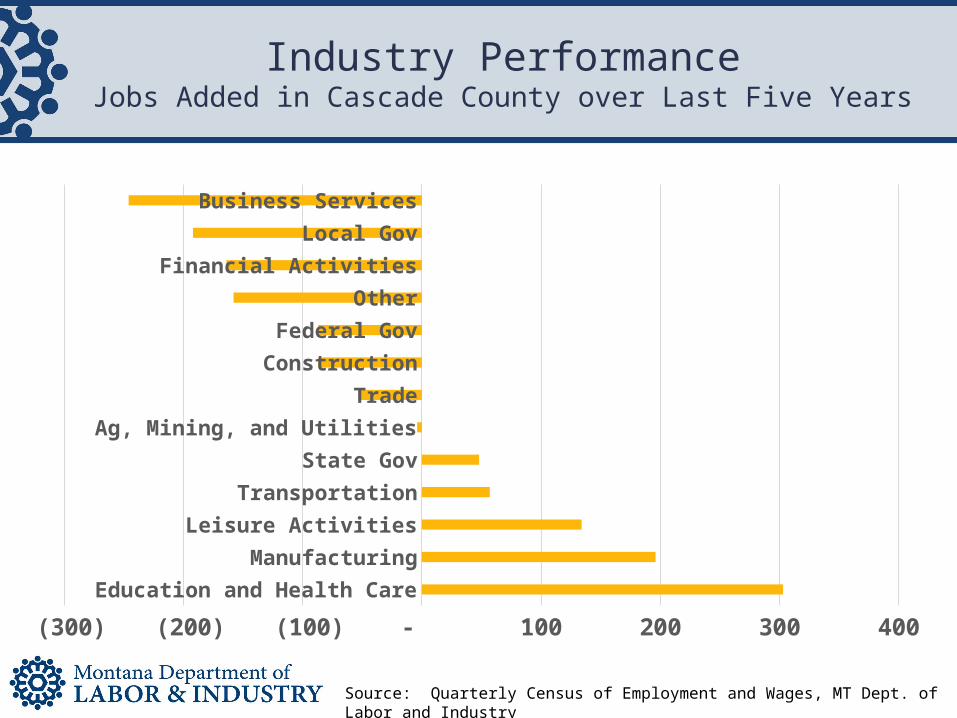
Industry PerformanceJobs Added in Cascade County over Last Five Years
Education and Health CareManufacturing
Leisure ActivitiesTransportation
State GovAg, Mining, and Utilities
TradeConstructionFederal Gov
OtherFinancial Activities
Local GovBusiness Services
(300) (200) (100) - 100 200 300 400
Source: Quarterly Census of Employment and Wages, MT Dept. of Labor and Industry
Upcoming Challenges
1. Strengthening dollar
2. Low oil and commodity prices
3. Worker shortage

World GDP Growth
2012 2013 2014 2015 2016 2017
-4%
-2%
0%
2%
4%
6%
8%
10%
U.S. ChinaSouth Asia
Euro AreaJapanRussia
FORECASTED
Source: World Bank Global Outlook, June 2014

U.S. Economy Doing Better Than Rest of World
• Dollar strengthens against other currencies– Harms exporting industries– Imports less expensive
• Reduced global demand for commodities
$ € £ ¥
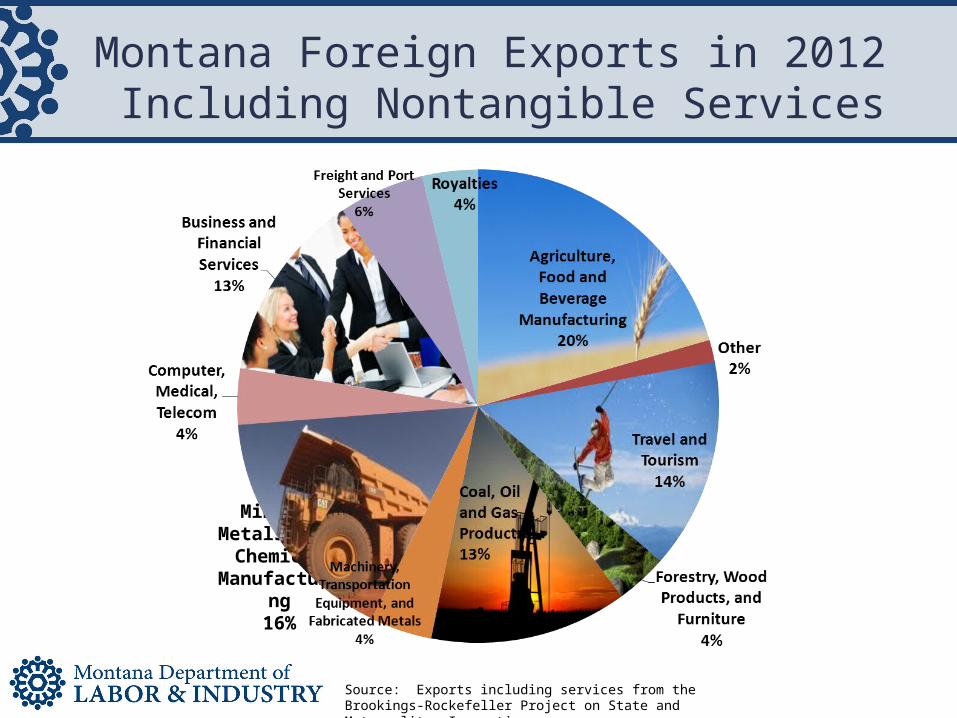
Montana Foreign Exports in 2012 Including Nontangible Services
Source: Exports including services from the Brookings-Rockefeller Project on State and Metropolitan Innovation.
Mining, Metals, and Chemical
Manufacturing16%

Impacts of Lower Commodity Prices
• Low oil prices slowed personal income and employment growth in 2nd half of 2014.– Job losses in Eastern region have stabilized– Related job losses in temporary employment services
• Mining lost 311 jobs in 2014, but not in oil and gas mining.
• Petroleum refining expected to remain stable.– Refining comprises over half of manufacturing output.– 3.9% of GDP in 2014 (compared to 1.2% for oil and gas
extraction)

Labor Force Participation Recovering from Recession in Montana
Source: Local Area Unemployment Statistics for Montana and Current Population Survey for U.S., Bureau of Labor Statistics and MT Dept of Labor and Industry (MT DLI)
Montana and U.S. Labor Force Participation Rates Since 1976

U.S. Labor Force Participation by Age GroupFewer Working in Younger Generations
1950
1952
1954
1956
1958
1960
1962
1964
1966
1968
1970
1972
1974
1976
1978
1980
1982
1984
1986
1988
1990
1992
1994
1996
1998
2000
2002
2004
2006
2008
2010
2012
0
10
20
30
40
50
60
70
80
90
U.S
. Lab
or F
orce
Par
ticip
ation
65 and Older
25 to 29 30 to 3435 to 44 45 to 54
55 to 64
16 to 19
20 to 24
Source: Current Population Statistics, U.S. Bureau of Labor Statistics
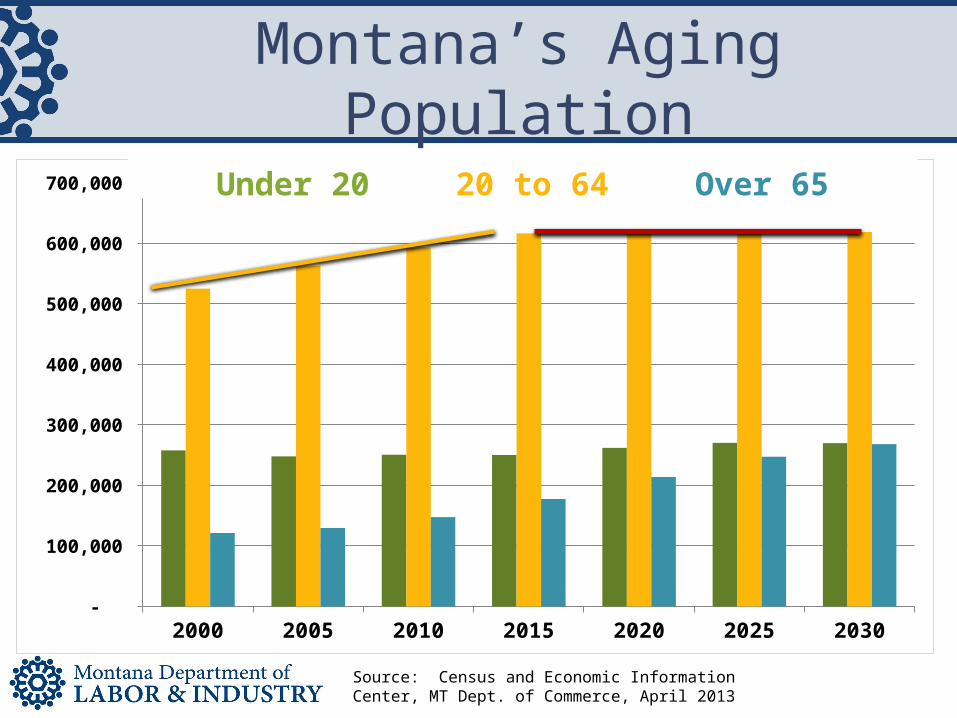
Montana’s Aging Population
Source: Census and Economic Information Center, MT Dept. of Commerce, April 2013
2000 2005 2010 2015 2020 2025 2030 -
100,000
200,000
300,000
400,000
500,000
600,000
700,000 Under 20 20 to 64 Over 65
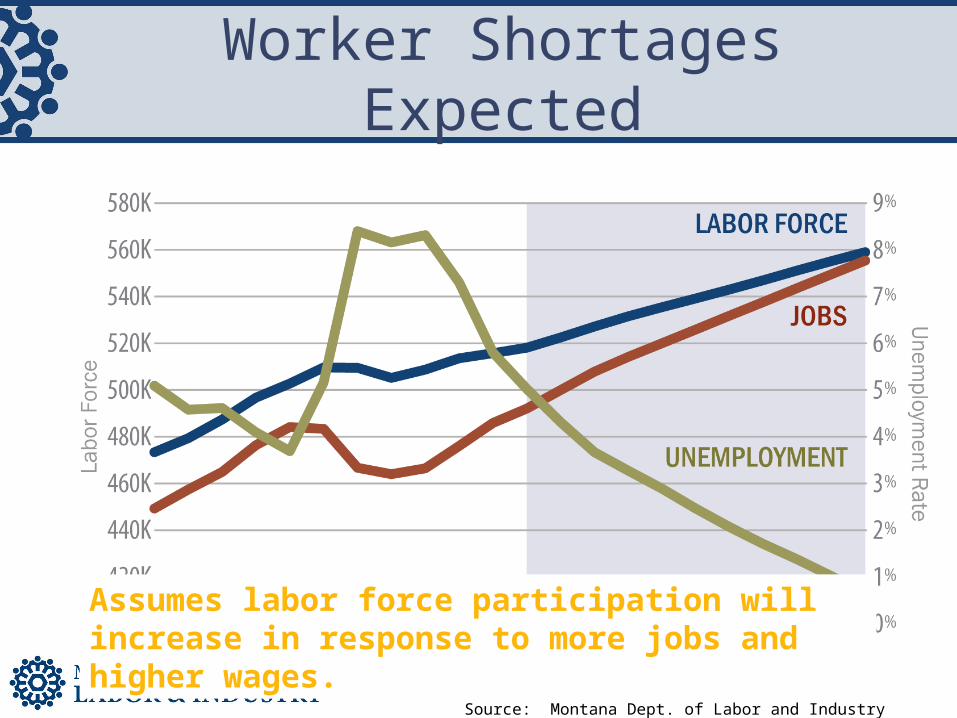
Worker Shortages Expected
Assumes labor force participation will increase in response to more jobs and higher wages.
Source: Montana Dept. of Labor and Industry Employment Forecasts

Job Forecasts Expect Slightly Slower Growth Due to Worker Shortage
Expect per year:6,500 more jobs
4,100 new workers

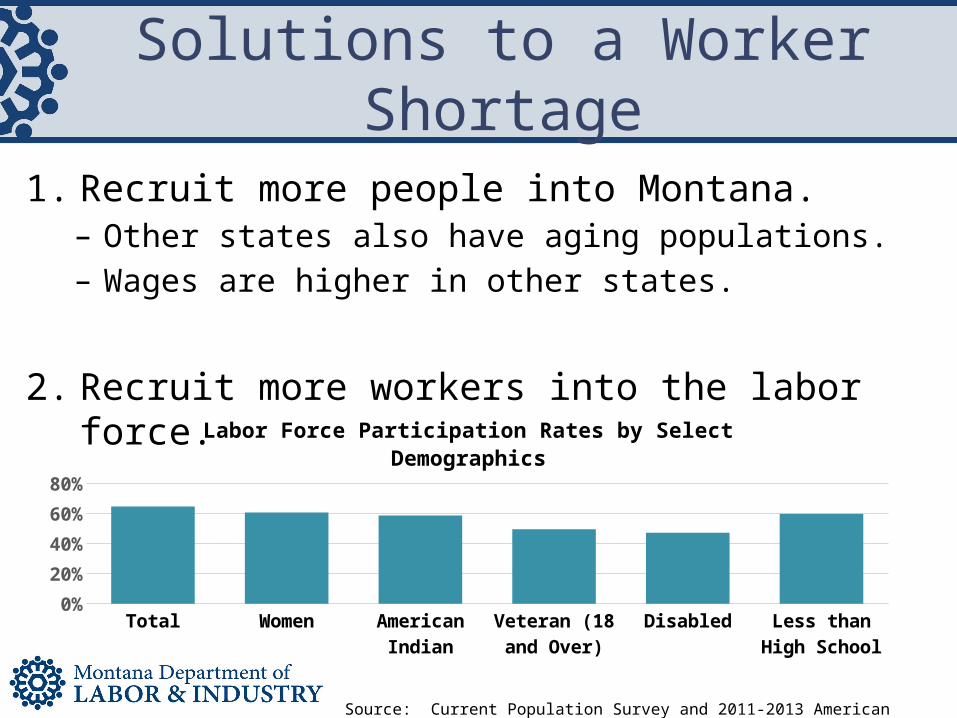
Solutions to a Worker Shortage
1. Recruit more people into Montana.– Other states also have aging populations.– Wages are higher in other states.
2. Recruit more workers into the labor force.
Total Women American Indian
Veteran (18 and Over)
Disabled Less than High School
0%10%20%30%40%50%60%70%
Labor Force Participation Rates by Select Demographics
Source: Current Population Survey and 2011-2013 American Community Survey

Solutions to a Worker Shortage
3. More full-time employment.– 6th highest percent of part time work in the nation.– Shortest work week in the nation.
Male
Female
76%
57%
7%
14%
17%
19%
Part-time Employment by Gender
Full-time, Year-roundPart-time, year-round
Part-year, Part-time
Construction and extraction
Installation and repair
Protective service
Computer and math
Management
Building cleaning and maintenance
Arts and media
Sales and related
Legal
Food preparation and serving
Business and financial
Community services
Office and admin
Education and library
Healthcare practitioner
Personal care
Healthcare support
0% 10% 20% 30% 40% 50% 60% 70% 80% 90% 100%
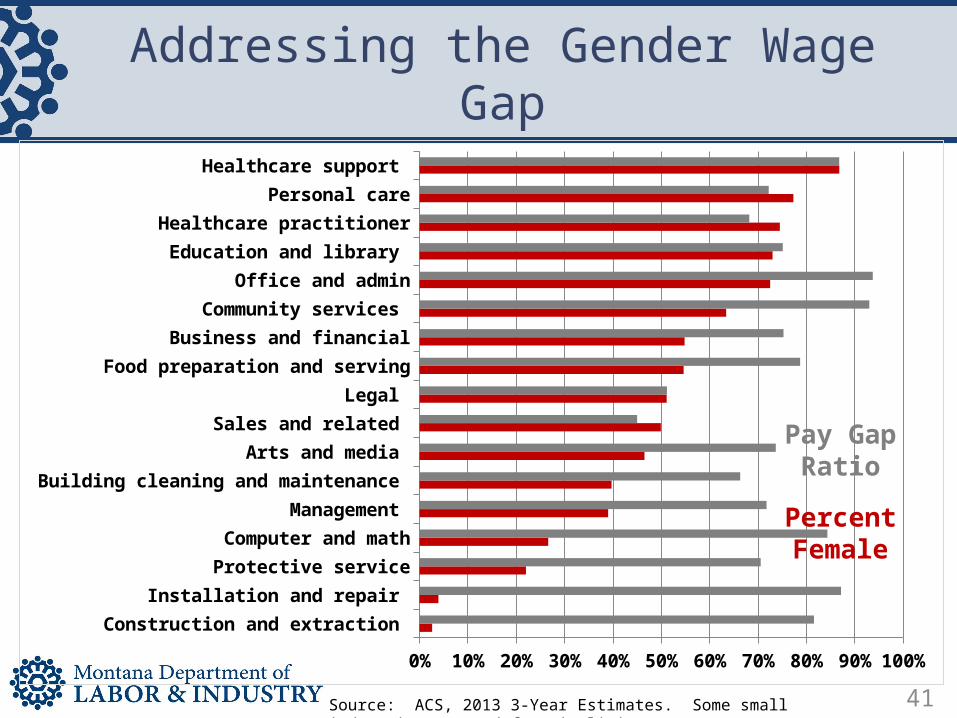
Addressing the Gender Wage Gap
41
Pay Gap Ratio
Percent Female
Source: ACS, 2013 3-Year Estimates. Some small industries removed for simplicity.

Solutions to a Worker Shortage
4. Reduce time out of labor force for retraining.– More on-the-job training like internships and apprenticeships.– More business-paid training for specific skills.
5. Improve labor productivity to produce more with fewer workers.– Technology improvements– Better job matching– More training for professionals

Take Away Points
• U.S. and Montana economies have momentum to weather international troubles.
• Tight labor markets expected.
– Workplaces may have different culture in the future as businesses work to recruit atypical workers.
– Creativity in hiring and retention practices
Today’s Agenda
1. Overview of Montana’s Economic Performance
2. Worker Shortage Ahead
3. Some Stats on Unions
4. Potentially Helpful Tools

Union Coverage by StatePercent of Employment who are Members in a Union or Covered by a Union
0
5
10
15
20
25
30
Sout
h Ca
rolin
aN
orth
Car
olin
aM
issi
ssip
piU
tah
Geo
rgia
Ark
ansa
sTe
nnes
see
Sout
h D
akot
aVi
rgin
iaTe
xas
Loui
sian
aA
rizo
naId
aho
Nor
th D
akot
aFl
orid
aO
klah
oma
New
Mex
ico
Wyo
min
gN
ebra
ska
Kans
asM
isso
uri
D.C
.Co
lora
doD
elaw
are
New
Ham
pshi
reW
est
Virg
inia
Indi
ana
Ala
bam
aM
aine
Wis
cons
inIo
wa
Kent
ucky
Verm
ont
Mar
ylan
dPe
nnsy
lvan
iaM
onta
naO
hio
Mas
sach
usett
sM
inne
sota
Mic
higa
nCo
nnec
ticut
Rhod
e Is
land
Illin
ois
Nev
ada
Ore
gon
New
Jers
eyCa
lifor
nia
Was
hing
ton
Haw
aii
Ala
ska
New
Yor
k
MembersCovered by Unions, but not Members
Source: Current Population Survey, compiled by Union Membership and Coverage Database at www.unionstats.com.
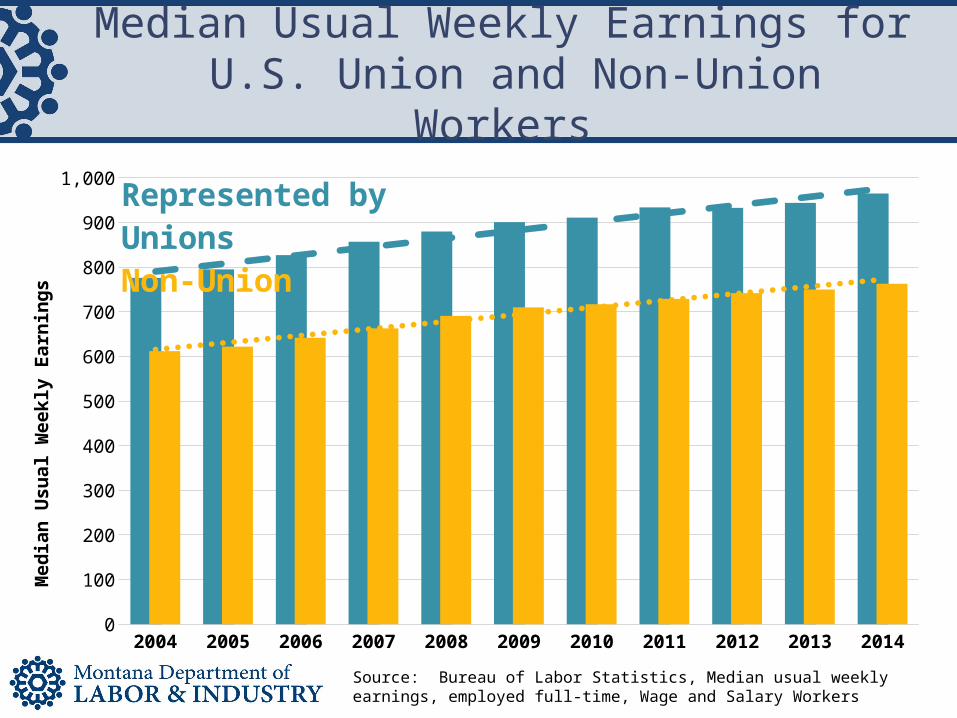
Median Usual Weekly Earnings for U.S. Union and Non-Union Workers
2004 2005 2006 2007 2008 2009 2010 2011 2012 2013 20140
100
200
300
400
500
600
700
800
900
1,000
Med
ian
Usu
al W
eekl
y Ea
rnin
gs
Represented by UnionsNon-Union
Source: Bureau of Labor Statistics, Median usual weekly earnings, employed full-time, Wage and Salary Workers
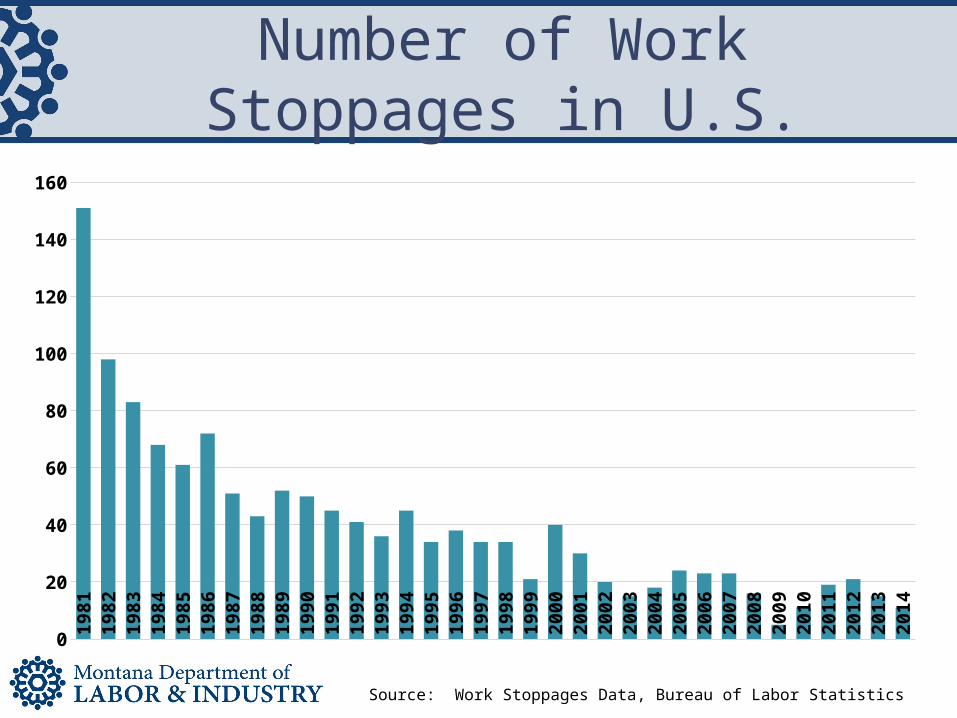
Number of Work Stoppages in U.S.
0
20
40
60
80
100
120
140
160
1981
1982
1983
1984
1985
1986
1987
1988
1989
1990
1991
1992
1993
1994
1995
1996
1997
1998
1999
2000
2001
2002
2003
2004
2005
2006
2007
2008
2009
2010
2011
2012
2013
2014
Source: Work Stoppages Data, Bureau of Labor Statistics
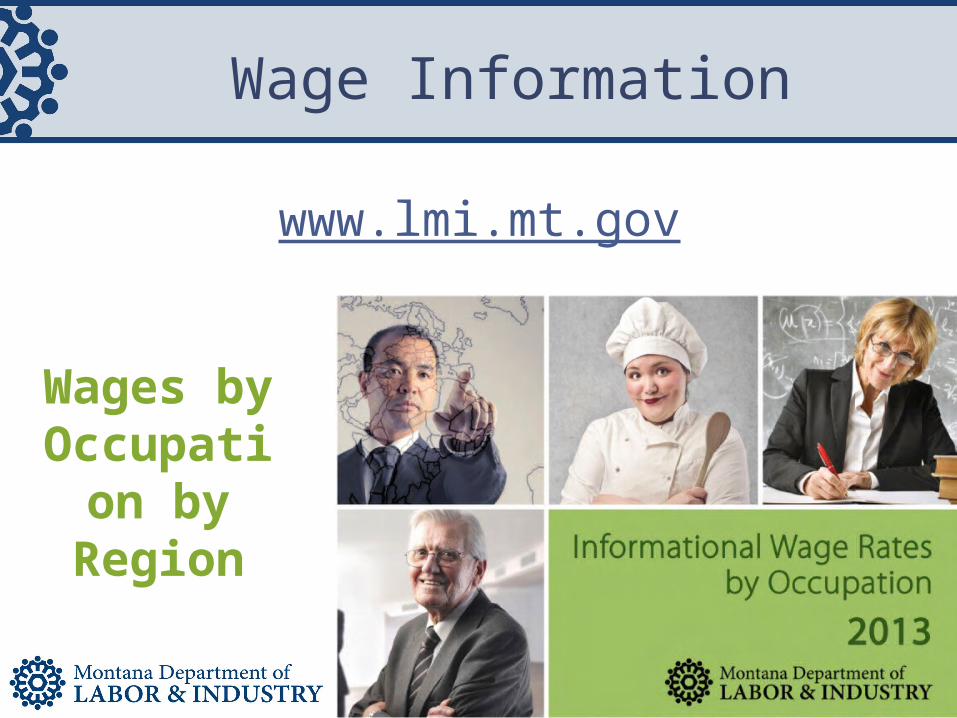

Wage Rates by Region
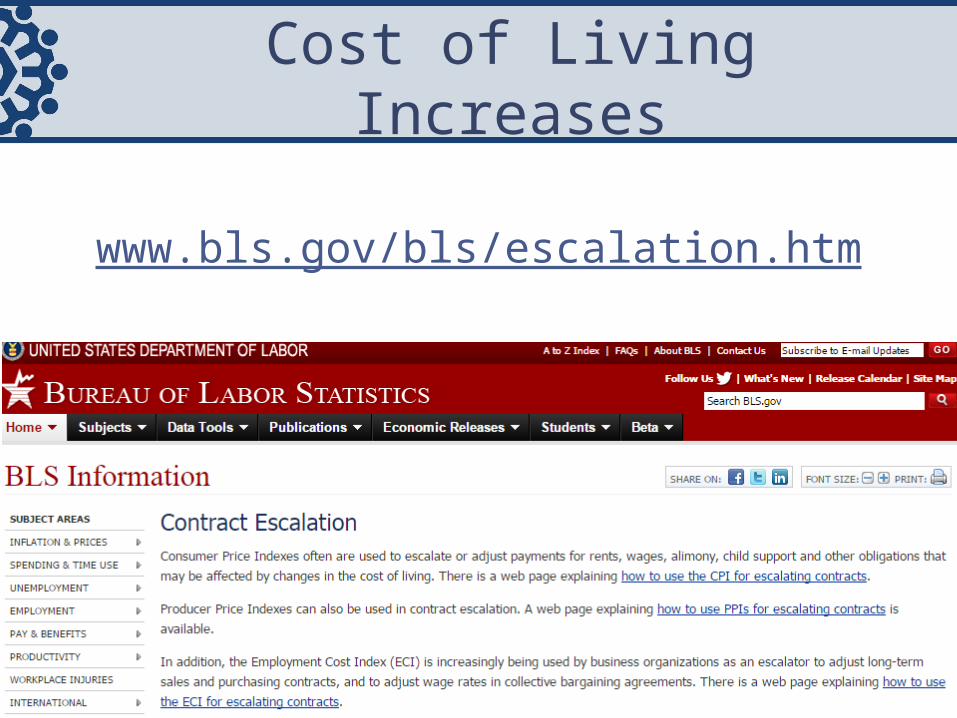

Regional Price Changes
• U.S. and Metro prices only.
• Wage growth and price increases similar in most circumstances.– But not necessarily in E. Montana.
• New data being released soon to provide more county price information.
