2015 national limiting prescribed fire implementation. further study into weather’s driving...
TRANSCRIPT
Technical Report 02-15
Coalition of Prescribed Fire Councils, Inc.
2015 NATIONALPRESCRIBED FIRE USE
SURVEY REPORT

2015 NATIONAL PRESCRIBED FIRE USE SURVEY REPORT
i
This report is a collaborative effort of the National Association of State Foresters and the Coalition of Prescribed Fire Councils.
The mission of the National Association of State Foresters is to represent state and territorial forester interests by influencing forest policy and leading efforts to promote healthy and sustainable trees and forests.
The mission of the Coalition of Prescribed Fire Councils is to promote the appropriate use of prescribed fire for enhancing public safety, managing resources, and sustaining environment quality.
Author:
Mark A. Melvin
Acknowledgements:
Special appreciation is given to all 50 state forestry agencies for providing the prescribed fire use information; without their participation this report would not be possible. Thanks to Mike Zupko for providing the foreword. Thanks to the Joseph W. Jones Ecological Research Center for its continued support and particularly to my colleagues Jean Brock, Lisa Giencke, and Jessica McCorvey for technical support and guidance.
For a copy of this report, visit www.prescribedfire.net

2015 NATIONAL PRESCRIBED FIRE USE SURVEY REPORT
ii
Executive Summary
Prescribed fire activity is complex and poorly understood when evaluated at a national scale. Most often fire complexity is defined by scale, frequency, season, and location in the context of local and state laws and local community acceptance. In an effort to gain better knowledge of prescribed fire use in the United States, the National Association of State Foresters (NASF) and the Coalition of Prescribed Fire Councils (CPFC) partnered to conduct and produce the 2015 National Prescribed Fire Use Survey Report. This report is the second of its kind, and is based on the responses from all 50 state forestry agencies. It outlines national and regional prescribed fire activity, state prescribed fire programs, and identifies impediments limiting the use of prescribed fire. The results include all federal, state, and private prescribed fire acres for forestry, rangeland, and agricultural burning that occurred in 2014.
The survey results indicate approximately 11.7 million acres were treated in 2014 with prescribed fire. The majority (76%) was for forestry purposes with the balance related to agriculture. The Southeast accounted for a little over 8 million acres of the total activity and continues to lead the nation in all categories of prescribed fire use. There was no change from the 2012 report with respect to the top three national impediments; however, weather replaced capacity as the number one impediment. Forty percent of states reported weather as the factor most limiting prescribed fire implementation. Further study into weather’s driving factors, such as narrow burn windows versus meeting smoke management concerns, is necessary and would provide additional insight.
One significant finding was an increase in the number of states that offer education and training to certify prescribed fire managers. The number of states increased to 24, a 41% increase over the 2012 report. This is an impressive statistic, and one that will hopefully build capacity of trained fire managers. During the same period, the number of prescribed fire councils grew by 24%, bringing the total to 31 councils in 27 states. Across the country local, state, and regional groups are emerging, leveraging unity and vision, and accomplishing common goals to preserve and restore the use of prescribed fire. The results of the 2015 survey revealed successes over the last three years and identified challenges for the future. It is the ambition of both the NASF and the CPFC that this report will serve the prescribed fire community as a tool to guide future management decisions and actions.
2015 NATIONAL PRESCRIBED FIRE USE SURVEY REPORT
iii
Foreword
The National Prescribed Fire Use Survey Report and the National Cohesive Wildland Fire Management Strategy go hand-in-hand: Using the best available data to make informed decisions about our natural landscape in order to have a positive impact through land and resource management.
The Cohesive Strategy and the recently rolled-out Quadrennial Fire Review (QFR) aim to look for opportunities to most effectively utilize and manage fire into the future. The role prescribed fire will play no doubt can be immense, but many challenges remain that will continue to hinder the extent of controlled fire as a management tool.
The Cohesive Strategy stemmed out of the 2009 Federal Land Assistance, Management, and Enhancement Act of 2009 (FLAME ACT), where Congress mandated the development of a strategy to address wildland fire management across all lands in the country. The intergovernmental Wildland Fire Leadership Council led the development of a three-phase approach that included planning, risk analysis, and action implementation through a systematic and collaborative process informed by numerous stakeholders across all geographies of the United States.
Three national goals were distilled encapsulating the various challenges and opportunities:
• Restore and maintain landscapes: Landscapes across all jurisdictions are resilient to fire-related disturbances in accordance with management objectives.
• Fire-adapted communities: Human populations and infrastructure can withstand a wildfire without loss of life and property.
• Wildfire response: All jurisdictions participate in making and implementing safe, effective, efficient risk-based wildfire management decisions.
These goals and the associated analysis, strategies, and proposed actions help to drive immediate and near-term impacts on the ground in a concerted effort to collectively and cohesively address wildland fire management. The QFR takes a high-level strategic assessment of wildland fire and evaluates opportunities of management impacts in a 10-20 year timeframe. Intended as a long-range strategic vision document, it will serve as the foundation for discussions in the wildland fire community that impact future management decisions. The complimentary nature of the Cohesive Strategy and the QFR lends itself to insight in how the use of fire in the future may be approached.
The document titled National Strategy: The Final Phase in the Development of the National Cohesive Wildfire Management Strategy, completed in April 2014, encapsulates the contribution of prescribed fire to wildland fire as a whole. “The National Strategy recognizes and accepts fire as a natural process for the maintenance of many ecosystems, and strives to reduce conflicts between fire-prone landscapes and people. By simultaneously considering the role of fire in the landscape, the ability of humans to plan for and adapt to living with fire, and the need to be prepared to respond to fire when it occurs, the Cohesive Strategy takes a holistic approach to the future of wildland fire management” (p3).
2015 NATIONAL PRESCRIBED FIRE USE SURVEY REPORT
iv
Foreward (continued)
The importance of creating resilient landscapes cannot be underestimated, both to the natural environments they support and to minimizing risk to the human populations they contain. Many landscapes across the country require fire to stay healthy. Additionally, using fire as a management tool is often one of the most economical and natural methods for managing many landscapes. By understanding the extent and impact of continued use of prescribed fire, land managers can better understand the positive effect their management practices are having.
Environmental and health concerns are another issue of importance surrounding the discussion of wildland fire and unintended impacts. By managing the extent of wildfire through prescribed fire and using fire for resource benefit in controlled situations, the impact of smoke on public health can be greatly reduced. The ability to place prescribed fire on the ground under planned circumstances and weather conditions can greatly outweigh responding to unexpected wildfire emergencies. Proactive use of prescribed fire has shown the ability to minimize smoke impacts compared to emission from wildfires.
In order to be successful in any land management decision making process, collaboration and partnerships are key. The use of the term “cohesive” in the Cohesive Strategy is by design. Multiple partners working collectively toward a common goal can accomplish much more than each individual partner. Alignment of visions and goals help to set the stage for success, and prescribed fire councils across the country are already leading the way for many successful collaboratives. Continued cooperation and investment in understanding various partners and respecting different viewpoints can easily overcome what are often misperceptions and miscommunications blurring common goals.
At the national, regional, tribal, state and local level, good information and science is paramount in making good land management decisions and having a positive impact on our natural ecosystems through understanding where prescribed fire has been and where it is headed. The use and placement of prescribed fire across the landscape will hopefully continue to increase while enhancing resilient landscapes across its path. Through the leadership of the Coalition of Prescribed Fire Councils and the relationships built within the many prescribed fire councils across the country, the science of prescribed fire and the message of its positive impact is being heard. This is further increasing the opportunity for expanded use of prescribed fire. Ultimately, the use of expanded prescribed fire as a management tool in many landscapes will go a long way in meeting the vision of the Cohesive Strategy: To safely and effectively extinguish fire, when needed; use fire where allowable; manage our natural resources; and as a Nation, live with wildland fire.
G. Michael Zupko IVExecutive ManagerWildland Fire Leadership Council

2015 NATIONAL PRESCRIBED FIRE USE SURVEY REPORT
1
Introduction
In 2012 the National Association of State Foresters (NASF) and the Coalition of Prescribed Fire Councils (CPFC) partnered to produce the first-ever report that investigated national prescribed fire activity. Understanding how much and where prescribed fire occurs is important to the entire fire community. The report has been used as an informative tool to help guide decision making, research, and policy by wildland fire agencies, prescribed fire councils, academia, and air quality agencies. In an effort to garner and maintain the most current data, the NASF and the CPFC have partnered once again to produce a 2015 prescribed fire report.
This 2015 survey is a national evaluation focusing on the scale of prescribed fire use, state-level supporting programs, and factors that limit the use of prescribed fire. The survey is based on 2014 prescribed fire activity and utilizes the 2012 report (of data from 2011) as a comparison to illustrate and describe areas of stabilization and trends. This report uses the best information available from state forestry agencies, and includes participation from all 50 states. The data presented are intended to inform the fire community by identifying challenges at a national scale, as well as defining key regional and state differences and similarities. The following report presents the findings of the survey.

2015 NATIONAL PRESCRIBED FIRE USE SURVEY REPORT
2
Methods
In early 2015, state forestry agencies received the National Prescribed Fire Use Survey questionnaire and an invitation to participate. The survey questions focused on prescribed fire activity, state-level programs, and factors limiting prescribed fire implementation. For the purpose of this survey, forestry and agricultural acreages were reported separately and include all 2014 federal, state, and private prescribed burning activity. Rangeland burning was reported and calculated as a forestry activity. NASF geographic regions were used to make all regional comparisons and are consistent with the National Cohesive Strategy.
Figure 1. U.S. Geographic Regions
All questions were posed and presented in yes/no or fill-in-the-blank format in an effort to address any differences existing between state fire programs and to collect consistent data. The impediment categories developed in the 2012 National Prescribed Fire Use Survey Report were also used in an effort to provide consistency. Each state agency was asked to identify and rank their top three impediments from the established list (see Table 1).

2015 NATIONAL PRESCRIBED FIRE USE SURVEY REPORT
3
Methods (continued)
Table 1. The nine impediment categories are as follows:
Capacity Concerns Limited personnel, training, private contractor availability, partnerships, equipment
Weather Concerns Narrow burn windows, drought, available burn days
Air Quality/Smoke Management Concerns Visibility, nuisance, emission impacts
Resource Concerns Limited funding, high implementation costs
Public Perception Concerns Lack of public understanding/acceptance
Liability/Insurance Concerns Landowner liability, insurance availability and/or cost
Permitting/Legal Concerns State law, burn bans, local restrictions, NEPA process, ESA
WUI/Population Growth Concerns Urbanization, influx of new residents
Low Priority Agency or landowner priority, too difficult
Results
Prescribed Fire Activity
2014 National Prescribed Burning Activity by Resource Objective
Figure 2. Percentages and acres of national prescribed fire activity by resource objective.
76%
24%
2014 National Prescribed Burning Activity by Resource Objective
Forestry - 8,946,900 Acres
Agriculture - 2,795,099 Acres

2015 NATIONAL PRESCRIBED FIRE USE SURVEY REPORT
4
Results (continued)
2014 Northeast Region Prescribed Burning Activity by Resource Objective
Figure 3. Percentages and acres of northeastern prescribed fire activity by resource objective.
2014 Southeast Region Prescribed Burning Activity by Resource Objective
Figure 4. Percentages and acres of southeastern prescribed fire activity by resource objective.
85%
15%
2014 Northeast Region Prescribed Burning Activity by Resource
Objective
Forestry - 310,558 Acres
Agriculture - 54,220 Acres85%
15%
2014 Northeast Region Prescribed Burning Activity by Resource
Objective
Forestry - 310,558 Acres
Agriculture - 54,220 Acres
85%
15%
2014 Northeast Region Prescribed Burning Activity by Resource
Objective
Forestry - 310,558 Acres
Agriculture - 54,220 Acres
76%
24%
2014 Southeast Region Prescribed Burning Activity by Resource
Objective
Forestry - 6,187,117 Acres
Agriculture - 1,912,502 Acres
76%
24%
2014 National Prescribed Burning Activity by Resource Objective
Forestry - 8,946,900 Acres
Agriculture - 2,795,099 Acres

2015 NATIONAL PRESCRIBED FIRE USE SURVEY REPORT
5
Results (continued)
2014 West Region Prescribed Burning Activity by Resource Objective
Figure 5. Percentages and acres of western prescribed fire activity by resource objective.
2014 Forestry & Agricultural Prescribed Fire Activity by Region
Figure 6. Percentages of all national prescribed fire acres by region.
75%
25%
2014 West Region Prescribed Burning Activity by Resource Objective
Forestry - 2,449,225 Acres
Agriculture - 828,377 Acres75%
25%
2014 West Region Prescribed Burning Activity by Resource Objective
Forestry - 2,449,225 Acres
Agriculture - 828,377 Acres
3%
69%
28%
2014 Forestry & Agricultural Prescribed Fire Activity by Region
Northeast
Southeast
West
3%
69%
28%
2014 Forestry & Agricultural Prescribed Fire Activity by Region
Northeast
Southeast
West

2015 NATIONAL PRESCRIBED FIRE USE SURVEY REPORT
6
Results (continued)
2014 Forestry Prescribed Fire Activity by Region
Figure 7. Percentages of all forestry prescribed fire acres by region.
2014 Agricultural Prescribed Fire Activity by Region
Figure 8. Percentages of all agricultural prescribed fire acres by region.
3%
69%
28%
2014 Forestry & Agricultural Prescribed Fire Activity by Region
Northeast
Southeast
West
4%
69%
27%
2014 Forestry Prescribed Fire Activity by Region
Northeast
Southeast
West
3%
69%
28%
2014 Forestry & Agricultural Prescribed Fire Activity by Region
Northeast
Southeast
West
2%
68%
30%
2014 Agricultural Prescribed Fire Activity by Region
Northeast
Southeast
West

2015 NATIONAL PRESCRIBED FIRE USE SURVEY REPORT
7
Results (continued)
Figure 9. Acres of all prescribed fire use by state. Coarse acreage classes were created using a histogram that determined the most significant breaking points in acres reported.
2015 NATIONAL PRESCRIBED FIRE USE SURVEY REPORT
8
Results (continued)
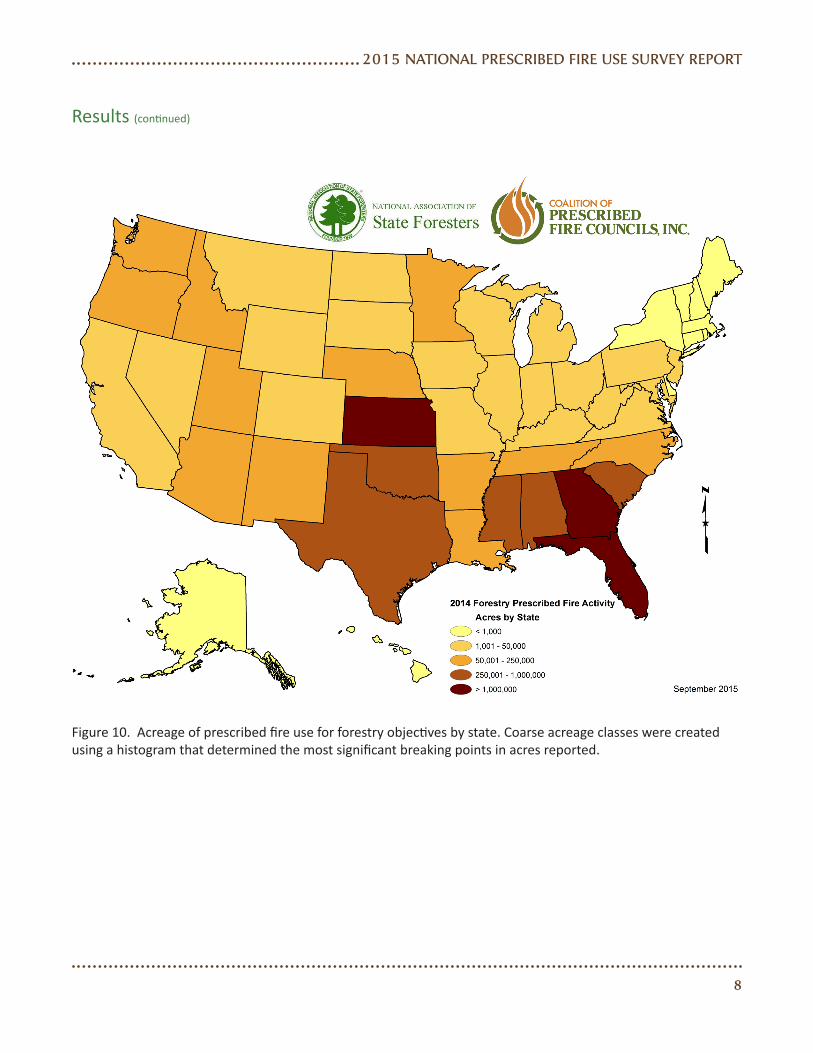
Figure 10. Acreage of prescribed fire use for forestry objectives by state. Coarse acreage classes were created using a histogram that determined the most significant breaking points in acres reported.
2015 NATIONAL PRESCRIBED FIRE USE SURVEY REPORT
9
Results (continued)
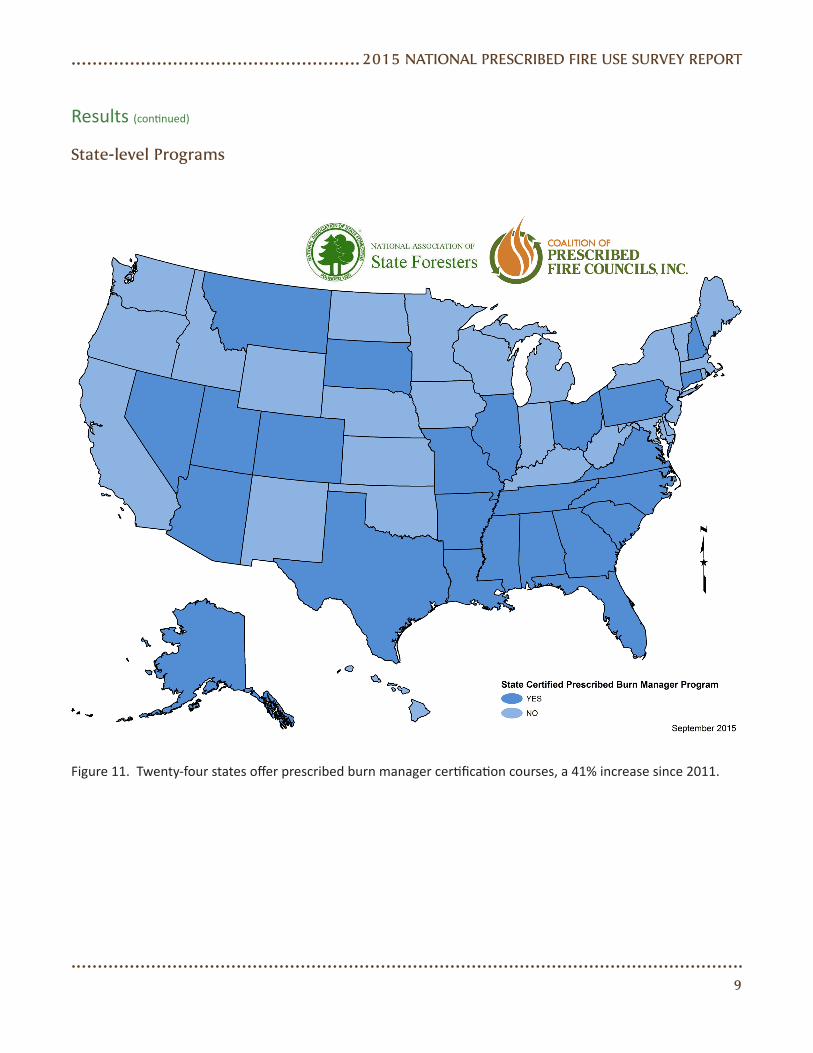
State-level Programs
Figure 11. Twenty-four states offer prescribed burn manager certification courses, a 41% increase since 2011.

2015 NATIONAL PRESCRIBED FIRE USE SURVEY REPORT
10
Results (continued)
Figure 12. Only five states indicated a downward trend in prescribed fire acres, compared to seven in 2011.

2015 NATIONAL PRESCRIBED FIRE USE SURVEY REPORT
11
Results (continued)
Figure 13. Thirty-one prescribed fire councils exist in 27 states, a 24% increase since 2011.

2015 NATIONAL PRESCRIBED FIRE USE SURVEY REPORT
12
Results (continued)
Prescribed Fire Impediments
Top Impediment Limiting Prescribed Fire Use Nationwide Ranking
Figure 14. National summary of impediments reported by states as the single factor most limiting the use of prescribed fire. Weather, capacity, and air quality/smoke management accounted for 72% of the responses, and are the three most significant national challenges for prescribed fire implementation.

2015 NATIONAL PRESCRIBED FIRE USE SURVEY REPORT
13
Figure 15. These graphs illustrate the national and regional percentage of states that reported an impediment as one of their “top three” selections limiting prescribed fire.
0%5%
10%15%20%25%30%
WEATHERNo. 1 Weather
0%5%
10%15%20%25%30%
CAPACITY
0%5%
10%15%20%25%30%
AIR QUALITY / No. 2 Capacity No. 3 Air Quality/Smoke
0%5%
10%15%20%25%30%
RESOURCESNo. 6 Resources
0%5%
10%15%20%25%30%
PERMITTING / No. 5 Permitting/Legal
0%5%
10%15%20%25%30%
LIABILITY / No. 4 Liability/Insurance
0%5%
10%15%20%25%30%
PUBLIC PERCEPTNo. 7 Public Perception
0%5%
10%15%20%25%30%
WUI / No. 8 WUI/Pop. Growth
0%5%
10%15%20%25%30%
LOW PRIORITYNo. 9 Low Priority
Results (continued)

2015 NATIONAL PRESCRIBED FIRE USE SURVEY REPORT
14
Discussion
One objective of this survey was to determine prescribed fire usage and purpose on both national and regional scales. The survey revealed that an estimated 11,741,999 acres were treated with prescribed fire across the country in 2014. Of that figure, approximately 8.9 million acres were forestry related and 2.8 million acres were agricultural related. Total acres burned in 2014 for forestry purposes were comparable with 2011, however agricultural acres were significantly lower (77%). This decrease is largely due to better reporting in 2015 from western states and the fact that agricultural use of fire is poorly tracked at a national scale. Nonetheless, despite a 1 million acre increase in forestry activity, total acres reported decreased by almost 8.5 million acres.
National Prescribed Burning Activity by Resource Objective
Figure 16. Comparison between 2011 and 2014 national prescribed fire burning activity.
Northeast Region Prescribed Burning Activity by Resource Objective
Figure 17. Comparison between 2011 and 2014 Northeast region prescribed fire activity.
2011
2011
2014
2014
0
2
4
6
8
10
12
14
Forestry Agriculture
Acre
s (M
illio
ns)
National Prescribed BurningActivity by Resource Objective
2011
2011
2014
2014
050
100150200250300350400450
Forestry Agriculture
Acre
s (Th
ousa
nds)
Northeast Prescribed Burning Activity by Resource Objective

2015 NATIONAL PRESCRIBED FIRE USE SURVEY REPORT
15
Discussion (continued)
Southeast Region Prescribed Burning Activity by Resource Objective
Figure 18. Comparison between 2011 and 2014 Southeast region prescribed fire activity.
West Region Prescribed Burning Activity by Resource Objective
Figure 19. Comparison between 2011 and 2014 West region prescribed fire activity.
At a regional scale, nearly 70% of all prescribed fire activity occurred in the Southeast. Three of the four states reporting 1 million acres or more were from the Southeast. The West reported a 143% increase in forestry activity due to improved reporting of rangeland burning as a forestry activity. The Northeast remained steady in its use and continued to be a small percentage of the national total.
2011
2011
2014
2014
0
1
2
3
4
5
6
7
Forestry Agriculture
Acre
s (M
illio
ns)
Southeast Prescrobed Burning Activity by Resource Objective
2011
2011
2014
2014
0123456789
Forestry Agriculture
Acre
s (M
illio
ns)
West Prescribed Burning Activity by Resource Objective

2015 NATIONAL PRESCRIBED FIRE USE SURVEY REPORT
16
Discussion (continued)
Another objective of this report was to identify state-level programs that support prescribed fire management. Nationally, the majority of states (82%) continue to use some form of burn permitting or authorization process. There was no change from the 2012 survey report on time needed to obtain burn authorizations. This process varied by state and region, and time required ranged from the day of the burn to four months prior. One area of significant change was the number of states that offer certified burn manager programs. The number of states offering these programs increased to 24, which represents a 41% increase since the last survey and is likely the most important change within the last three years. Only five states reported fire acres trending down, and 90% claimed fire use was up or remained stable. The number of prescribed fire councils grew to 31 in 27 states, a 24% increase since 2011.
An area of special concern arising from the survey is the discrepancy between the tracking of forestry and agricultural prescribed fire activity. Thirty-three states (66%) have a formal process to track the number of acres burned for forestry purposes, while only 12 states (24%) track agricultural burns. This demonstrates that agricultural burning in the U.S is viewed and treated differently than burning in forestry applications.
Figure 20. Thirty-three states have a formal process to track forestry prescribed fire activity.
Figure 21. Only 12 states have a formal process to track agricultural prescribed fire activity.

2015 NATIONAL PRESCRIBED FIRE USE SURVEY REPORT
17
Discussion (continued)
The final objective of this survey was to determine which impediments states viewed as the most limiting for prescribed fire use. The nine impediment categories developed in the first survey were used to determine the “number one” and “top three” impediments on national and regional scales. Weather, capacity, and air quality/smoke management were the issues of highest national importance, and accounted for 72% of the responses. Weather had the highest number of responses, with four in ten states ranking it as the number one issue.
Top Impediment Limiting Prescribed Fire Use National Ranking
Figure 22. Comparison of the national top impediment between survey years.
A comparison of survey years reveals a prominent shift and priority realignment from low priority, WUI, public perception, resources, and capacity to weather concerns. This comparison clearly identifies the key national concerns and where immediate action is needed.
At a regional scale, weather and capacity exceeded the national percentage in the Northeast, while liability/insurance, permitting/legal, and WUI ranked lower. The Southeast reported air quality/smoke management and liability/insurance both higher when compared to national responses, and surprisingly WUI/population growth was nearly twice the national percentage — an issue typically associated with the West. The category permitting/legal was more than double the national average for the West, and capacity was significantly lower than the national average. The western responses most closely mirrored the national percentages of the three regions.
As the results of this survey illustrate, prescribed fire use in the U.S. is complex and dynamic. For this reason, it is important that the national survey be repeated over time, to account for current use and identify emerging trends related to prescribed fire activity. Despite numerous challenges, there has never been more support (or a greater need) for prescribed fire throughout the U.S.
0%5%
10%15%20%25%30%35%40%45%
Perc
ent o
f Rep
onse
s
Top Impediment Limiting Prescribed Fire UseNational Ranking
2011
2014
0%5%
10%15%20%25%30%35%40%45%
Perc
ent o
f Rep
onse
s
Top Impediment Limiting Prescribed Fire UseNational Ranking
2011
20140%5%
10%15%20%25%30%35%40%45%
Perc
ent o
f Rep
onse
s
Top Impediment Limiting Prescribed Fire UseNational Ranking
2011
2014
WEATHER CAPACITY AIR QUALITY/SMOKE
MANAGEMENT
LIABILITY/ INSURANCE
PERMITTING/ LEGAL
RESOURCES PUBLIC PERCEPTION
WUI/ POPULATION
GROWTH
LOW PRIORITY