2015 october rate design proposal v2 10 8 15 - ewebrate)designpropos… · subject: 2016 eweb...
TRANSCRIPT
1
M E M O R A N D U M
EUGENE WATER & ELECTRIC BOARD
TO: Commissioners Mital, Simpson, Helgeson, Manning and Brown
FROM: Erin Erben, Power & Strategic Planning Manager
Adam Rue, Senior Energy Resource Analyst
Cathy Gray, Energy Resource Analyst
DATE: September 29, 2015
SUBJECT: 2016 EWEB Pricing (Rate) Design Proposal
Objective
This memo lays out the details of the pricing design proposal Management is recommending to
the Board for inclusion in the November Pricing Proposal. It also incorporates both
recommended structural changes to the individual customer price plans1 (rates), consistent with
the Board’s Strategic Plan objectives, as well as a preview of the overall average revenue
requirement change that will be proposed to the Board next month in a separate proposal from
the Finance Department. Including both herein is intended to give the Board a complete picture
of the bill impact to customers from the proposed changes combined.
In addition, this memo seeks to provide clarity on the potential end state of the current pricing
design initiative in the Strategic Plan, for which Management will be seeking guidance from the
Board at the October Board Meeting on a number of topics. Specifically, Management will be
seeking a Board decision on the following:
Electric Utility:
1. Approve Management recommendation to select Option A – which shifts $10 (vs. $5) to
the basic charge, and makes an offsetting energy charge reduction, for inclusion in the
formal residential pricing proposal scheduled to come to the Board in November.
2. Direct Management to also reflect the recommended commercial class price plan design
changes in the November proposal.
3. Direct Management to adopt the end-state pricing objectives defined in this backgrounder
and choose either a three-year or five-year implementation path to completion.
4. Direct Management to include the OATT update and the C-TOU pilot proposal in the
formal November proposal, in order to leverage the public process already planned.
1 You will see the migration of language in this document from “rates” or
“tariffs” to “prices” and “price plans”. Similarly, the utility values
moving from “ratepayers” to “customers”.
2
Water Utility:
1. Direct Management to include the proposed revenue requirement increase in the fixed bill
component for the November proposal.
2. Direct Management to return next year with end-state pricing objectives that take into
account the appropriate levels of fixed charge, conservation price signals, and elevation
charges.
Introduction
In recent years, EWEB has made incremental changes to its pricing to progress toward the stated
goal of improving fixed cost recovery and better reflecting marginal energy prices through
energy tier price flattening, particularly in its residential price structure. EWEB has also
commissioned consultant review of its Cost of Service models to help ensure appropriate cost
allocation practices for both utilities. Having completed those for the electric utility, EWEB is
now ready to propose design changes to commercial pricing as well.
The structural changes to pricing are intended to help EWEB, and its customers, transition to a
more sustainable pricing paradigm which provides customers with accurate information about
the cost of utility services, reduces cross subsidies among customers within classes, and
improves price signals for customers making investment decisions that anticipate expected
paybacks from utility bill savings.
Pricing Principles
When evaluating pricing proposals to bring before the Board, EWEB considers many factors,
most prominently customer bill impacts and the six ratemaking principles that guide our pricing
strategy: 1) Sufficiency, 2) Affordability, 3) Efficiency, 4) Cost-Basis, 5) Equity, and 6)
Gradualism.
Since no two customer consumption patterns are exactly alike, making structural changes to
pricing inevitably impacts individual accounts differently within a customer class. To help
remove ambiguity and achieve the lowest costs overall, Efficiency is sought through minimizing
subsidies by the use of Cost-Basis to enhance Equity. These principles are employed as the
measure of best fit for cost allocation within a given customer class. Affordability and
Sufficiency guide the revenue requirement overall and Gradualism governs the pace of change
being proposed, generally assessed through bill impacts.
The remainder of this memo is laid out as follows:
I. ELECTRIC UTILITY - RETAIL PRICING DESIGN PROPOSAL
A. Possible end states for current Pricing Strategy
B. Recommended 2016 Electric Price Design2
C. Electric Pilot Offering – Commercial TOU
2 Note that while figures are provided in this backgrounder for illustrative
purposes, the final price plans will be presented at the November Board
meeting and the exact numbers may change. The associated bill impacts shown
herein are representative of the final results.

3
II. ELECTRIC UTILITY - WHOLESALE TRANSMISSION PRICING PROPOSAL
A. OATT proposal
III. WATER UTILITY - RETAIL PRICING DESIGN PROPOSAL
A. Possible end states for current Pricing Strategy
B. Recommended 2016 Water Price Design

4
I. ELECTRIC UTILITY - RETAIL PRICING DESIGN PROPOSAL
A. Possible end states for current Pricing Strategy
To prepare for a discussion on the best end state solution for EWEB’s pricing design Business
Strategy, the following offers a brief refresher on the basic cost components of a customer’s bill.
Basic Cost Components:
1) Customer-related charges, include: meter reading, customer service, customer
accounting and billing service. These costs are largely fixed on a per customer basis,
independent of quantity or time consumed.
2) Facilities-related charges, include: customer specific facilities such as service drop
installations, and metering infrastructure. These costs are largely fixed and are a function
of the maximum amount of energy a customer is configured to consume.
3) Demand-related charges, include: transmission and distribution substations, and wires.
The cost allocation to customers is best based on maximum amount of energy a customer
consumes a particular point in time.
4) Energy-related charges, include: purchased power, fuel, and variable O&M costs. These
costs vary with the total amount of generation a customer consumes.
Today, EWEB uses 1, 3 and 4 in its customer price plans.
Cost-based “end state” for Pricing Strategy
As part of the exercise to respond to the Board Strategy Objective to:
“Redefine and price the products and services that today’s customers’ value over the next three
years, in order to help prepare EWEB and the community for the utility of the future”,
Management has been working on categorizing and reassessing the cost components we track,
and thinking about how we can communicate these to customers in a more intuitive way.
The chart below illustrate this work by comparing the current cost allocation components used in
our Cost of Service Analysis (COSA) as compared to four high-level service categories that we
would ultimately envision displaying on the customer bill.
5
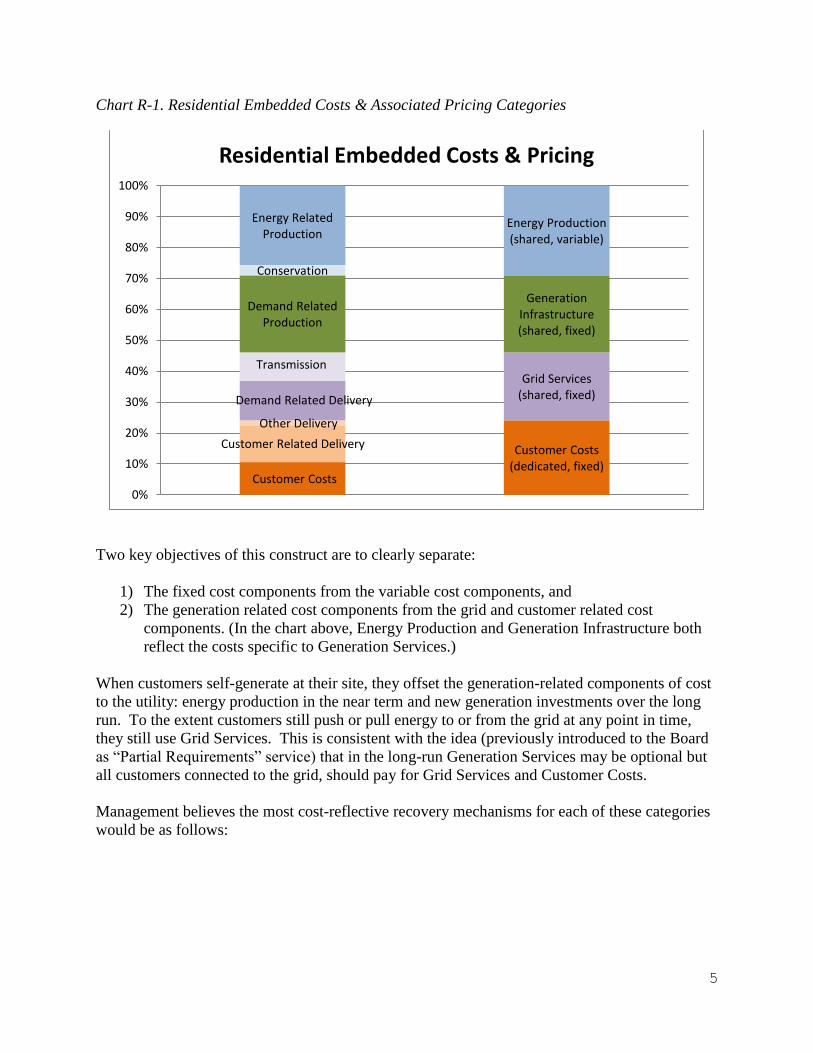
Chart R-1. Residential Embedded Costs & Associated Pricing Categories
Two key objectives of this construct are to clearly separate:
1) The fixed cost components from the variable cost components, and
2) The generation related cost components from the grid and customer related cost
components. (In the chart above, Energy Production and Generation Infrastructure both
reflect the costs specific to Generation Services.)
When customers self-generate at their site, they offset the generation-related components of cost
to the utility: energy production in the near term and new generation investments over the long
run. To the extent customers still push or pull energy to or from the grid at any point in time,
they still use Grid Services. This is consistent with the idea (previously introduced to the Board
as “Partial Requirements” service) that in the long-run Generation Services may be optional but
all customers connected to the grid, should pay for Grid Services and Customer Costs.
Management believes the most cost-reflective recovery mechanisms for each of these categories
would be as follows:
Customer Costs
Customer Related Delivery
Other Delivery
Customer Costs(dedicated, fixed)
Demand Related Delivery
TransmissionGrid Services
(shared, fixed)
Demand Related Production
Generation Infrastructure (shared, fixed)
Conservation
Energy Related Production
Energy Production (shared, variable)
0%
10%
20%
30%
40%
50%
60%
70%
80%
90%
100%
Residential Embedded Costs & Pricing

6
Customer Costs Fixed monthly charge
Grid Services kW charge based on annual peak demand3
Generation Infrastructure kW charge based on monthly peak demand
Energy Production kWh charge based on monthly usage
Residential Customers
To date, demand charges have not be used for residential customers, primarily due to metering
constraints, but also to enhance bill simplicity for customers. In the future, it may be warranted
to include a demand charge component to the bill. A second best solution would be to move
some or all of the demand-related costs into the fixed, customer charge. While EWEB’s billing
and metering technology is not currently capable of doing this, if including demand charges for
residential customers is chosen as an end state strategy by the Board, there would be a couple of
options:
Modify current systems to accommodate as soon as feasible, or
Wait 2-3 years for new technology upgrades to begin implementing
Should the Board not choose to employ demand charges for residential customers, Management
recommends the following:
Move Grid Services related costs into the fixed monthly charge over time.
Ultimately, the end state of this iteration of price design changes, particularly the level of
residential fixed costs, will depend on perceptions of fairness as much as cost-causation. While
it is true that the current pricing construct does result in cross-subsidies within customer classes
(i.e. high usage customers subsidize the fixed costs of low usage customers), societal
consideration such as limited income bill impacts from any change are real and must be
addressed. Additional information regarding the make-up on EWEB’s residential customer base
and proposed mitigation options for limited income are provided in the sections below.
Choice for all Customers
Ultimately, all of this work is intended to lay the groundwork to offer EWEB customers more
choice. Once our products and services are priced appropriately, (unwinding a long legacy of
false price signals for electricity), and EWEB is able to make some key investments in new
technology (namely meter and billing system upgrades), EWEB can be in a position to offer its
customers many of the desirable service options they have come to expect from alternative
electricity providers, in addition to implementing the end-state design changes shown above.
These include, but are not limited to services such as:
3 A case can be made to include Grid Services in the fixed monthly charge
component, but to allow customers more opportunity to release bill savings
through alternative investment decisions, EWEB Management prefers an annual
kW charge, which balances the fixed nature of these investments against
customer use of the system.

7
Partial Requirements pricing options
Time-based pricing options for all customer classes
Fixed bill pricing options
Pre-pay pricing options
Limited income price discounts on the bill
Other customized billing and usage notification offerings
The end goal is to offer customers more options so they can have greater control over their bill as
a result of their individual consumption choices and needs. This is important since there are
really are no two customers that are exactly alike, and yet we all share and rely on the same basic
infrastructure to provide this very important service – electricity – that is a foundational element
of our economy and society.
It is Management’s hope to continue to offer pilot programs that explore the nature of these new
services, in addition to testing customer interest, as we overhaul our systems to enable the
capability to provide new offerings to all customers.
Other Considerations
Timing of the ultimate availability of these options for customers, and the time it takes to achieve
our price design objectives, is impacted by the following:
The difference between costs and current pricing components for each of the classes (as
defined by the costing models EWEB employs);
The Board’s feedback on its desired end state;
How recent accounting changes ultimately trickle down to these cost models (how we
group and track our cost components);
When we are able to replace our Customer Information System (aka billing system) –
currently slated for completion in three years’ time;
Ability to offer new metering options to customers, currently slated to be available in
about two years’ time); and
Our ability to test programs in the pilot stage between now and then.
B. Recommended 2016 Electric Price Design
Residential Service
Residential customers are served under EWEB’s Schedule R-6 Price Plan, which applies to both
single-family and multi-family dwellings. There are approximately 80,000 customers in this
class. Of those approximately 8 percent have been identified as limited income. In general, the
consumption patterns of limited income customers4 has been found to follow the general
population overall.
4 This includes EWEB’s Customer Care (ECC) and the Job loss program (JOBL)
that represented 3,466 and 405 total customers in 2014, respectively. Non-
EWEB federal funds are also available to qualifying customers under the Low
Income Home Energy Assistance Program (LIEP). In 2014, 2,641 customers
qualified for LIEP.

8
Table R-1. Comparison of Annual Average Consumption
Usage Range (kWh)
No. of Residential Customer Accounts %
No. of Limited Income
Accounts %
0 - 101 2662 3% 27 0% 101 - 501 21303 27% 1717 26%
501 - 1001 29108 36% 2467 38% 1001 - 2001 20711 26% 1814 28% 2001 - 3001 4423 6% 375 6% 3001 - 4001 1122 1% 89 1% 4001 - 5001 333 0% 25 0% over 5001 294 0% 9 0%
79955 6521
End State
The chart below compares current EWEB residential prices with price design proposal
recommended for inclusion in the November Pricing Process, in addition to two views of the
potential end state price design.
Chart R-2. Comparison of Pricing Design Options (*)
(*) All four options reflective of on an average residential customer bill of $106.
BasicBasic
BasicFixed Customer
Charge
Grid Services
Generation Infrastructure
EnergyEnergy
Energy
Energy Production
0%
10%
20%
30%
40%
50%
60%
70%
80%
90%
100%
Current Proposed Fixed Costs End State
Residential Current, Proposed, and Potential End State
9
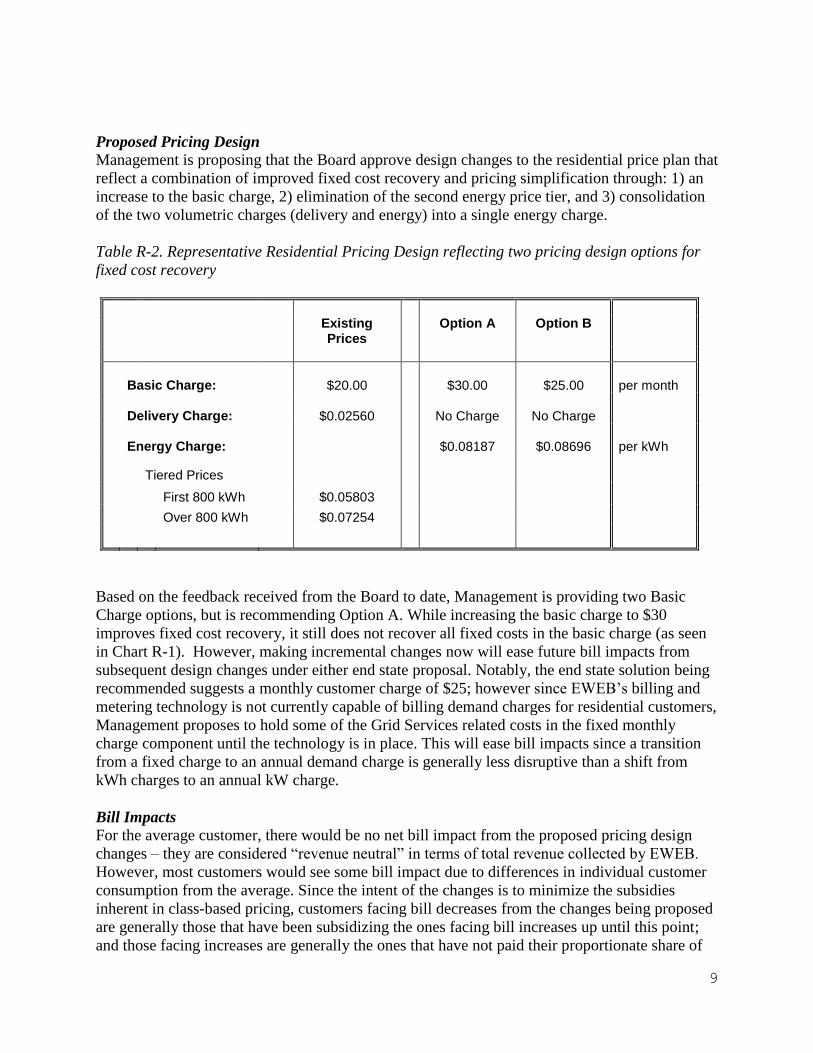
Proposed Pricing Design
Management is proposing that the Board approve design changes to the residential price plan that
reflect a combination of improved fixed cost recovery and pricing simplification through: 1) an
increase to the basic charge, 2) elimination of the second energy price tier, and 3) consolidation
of the two volumetric charges (delivery and energy) into a single energy charge.
Table R-2. Representative Residential Pricing Design reflecting two pricing design options for
fixed cost recovery
Existing Prices
Option A
Option B
Basic Charge: $20.00 $30.00 $25.00 per month
Delivery Charge: $0.02560 No Charge No Charge
Energy Charge: $0.08187 $0.08696 per kWh
Tiered Prices
First 800 kWh $0.05803
Over 800 kWh $0.07254
Based on the feedback received from the Board to date, Management is providing two Basic
Charge options, but is recommending Option A. While increasing the basic charge to $30
improves fixed cost recovery, it still does not recover all fixed costs in the basic charge (as seen
in Chart R-1). However, making incremental changes now will ease future bill impacts from
subsequent design changes under either end state proposal. Notably, the end state solution being
recommended suggests a monthly customer charge of $25; however since EWEB’s billing and
metering technology is not currently capable of billing demand charges for residential customers,
Management proposes to hold some of the Grid Services related costs in the fixed monthly
charge component until the technology is in place. This will ease bill impacts since a transition
from a fixed charge to an annual demand charge is generally less disruptive than a shift from
kWh charges to an annual kW charge.
Bill Impacts
For the average customer, there would be no net bill impact from the proposed pricing design
changes – they are considered “revenue neutral” in terms of total revenue collected by EWEB.
However, most customers would see some bill impact due to differences in individual customer
consumption from the average. Since the intent of the changes is to minimize the subsidies
inherent in class-based pricing, customers facing bill decreases from the changes being proposed
are generally those that have been subsidizing the ones facing bill increases up until this point;
and those facing increases are generally the ones that have not paid their proportionate share of
10
the fixed costs heretofore.
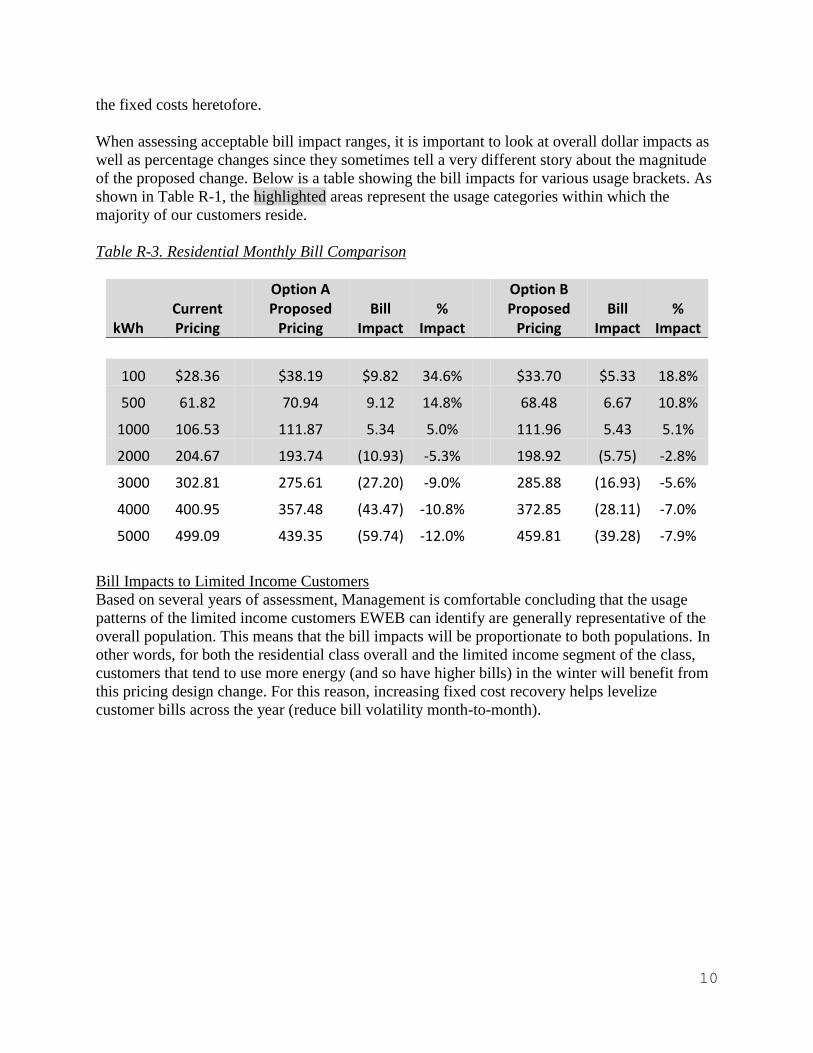
When assessing acceptable bill impact ranges, it is important to look at overall dollar impacts as
well as percentage changes since they sometimes tell a very different story about the magnitude
of the proposed change. Below is a table showing the bill impacts for various usage brackets. As
shown in Table R-1, the highlighted areas represent the usage categories within which the
majority of our customers reside.
Table R-3. Residential Monthly Bill Comparison
kWh Current Pricing
Option A Proposed
Pricing Bill
Impact %
Impact
Option B Proposed
Pricing Bill
Impact %
Impact
100 $28.36 $38.19 $9.82 34.6% $33.70 $5.33 18.8%
500 61.82 70.94 9.12 14.8% 68.48 6.67 10.8%
1000 106.53 111.87 5.34 5.0% 111.96 5.43 5.1%
2000 204.67 193.74 (10.93) -5.3% 198.92 (5.75) -2.8%
3000 302.81 275.61 (27.20) -9.0% 285.88 (16.93) -5.6%
4000 400.95 357.48 (43.47) -10.8% 372.85 (28.11) -7.0%
5000 499.09 439.35 (59.74) -12.0% 459.81 (39.28) -7.9%
Bill Impacts to Limited Income Customers
Based on several years of assessment, Management is comfortable concluding that the usage
patterns of the limited income customers EWEB can identify are generally representative of the
overall population. This means that the bill impacts will be proportionate to both populations. In
other words, for both the residential class overall and the limited income segment of the class,
customers that tend to use more energy (and so have higher bills) in the winter will benefit from
this pricing design change. For this reason, increasing fixed cost recovery helps levelize
customer bills across the year (reduce bill volatility month-to-month).

11
Chart R-3a (Proposed Option A). Average Usage Customer - Monthly Consumption and Bill
Impact for Proposed Change vs. a Flat 2.5% Increase to all Cost Components
You can see in the chart above that, for the average customer, bills in the highest usage months
tend to decrease under the proposed changes while the summer bills and shoulder month bills
increase. This benefits customers, particularly those on limited income, as it lowers the bill
impact in the highest usage months. This benefit is more pronounced for higher consumption
customers (see Chart R-3b). However, the lowest consumption customers see increases in every
month (see Chart R-3c). The benefit of this approach to EWEB overall is better revenue stability
since it better aligns revenues with underlying costs.
$-
$20
$40
$60
$80
$100
$120
$140
$160
$180
1 2 3 4 5 6 7 8 9 10 11 12
$/M
on
th B
ill
Month
Average Usage Customer
Increased Basic Charge and Flat Tiers
Increase All Elements 2.5%
12
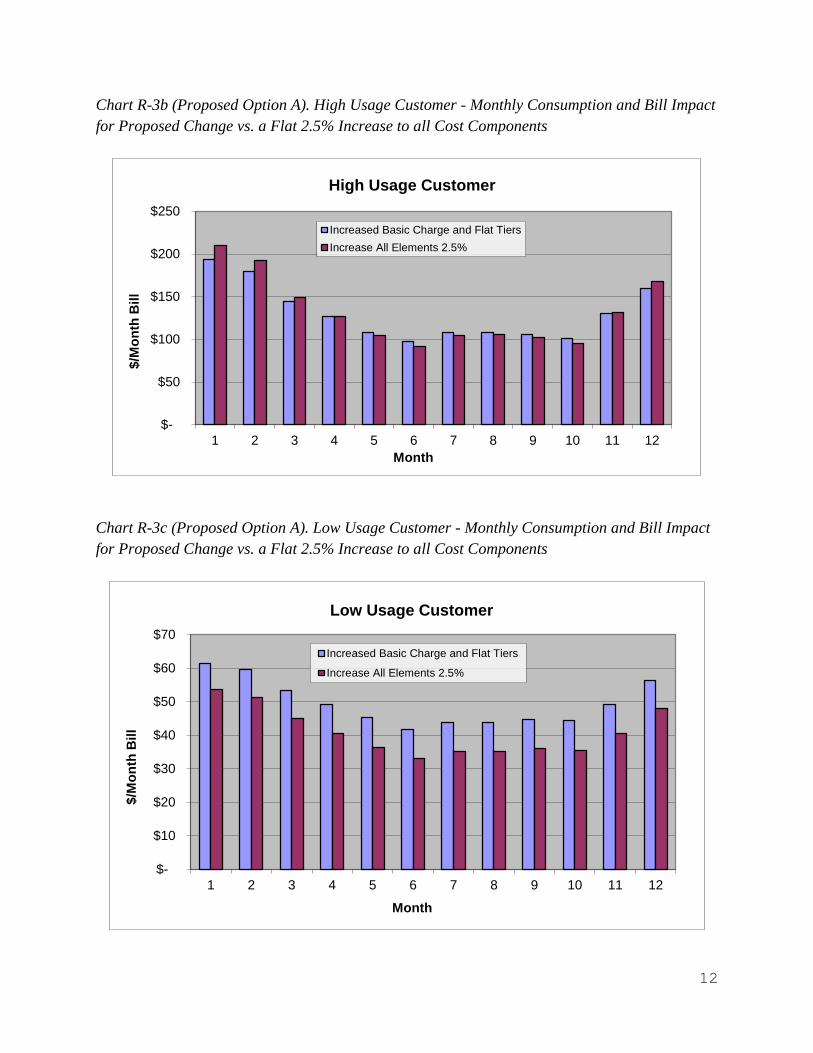
Chart R-3b (Proposed Option A). High Usage Customer - Monthly Consumption and Bill Impact
for Proposed Change vs. a Flat 2.5% Increase to all Cost Components
Chart R-3c (Proposed Option A). Low Usage Customer - Monthly Consumption and Bill Impact
for Proposed Change vs. a Flat 2.5% Increase to all Cost Components
$-
$50
$100
$150
$200
$250
1 2 3 4 5 6 7 8 9 10 11 12
$/M
on
th B
ill
Month
High Usage Customer
Increased Basic Charge and Flat Tiers
Increase All Elements 2.5%
$-
$10
$20
$30
$40
$50
$60
$70
1 2 3 4 5 6 7 8 9 10 11 12
$/M
on
th B
ill
Month
Low Usage Customer
Increased Basic Charge and Flat Tiers
Increase All Elements 2.5%
13
These charts also provide a look at the impact of this design proposal as compared to the typical
approach of applying the proposed overall price increase “across the board” to all pricing
components. What you can see, is that when the bills are highest for customers, especially for
those with the highest usage overall, this approach actually tends to reduce bills. Since the “high
bill season” is the time our customers are most sensitive to their bills, this can help reduce
customer high-bill complaints.
Limited Income Customer Bill Impacts
Management has taken to heart the concerns raised by the Board about our most financially
vulnerable customers, those on limited incomes. We share those concerns. While we believe this
proposal actually helps many limited income customers, particularly those that spend a higher
proportion of income on their electric bills (the higher usage customers), we would propose
consideration of additional limited income funds to be applied to the annual allotment of aid
(currently $200) for low usage, limited income customers that apply. While ideally we might
offer a bill credit that offsets some of the fixed costs for these customers, our current systems
limit our ability to do so and the administrative overhead of manual eligibility determination is
onsidered too costly to implement at this time. However, a simple solution would be to augment
the existing program of offering a one-time bill credit annually, for which the administrative
overhead is already incurred. Management is recommending an offset equal to half of the
proposed increase to the fixed monthly charge under the proposed residential price design of
Option A so that the bill impact for these customers matches Option B.
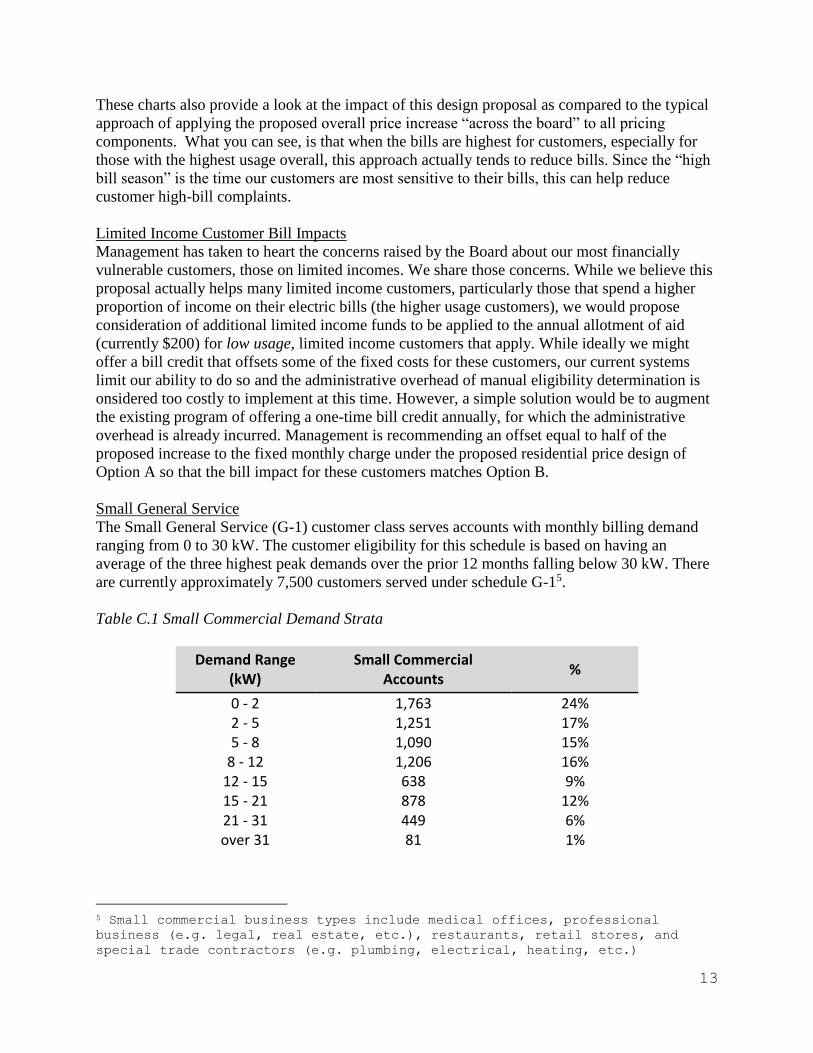
Small General Service
The Small General Service (G-1) customer class serves accounts with monthly billing demand
ranging from 0 to 30 kW. The customer eligibility for this schedule is based on having an
average of the three highest peak demands over the prior 12 months falling below 30 kW. There
are currently approximately 7,500 customers served under schedule G-15.
Table C.1 Small Commercial Demand Strata
Demand Range (kW)
Small Commercial Accounts
%
0 - 2 1,763 24% 2 - 5 1,251 17% 5 - 8 1,090 15%
8 - 12 1,206 16% 12 - 15 638 9% 15 - 21 878 12% 21 - 31 449 6% over 31 81 1%
5 Small commercial business types include medical offices, professional
business (e.g. legal, real estate, etc.), restaurants, retail stores, and
special trade contractors (e.g. plumbing, electrical, heating, etc.)
14
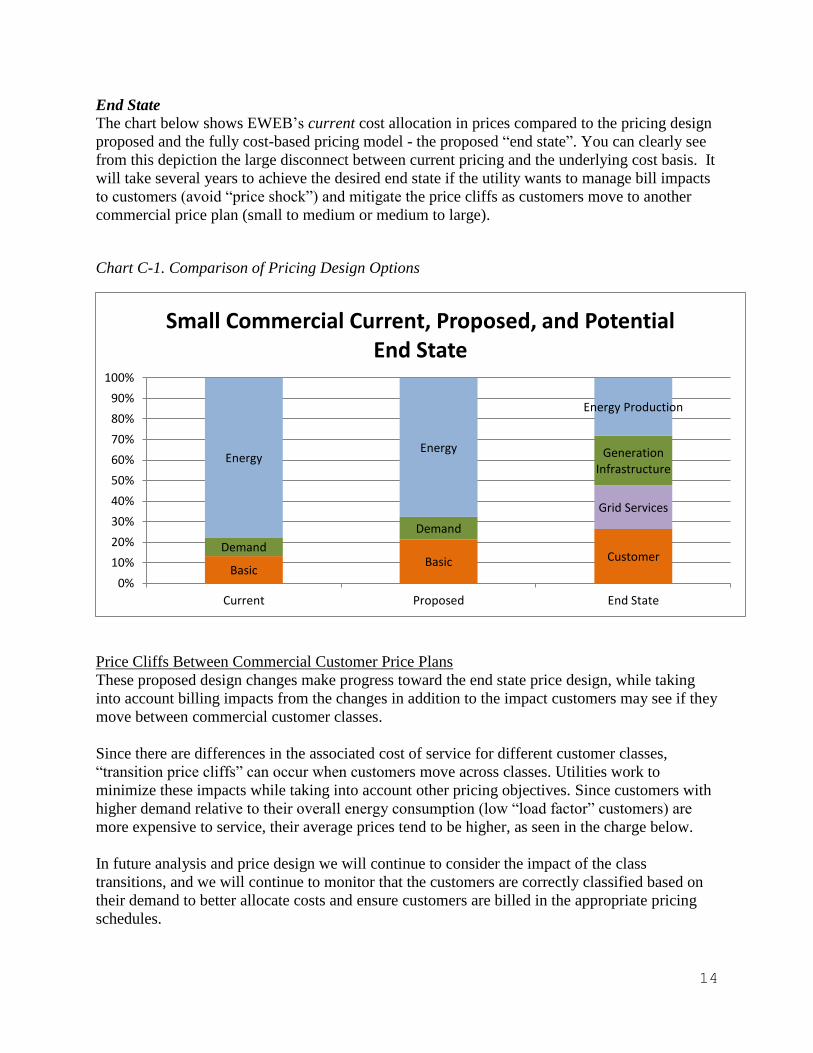
End State
The chart below shows EWEB’s current cost allocation in prices compared to the pricing design
proposed and the fully cost-based pricing model - the proposed “end state”. You can clearly see
from this depiction the large disconnect between current pricing and the underlying cost basis. It
will take several years to achieve the desired end state if the utility wants to manage bill impacts
to customers (avoid “price shock”) and mitigate the price cliffs as customers move to another
commercial price plan (small to medium or medium to large).
Chart C-1. Comparison of Pricing Design Options
Price Cliffs Between Commercial Customer Price Plans
These proposed design changes make progress toward the end state price design, while taking
into account billing impacts from the changes in addition to the impact customers may see if they
move between commercial customer classes.
Since there are differences in the associated cost of service for different customer classes,
“transition price cliffs” can occur when customers move across classes. Utilities work to
minimize these impacts while taking into account other pricing objectives. Since customers with
higher demand relative to their overall energy consumption (low “load factor” customers) are
more expensive to service, their average prices tend to be higher, as seen in the charge below.
In future analysis and price design we will continue to consider the impact of the class
transitions, and we will continue to monitor that the customers are correctly classified based on
their demand to better allocate costs and ensure customers are billed in the appropriate pricing
schedules.
BasicBasic Customer
Grid Services
Demand
Demand
Generation Infrastructure
EnergyEnergy
Energy Production
0%
10%
20%
30%
40%
50%
60%
70%
80%
90%
100%
Current Proposed End State
Small Commercial Current, Proposed, and Potential End State
15
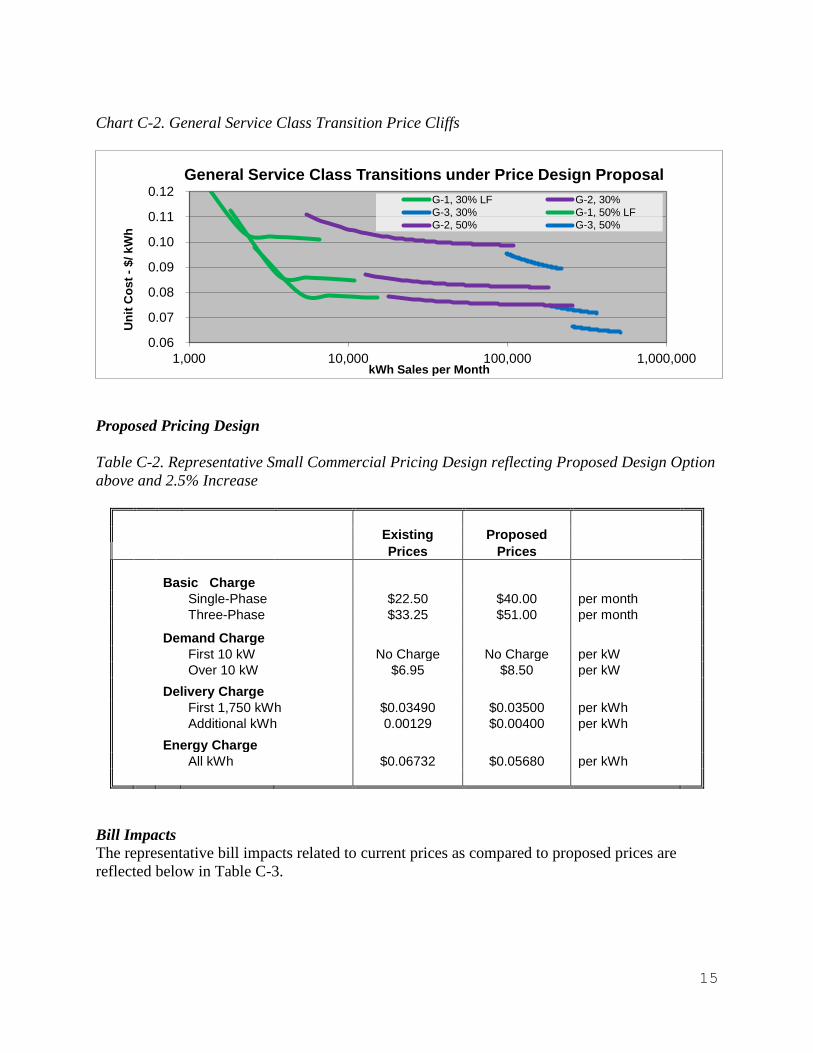
Chart C-2. General Service Class Transition Price Cliffs
Proposed Pricing Design
Table C-2. Representative Small Commercial Pricing Design reflecting Proposed Design Option
above and 2.5% Increase
Existing Proposed
Prices Prices
Basic Charge
Single-Phase $22.50 $40.00 per month
Three-Phase $33.25 $51.00 per month
Demand Charge
First 10 kW No Charge No Charge per kW
Over 10 kW $6.95 $8.50 per kW
Delivery Charge
First 1,750 kWh $0.03490 $0.03500 per kWh
Additional kWh 0.00129 $0.00400 per kWh
Energy Charge
All kWh $0.06732 $0.05680 per kWh
Bill Impacts
The representative bill impacts related to current prices as compared to proposed prices are
reflected below in Table C-3.
0.06
0.07
0.08
0.09
0.10
0.11
0.12
1,000 10,000 100,000 1,000,000
Un
it C
os
t -
$/ k
Wh
kWh Sales per Month
General Service Class Transitions under Price Design Proposal
G-1, 30% LF G-2, 30%
G-3, 30% G-1, 50% LF
G-2, 50% G-3, 50%
16
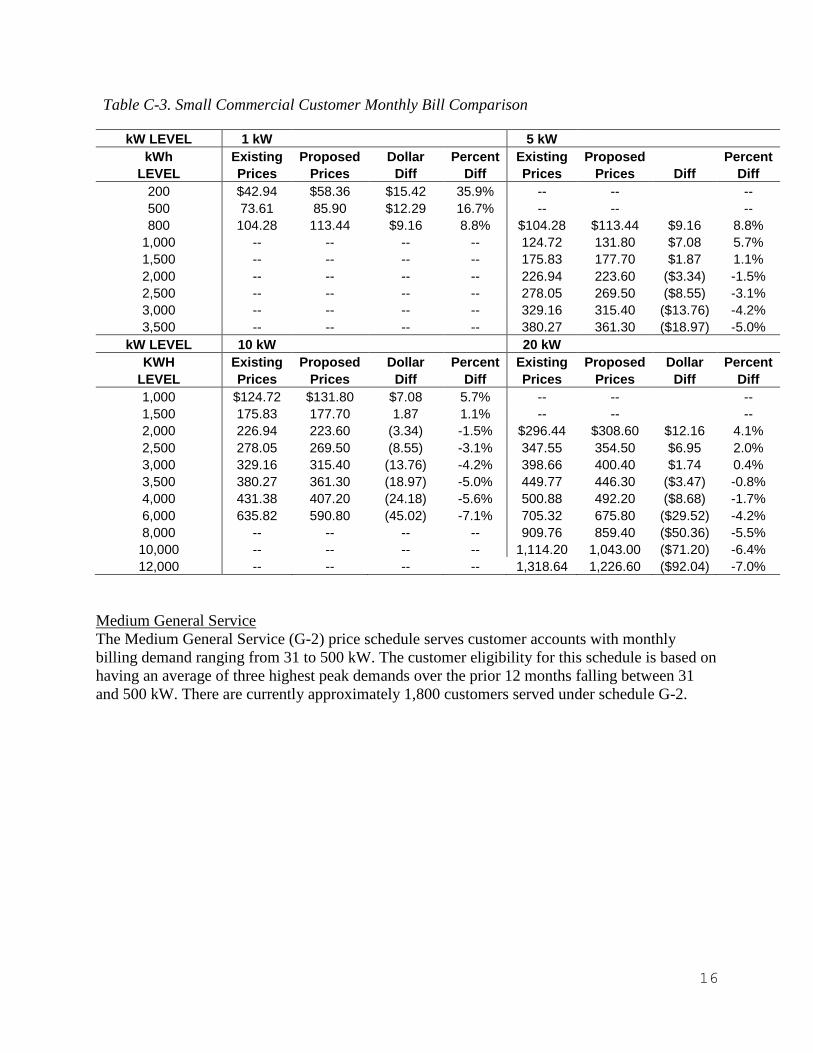
Table C-3. Small Commercial Customer Monthly Bill Comparison
kW LEVEL 1 kW 5 kW
kWh Existing Proposed Dollar Percent Existing Proposed Percent
LEVEL Prices Prices Diff Diff Prices Prices Diff Diff
200 $42.94 $58.36 $15.42 35.9% -- -- --
500 73.61 85.90 $12.29 16.7% -- -- --
800 104.28 113.44 $9.16 8.8% $104.28 $113.44 $9.16 8.8%
1,000 -- -- -- -- 124.72 131.80 $7.08 5.7%
1,500 -- -- -- -- 175.83 177.70 $1.87 1.1%
2,000 -- -- -- -- 226.94 223.60 ($3.34) -1.5%
2,500 -- -- -- -- 278.05 269.50 ($8.55) -3.1%
3,000 -- -- -- -- 329.16 315.40 ($13.76) -4.2%
3,500 -- -- -- -- 380.27 361.30 ($18.97) -5.0%
kW LEVEL 10 kW 20 kW
KWH Existing Proposed Dollar Percent Existing Proposed Dollar Percent
LEVEL Prices Prices Diff Diff Prices Prices Diff Diff
1,000 $124.72 $131.80 $7.08 5.7% -- -- --
1,500 175.83 177.70 1.87 1.1% -- -- --
2,000 226.94 223.60 (3.34) -1.5% $296.44 $308.60 $12.16 4.1%
2,500 278.05 269.50 (8.55) -3.1% 347.55 354.50 $6.95 2.0%
3,000 329.16 315.40 (13.76) -4.2% 398.66 400.40 $1.74 0.4%
3,500 380.27 361.30 (18.97) -5.0% 449.77 446.30 ($3.47) -0.8%
4,000 431.38 407.20 (24.18) -5.6% 500.88 492.20 ($8.68) -1.7%
6,000 635.82 590.80 (45.02) -7.1% 705.32 675.80 ($29.52) -4.2%
8,000 -- -- -- -- 909.76 859.40 ($50.36) -5.5%
10,000 -- -- -- -- 1,114.20 1,043.00 ($71.20) -6.4%
12,000 -- -- -- -- 1,318.64 1,226.60 ($92.04) -7.0%
Medium General Service
The Medium General Service (G-2) price schedule serves customer accounts with monthly
billing demand ranging from 31 to 500 kW. The customer eligibility for this schedule is based on
having an average of three highest peak demands over the prior 12 months falling between 31
and 500 kW. There are currently approximately 1,800 customers served under schedule G-2.

17
Table C-4. Medium Commercial (G-2) Demand Strata
Demand Range (kW) Medium Commercial
Accounts %
0 - 21 211 12%
21 - 31 285 16%
31 - 51 543 30%
51 - 101 410 23%
101 - 151 141 8%
151 - 201 72 4%
201 - 301 76 4%
over 301 47 3%
End State
The chart below shows EWEB’s current medium commercial prices, as compared to the
proposed price design, and the potential end state. EWEB proposed increase moves towards the
proposed end state price. Note there is no difference in the average customer bill under any of
these options.
Chart C-3. Comparison of Pricing Design Options
Basic Basic Fixed Customer Charge
Grid ServicesDemandDemand
Generation Infrastructure
EnergyEnergy
Energy Production
0%
10%
20%
30%
40%
50%
60%
70%
80%
90%
100%
Current Proposed End State
Medium Commercial Current, Proposed, and Potential End State
18
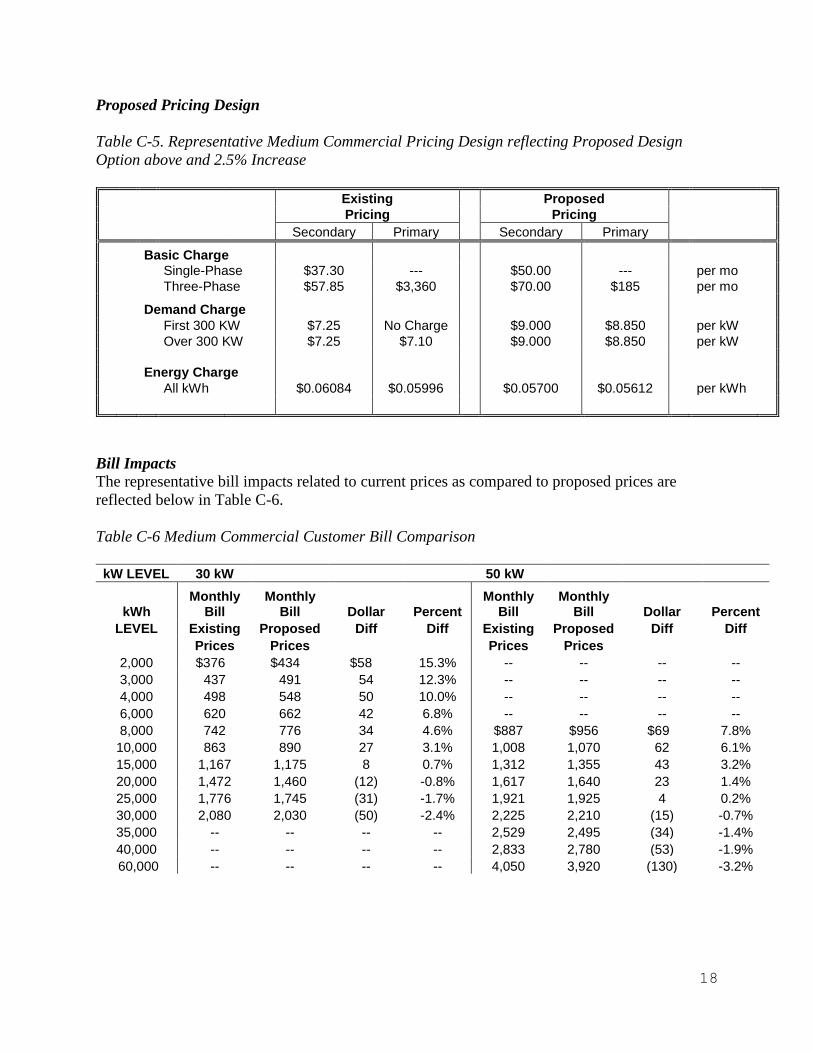
Proposed Pricing Design
Table C-5. Representative Medium Commercial Pricing Design reflecting Proposed Design
Option above and 2.5% Increase
Existing Proposed
Pricing Pricing
Secondary Primary Secondary Primary
Basic Charge Single-Phase $37.30 --- $50.00 --- per mo
Three-Phase $57.85 $3,360 $70.00 $185 per mo
Demand Charge
First 300 KW $7.25 No Charge $9.000 $8.850 per kW
Over 300 KW $7.25 $7.10 $9.000 $8.850 per kW
Energy Charge
All kWh $0.06084 $0.05996 $0.05700 $0.05612 per kWh
Bill Impacts
The representative bill impacts related to current prices as compared to proposed prices are
reflected below in Table C-6.
Table C-6 Medium Commercial Customer Bill Comparison
kW LEVEL 30 kW 50 kW
kWh Monthly
Bill Monthly
Bill Dollar Percent Monthly
Bill Monthly
Bill Dollar Percent
LEVEL Existing Proposed Diff Diff Existing Proposed Diff Diff
Prices Prices Prices Prices
2,000 $376 $434 $58 15.3% -- -- -- --
3,000 437 491 54 12.3% -- -- -- --
4,000 498 548 50 10.0% -- -- -- --
6,000 620 662 42 6.8% -- -- -- --
8,000 742 776 34 4.6% $887 $956 $69 7.8%
10,000 863 890 27 3.1% 1,008 1,070 62 6.1%
15,000 1,167 1,175 8 0.7% 1,312 1,355 43 3.2%
20,000 1,472 1,460 (12) -0.8% 1,617 1,640 23 1.4%
25,000 1,776 1,745 (31) -1.7% 1,921 1,925 4 0.2%
30,000 2,080 2,030 (50) -2.4% 2,225 2,210 (15) -0.7%
35,000 -- -- -- -- 2,529 2,495 (34) -1.4%
40,000 -- -- -- -- 2,833 2,780 (53) -1.9%
60,000 -- -- -- -- 4,050 3,920 (130) -3.2%
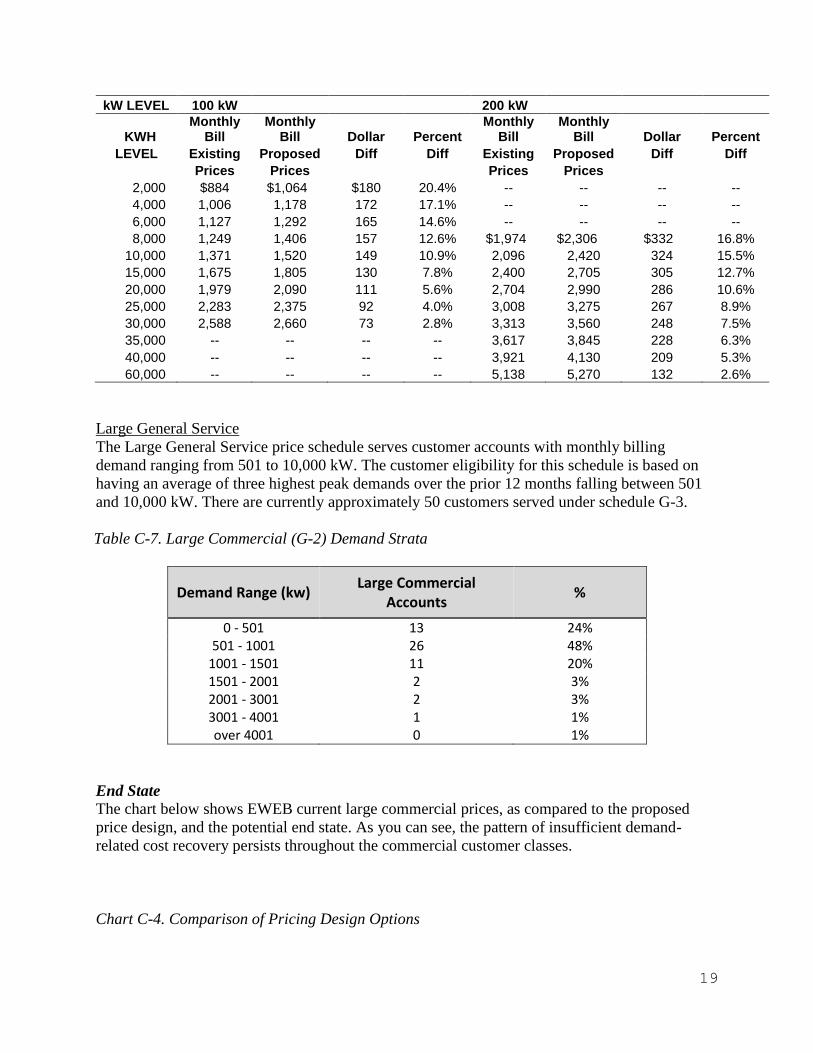
19
kW LEVEL 100 kW 200 kW
KWH Monthly
Bill Monthly
Bill Dollar Percent Monthly
Bill Monthly
Bill Dollar Percent
LEVEL Existing Proposed Diff Diff Existing Proposed Diff Diff
Prices Prices Prices Prices
2,000 $884 $1,064 $180 20.4% -- -- -- --
4,000 1,006 1,178 172 17.1% -- -- -- --
6,000 1,127 1,292 165 14.6% -- -- -- --
8,000 1,249 1,406 157 12.6% $1,974 $2,306 $332 16.8%
10,000 1,371 1,520 149 10.9% 2,096 2,420 324 15.5%
15,000 1,675 1,805 130 7.8% 2,400 2,705 305 12.7%
20,000 1,979 2,090 111 5.6% 2,704 2,990 286 10.6%
25,000 2,283 2,375 92 4.0% 3,008 3,275 267 8.9%
30,000 2,588 2,660 73 2.8% 3,313 3,560 248 7.5%
35,000 -- -- -- -- 3,617 3,845 228 6.3%
40,000 -- -- -- -- 3,921 4,130 209 5.3%
60,000 -- -- -- -- 5,138 5,270 132 2.6%
Large General Service
The Large General Service price schedule serves customer accounts with monthly billing
demand ranging from 501 to 10,000 kW. The customer eligibility for this schedule is based on
having an average of three highest peak demands over the prior 12 months falling between 501
and 10,000 kW. There are currently approximately 50 customers served under schedule G-3.
Table C-7. Large Commercial (G-2) Demand Strata
Demand Range (kw) Large Commercial
Accounts %
0 - 501 13 24% 501 - 1001 26 48%
1001 - 1501 11 20% 1501 - 2001 2 3% 2001 - 3001 2 3% 3001 - 4001 1 1% over 4001 0 1%
End State
The chart below shows EWEB current large commercial prices, as compared to the proposed
price design, and the potential end state. As you can see, the pattern of insufficient demand-
related cost recovery persists throughout the commercial customer classes.
Chart C-4. Comparison of Pricing Design Options

20
Proposed Pricing Design
Table C-8. Representative Large Customer Commercial Pricing Design reflecting Proposed
Design Option above and 2.5% Increase
Existing Proposed
Prices Prices
Secondary Primary Secondary Primary
Basic Charge $2,690 $2,615 $1,100 $1,050 per month
Demand Charge
First 300 kW No Charge No Charge $8.50 $8.30 per kW
Over 300 kW $7.50 $7.30 $8.50 $8.30 per kW
Energy Charge
All kWh $0.04823 $0.04730 $0.04550 $0.04457 per kWh
Bill Impacts
The representative bill impacts related to the current prices as compared to the proposed prices
are represented in C-9.
Basic Basic Customer
Grid ServicesDemand Demand
Generation Infrastructure
Energy Energy
Energy Production
0%
10%
20%
30%
40%
50%
60%
70%
80%
90%
100%
Current Proposed End State
Large Commercial Current & Potential End State

21
Table C-9. Large Commercial Customer Monthly Bill Comparison
kWh LEVEL 500 kW 1000 kW
Monthly Bill
Monthly Bill Dollar Percent
Monthly Bill
Monthly Bill Dollar Percent
Existing Proposed Diff Diff Existing Proposed Diff Diff
Prices Prices Prices Prices
60,000 $7,084 $8,080 $996 14.1% -- -- --
80,000 8,048 8,990 942 11.7% -- -- --
100,000 9,013 9,900 887 9.8% $12,763 $14,150 $1,387 10.9%
150,000 11,425 12,175 751 6.6% 15,175 16,425 1,251 8.2%
200,000 13,836 14,450 614 4.4% 17,586 18,700 1,114 6.3%
250,000 16,248 16,725 478 2.9% 19,998 20,975 978 4.9%
300,000 18,659 19,000 341 1.8% 22,409 23,250 841 3.8%
350,000 21,071 21,275 205 1.0% 24,821 25,525 705 2.8%
500,000 -- -- -- 32,055 32,350 295 0.9%
600,000 -- -- -- 36,878 36,900 22 0.1%
700,000 -- -- -- 41,701 41,450 (251) -0.6%
800,000 -- -- -- 46,524 46,000 (524) -1.1%
1,000,000 -- -- -- 56,170 55,100 (1,070) -1.9%
1,500,000 -- -- -- 80,285 77,850 (2,435) -3.0%
2,000,000 -- -- -- 104,400 100,600 (3,800) -3.6%
Street Lighting
Management will be bringing proposed price schedules for both public and private street lighting
to the November 2015 Board meeting. The revised schedules will reflect updates to the cost of
service models as well as a new schedule for LED street lighting. The LED price will be based
on multiple wattage ranges each with an assigned price for its respective range.
C. Electric Pilot Offering – Commercial TOU
Commercial Time of Use
EWEB is proposing a limited time of use pilot for commercial customers. The time of use pilot
allows customer to benefit from shifting load to off-peak hours. The intent of the pilot is to allow
customers to receive the benefit of load shifting while EWEB works through metering issues,
billing, and customer accounting issues with a small group of customers. The pilot price is
limited due to billing constraints, but it is structured to be revenue neutral. Customers would not
be guaranteed bill savings under this pilot.
The design is constructed to pass along savings from EWEB’s BPA network transmission bill
and on- and off-peak price differentials. The BPA network transmission bill is determined by
EWEB’s peak kilowatt demand at the time of the BPA’s transmission system peak. We reviewed
the historical data to confirm the on-peak demand period coincided with the BPA transmission
system peak. Therefore, a shift in demand from on-peak to off-peak hours will have a
corresponding reduction in BPA NT bills every two years when BPA resets their prices.
22
The on- and off-peak energy pricing differential was based on the wholesale market price
differential. If the customer shifts from on peak to off peak hours, EWEB is able to arbitrage the
difference in market prices to realize the on- and off- peak price differential. Both the demand
and energy off-peak pricing represents real cost savings to EWEB that can be being passed along
to customers who can consume proportionately more in the off-peak periods.
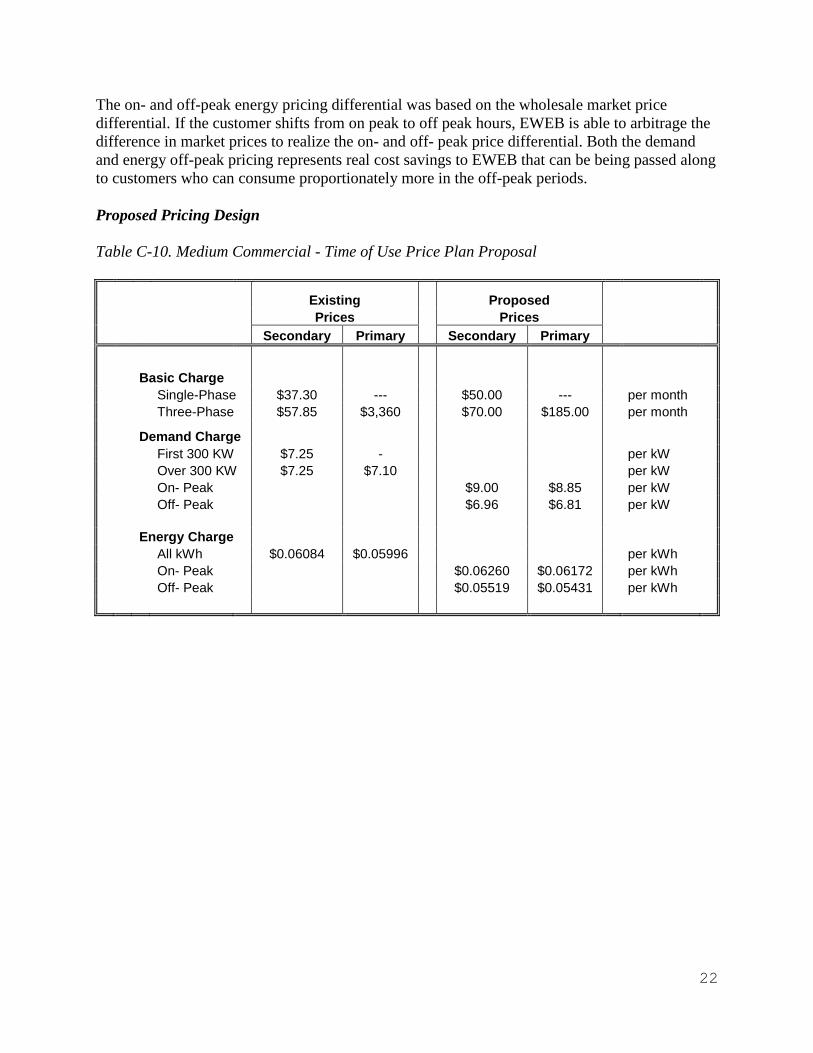
Proposed Pricing Design
Table C-10. Medium Commercial - Time of Use Price Plan Proposal
Existing Proposed
Prices Prices
Secondary Primary Secondary Primary
Basic Charge
Single-Phase $37.30 --- $50.00 --- per month
Three-Phase $57.85 $3,360 $70.00 $185.00 per month
Demand Charge
First 300 KW $7.25 - per kW
Over 300 KW $7.25 $7.10 per kW
On- Peak $9.00 $8.85 per kW
Off- Peak $6.96 $6.81 per kW
Energy Charge
All kWh $0.06084 $0.05996 per kWh
On- Peak $0.06260 $0.06172 per kWh
Off- Peak $0.05519 $0.05431 per kWh
23
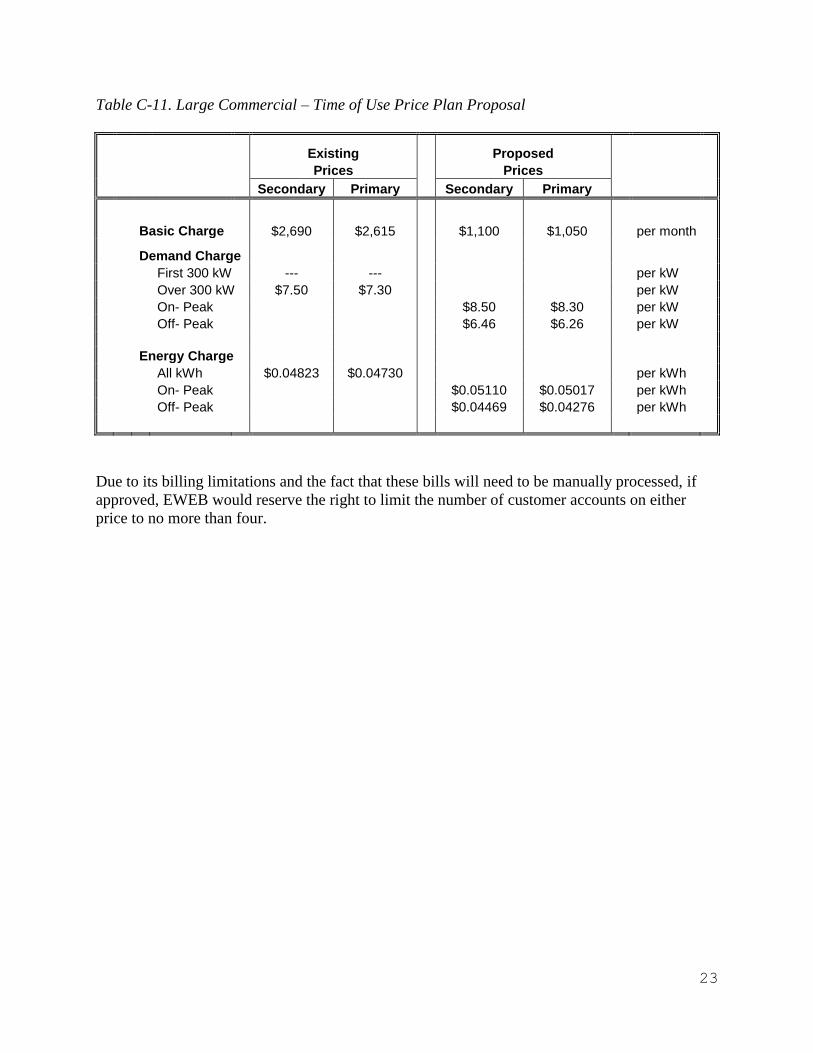
Table C-11. Large Commercial – Time of Use Price Plan Proposal
Existing Proposed
Prices Prices
Secondary Primary Secondary Primary
Basic Charge $2,690 $2,615 $1,100 $1,050 per month
Demand Charge
First 300 kW --- --- per kW
Over 300 kW $7.50 $7.30 per kW
On- Peak $8.50 $8.30 per kW
Off- Peak $6.46 $6.26 per kW
Energy Charge
All kWh $0.04823 $0.04730 per kWh
On- Peak $0.05110 $0.05017 per kWh
Off- Peak $0.04469 $0.04276 per kWh
Due to its billing limitations and the fact that these bills will need to be manually processed, if
approved, EWEB would reserve the right to limit the number of customer accounts on either
price to no more than four.

24
II. Open Access Transmission Tariff (OATT) proposal
While this item is typically not bundled with the retail price proposal for Board, the timing
matched on this occasion and so we are addressing review of the retail price and wholesale price
changes together.
Background
A price increase in EWEB’s transmission tariff is being proposed. The primary price would
increase from $1.13 per kW-month to $1.51 per kW month, effective with January 2016 bills.
The most recent change to the price was in January 2011.
EWEB offers electric transmission service at the wholesale level. User prices for this service are
contained in EWEB’s Open Access Transmission Tariff (OATT). This tariff is patterned after
OATT tariffs required of FERC-jurisdiction utilities. Though EWEB is not a FERC-jurisdiction
utility, it has voluntary chosen this type of price and price schedule to provide transmission on a
non-discriminatory basis and to provide consistency with other transmission serving entities.
Currently EWEB provides transmission service to the Springfield Utility Board and the
University of Oregon.
Discussion
EWEB’s OATT tariff is periodically updated and was most recently updated in January 2011.
The proposed increase is due to higher transmission plant investment and decreasing peak load
forecast. Both of these factors result in a higher price.
The peak load forecast decrease reflects lower peak demand.
Under this proposal, the primary price for the transmission system would increase from $1.13 per
kilowatt month to $1.51 per kilowatt month.
Table OATT-1. Open Access Transmission Tariff Price Plan Proposal
Existing Transmission Prices per kW-Year per kW-Month
a. McKenzie Substation Common $ 5.69 $ 0.47
b. Transmission System $13.53 $ 1.13
Proposed 2016 Transmission Prices
a. McKenzie Substation Common $ 5.36 $ 0.45
b. Transmission System $ 18.11 $ 1.51

25
III. WATER RETAIL PRICING UTILITY PROPOSAL
A. Possible end states for current Pricing Strategy
To prepare for a discussion around the best end state solution for EWEB’s pricing strategy, here
is a refresher on the basic cost components of a customer’s bill.
Basic Cost Components:
1) Customer-related charges, include: meter reading, billing and customer service. These
costs are based on meter size and cover the cost of services that must be provided
regardless of how much water is used per month.
2) Consumption-related charges, include: water extraction, processing and delivery. These
costs apply to the amount of water consumed per month and are expressed in thousands
of gallons, or "kgals."
3) Elevation-related charges, include: the cost of pumping water to higher-elevation
customers, where applicable.
Here are some of the changes Management is interested in pursuing:
Increasing fixed costs
Assessing tier pricing
Assessing elevation charges
Water price design will be undergoing a more comprehensive assessment next year. Prior to the
implementation of our new asset management system, we were unable to trace costs to the
specific assets needed to deliver water to higher elevations. With the implementation of WAM,
we have an opportunity to accumulate costs such that we can assign them to the appropriate
elevation zones. In developing a water “end state” proposal, we will also revisit the assumptions
in the water COSA.
The water utility faces unique challenges in its water price design. The costs of providing water
are primarily fixed (costs that do not vary with consumption). In its effort to improve fixed cost
recovery, EWEB will need to balance water supply pricing objectives with regulatory
requirements around conservation, as detailed below.
In accordance with Oregon Water Resources Department administrative rules for Water
Management and Conservation Plans, OAR 690-086-0150 required that for an EWEB
groundwater permit, the applicable price elements require inclusion of the following:
A price structure under which customer bills are based, at least in part, on the quantity of
water metered at the service connections; and
Adoption of price structures, billing schedules, and other associated programs that
support and encourage water conservation.
26
In 2012, EWEB's Water Management and Conservation Plan (WMCP) was approved by the
State of Oregon Water Resources Department (OWRD) to meet this OAR requirement. OWRD
determined that EWEB's inclining, tiered pricing (established in 2000) was a benchmark that
EWEB is required to meet as a condition of certain water permits. EWEB water pricing to date
continues to be consistent with the most commonly applied conservation approach, as defined by
the Alliance for Water Efficiency. In addition, according to the California Urban Water
Conservation Council (CUWCC) BMP-116, the generally accepted definition of a conservation
water price has two criteria:
Collect no more than 30% of revenue from fixed charges so that increases in water
consumption directly impact the water bill.
The goal of BMP-11 is to recover the maximum amount of water sales revenue from
conservation pricing which may include:
o uniform volumetric prices (considered to be a conservation pricing compared to flat
fee for all the water you can use),
o seasonal prices (an increased block effective during the outdoor watering season),
o tiered prices (also called increasing block prices), and/or
o allocation-based prices (also called water budget prices).
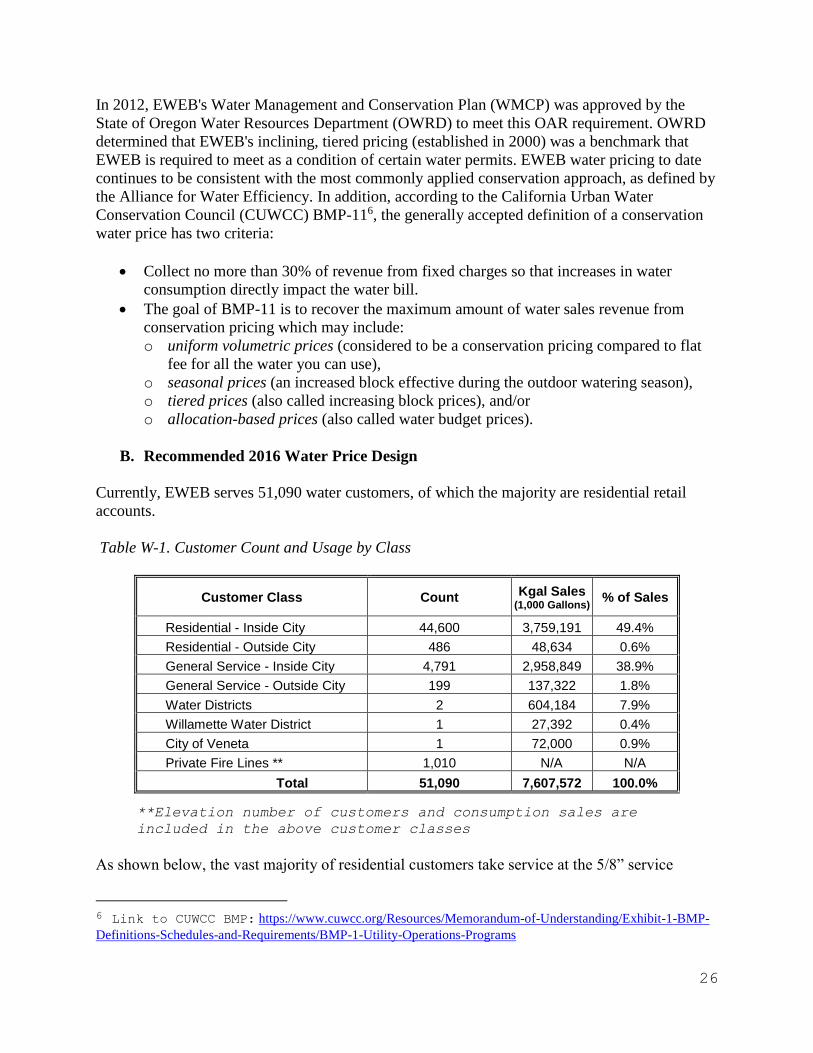
B. Recommended 2016 Water Price Design
Currently, EWEB serves 51,090 water customers, of which the majority are residential retail
accounts.
Table W-1. Customer Count and Usage by Class
Customer Class Count Kgal Sales (1,000 Gallons)
% of Sales
Residential - Inside City 44,600 3,759,191 49.4%
Residential - Outside City 486 48,634 0.6%
General Service - Inside City 4,791 2,958,849 38.9%
General Service - Outside City 199 137,322 1.8%
Water Districts 2 604,184 7.9%
Willamette Water District 1 27,392 0.4%
City of Veneta 1 72,000 0.9%
Private Fire Lines ** 1,010 N/A N/A
Total 51,090 7,607,572 100.0%
**Elevation number of customers and consumption sales are
included in the above customer classes
As shown below, the vast majority of residential customers take service at the 5/8” service
6 Link to CUWCC BMP: https://www.cuwcc.org/Resources/Memorandum-of-Understanding/Exhibit-1-BMP-
Definitions-Schedules-and-Requirements/BMP-1-Utility-Operations-Programs
27
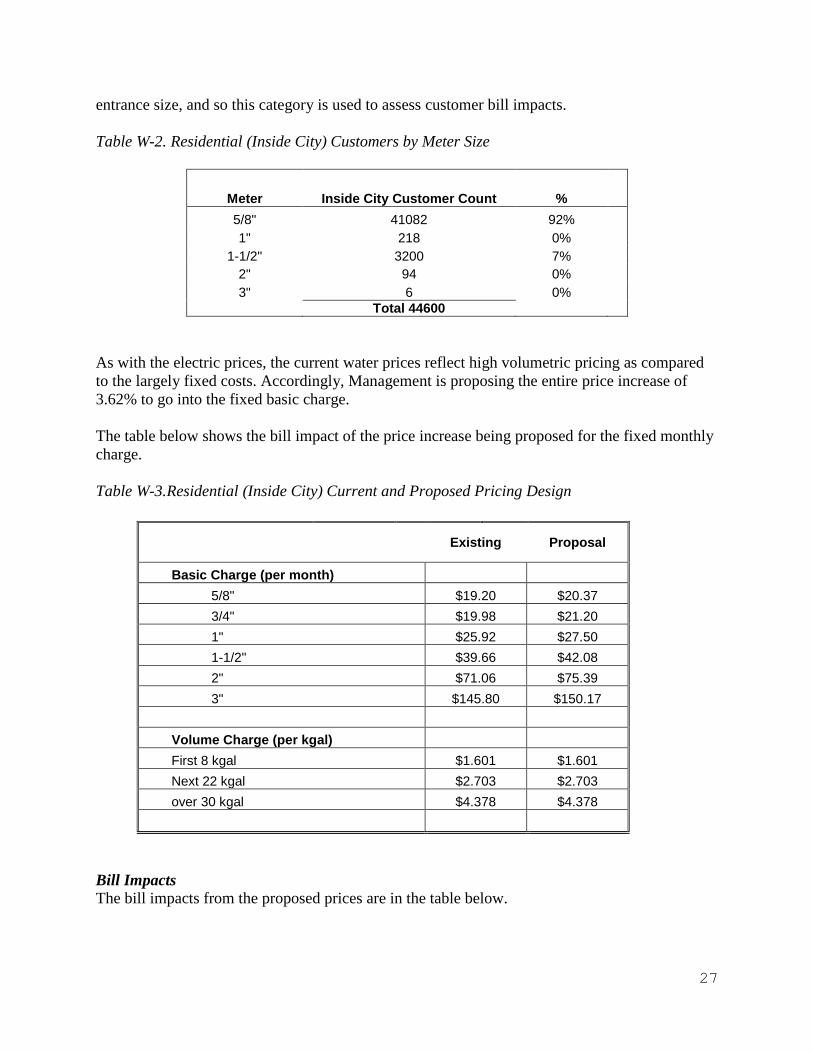
entrance size, and so this category is used to assess customer bill impacts.
Table W-2. Residential (Inside City) Customers by Meter Size
Meter Inside City Customer Count %
5/8" 41082 92%
1" 218 0%
1-1/2" 3200 7%
2" 94 0%
3" 6 0% Total 44600
As with the electric prices, the current water prices reflect high volumetric pricing as compared
to the largely fixed costs. Accordingly, Management is proposing the entire price increase of
3.62% to go into the fixed basic charge.
The table below shows the bill impact of the price increase being proposed for the fixed monthly
charge.
Table W-3.Residential (Inside City) Current and Proposed Pricing Design
Existing Proposal
Basic Charge (per month)
5/8" $19.20 $20.37
3/4" $19.98 $21.20
1" $25.92 $27.50
1-1/2" $39.66 $42.08
2" $71.06 $75.39
3" $145.80 $150.17
Volume Charge (per kgal)
First 8 kgal $1.601 $1.601
Next 22 kgal $2.703 $2.703
over 30 kgal $4.378 $4.378
Bill Impacts
The bill impacts from the proposed prices are in the table below.
28
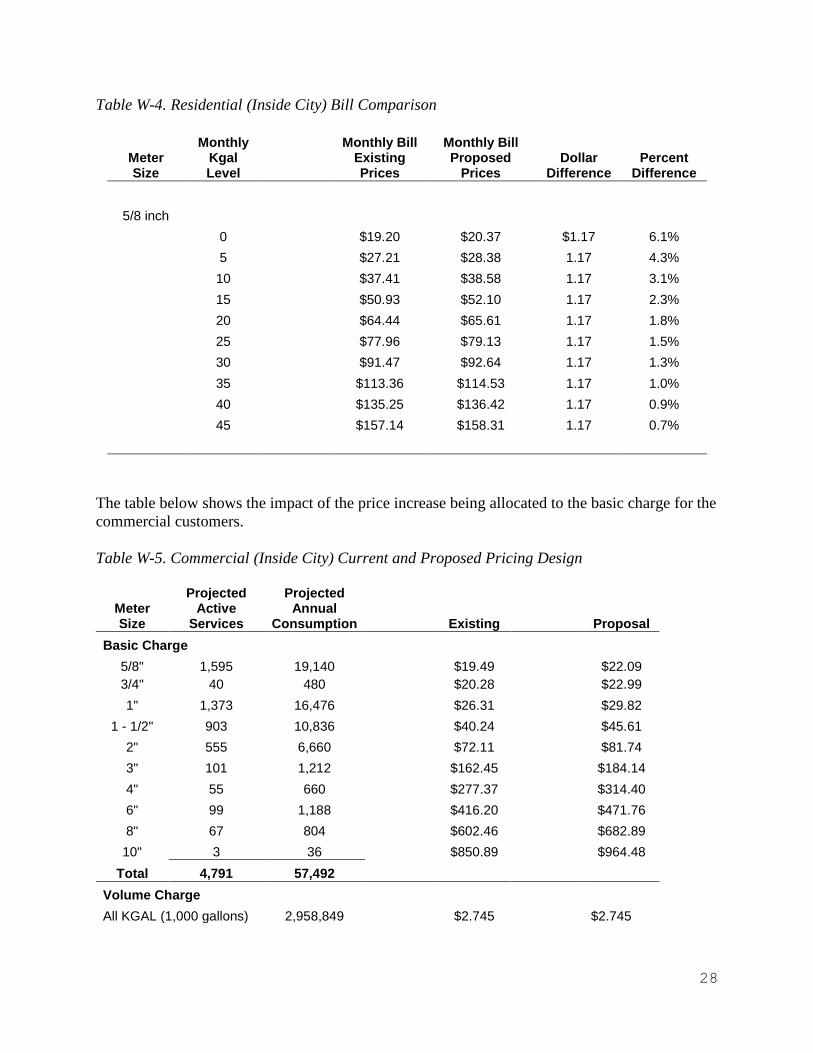
Table W-4. Residential (Inside City) Bill Comparison
Meter Size
Monthly Kgal Level
Monthly Bill Existing Prices
Monthly Bill Proposed
Prices Dollar
Difference Percent
Difference
5/8 inch
0 $19.20 $20.37 $1.17 6.1%
5 $27.21 $28.38 1.17 4.3%
10 $37.41 $38.58 1.17 3.1%
15 $50.93 $52.10 1.17 2.3%
20 $64.44 $65.61 1.17 1.8%
25 $77.96 $79.13 1.17 1.5%
30 $91.47 $92.64 1.17 1.3%
35 $113.36 $114.53 1.17 1.0%
40 $135.25 $136.42 1.17 0.9%
45 $157.14 $158.31 1.17 0.7%
The table below shows the impact of the price increase being allocated to the basic charge for the
commercial customers.
Table W-5. Commercial (Inside City) Current and Proposed Pricing Design
Meter Size
Projected Active
Services
Projected Annual
Consumption Existing Proposal
Basic Charge
5/8" 1,595 19,140 $19.49 $22.09
3/4" 40 480 $20.28 $22.99
1" 1,373 16,476 $26.31 $29.82
1 - 1/2" 903 10,836 $40.24 $45.61
2" 555 6,660 $72.11 $81.74
3" 101 1,212 $162.45 $184.14
4" 55 660 $277.37 $314.40
6" 99 1,188 $416.20 $471.76
8" 67 804 $602.46 $682.89
10" 3 36 $850.89 $964.48
Total 4,791 57,492
Volume Charge
All KGAL (1,000 gallons) 2,958,849 $2.745 $2.745

29
Bill Impacts
The proposed bill impacts are on the table below.
Table W-6. Commercial (Inside City) Current and Proposed Bill Impact
5/8" SERVICE 1" SERVICE 2" SERVICE
Monthly Usage Level
(KGAL)
Monthly Bill
Existing Price
Monthly Bill
Proposed Price
Percent Diff.
Monthly Bill
Existing Price
Monthly Bill
Proposed Price
Percent Diff.
Monthly Bill
Present Price
Monthly Bill
Proposed Price
Percent Diff.
0 $19.49 $22.09 13.3%
5 33.22 35.82 7.8%
10 46.94 49.54 5.5% $53.76 $57.27 6.5%
15 60.67 63.27 4.3% 67.49 71.00 5.2%
20 74.39 76.99 3.5% 81.21 84.72 4.3% $127.01 $136.64 7.6%
25 88.12 90.72 3.0% 94.94 98.45 3.7% 140.74 150.37 6.8%
30 101.84 104.44 2.6% 108.66 112.17 3.2% 154.46 164.09 6.2%
40 129.29 131.89 2.0% 136.11 139.62 2.6% 181.91 191.54 5.3%
50 156.74 159.34 1.7% 163.56 167.07 2.1% 209.36 218.99 4.6%
75 232.19 235.70 1.5% 277.99 287.62 3.5%
100 300.81 304.32 1.2% 346.61 356.24 2.8%
200 575.31 578.82 0.6% 621.11 630.74 1.6%
250 712.56 716.07 0.5% 758.36 767.99 1.3%
500 1,444.61 1,454.24 0.7%
4" SERVICE 6" SERVICE
Monthly Usage Level
(KGAL)
Monthly Bill
Existing Price
Monthly Bill
Proposed Price
Percent Diff
Monthly Bill
Existing Price
Monthly Bill
Proposed Price
Percent Diff.
50 $414.62 $451.65 8.9%
75 483.25 520.28 7.7%
100 551.87 588.90 6.7% $690.70 $746.26 8.0%
200 826.37 863.40 4.5% 965.20 1,020.76 5.8%
250 963.62 1,000.65 3.8% 1,102.45 1,158.01 5.0%
500 1,649.87 1,686.90 2.2% 1,788.70 1,844.26 3.1%
750 2,336.12 2,373.15 1.6% 2,474.95 2,530.51 2.2%
1,000 3,022.37 3,059.40 1.2% 3,161.20 3,216.76 1.8%
1,500 4,533.70 4,589.26 1.2%
2,000 5,906.20 5,961.76 0.9%
2,500 7,278.70 7,334.26 0.8%

30
Recommendations
Management will be making the following recommendations to the Board at the October 6 Board
meeting:
Electric Utility:
1. Approve Management recommendation to select Option A – which shifts $10 (vs. $5) to
the basic charge, and makes an offsetting energy charge reduction, for inclusion in the
formal residential pricing proposal scheduled to come to the Board in November.
2. Direct Management to also reflect the recommended commercial class price plan design
changes in the November proposal.
3. Direct Management to adopt the end-state pricing objectives defined in this backgrounder
and choose either a three-year or five-year implementation path to completion.
4. Direct Management to include the OATT update and the C-TOU pilot proposal in the
formal November proposal, in order to leverage the public process already planned.
Water Utility:
1. Direct Management to include the price increase in the fixed bill component for the
November proposal and public process.
2. Direct Management to return next year with end-state pricing objectives that take into
account the appropriate levels of fixed charge, conservation price signals and elevation
charges.

31
APPENDIX 1. OPTIONAL READING

What’s a Watt Worth? Page 1 of 4
What's a Watt Worth?
THE BEGINNING OF RATE REFORM
Published In: EnergyBiz Magazine Summer 2015
Richard Schlesinger
TUCSON ELECTRIC POWER, the Arizona‐based investor‐
owned utility, and Sacramento Municipal Utility District,
or SMUD, the community‐owned utility that serves the
capital area of California, are planning changes to their
rate structures to more accurately reflect the current state of the utility industry.
It's a process that is being addressed with increasing urgency across the country.
But although it's clear that old rate structures, designed to account for
predictable costs of production and infrastructure requirements, no longer reflect
the reality of today's systems, just how to better align rates with actual costs ‐‐‐
and to do so in an equitable manner ‐‐‐ is far from obvious.
Just who pays for what in today's disruptive environment may be less sexy than
understanding the structural changes and technological opportunities and risks
facing the industry, but it's no less crucial.
Technology is rapidly changing both the structure and the function of the grid,
and as the grid becomes increasingly data‐driven, security issues become all the
more critical and costly.
At the same time, distributed generation, solar panels in particular, complicate
the relationship between generation and distribution. Because the customer base
is now diverse and because not every residential or commercial customer uses
energy in the same way or at the same time, it is essential to unbundle rates so
that the cost of a customer's use of the infrastructure is clear. It also is essential
to adjust energy rates to reflect those costs, including time‐of‐day differentials,
and specific services.
Distributed generation, particularly rooftop solar, offers the most obvious
challenge to traditional utility rates, which were essentially volumetric. Using a

What’s a Watt Worth? Page 2 of 4
volumetric model, utilities recovered costs based on the amount of energy used.
When customers generate their own power, however, the volume they take from
the grid goes down and so does the revenue that utility companies receive, part
of which goes to maintaining the grid and the rest of the power infrastructure.
With net metering, when customers sell excess power back to the utility, the
problem is exacerbated.
Rate clarity is essential if people are to make informed decisions about adopting
rooftop solar for their homes. Under the traditional rate system, which bundles
infrastructure and power costs, customers who draw less power from the system,
including those whose usage is significantly decreased by solar arrays, pay less
than their fair share for operating and maintaining the system. Essentially, that
means those who choose not to adopt solar, often because they can't afford it,
are subsidizing those customers who can afford it. At the same time, customers
who decide to adopt solar on the assumption that they will be able to sell back
excess power at an unrealistically high rate will be in for a rude awakening when
rates are unbundled and net metering is priced realistically.
Tucson Electric’s sister company, Unisource Energy Services, in its May application
for new electric rates, specifically addresses these issues. TEP withdrew a similar
application earlier this year, but plans to resubmit it as part of a rate request.
It proposes purchasing excess power from home rooftop installations at the
current market price for power from large solar arrays. Current residential
installations and requests for installations submitted by June 1 will be
grandfathered under the old rates.
Phil Dion, former senior vice president for Public Policy and Customer Solutions at
TEP, emphasizes that rate transparency is essential to ensure that all customers
pay their fair share of the costs of maintaining the system and so that customers
can make informed decisions.
"We need to send proper price signals to customers so they can decide if adding a
rooftop array, for instance, is worth the cost of installation," he said.
Jim Tracy, chief financial officer, Finance and Enterprise Planning for SMUD,
echoes Dion's concern about realistic pricing.
What’s a Watt Worth? Page 3 of 4
"If the utility changes the rate structure so that different services are unbundled,
all of a sudden early adopters of solar will face a new rate structure that may not
pay them as much as they assumed they'd get. The last thing we want to do is pull
the rug out from under them or drastically slow the adoption of renewable
sources. So, for us, one of the issues is to get ahead of this and make these
decisions before we have a large number of our residential and commercial
customers making long‐term investment decisions based on an unrealistic rate
structure, Tracy said."
At the same time, SMUD wants to avoid making the rate structure unnecessarily
complex. "I think that if you try to do too much too quickly, you'll just confuse the
customer. The board wants to phase in rate restructuring so that people will have
a sense of how the new rates will affect them so that they have a chance to react.
We don't want them to be hit with a big change in their bill all at once," he said.
Tracy noted that while the changes may not always be significant in absolute
terms, a change of even $5 per month could be significant for some customers.
SMUD's board decided a few years ago to begin unbundling rates gradually, so
that most of the changes will be in place by 2018, which is when the utility
expects to convert to a time‐of‐use rate for residential customers.
SMUD has used a tiered system for billing, in which the first block of power is
billed at a lower rate, with additional blocks costing more. This system, of course,
fails to reflect the actual cost of power, which fluctuates with system demand.
With the deployment of digital meters just about complete, SMUD is prepared to
eliminate tiered pricing and expects to complete the move to time‐of‐day pricing
by 2018.
"Digital meters are really a tipping point for rate reform," SMUD's Tracy noted.
"These meters permit two‐way communication with the customer, which gives
them real‐time pricing information so they can intelligently manage their load.
We see load management as becoming more and more prevalent. With the
advent of new smart appliances and apps to remotely control them, residential
customers will be able to cut their costs, and we'll see a shift away from peak
demand times."

What’s a Watt Worth? Page 4 of 4
Tracy also expects commercial customers to take increasing advantage of load
management. "We expect load management to become especially important to
commercial customers, who may rely on third‐party vendors to help manage load
across a number of locations. For example, Safeway, the supermarket chain, is
using a third party to help manage load in their California stores. We see that as a
very common model going forward," he said.
With the grid quickly evolving into a highly complex, bidirectional, data‐driven
system that demands increasing levels of investment and the utility customer
base becoming ever more diverse in its use of power, and with the deployment of
distributed generation and the need to maintain reliability and quality standards
in the face of sophisticated security threats, the traditional way that utilities
charge for their power and their services is obviously inadequate.
But however obvious the need for change, the details and the process of
implementation are not. In other words, while rate reform is inevitable, it won't
come without a certain amount of disruption, both for utilities and their
customers.