2015 oregon air quality data summaries · 30.09.2016 · iv glossary of air quality terms used in...
TRANSCRIPT
2015 Oregon Air Quality Data Summaries
July 2016
Last Updated: 09/30/16 By: Jane Doe
DEQ 03-??-###

ii
This report prepared by:
Oregon Department of Environmental Quality
811 SW 6th Avenue
Portland, OR 97204
1-800-452-4011
Contact:
Anthony Barnack
(503) 229-5713
Alternative formats (Braille, large type) of this document can be made available. Contact DEQ, Portland,
at 503-229-5696, or toll-free in Oregon at 1-800-452-4011, ext. 5696.
i
Table of Contents
Oregon’s 2015 Ambient Air Quality in Summary: ....................................................................................... 1
Air Quality Index .......................................................................................................................................... 2
How the AQI is computed ........................................................................................................................ 2
2015 Oregon Air Quality Index by City ................................................................................................... 3
Air Quality Trends ...................................................................................................................................... 22
PM10 Trends .......................................................................................................................................... 38
Carbon Monoxide Trends ....................................................................................................................... 38
Sulfur Dioxide Trends ............................................................................................................................ 39
Nitrogen Dioxide Trends ........................................................................................................................ 39
Air Toxics Trends ................................................................................................................................... 40
Green House Gas Trends ........................................................................................................................ 43
National Ambient Air Quality Standards (NAAQS) ..................................................................................... 45
Exceedances vs. Violation ............................................................................................................................ 45
Recent NAAQS Exceedances. .................................................................................................................... 46
Appendix 1 Data Summaries for 2006 through 2015 .................................................................................... 48
DEQ Air Monitoring Methods .................................................................................................................... 49
A. PM2.5 Data Summary .................................................................................................................... 50
B. PM10 Data Summary ..................................................................................................................... 54
C. Ozone Data Summary .................................................................................................................... 56
D. Nitrogen Dioxide Data Summary .................................................................................................. 59
E. Sulfur Dioxide Data Summary ....................................................................................................... 59
F. Carbon Monoxide Data Summary ................................................................................................. 59
G. Air Quality Index Summary ........................................................................................................... 60
H. Air Toxics Data Summary ............................................................................................................. 68
Appendix 2. Oregon Air Quality Surveillance Network................................................................................ 71
Appendix 3 Data Quality .............................................................................................................................. 76
Table of Tables Table 1 Air Quality Index Health Category Descriptors. ............................................................................ 2
Table 2. Air Quality Index Ranges and Episode Stages. .............................................................................. 2
Table 3. Figure Key for 2015 Air Quality Index. ........................................................................................ 3
Table 4. 2015 National Ambient Air Quality Standards (NAAQS). .......................................................... 45
Table 5. PM2.5 98th Percentile – Eastern Oregon. ..................................................................................... 46
Table 6. PM2.5 98th Percentile – Western Oregon. ................................................................................... 46
Table 7. PM10 Number of Exceedances per year. ..................................................................................... 47
Table 8. Carbon Monoxide Number of Exceedances per year. ................................................................. 47
Table 9. Ozone Number of Exceedances per year. .................................................................................... 47
Table 10. Ambient Air Quality Monitoring Methods ................................................................................. 49
Table 11. Oregon Ambient Air Monitoring Network. ............................................................................... 72
Table 12. Oregon Ambient Air Monitoring Visibility and Forest Health Network. .................................. 74
ii
Table of Figures Figure 1. 2015 Albany Air Quality Summary. .............................................................................................. 3
Figure 2. 2015 Applegate Valley Air Quality Summary. ............................................................................. 4
Figure 3. 2015 Baker City Air Quality Summary. ........................................................................................ 4
Figure 4. 2015 Beaverton Air Quality Summary. ......................................................................................... 5
Figure 5. 2015 Bend Air Quality Summary. ................................................................................................. 5
Figure 6. 2015 Burns/Hines Air Quality Summary. ..................................................................................... 6
Figure 7. 2015 Cave Junction Air Quality Summary. ................................................................................... 6
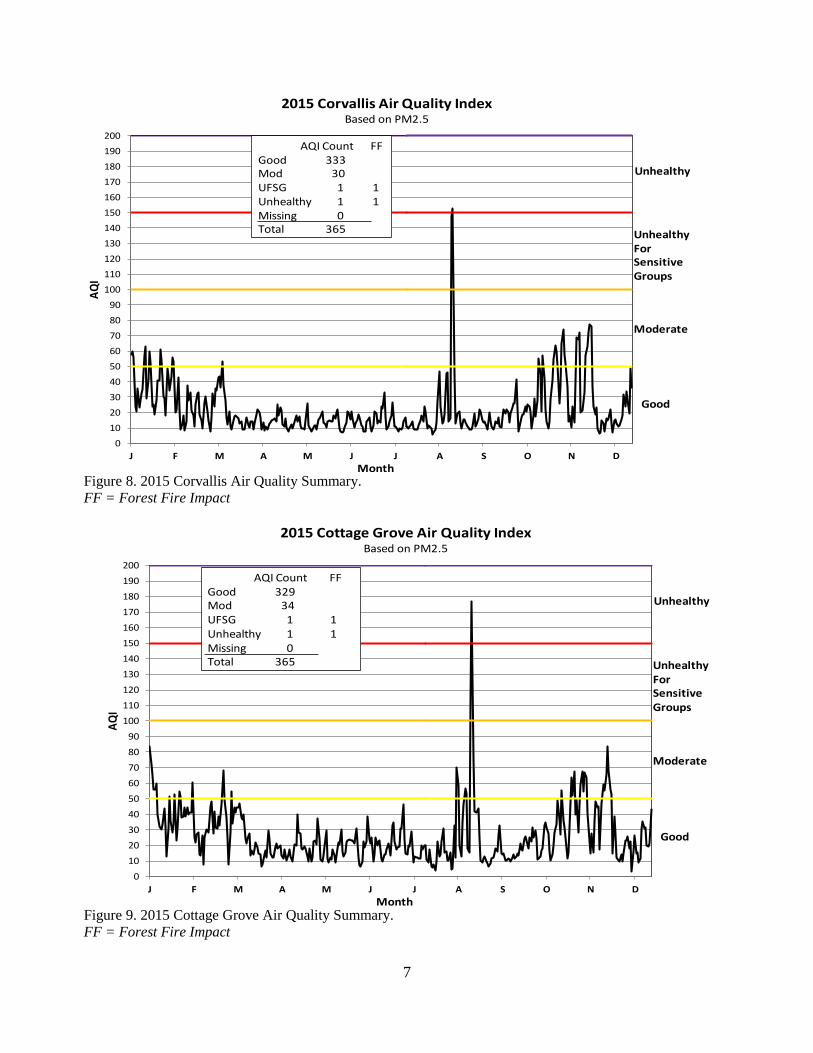
Figure 8. 2015 Corvallis Air Quality Summary. ........................................................................................... 7
Figure 9. 2015 Cottage Grove Air Quality Summary. .................................................................................. 7
Figure 10. 2015 Cove Summer Air Quality Summary. ................................................................................ 8
Figure 11. 2015 Enterprise Air Quality Summary. ....................................................................................... 8
Figure 12. 2015 Eugene/Springfield Air Quality Summary. ........................................................................ 9
Figure 13. 2015 Grants Pass Air Quality Summary. ..................................................................................... 9
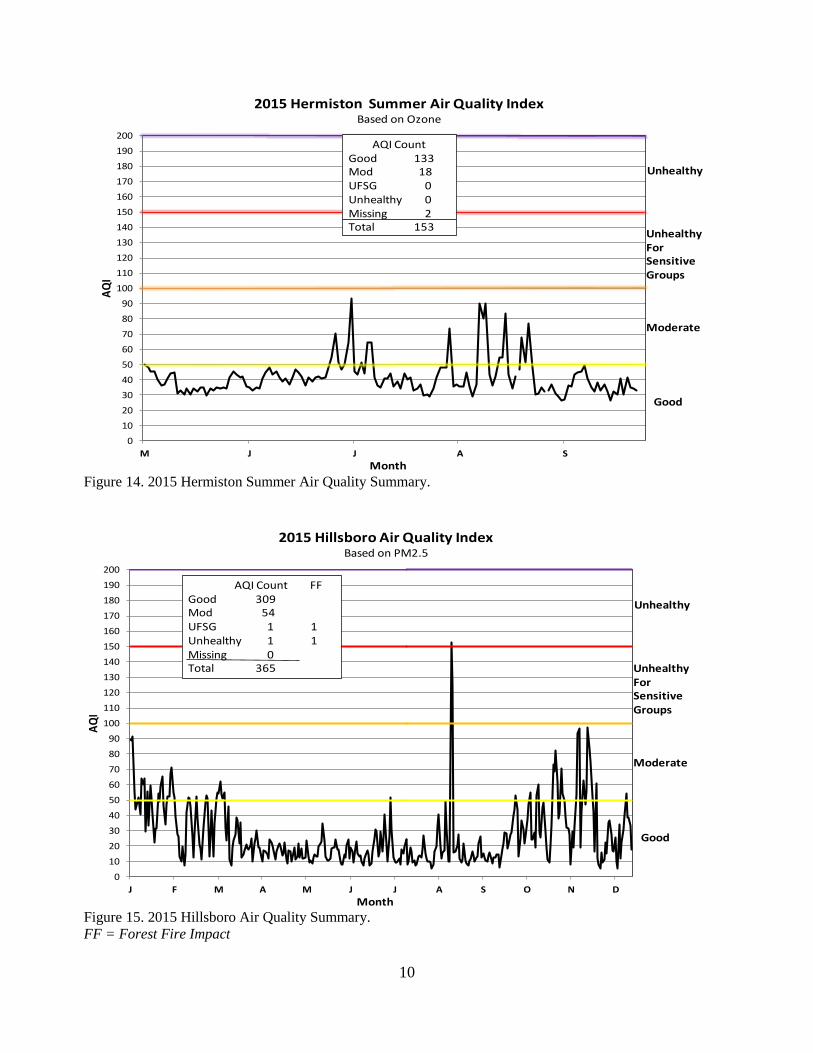
Figure 14. 2015 Hermiston Summer Air Quality Summary. ...................................................................... 10
Figure 15. 2015 Hillsboro Air Quality Summary. ...................................................................................... 10
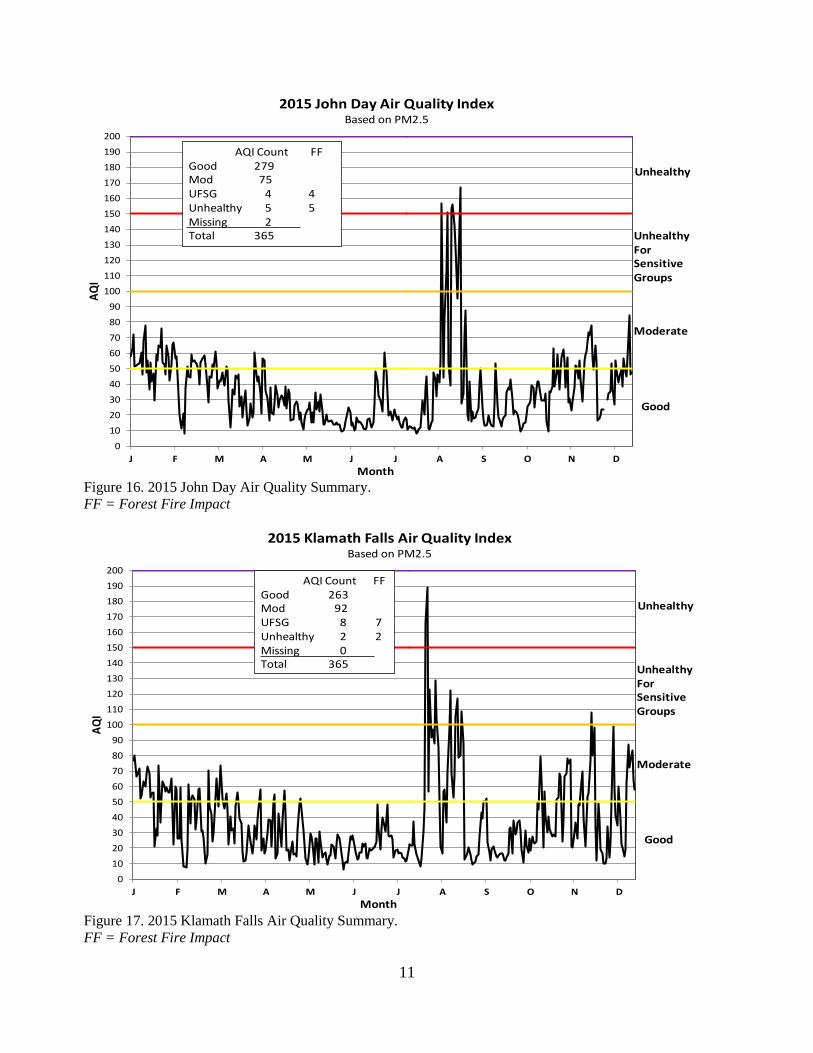
Figure 16. 2015 John Day Air Quality Summary. ...................................................................................... 11
Figure 17. 2015 Klamath Falls Air Quality Summary. ............................................................................... 11
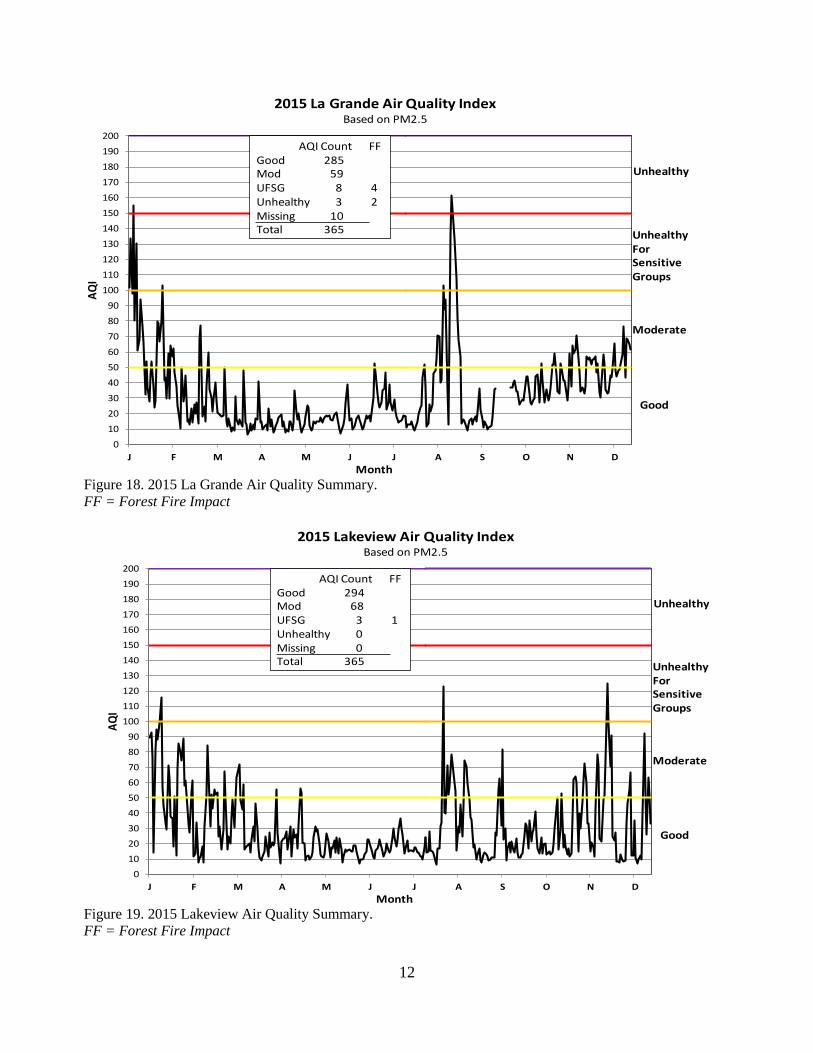
Figure 18. 2015 La Grande Air Quality Summary. .................................................................................... 12
Figure 19. 2015 Lakeview Air Quality Summary. ...................................................................................... 12
Figure 20. 2015 Lyons Summer Air Quality Summary. ............................................................................. 13
Figure 21. 2015 Madras Summer Air Quality Summary. ........................................................................... 13
Figure 22. 2015 Medford Air Quality Summary. ....................................................................................... 14
Figure 23. 2015 Oakridge Air Quality Summary........................................................................................ 14
Figure 24. 2015 Pendleton Air Quality Summary. ..................................................................................... 15
Figure 25. 2015 Portland Air Quality Summary. ........................................................................................ 15
Figure 26. 2015 Prineville Air Quality Summary. ...................................................................................... 16
Figure 27. 2015 Roseburg Air Quality Summary. ...................................................................................... 16
Figure 28. 2015 Salem Air Quality Summary. ........................................................................................... 17
Figure 29. 2015 Shady Cove Air Quality Summary. .................................................................................. 17
Figure 30. 2015 Silverton Summer Air Quality Summary. ........................................................................ 18
Figure 31. 2015 Sisters Air Quality Summary. ........................................................................................... 18
Figure 32. 2015 Sweet Home Air Quality Summary. ................................................................................. 19
Figure 33. 2015 The Dalles Air Quality Summary. .................................................................................... 19
Figure 34. 2015 Crater Lake Summer Air Quality Summary. .................................................................... 20
Figure 35. 2014 Eagle Cap Wilderness Summer Air Quality Summary. ................................................... 20
Figure 36. 2015 Mt. Hood Summer Air Quality Summary. ....................................................................... 21
Figure 37. Ozone trend. .............................................................................................................................. 22
Figure 38. Willamette Valley ozone trends ................................................................................................ 23
Figure 39. Southwest and Eastern Oregon ozone trends............................................................................. 23
Figure 40. 2015 Ozone Levels .................................................................................................................... 24
Figure 41. Albany PM2.5 trends ................................................................................................................. 24
Figure 42. Baker City PM2.5 trends ........................................................................................................... 25
Figure 43. Bend PM2.5 trends .................................................................................................................... 25
Figure 44. Burns PM2.5 trend. .................................................................................................................... 26
Figure 45. Cave Junction PM2.5 trend. ...................................................................................................... 26
Figure 46. Corvallis PM2.5 trend................................................................................................................ 27
Figure 47. Cottage Grove PM2.5 trends. .................................................................................................... 27
Figure 48. Enterprise PM2.5 trends. ........................................................................................................... 28
Figure 49. Eugene/Springfield PM2.5 trends. ............................................................................................. 28
iii
Figure 50. Grants Pass PM2.5 trends. ......................................................................................................... 29
Figure 51. John Day PM2.5 trends. ............................................................................................................ 29
Figure 52. Klamath Falls PM2.5 trends. ..................................................................................................... 30
Figure 53. Lakeview PM2.5 trends. ............................................................................................................ 30
Figure 54. La Grande PM2.5 trends. ........................................................................................................... 31
Figure 55. Medford PM2.5 trends. .............................................................................................................. 31
Figure 56. Oakridge PM2.5 trends. ............................................................................................................. 32
Figure 57. Pendleton PM2.5 trends. ............................................................................................................ 32
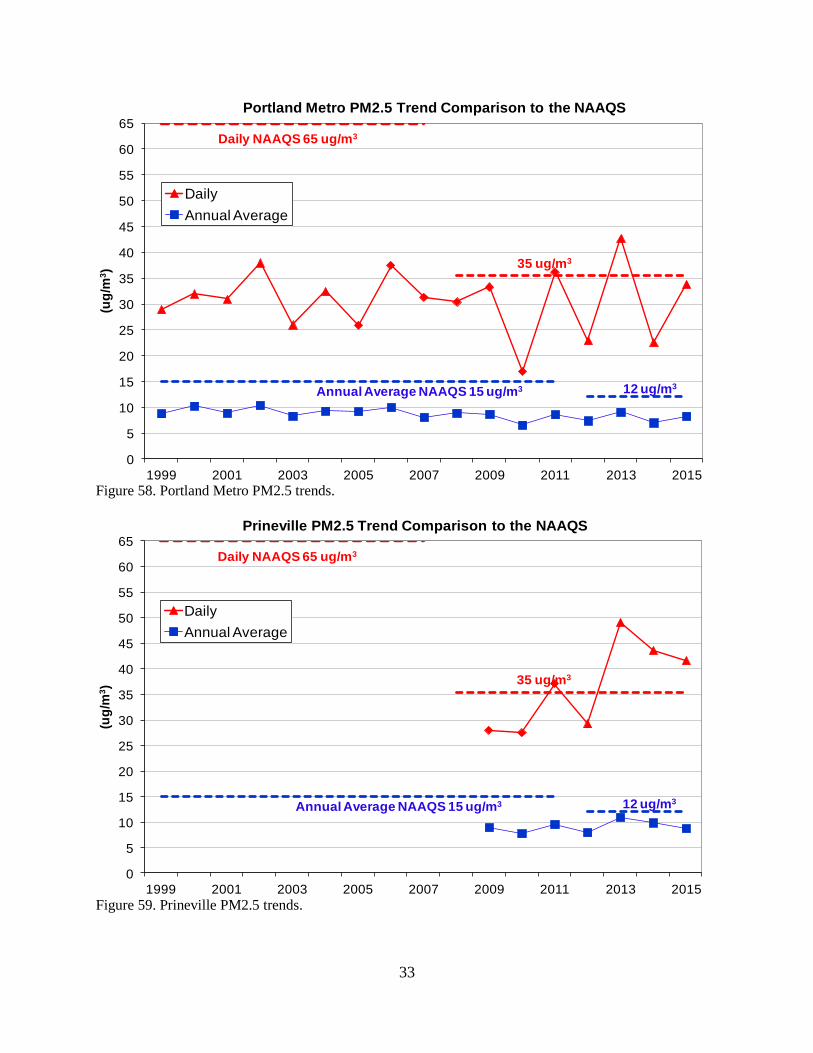
Figure 58. Portland Metro PM2.5 trends. ................................................................................................... 33
Figure 59. Prineville PM2.5 trends. ............................................................................................................ 33
Figure 60. Roseburg PM2.5 trends. ............................................................................................................ 34
Figure 61. Salem PM2.5 trends. .................................................................................................................. 34
Figure 62. Sisters PM2.5 trends. ................................................................................................................. 35
Figure 63. Sweet Home PM2.5 trends. ....................................................................................................... 35
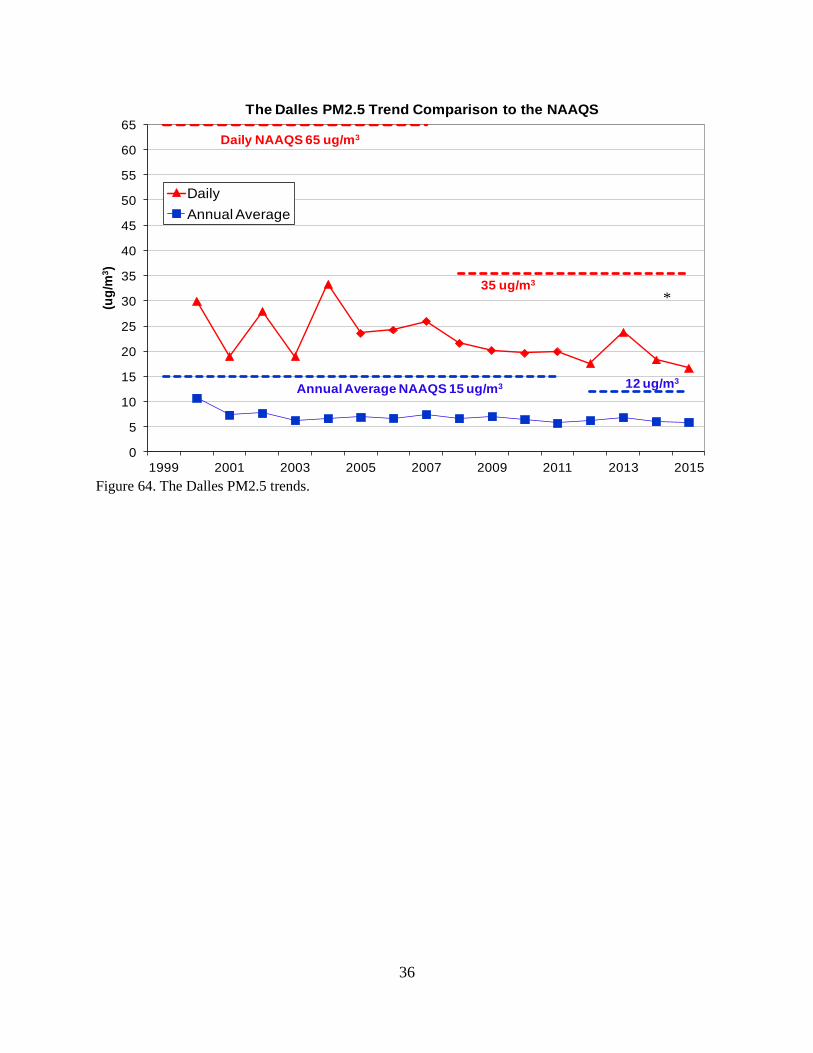
Figure 64. The Dalles PM2.5 trends. .......................................................................................................... 36
Figure 65. Oregon cities 2013-2015 daily PM2.5 comparison. .................................................................. 37
Figure 66. Oregon cities 2013-2015 annual average PM2.5 comparison. .................................................. 37
Figure 67. PM10 trends ............................................................................................................................... 38
Figure 68. Carbon monoxide Trend. ........................................................................................................... 38
Figure 69. Sulfur dioxide one hour average trends. .................................................................................... 39
Figure 70. Nitrogen dioxide one hour and annual average trends. ............................................................. 39
Figure 71. Benzene trends for Oregon cities. .............................................................................................. 40
Figure 72. Acetaldehyde trends for Oregon cities. ..................................................................................... 41
Figure 73. PM10 Arsenic trends for Oregon cities...................................................................................... 41
Figure 74. PM10 Cadmium trends for Oregon cities. ................................................................................. 42
Figure 75. PM10 Lead trends for Oregon cities. ......................................................................................... 42
Figure 76. PM10 Manganese trends for Oregon cities. .............................................................................. 43
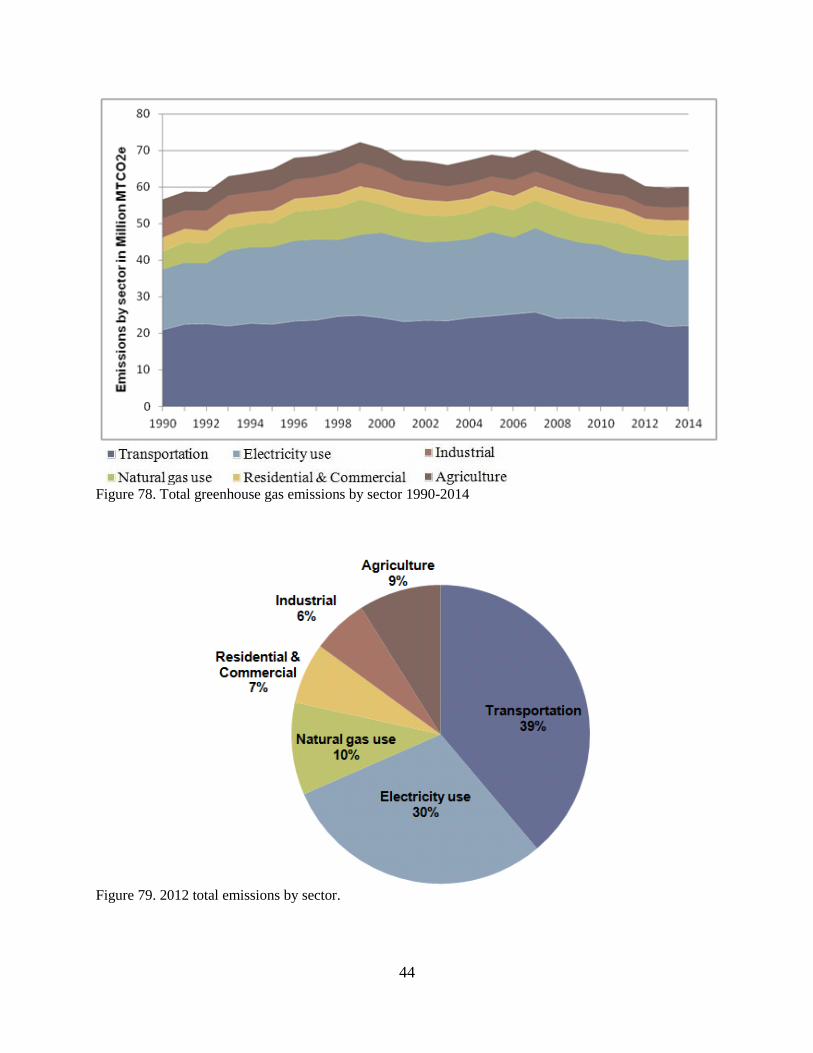
Figure 77. Oregon’s total greenhouse gas emissions 1990-2014 ............................................................... 43
Figure 78. Total greenhouse gas emissions by sector 1990-2014 ............................................................... 44
Figure 79. 2012 total emissions by sector. .................................................................................................. 44
Figure 80. 2014 Ambient Air Monitoring Network. ................................................................................... 75

iv
Glossary of Air Quality Terms used in this report:
AQI – Air Quality Index – standardized EPA method of reporting air quality BScat – Beta Scattering - a light scattering unit used for visibility CO – Carbon monoxide – An odorless, colorless gaseous pollutant CO2 – Carbon dioxide – Primary greenhouse gas CO2e - Carbon dioxide equivalent – Way to compare other GHG to CO2 FF - Forest Fire GHG – Greenhouse Gas HAPs – Hazardous Air Pollutant as defined in Title III of the Clean Air Act MMTCO2e - Million metric tons of carbon dioxide equivalent NAAQS – National Ambient Air Quality Standards – federal air quality standards NO – Nitrogen oxide NO2 – Nitrogen dioxide - a reddish-brown gaseous pollutant. NOx – Nitrogen oxides – reddish brown gaseous pollutant - mainly NO and NO2 O3 – Ozone – a gaseous pollutant and a component of smog at ground level PM2.5 – Particulate Matter 2.5 micrometers in diameter and smaller PM10 - Particulate Matter 10 micrometers in diameter and smaller ppm – Parts per million - air pollutant concentration. ppb – Parts per billion - air pollutant concentration. SO2 – Sulfur dioxide - a colorless, pungent gaseous pollutant. SOx – Sulfur oxides - mainly SO2 UFSG – Unhealthy For Sensitive Groups – an AQI air quality category μg/m3 – Microgram per meters cubed - air pollutant concentration VOC – Volatile Organic Compounds WAQR – Wildfire Air Quality Rating - wildfire smoke health internet page Standard Exceedance – Occur when the NAAQS is surpassed. Standard Violation – The NAAQS provides a cushion which allows for a few exceedances every
year. (e.g. the ozone NAAQS is compared to the 4th highest day of the year. So a city can have three exceedances without a violation.)
Non-Attainment - An area is non-attainment if its three year average violates the NAAQS and EPA formally declares it non-attainment.
Published by the Department of Environmental Quality, July 2016
1
Air Quality Annual Report
DEQ’s Mission Statement The Department of Environmental Quality’s (DEQ) mission is to be a leader in restoring, maintaining and
enhancing the quality of Oregon's air, land and water.
The air pollutants of greatest concern in Oregon are: Fine particulate matter (mostly from wood smoke, other combustion sources, cars and dust) known as
PM2.5 (2.5 micrometers and smaller diameter)
Air Toxics
Ground-level ozone, commonly known as smog
Greenhouse gas (GHG) emissions and global climate change are also concerns in Oregon. DEQ
tracks GHG emissions from a wide variety of products, services, utilities, and fuel providers. These
emissions data are available at: http://www.deq.state.or.us/aq/climate/reporting and
http://www.oregon.gov/DEQ/AQ/Pages/Greenhouse-Gas-Inventory-Report
In 2013 the Oregon Global Warming Commission summarized the status of Oregon’s greenhouse gas
emissions and progress toward meeting the state’s reduction goals. This information is available at:
www.keeporegoncool.org/view/ogwc-reports
Oregon’s 2015 Ambient Air Quality in Summary: PM2.5 exceeded the health standard for at least one day in most communities because of either
forest fire smoke or woodstove smoke during winter time inversions. Oakridge remains a non-
attainment area. Klamath Falls is now below the standard and is working to become a maintenance
area. Lakeview, Prineville, and Medford are in danger of becoming non-attainment areas the next
time EPA reviews the designations.
Smoke from forest fires drastically impacted communities in Oregon starting in June and going
through September. Smoke from fires impacted communities on both sides of the Cascades
including areas like Portland and Salem which usually escape impact from fires. These fires
produced smoke which caused unhealthy health conditions.
Air toxics, such as benzene and acetaldehyde, remain near or above the health benchmarks. The
health benchmarks are concentration levels at which, if exposed over a lifetime, an individual’s risk
of getting cancer is increased by one in a million. Elevated air toxics metals were discovered near
some art glass and metal production facilities and resulted in new regulations for air toxics.
The ozone (smog) levels did not violate the federal health standard in any community.
Carbon monoxide, nitrogen dioxide, sulfur dioxide and PM10 are far below the
criteria pollutant federal health standard. The pollutants have been trending down for some time.
2
Air Quality Index The Air Quality Index (AQI) is a health index which converts concentrations into health levels. The AQI
is updated hourly at EPA’s www.AIRNow.Gov and on DEQ’s and Lane Regional Air Protection Agency
(LRAPA)’s websites. The AQI uses index numbers, health levels, and colors to communicate the health
levels (Table 1).
Table 1 Air Quality Index Health Category Descriptors.
How the AQI is computed The AQI is computed hourly for PM2.5 and ozone. EPA provides all states with the AQI equation for
national uniformity. The AQI is reported by DEQ and Lane County Regional Air Protection Authority
(LRAPA) for various cities in Oregon.
Table 2. Air Quality Index Ranges and Episode Stages.
AIR QUALITY INDEX, (AQI) and Episode Stage Episode
Stage Within Standard > Standard Alert Warning Emergency Significant
Harm
AQI range
0-50 51-100 101-150 151-200 201-300 301-400 401-500p
AQI Descriptor
Good Moderate Unhealthy For
Sensitive Groups
Unhealthy Very Unhealthy
Hazardous Very Hazardous
PM2.5
g/m3
(24hr aver)
0-15.4 15.5-35.4 35.5-55.4 55.5-140.4 140.5-210.4
210.5-500.4
na
Ozone ppm (8-hr aver)
0.000-0.059
0.060-0.075
0.076-0.095 0.096-0.115
0.116-0.374
375 to 599 >600
2hr aver.
Update in 2016
0.000-0.054
0.055-0.070
0.071-0.085 0.086-0.105
0.106-0.200
201 to 599 >600
2hr aver
Air Quality AQI Health Advisory
Good 0-50 No health impacts expected .
Moderate 51-100
Unusually sensitive people should consider reducing prolonged or heavy outdoor exertion.
Unhealthy for
Sensitive Groups
101-150
People with heart disease, respiratory disease (such as asthma), older adults, and children should reduce prolonged or heavy exertion. Active healthy adults should also limit prolong outdoor exertion.
Unhealthy 151-200
People with heart disease, respiratory disease (such as asthma), older adults, and children should avoid prolonged or heavy outdoor exertion. Everyone else should reduce prolonged or heavy outdoor exertion.
Very Unhealthy
(Alert)
201-300
People with heart disease, respiratory disease (such as asthma), older adults, and children should avoid all physical activity outdoors. Everyone else should avoid prolonged or heavy exertion.

3
2015 Oregon Air Quality Index by City The AQI provides a review of the health levels over the past year. The Figures below display the AQI
health levels over the past year for all the areas where ODEQ and LRAPA monitor air quality. Note: A
summary of all the AQI days are shown in Appendix G.
Table 3. Figure Key for 2015 Air Quality Index.
Figure City or Area Figure City or Area Figure City or Area
1 Albany 14 Hermiston 27 Roseburg
2 Appelgate Valley 15 Hillsboro 28 Salem
3 Baker City 16 John Day 29 Shady Cove
4 Beaverton 17 Klamath Falls 30 Silverton
5 Bend 18 La Grande 31 Sisters
6 Burns 19 Lakeview 32 Sweet Home
7 Cave Junction 20 Lyons 33 The Dalles
8 Corvallis 21 Madras 34 Crater Lake
9 Cottage Grove 22 Medford 35 Eagle Cap Wilderness
10 Cove 23 Oakridge 36 Mt. Hood Wilderness
11 Enterprise 24 Pendleton
12 Eugene/Springfield 25 Portland
13 Grants Pass 26 Prineville
Figure 1. 2015 Albany Air Quality Summary.
FF = Forest Fire Impact
0
10
20
30
40
50
60
70
80
90
100
110
120
130
140
150
160
170
180
190
200
J F M A M J J A S O N D
AQ
I
Month
2015 Albany Air Quality IndexBased on PM2.5
AQI Count FFGood 305Mod 43 UFSG 2 Unhealthy 3 2Missing 12Total 365 Unhealthy
For SensitiveGroups
Good
Moderate
Unhealthy
4
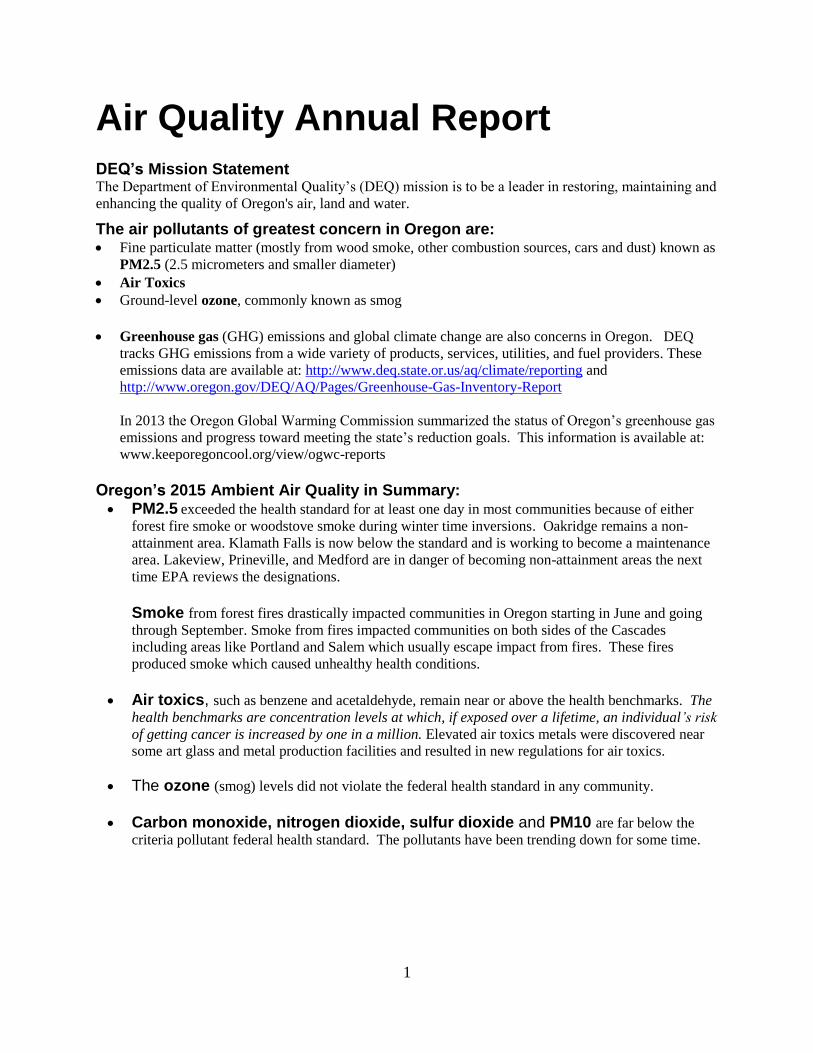
Figure 2. 2015 Applegate Valley Air Quality Summary.
FF = Forest Fire Impact
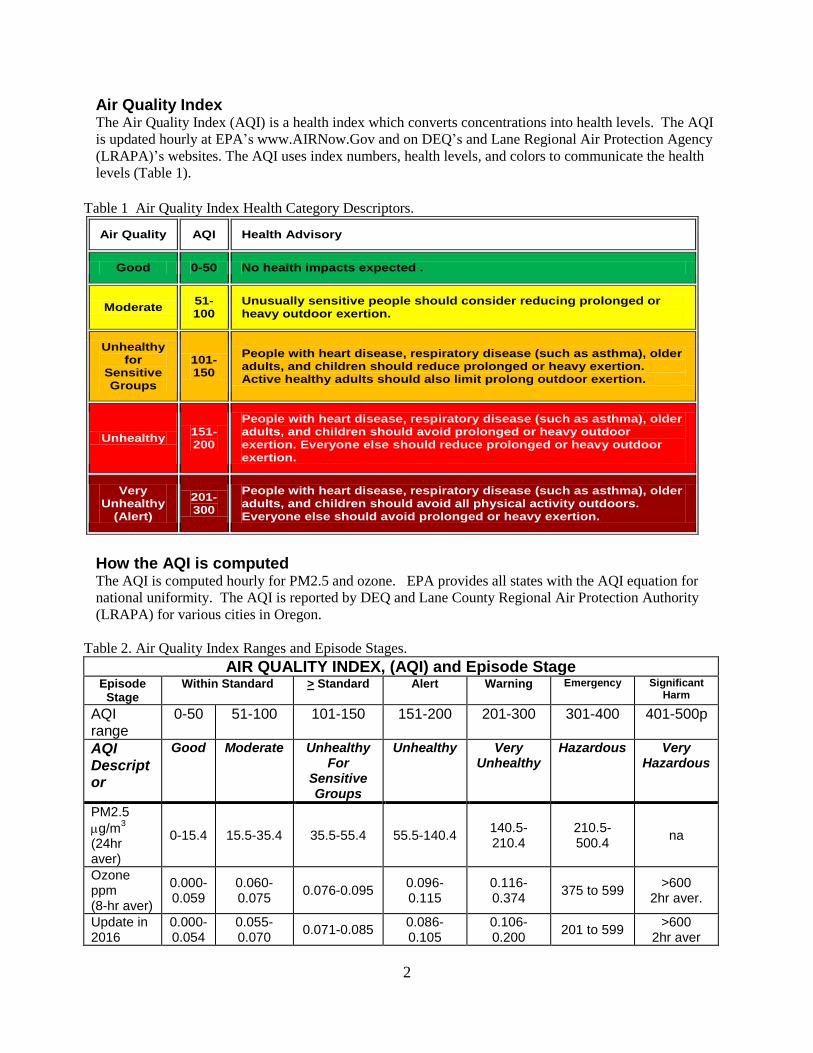
Figure 3. 2015 Baker City Air Quality Summary.
FF = Forest Fire Impact
0
10
20
30
40
50
60
70
80
90
100
110
120
130
140
150
160
170
180
190
200
J F M A M J J A S O N D
AQ
I
Month
2015 Applegate Valley Air Quality IndexBased on PM2.5
AQI Count FFGood 330Mod 27 UFSG 3 3Unhealthy 2 2Missing 3Total 365 Unhealthy
For SensitiveGroups
Good
Moderate
Unhealthy
0
10
20
30
40
50
60
70
80
90
100
110
120
130
140
150
160
170
180
190
200
J F M A M J J A S O N D
AQ
I
Month
2015 Baker City Air Quality IndexBased on PM2.5
AQI Count FFGood 326Mod 29 UFSG 8 8Unhealthy 2 2Missing 0Total 365 Unhealthy
For SensitiveGroups
Good
Moderate
Unhealthy

5
Figure 4. 2015 Beaverton Air Quality Summary.
FF = Forest Fire Impact
Figure 5. 2015 Bend Air Quality Summary.
FF = Forest Fire Impact
0
10
20
30
40
50
60
70
80
90
100
110
120
130
140
150
160
170
180
190
200
J F M A M J J A S O N D
AQ
I
Month
2015 Beaverton Air Quality IndexBased on PM2.5
AQI Count FFGood 338Mod 24 UFSG 1 1Unhealthy 1 1Missing 1Total 365 Unhealthy
For SensitiveGroups
Good
Moderate
Unhealthy
0
10
20
30
40
50
60
70
80
90
100
110
120
130
140
150
160
170
180
190
200
J F M A M J J A S O N D
AQ
I
Month
2015 Bend Air Quality IndexBased on PM2.5and Ozone
Good
Moderate
Unhealthy
UnhealthyFor SensitiveGroups
AQI CountTotal PM2.5 Ozone FF
Good 329 335 144 Mod 33 27 9UFSG 2 2 0 2 Unhealthy 1 1 0 1Missing 0 0 0 Total 365 365 153
Ozone Monitoring Season
6
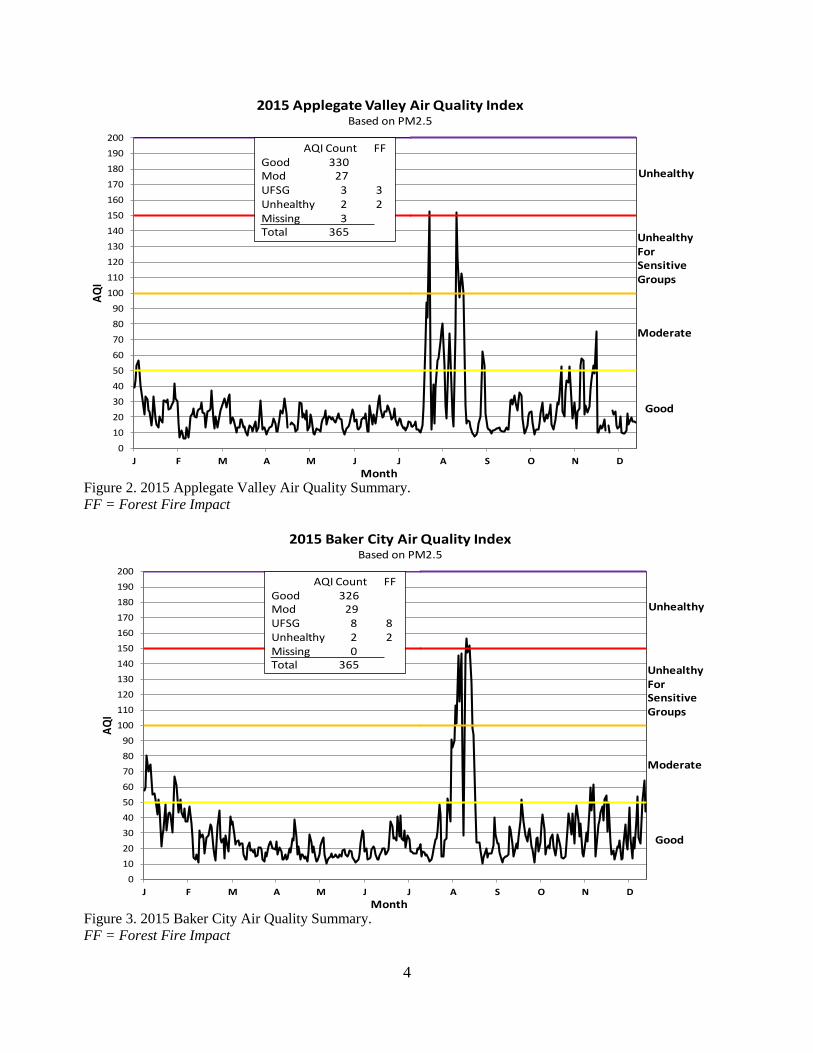
Figure 6. 2015 Burns/Hines Air Quality Summary.
FF = Forest Fire Impact
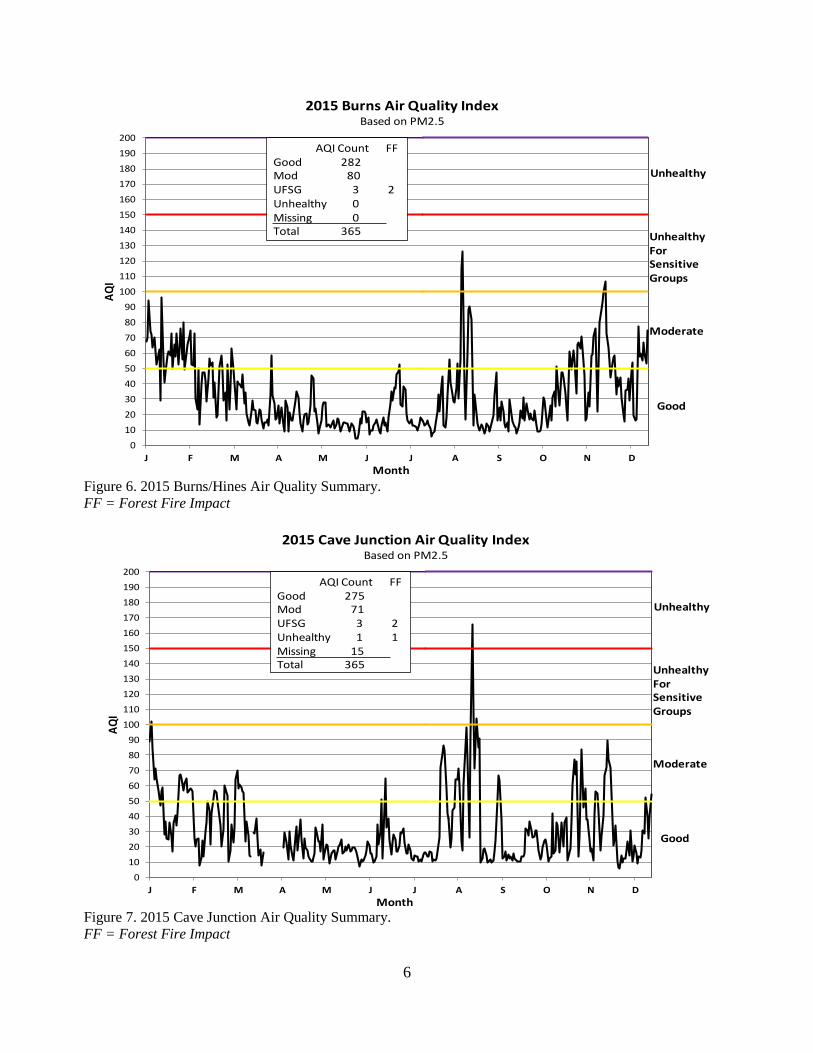
Figure 7. 2015 Cave Junction Air Quality Summary.
FF = Forest Fire Impact
0
10
20
30
40
50
60
70
80
90
100
110
120
130
140
150
160
170
180
190
200
J F M A M J J A S O N D
AQ
I
Month
2015 Burns Air Quality IndexBased on PM2.5
AQI Count FFGood 282Mod 80 UFSG 3 2Unhealthy 0 Missing 0Total 365 Unhealthy
For SensitiveGroups
Good
Moderate
Unhealthy
0
10
20
30
40
50
60
70
80
90
100
110
120
130
140
150
160
170
180
190
200
J F M A M J J A S O N D
AQ
I
Month
2015 Cave Junction Air Quality IndexBased on PM2.5
AQI Count FFGood 275Mod 71 UFSG 3 2Unhealthy 1 1Missing 15Total 365 Unhealthy
For SensitiveGroups
Good
Moderate
Unhealthy
7
Figure 8. 2015 Corvallis Air Quality Summary.
FF = Forest Fire Impact
Figure 9. 2015 Cottage Grove Air Quality Summary.
FF = Forest Fire Impact
0
10
20
30
40
50
60
70
80
90
100
110
120
130
140
150
160
170
180
190
200
J F M A M J J A S O N D
AQ
I
Month
2015 Corvallis Air Quality IndexBased on PM2.5
AQI Count FFGood 333Mod 30 UFSG 1 1Unhealthy 1 1Missing 0Total 365 Unhealthy
For SensitiveGroups
Good
Moderate
Unhealthy
0
10
20
30
40
50
60
70
80
90
100
110
120
130
140
150
160
170
180
190
200
J F M A M J J A S O N D
AQ
I
Month
2015 Cottage Grove Air Quality IndexBased on PM2.5
AQI Count FF Good 329Mod 34 UFSG 1 1Unhealthy 1 1Missing 0Total 365 Unhealthy
For SensitiveGroups
Good
Moderate
Unhealthy

8
Figure 10. 2015 Cove Summer Air Quality Summary.
FF = Forest Fire Impact
Figure 11. 2015 Enterprise Air Quality Summary.
FF = Forest Fire Impact
0
10
20
30
40
50
60
70
80
90
100
110
120
130
140
150
160
170
180
190
200
J A S
AQ
I
Month
2015 Cove Summer Air Quality IndexBased on PM2.5
AQI Count FF Good 63Mod 15 UFSG 2 2Unhealthy 4 4Missing 14Total 98 Unhealthy
For SensitiveGroups
Good
Moderate
Unhealthy
0
10
20
30
40
50
60
70
80
90
100
110
120
130
140
150
160
170
180
190
200
J F M A M J J A S O N D
AQ
I
Month
2015 Enterprise Air Quality IndexBased on PM2.5
AQI Count FFGood 322Mod 34 UFSG 3 3Unhealthy 5 5Missing 1Total 365 Unhealthy
For SensitiveGroups
Good
Moderate
Unhealthy

9
Figure 12. 2015 Eugene/Springfield Air Quality Summary.
FF = Forest Fire Impact
Figure 13. 2015 Grants Pass Air Quality Summary.
FF = Forest Fire Impact
0
10
20
30
40
50
60
70
80
90
100
110
120
130
140
150
160
170
180
190
200
J F M A M J J A S O N D
AQ
I
Month
2015 Eugene-Springfield Air Quality IndexBased on PM2.5and Ozone
AQI CountTotal PM2.5 Ozone FF
Good 282 284 151 Mod 77 75 2UFSG 4 4 0Unhealthy 2 2 0 2Missing 0 0 0 Total 365 365 153
Good
Moderate
Unhealthy
UnhealthyFor SensitiveGroups
Ozone Monitoring Season
0
10
20
30
40
50
60
70
80
90
100
110
120
130
140
150
160
170
180
190
200
J F M A M J J A S O N D
AQ
I
Month
2015 Grants Pass Air Quality IndexBased on PM2.5
AQI Count FFGood 307Mod 55 UFSG 2 2Unhealthy 1 1Missing 0Total 365 Unhealthy
For SensitiveGroups
Good
Moderate
Unhealthy
10
Figure 14. 2015 Hermiston Summer Air Quality Summary.
Figure 15. 2015 Hillsboro Air Quality Summary.
FF = Forest Fire Impact
0
10
20
30
40
50
60
70
80
90
100
110
120
130
140
150
160
170
180
190
200
M J J A S
AQ
I
Month
2015 Hermiston Summer Air Quality IndexBased on Ozone
AQI CountGood 133Mod 18UFSG 0Unhealthy 0Missing 2Total 153
UnhealthyFor SensitiveGroups
Good
Moderate
Unhealthy
0
10
20
30
40
50
60
70
80
90
100
110
120
130
140
150
160
170
180
190
200
J F M A M J J A S O N D
AQ
I
Month
2015 Hillsboro Air Quality IndexBased on PM2.5
AQI Count FF Good 309Mod 54 UFSG 1 1Unhealthy 1 1Missing 0Total 365 Unhealthy
For SensitiveGroups
Good
Moderate
Unhealthy
11
Figure 16. 2015 John Day Air Quality Summary.
FF = Forest Fire Impact
Figure 17. 2015 Klamath Falls Air Quality Summary.
FF = Forest Fire Impact
0
10
20
30
40
50
60
70
80
90
100
110
120
130
140
150
160
170
180
190
200
J F M A M J J A S O N D
AQ
I
Month
2015 John Day Air Quality IndexBased on PM2.5
AQI Count FF Good 279Mod 75 UFSG 4 4Unhealthy 5 5Missing 2Total 365 Unhealthy
For SensitiveGroups
Good
Moderate
Unhealthy
0
10
20
30
40
50
60
70
80
90
100
110
120
130
140
150
160
170
180
190
200
J F M A M J J A S O N D
AQ
I
Month
2015 Klamath Falls Air Quality IndexBased on PM2.5
AQI Count FFGood 263Mod 92 UFSG 8 7Unhealthy 2 2Missing 0Total 365 Unhealthy
For SensitiveGroups
Good
Moderate
Unhealthy
12
Figure 18. 2015 La Grande Air Quality Summary.
FF = Forest Fire Impact
Figure 19. 2015 Lakeview Air Quality Summary.
FF = Forest Fire Impact
0
10
20
30
40
50
60
70
80
90
100
110
120
130
140
150
160
170
180
190
200
J F M A M J J A S O N D
AQ
I
Month
2015 La Grande Air Quality IndexBased on PM2.5
AQI Count FFGood 285Mod 59 UFSG 8 4Unhealthy 3 2Missing 10Total 365 Unhealthy
For SensitiveGroups
Good
Moderate
Unhealthy
0
10
20
30
40
50
60
70
80
90
100
110
120
130
140
150
160
170
180
190
200
J F M A M J J A S O N D
AQ
I
Month
2015 Lakeview Air Quality IndexBased on PM2.5
AQI Count FFGood 294Mod 68 UFSG 3 1Unhealthy 0 Missing 0Total 365 Unhealthy
For SensitiveGroups
Good
Moderate
Unhealthy
13
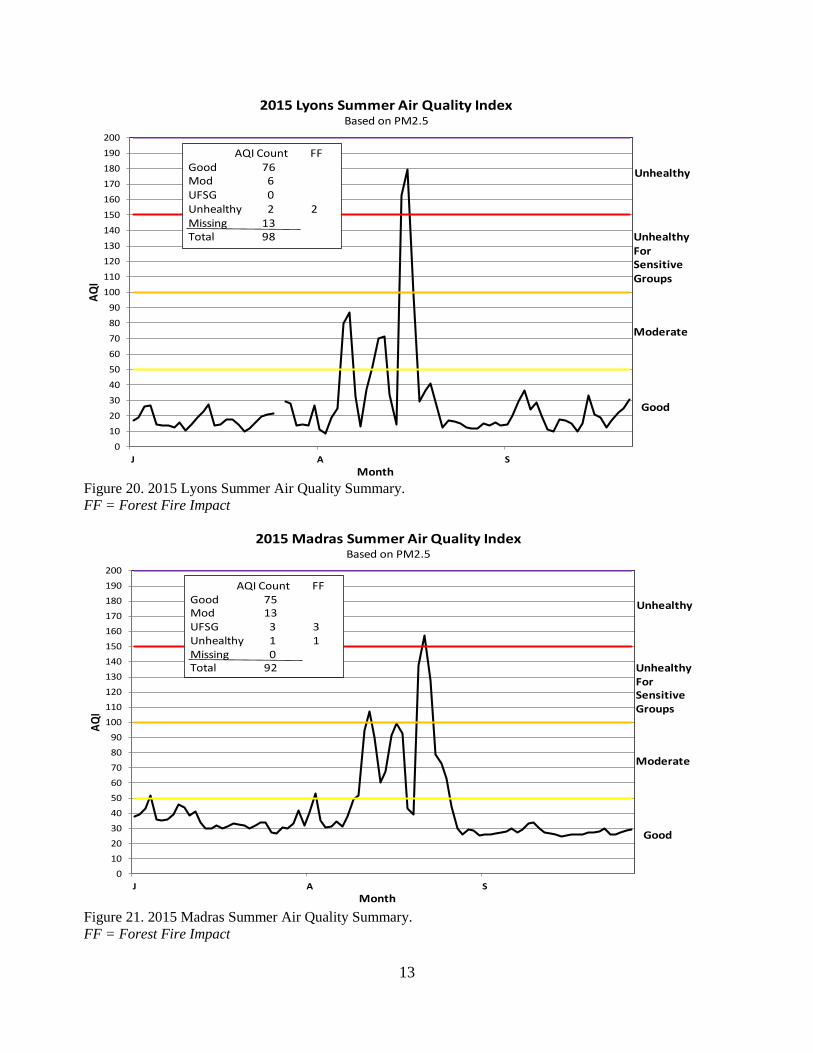
Figure 20. 2015 Lyons Summer Air Quality Summary.
FF = Forest Fire Impact
Figure 21. 2015 Madras Summer Air Quality Summary.
FF = Forest Fire Impact
0
10
20
30
40
50
60
70
80
90
100
110
120
130
140
150
160
170
180
190
200
J A S
AQ
I
Month
2015 Lyons Summer Air Quality IndexBased on PM2.5
AQI Count FF Good 76Mod 6 UFSG 0 Unhealthy 2 2Missing 13Total 98 Unhealthy
For SensitiveGroups
Good
Moderate
Unhealthy
0
10
20
30
40
50
60
70
80
90
100
110
120
130
140
150
160
170
180
190
200
J A S
AQ
I
Month
2015 Madras Summer Air Quality IndexBased on PM2.5
AQI Count FF Good 75Mod 13 UFSG 3 3Unhealthy 1 1Missing 0Total 92 Unhealthy
For SensitiveGroups
Good
Moderate
Unhealthy
14
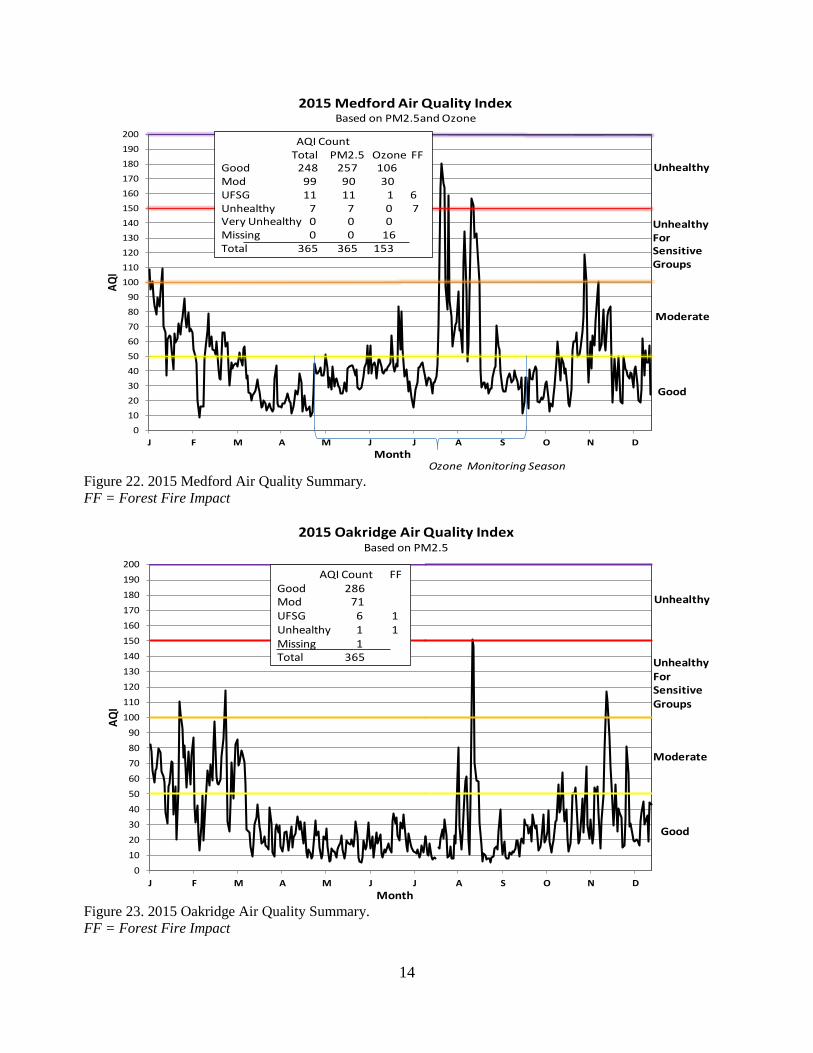
Figure 22. 2015 Medford Air Quality Summary.
FF = Forest Fire Impact
Figure 23. 2015 Oakridge Air Quality Summary.
FF = Forest Fire Impact
0
10
20
30
40
50
60
70
80
90
100
110
120
130
140
150
160
170
180
190
200
J F M A M J J A S O N D
AQ
I
Month
2015 Medford Air Quality IndexBased on PM2.5and Ozone
AQI CountTotal PM2.5 Ozone FF
Good 248 257 106 Mod 99 90 30 UFSG 11 11 1 6 Unhealthy 7 7 0 7Very Unhealthy 0 0 0 Missing 0 0 16 Total 365 365 153
Good
Moderate
Unhealthy
UnhealthyFor SensitiveGroups
Ozone Monitoring Season
0
10
20
30
40
50
60
70
80
90
100
110
120
130
140
150
160
170
180
190
200
J F M A M J J A S O N D
AQ
I
Month
2015 Oakridge Air Quality IndexBased on PM2.5
AQI Count FFGood 286Mod 71 UFSG 6 1Unhealthy 1 1Missing 1Total 365 Unhealthy
For SensitiveGroups
Good
Moderate
Unhealthy

15
Figure 24. 2015 Pendleton Air Quality Summary.
FF = Forest Fire Impact
Figure 25. 2015 Portland Air Quality Summary.
FF = Forest Fire Impact
0
10
20
30
40
50
60
70
80
90
100
110
120
130
140
150
160
170
180
190
200
J F M A M J J A S O N D
AQ
I
Month
2015 Pendleton Air Quality IndexBased on PM2.5
AQI Count FFGood 312Mod 47 UFSG 2 2Unhealthy 2 2Missing 2Total 365 Unhealthy
For SensitiveGroups
Good
Moderate
Unhealthy
0
10
20
30
40
50
60
70
80
90
100
110
120
130
140
150
160
170
180
190
200
J F M A M J J A S O N D
AQ
I
Month
2015 Portland Air Quality IndexBased on PM2.5and Ozone
AQI CountTotal PM2.5 Ozone FF
Good 305 317 149 Mod 58 46 4UFSG 0 0 0Unhealthy 2 2 0 2Missing 0 0 0 Total 365 365 153
Good
Moderate
Unhealthy
UnhealthyFor SensitiveGroups

16
Figure 26. 2015 Prineville Air Quality Summary.
FF = Forest Fire Impact
Figure 27. 2015 Roseburg Air Quality Summary.
FF = Forest Fire Impact
0
10
20
30
40
50
60
70
80
90
100
110
120
130
140
150
160
170
180
190
200
J F M A M J J A S O N D
AQ
I
Month
2015 Prineville Air Quality IndexBased on PM2.5
AQI Count FFGood 290Mod 63 UFSG 6 3Unhealthy 2 2Missing 4Total 365 Unhealthy
For SensitiveGroups
Good
Moderate
Unhealthy
0
10
20
30
40
50
60
70
80
90
100
110
120
130
140
150
160
170
180
190
200
J F M A M J J A S O N D
AQ
I
Month
2015 Roseburg Air Quality IndexBased on PM2.5
AQI Count FFGood 326Mod 35 UFSG 1 1Unhealthy 0 Missing 3Total 365 Unhealthy
For SensitiveGroups
Good
Moderate
Unhealthy

17
Figure 28. 2015 Salem Air Quality Summary.
FF = Forest Fire Impact
Figure 29. 2015 Shady Cove Air Quality Summary.
FF = Forest Fire Impact
0
10
20
30
40
50
60
70
80
90
100
110
120
130
140
150
160
170
180
190
200
J F M A M J J A S O N D
AQ
I
Month
2015 Salem Air Quality IndexBased on PM2.5and Ozone
AQI CountTotal PM2.5 Ozone FF
Good 311 320 144 Mod 51 43 8UFSG 1 0 1 Unhealthy 2 2 0 2Missing 0 0 0 Total 365 365 153
Good
Moderate
Unhealthy
UnhealthyFor SensitiveGroups
Ozone Monitoring Season
0
10
20
30
40
50
60
70
80
90
100
110
120
130
140
150
160
170
180
190
200
J F M A M J J A S O N D
AQ
I
Month
2015 Shady Cove Air Quality IndexBased on PM2.5
AQI Count FFGood 333Mod 15 UFSG 9 9Unhealthy 6 6 Very Unhealthy 1 1Hazardous 1 1Missing 0Total 365
UnhealthyFor SensitiveGroups
Good
Moderate
Unhealthy
18
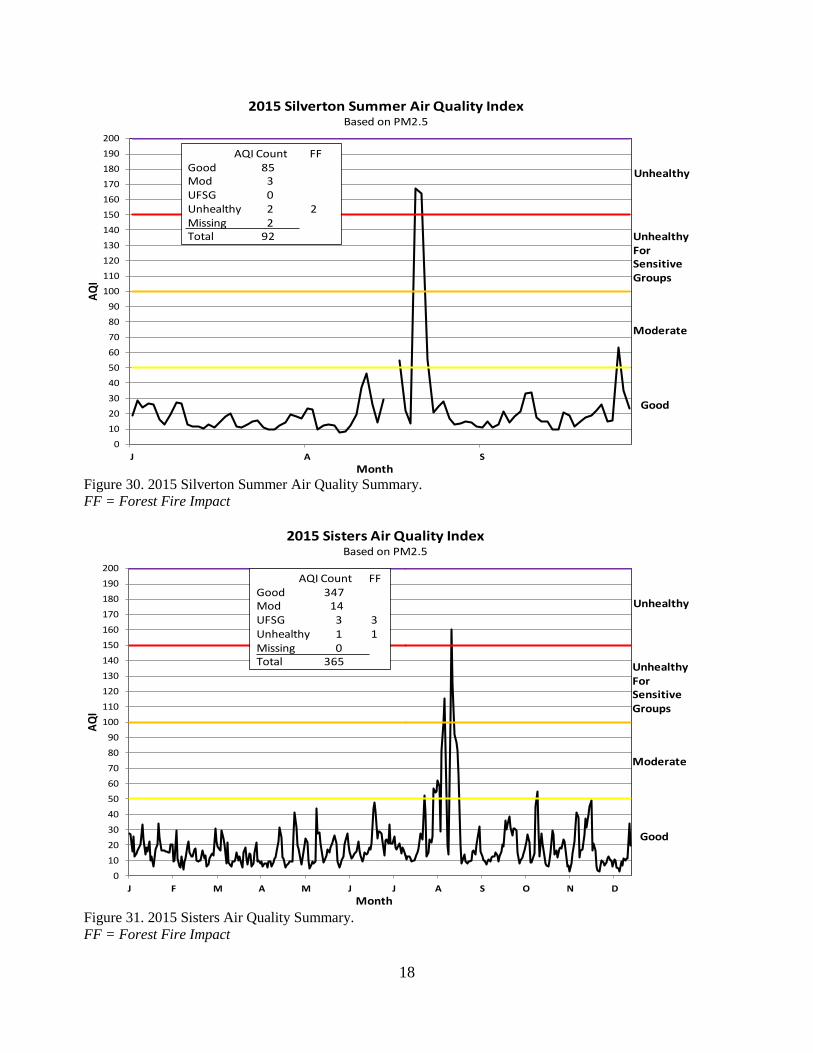
Figure 30. 2015 Silverton Summer Air Quality Summary.
FF = Forest Fire Impact
Figure 31. 2015 Sisters Air Quality Summary.
FF = Forest Fire Impact
0
10
20
30
40
50
60
70
80
90
100
110
120
130
140
150
160
170
180
190
200
J A S
AQ
I
Month
2015 Silverton Summer Air Quality IndexBased on PM2.5
AQI Count FF Good 85Mod 3 UFSG 0 Unhealthy 2 2Missing 2Total 92 Unhealthy
For SensitiveGroups
Good
Moderate
Unhealthy
0
10
20
30
40
50
60
70
80
90
100
110
120
130
140
150
160
170
180
190
200
J F M A M J J A S O N D
AQ
I
Month
2015 Sisters Air Quality IndexBased on PM2.5
AQI Count FFGood 347Mod 14 UFSG 3 3Unhealthy 1 1Missing 0Total 365 Unhealthy
For SensitiveGroups
Good
Moderate
Unhealthy

19
Figure 32. 2015 Sweet Home Air Quality Summary.
FF = Forest Fire Impact
Figure 33. 2015 The Dalles Air Quality Summary.
FF = Forest Fire Impact
0
10
20
30
40
50
60
70
80
90
100
110
120
130
140
150
160
170
180
190
200
J F M A M J J A S O N D
AQ
I
Month
2015 Sweet Home Air Quality IndexBased on PM2.5
AQI Count FFGood 332Mod 31 UFSG 0 Unhealthy 2 2Missing 0Total 365 Unhealthy
For SensitiveGroups
Good
Moderate
Unhealthy
0
10
20
30
40
50
60
70
80
90
100
110
120
130
140
150
160
170
180
190
200
J F M A M J J A S O N D
AQ
I
Month
2015 The Dalles Air Quality IndexBased on PM2.5
AQI Count FFGood 326Mod 30 UFSG 0 Unhealthy 2 2Missing 7Total 365 Unhealthy
For SensitiveGroups
Good
Moderate
Unhealthy
20
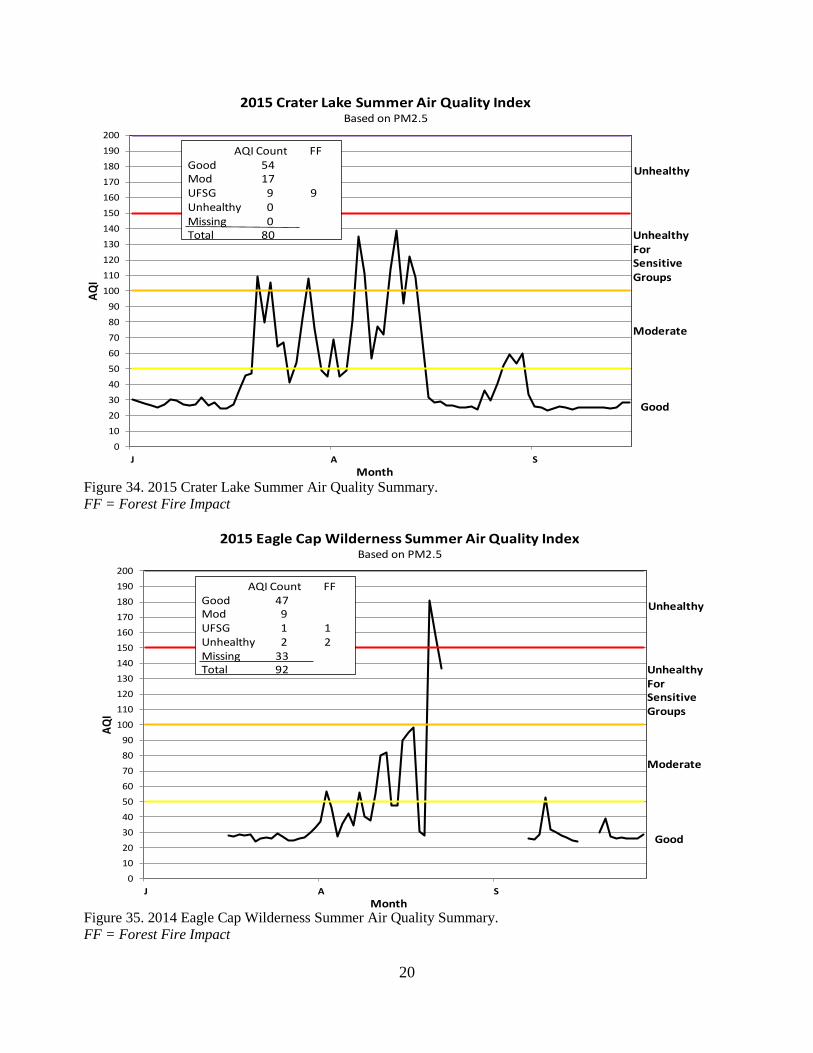
Figure 34. 2015 Crater Lake Summer Air Quality Summary.
FF = Forest Fire Impact
Figure 35. 2014 Eagle Cap Wilderness Summer Air Quality Summary.
FF = Forest Fire Impact
0
10
20
30
40
50
60
70
80
90
100
110
120
130
140
150
160
170
180
190
200
J A S
AQ
I
Month
2015 Crater Lake Summer Air Quality IndexBased on PM2.5
AQI Count FF Good 54Mod 17 UFSG 9 9Unhealthy 0 Missing 0Total 80 Unhealthy
For SensitiveGroups
Good
Moderate
Unhealthy
0
10
20
30
40
50
60
70
80
90
100
110
120
130
140
150
160
170
180
190
200
J A S
AQ
I
Month
2015 Eagle Cap Wilderness Summer Air Quality IndexBased on PM2.5
AQI Count FF Good 47Mod 9 UFSG 1 1Unhealthy 2 2Missing 33Total 92 Unhealthy
For SensitiveGroups
Good
Moderate
Unhealthy
21
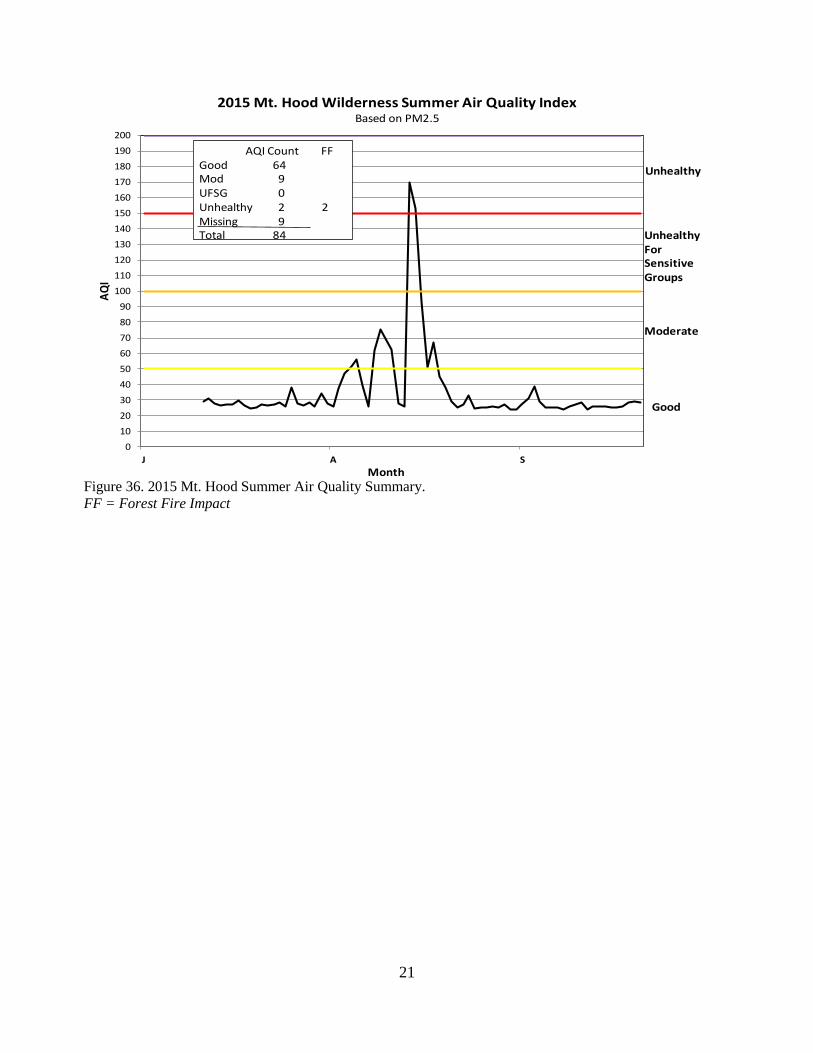
Figure 36. 2015 Mt. Hood Summer Air Quality Summary.
FF = Forest Fire Impact
0
10
20
30
40
50
60
70
80
90
100
110
120
130
140
150
160
170
180
190
200
J A S
AQ
I
Month
2015 Mt. Hood Wilderness Summer Air Quality IndexBased on PM2.5
AQI Count FF Good 64Mod 9 UFSG 0 Unhealthy 2 2Missing 9Total 84 Unhealthy
For SensitiveGroups
Good
Moderate
Unhealthy
22
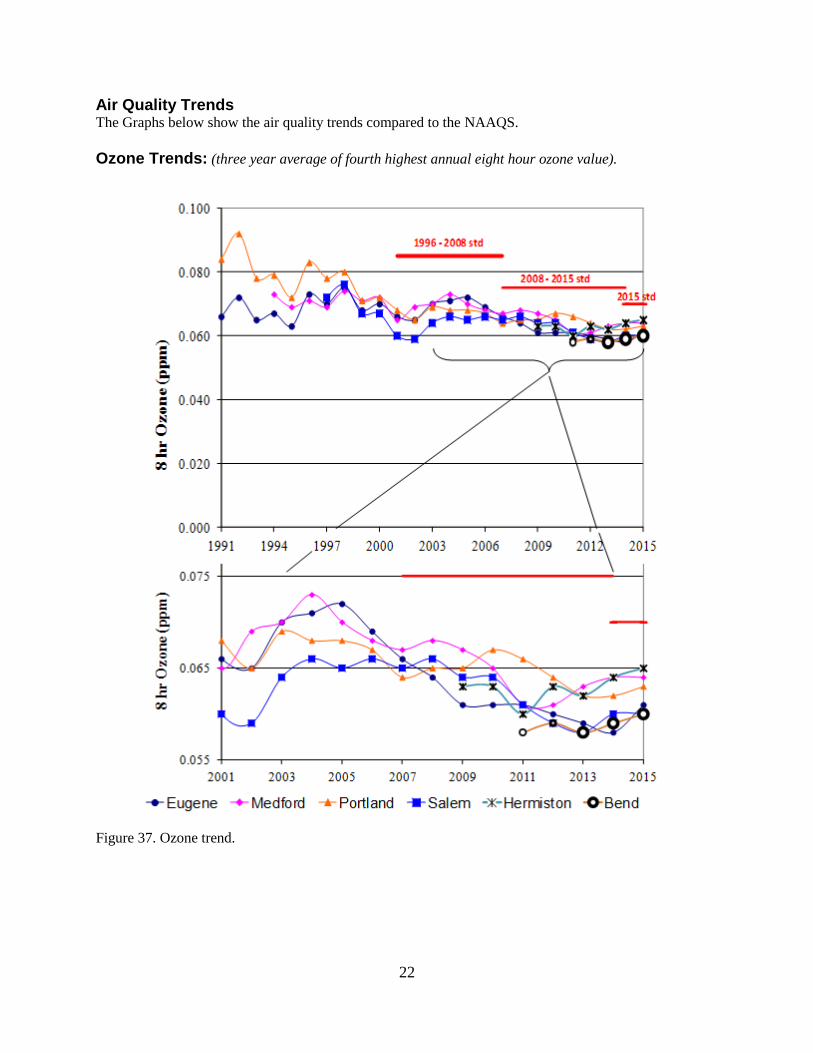
Air Quality Trends The Graphs below show the air quality trends compared to the NAAQS.
Ozone Trends: (three year average of fourth highest annual eight hour ozone value).
Figure 37. Ozone trend.
23
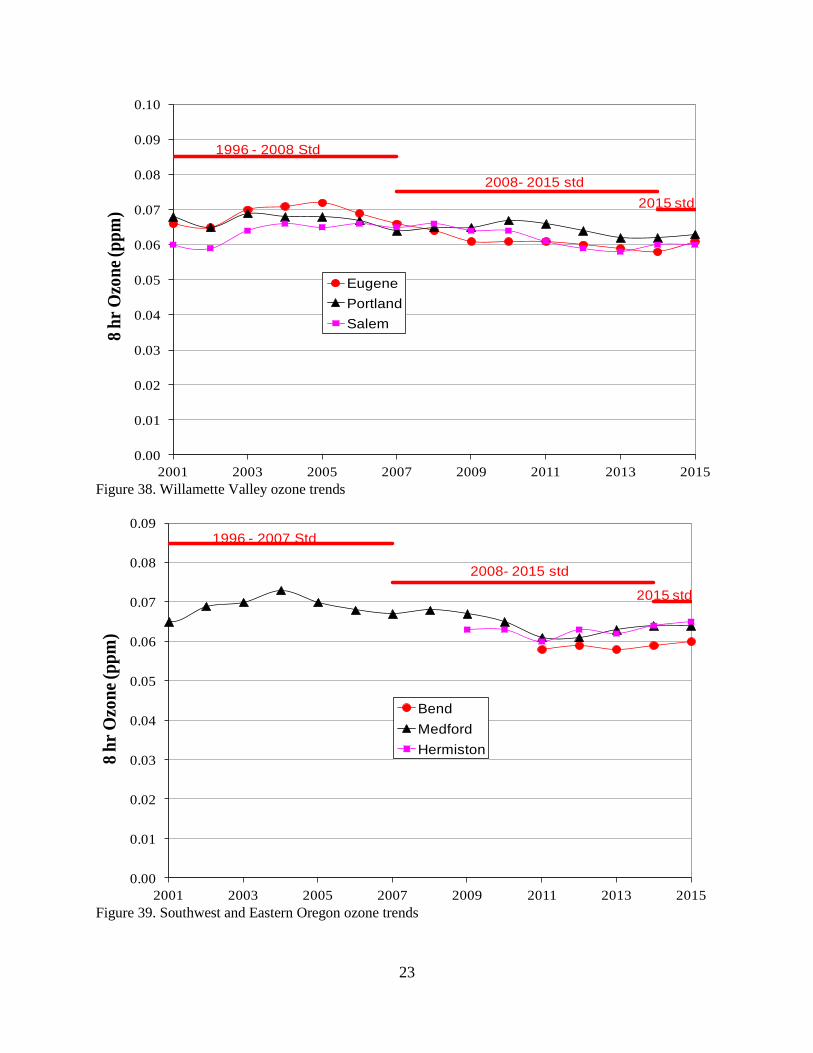
Figure 38. Willamette Valley ozone trends
Figure 39. Southwest and Eastern Oregon ozone trends
0.00
0.01
0.02
0.03
0.04
0.05
0.06
0.07
0.08
0.09
0.10
2001 2003 2005 2007 2009 2011 2013 2015
8 h
r O
zon
e (p
pm
)
Eugene
Portland
Salem
2008- 2015 std
1996 - 2008 Std
2015 std
0.00
0.01
0.02
0.03
0.04
0.05
0.06
0.07
0.08
0.09
2001 2003 2005 2007 2009 2011 2013 2015
8 h
r O
zon
e (p
pm
)
Bend
Medford
Hermiston
1996 - 2007 Std
2008- 2015 std
2015 std

24
Figure 40. 2015 Ozone Levels
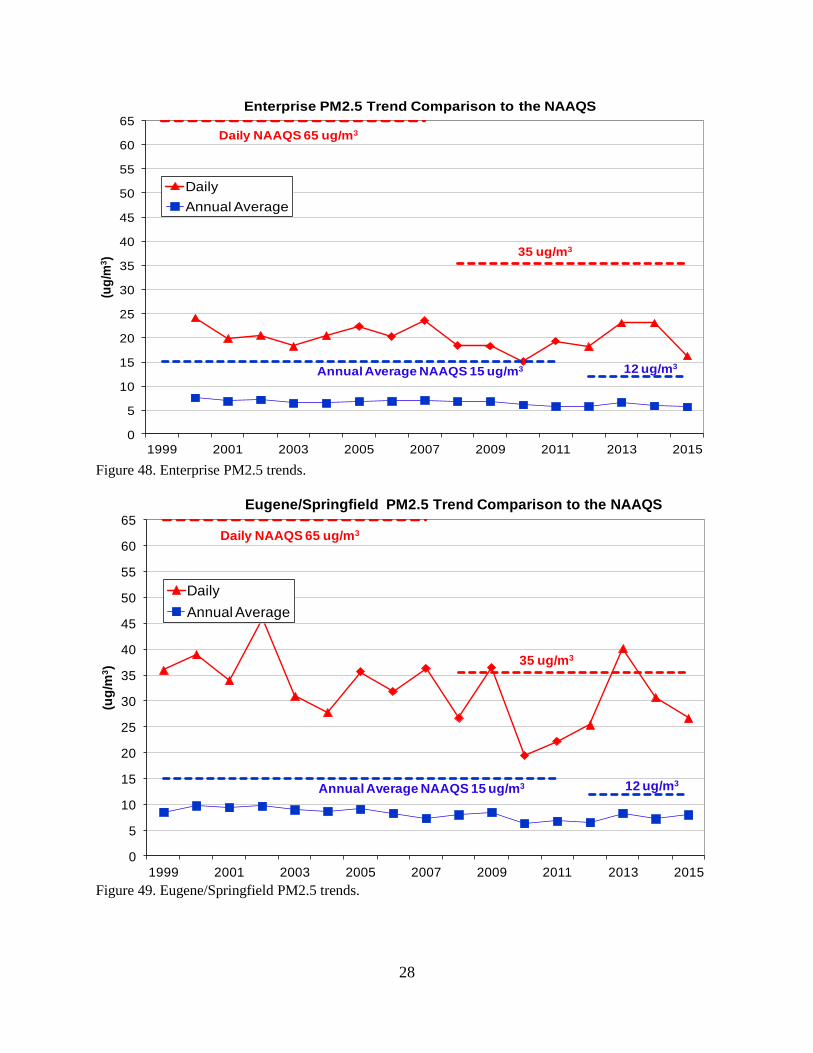
PM2.5 Trends: The charts below show the trends for the 98th percentile and annual average PM2.5. The 98th Percentile
is used for comparison to the daily standard. Forest Fire data was removed for daily standard comparison.
Figure 41. Albany PM2.5 trends
60 6165 64 63
60
0
5
10
15
20
25
30
35
40
45
50
55
60
65
70
75
Bend Eugene Hermiston Medford Portland Salem
part
per
bill
ion
Ozone Levels in Oregon 2013-2015
Three Year Average of Fourth Highest Eight Hour Average
EPA Standard
0
5
10
15
20
25
30
35
40
45
50
55
60
65
1999 2001 2003 2005 2007 2009 2011 2013 2015
(ug
/m3)
Albany PM2.5 Trend Comparison to the NAAQS
Daily
Annual Average
35 ug/m3
Annual Average NAAQS 15 ug/m3
Daily NAAQS 65 ug/m3
12 ug/m3

25
Figure 42. Baker City PM2.5 trends
Figure 43. Bend PM2.5 trends
0
5
10
15
20
25
30
35
40
45
50
55
60
65
1999 2001 2003 2005 2007 2009 2011 2013 2015
(ug
/m3)
Baker City PM2.5 Trend Comparison to the NAAQS
Daily
Annual Average
35 ug/m3
Annual Average NAAQS 15 ug/m3
Daily NAAQS 65 ug/m3
12 ug/m3
FF
0
5
10
15
20
25
30
35
40
45
50
55
60
65
1999 2001 2003 2005 2007 2009 2011 2013 2015
(ug
/m3)
Bend PM2.5 Trend Comparison to the NAAQS
Daily
Annual Average
35 ug/m3
Annual Average NAAQS 15 ug/m3
Daily NAAQS 65 ug/m3
12 ug/m3

26
Figure 44. Burns PM2.5 trend.
Figure 45. Cave Junction PM2.5 trend.
0
5
10
15
20
25
30
35
40
45
50
55
60
65
1999 2001 2003 2005 2007 2009 2011 2013 2015
(ug
/m3)
Burns PM2.5 Trend Comparison to the NAAQS
Daily
Annual Average
35 ug/m3
Annual Average NAAQS 15 ug/m3
Daily NAAQS 65 ug/m3
12 ug/m3
0
5
10
15
20
25
30
35
40
45
50
55
60
65
1999 2001 2003 2005 2007 2009 2011 2013 2015
(ug
/m3)
Cave Junction PM2.5 Trend Comparison to the NAAQS
Daily
Annual Average
35 ug/m3
Annual Average NAAQS 15 ug/m3
Daily NAAQS 65 ug/m3
12 ug/m3

27
Figure 46. Corvallis PM2.5 trend.
Figure 47. Cottage Grove PM2.5 trends.
0
5
10
15
20
25
30
35
40
45
50
55
60
65
1999 2001 2003 2005 2007 2009 2011 2013 2015
(ug
/m3)
Corvallis PM2.5 Trend Comparison to the NAAQS
Daily
Annual Average
35 ug/m3
Annual Average NAAQS 15 ug/m3
Daily NAAQS 65 ug/m3
12 ug/m3
0
5
10
15
20
25
30
35
40
45
50
55
60
65
1999 2001 2003 2005 2007 2009 2011 2013 2015
(ug
/m3)
Cottage Grove PM2.5 Trend Comparison to the NAAQS
Daily
Annual Average
35 ug/m3
Annual Average NAAQS 15 ug/m3
Daily NAAQS 65 ug/m3
12 ug/m3
28
Figure 48. Enterprise PM2.5 trends.
Figure 49. Eugene/Springfield PM2.5 trends.
0
5
10
15
20
25
30
35
40
45
50
55
60
65
1999 2001 2003 2005 2007 2009 2011 2013 2015
(ug
/m3)
Enterprise PM2.5 Trend Comparison to the NAAQS
Daily
Annual Average
35 ug/m3
Annual Average NAAQS 15 ug/m3
Daily NAAQS 65 ug/m3
12 ug/m3
0
5
10
15
20
25
30
35
40
45
50
55
60
65
1999 2001 2003 2005 2007 2009 2011 2013 2015
(ug
/m3)
Eugene/Springfield PM2.5 Trend Comparison to the NAAQS
Daily
Annual Average
35 ug/m3
Annual Average NAAQS 15 ug/m3
Daily NAAQS 65 ug/m3
12 ug/m3

29
Figure 50. Grants Pass PM2.5 trends.
Figure 51. John Day PM2.5 trends.
0
5
10
15
20
25
30
35
40
45
50
55
60
65
1999 2001 2003 2005 2007 2009 2011 2013 2015
(ug
/m3)
Grants Pass PM2.5 Trend Comparison to the NAAQS
Daily
Annual Average
35 ug/m3
Annual Average NAAQS 15 ug/m3
Daily NAAQS 65 ug/m3
12 ug/m3
0
5
10
15
20
25
30
35
40
45
50
55
60
65
1999 2001 2003 2005 2007 2009 2011 2013 2015
(ug
/m3)
John Day PM2.5 Trend Comparison to the NAAQS
Daily
Annual Average
35 ug/m3
Annual Average NAAQS 15 ug/m3
Daily NAAQS 65 ug/m3
12 ug/m3

30
Figure 52. Klamath Falls PM2.5 trends.
Figure 53. Lakeview PM2.5 trends.
0
5
10
15
20
25
30
35
40
45
50
55
60
65
1999 2001 2003 2005 2007 2009 2011 2013 2015
(ug
/m3)
Klamath Falls PM2.5 Trend Comparison to the NAAQS
Daily
Annual Average
35 ug/m3
Annual Average NAAQS 15 ug/m3
Daily NAAQS 65 ug/m3
12 ug/m3
0
10
20
30
40
50
60
70
80
90
100
1999 2001 2003 2005 2007 2009 2011 2013 2015
(ug
/m3)
Lakeview PM2.5 Trend Comparison to the NAAQS
Daily
Annual Average
35 ug/m3
Annual Average NAAQS 15 ug/m3
Daily NAAQS 65 ug/m3
12 ug/m3

31
Figure 54. La Grande PM2.5 trends.
Figure 55. Medford PM2.5 trends.
0
5
10
15
20
25
30
35
40
45
50
55
60
65
1999 2001 2003 2005 2007 2009 2011 2013 2015
(ug
/m3)
La Grande PM2.5 Trend Comparison to the NAAQS
Daily
Annual Average
35 ug/m3
Annual Average NAAQS 15 ug/m3
Daily NAAQS 65 ug/m3
12 ug/m3
0
5
10
15
20
25
30
35
40
45
50
55
60
65
1999 2001 2003 2005 2007 2009 2011 2013 2015
(ug
/m3)
Medford PM2.5 Trend Comparison to the NAAQS
Daily
Annual Average
35 ug/m3
Annual Average NAAQS 15 ug/m3
Daily NAAQS 65 ug/m3
12 ug/m3

32
Figure 56. Oakridge PM2.5 trends.
Figure 57. Pendleton PM2.5 trends.
0
5
10
15
20
25
30
35
40
45
50
55
60
65
1999 2001 2003 2005 2007 2009 2011 2013 2015
(ug
/m3)
Oakridge PM2.5 Trend Comparison to the NAAQS
Daily
Annual Average
35 ug/m3
Annual Average NAAQS 15 ug/m3
Daily NAAQS 65 ug/m3
12 ug/m3
0
5
10
15
20
25
30
35
40
45
50
55
60
65
1999 2001 2003 2005 2007 2009 2011 2013 2015
(ug
/m3)
Pendleton PM2.5 Trend Comparison to the NAAQS
Daily
Annual Average
35 ug/m3
Annual Average NAAQS 15 ug/m3
Daily NAAQS 65 ug/m3
12 ug/m3
33
Figure 58. Portland Metro PM2.5 trends.
Figure 59. Prineville PM2.5 trends.
0
5
10
15
20
25
30
35
40
45
50
55
60
65
1999 2001 2003 2005 2007 2009 2011 2013 2015
(ug
/m3)
Portland Metro PM2.5 Trend Comparison to the NAAQS
Daily
Annual Average
35 ug/m3
Annual Average NAAQS 15 ug/m3
Daily NAAQS 65 ug/m3
12 ug/m3
0
5
10
15
20
25
30
35
40
45
50
55
60
65
1999 2001 2003 2005 2007 2009 2011 2013 2015
(ug
/m3)
Prineville PM2.5 Trend Comparison to the NAAQS
Daily
Annual Average
35 ug/m3
Annual Average NAAQS 15 ug/m3
Daily NAAQS 65 ug/m3
12 ug/m3

34
Figure 60. Roseburg PM2.5 trends.
Figure 61. Salem PM2.5 trends.
0
5
10
15
20
25
30
35
40
45
50
55
60
65
1999 2001 2003 2005 2007 2009 2011 2013 2015
(ug
/m3)
Roseburg PM2.5 Trend Comparison to the NAAQS
Daily
Annual Average
35 ug/m3
Annual Average NAAQS 15 ug/m3
Daily NAAQS 65 ug/m3
12 ug/m3
0
5
10
15
20
25
30
35
40
45
50
55
60
65
1999 2001 2003 2005 2007 2009 2011 2013 2015
(ug
/m3)
Salem PM2.5 Trend Comparison to the NAAQS
Daily
Annual Average
35 ug/m3
Annual Average NAAQS 15 ug/m3
Daily NAAQS 65 ug/m3
12 ug/m3

35
Figure 62. Sisters PM2.5 trends.
Figure 63. Sweet Home PM2.5 trends.
0
5
10
15
20
25
30
35
40
45
50
55
60
65
1999 2001 2003 2005 2007 2009 2011 2013 2015
(ug
/m3)
Sisters PM2.5 Trend Comparison to the NAAQS
Daily
Annual Average
35 ug/m3
Annual Average NAAQS 15 ug/m3
Daily NAAQS 65 ug/m3
12 ug/m3
0
5
10
15
20
25
30
35
40
45
50
55
60
65
1999 2001 2003 2005 2007 2009 2011 2013 2015
(ug
/m3)
Sweet Home PM2.5 Trend Comparison to the NAAQS
Daily
Annual Average
35 ug/m3
Annual Average NAAQS 15 ug/m3
Daily NAAQS 65 ug/m3
12 ug/m3
36
Figure 64. The Dalles PM2.5 trends.
0
5
10
15
20
25
30
35
40
45
50
55
60
65
1999 2001 2003 2005 2007 2009 2011 2013 2015
(ug
/m3)
The Dalles PM2.5 Trend Comparison to the NAAQS
Daily
Annual Average
35 ug/m3
Annual Average NAAQS 15 ug/m3
Daily NAAQS 65 ug/m3
12 ug/m3
*

37
The figures below show the three year average 98th Percentile PM2.5 levels (daily standard) and the three
year average of the annual average PM2.5 levels (annual standard).
Figure 65. Oregon cities 2013-2015 daily PM2.5 comparison.
The chart shows the three year average 98th percentile. Forest fire data omitted.
Figure 66. Oregon cities 2013-2015 annual average PM2.5 comparison.
The chart shows the three year average of the annual average.
0.00
10
20
30
40
50
60
Th
e D
alle
s
Po
rtlan
d M
etro
Sale
m
Alb
an
y
Co
rva
llis
Sw
eet H
om
e
Eu
gen
e/S
prin
gfie
ld
Oakrid
ge
Co
ttag
e G
rove
Ro
se
bu
rg
Gra
nts
Pass
Med
ford
*
Pen
dle
ton
La G
ran
de
En
terp
rise
Ba
ke
r City
Ben
d
Prin
eville
Jo
hn
Day
Bu
rns
Kla
math
Falls
La
ke
vie
w
ug
/m3
2013-2015 Oregon Cities Compared to the New Daily PM2.5 Standard
PdxMetro
Willamette Valley
Southwest Northeast
Daily Std 35ug/m3
SEEast Central
E
est
Colum
bia Gorge
0
5
10
15
Th
e D
alle
s
Po
rtlan
d M
etro
Sale
m
Alb
an
y
Co
rvallis
Sw
eet H
om
e
Eu
gen
e/S
prin
gfield
Oa
krid
ge
Co
ttag
e G
rov
e
Gra
nts
Pass
Med
ford
Cave J
un
ctio
n
Pe
nd
leto
n
La
Gra
nd
e
En
terp
rise
Ba
ke
r City
Ben
d
Prin
eville
Jo
hn
Day
Bu
rns
Kla
math
Falls
Lakevie
w
ug
/m3
2013-2015 Oregon Cities Compared to the Annual PM2.5 Standard
Willamette Valley
Southwest Northeast
Std 12ug/m3
SEEast Central
Colum
bia Gorge
PdxMetro
38
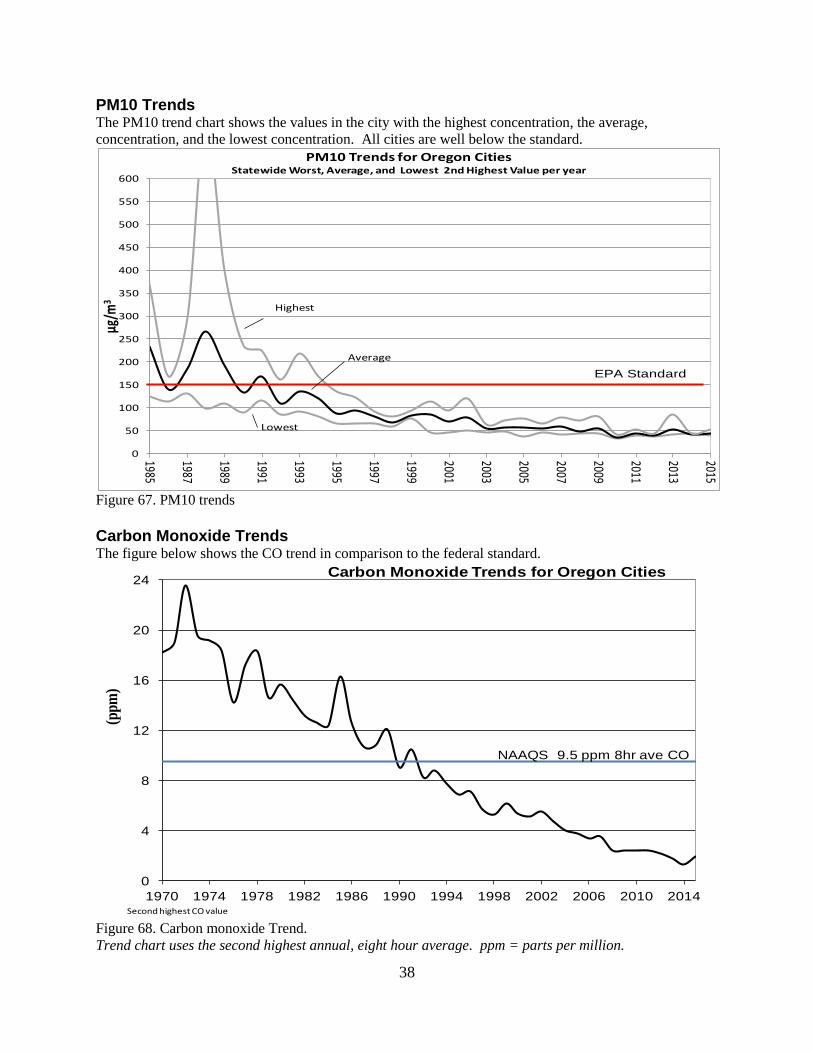
PM10 Trends The PM10 trend chart shows the values in the city with the highest concentration, the average,
concentration, and the lowest concentration. All cities are well below the standard.
Figure 67. PM10 trends
Carbon Monoxide Trends The figure below shows the CO trend in comparison to the federal standard.
Figure 68. Carbon monoxide Trend.
Trend chart uses the second highest annual, eight hour average. ppm = parts per million.
0
50
100
150
200
250
300
350
400
450
500
550
600
1985
1987
1989
1991
1993
1995
1997
1999
2001
2003
2005
2007
2009
2011
2013
2015µg
/m3
PM10 Trends for Oregon Cities Statewide Worst, Average, and Lowest 2nd Highest Value per year
EPA Standard
Highest
Average
Lowest
0
4
8
12
16
20
24
1970 1974 1978 1982 1986 1990 1994 1998 2002 2006 2010 2014
(pp
m)
Carbon Monoxide Trends for Oregon Cities
NAAQS 9.5 ppm 8hr ave CO
Second highest CO value

39
Sulfur Dioxide Trends The figure below shows the SO2 trends in comparison to the federal standard.
Figure 69. Sulfur dioxide one hour average trends.
Nitrogen Dioxide Trends The Figure below shows the NO2 trends in comparison to the federal standard.
Figure 70. Nitrogen dioxide one hour and annual average trends.
ppb = parts per billion
0
25
50
75
2006 2007 2008 2009 2010 2011 2012 2013 2014 2015
PPB
Sulfur Dioxide Trends
Portland
Hermiston
EPA - 1 hr Standard
0
20
40
60
80
100
2008 2009 2010 2011 2012 2013 2014 2015
PPB
Nitrogen Dioxide Trends
Portland
Hermiston
I-5 in Tualitan
Hourly Levels
Annual Average
Hourly Standard
Annual Standard

40
Air Toxics Trends Oregon DEQ and LRAPA began sampling for air toxics in Oregon in 1999. The Figures below show the
trends for some air toxics of concern. More air toxic information can be found in Appendix H. The
values are compared to the Oregon ambient concentration health benchmarks which are the level where
an individual has a risk of one in a million chance of getting cancer when exposed over a life time.
This information does not include the Portland air toxics metals near source data collected in 2016.
Figure 71. Benzene trends for Oregon cities.
0
1
2
2000 2001 2002 2003 2004 2005 2006 2007 2008 2009 2010 2011 2012 2013 2014 2015
µg/m
3
Benzene Trends N. Portland
Salem
Eugene
Eugene Commercial
Medford Residential
Medford Industrial
La Grande
Klamath Falls
Hillsboro
Health Benchmark = 0.13 µg/m3

41
Figure 72. Acetaldehyde trends for Oregon cities.
Figure 73. PM10 Arsenic trends for Oregon cities.
0
1
2
3
4
2000 2001 2002 2003 2004 2005 2006 2007 2008 2009 2010 2011 2012 2013 2014 2015
µg/m
3Acetaldehyde Trends
N. Portland Eugene
Eugene Commercial Salem
Medford Residential Medford Industrial
La Grande Klamath Falls
Hillsboro
Health Benchmark = 0.45 µg/m3
0
1
2
2005 2006 2007 2008 2009 2010 2011 2012 2013 2014 2015
Nan
ogra
ms/
m3
ArsenicTrends (PM10)N. Portland
Eugene
Salem
Medford Residential
Medford Industrial
La Grande
Klamath Falls
Hillsboro
Health Benchmark = 0.2 ng/m3

42
Figure 74. PM10 Cadmium trends for Oregon cities.
Figure 75. PM10 Lead trends for Oregon cities.
0
1
2
3
2004 2005 2006 2007 2008 2009 2010 2011 2012 2013 2014 2015
Nan
ogra
ms/
m3
Cadmium Trends (PM10) N. Portland
Eugene
Salem
Medford Residential
Medford Industrial
La Grande
Klamath Falls
Hillsboro
Health Benchmark = 0.6ng/m3
MDL
0
5
10
15
2005 2006 2007 2008 2009 2010 2011 2012 2013 2014 2015
Nan
ogra
ms/
m3
Lead Trends (PM10)
N. Portland
Salem
Eugene
Medford Residential
Medford Industrial
La Grande
Klamath Falls
Hillsboro
Health Benchmark = 150 ng/m3

43
Figure 76. PM10 Manganese trends for Oregon cities.
Green House Gas Trends Green house gas emissions from 1990 to 2014 are presented on DEQ’s web page at
http://www.oregon.gov/DEQ/AQ/Pages/Greenhouse-Gas-Inventory-Report Some of these trends are
shown in the Figures below.
Figure 77. Oregon’s total greenhouse gas emissions 1990-2014
0
5
10
15
20
2005 2006 2007 2008 2009 2010 2011 2012 2013 2014 2015
Nan
ogra
ms/
m3
Manganese Trends (PM10)
N. Portland
Salem
Eugene
Medford Residential
Medford Industrial
La Grande
Klamath Falls
Hillsboro
Health Benchmark = 90 ng/m3
44
Figure 78. Total greenhouse gas emissions by sector 1990-2014
Figure 79. 2012 total emissions by sector.
45
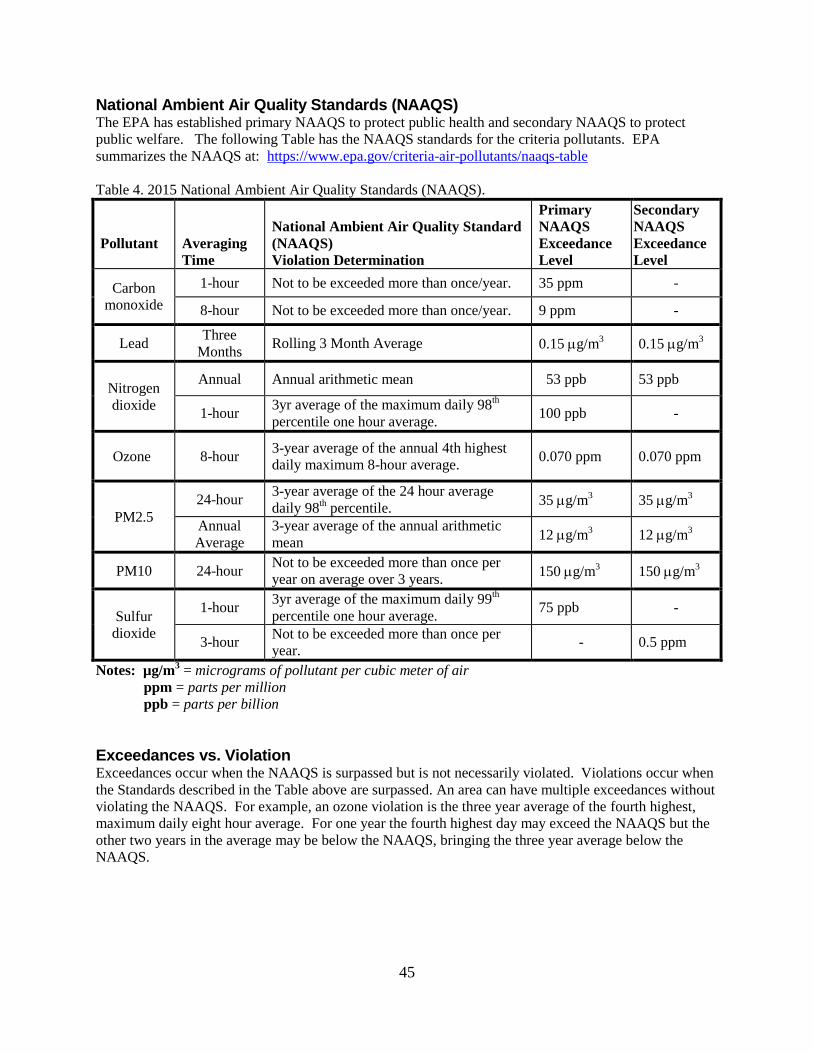
National Ambient Air Quality Standards (NAAQS) The EPA has established primary NAAQS to protect public health and secondary NAAQS to protect
public welfare. The following Table has the NAAQS standards for the criteria pollutants. EPA
summarizes the NAAQS at: https://www.epa.gov/criteria-air-pollutants/naaqs-table
Table 4. 2015 National Ambient Air Quality Standards (NAAQS).
Pollutant
Averaging
Time
National Ambient Air Quality Standard
(NAAQS)
Violation Determination
Primary
NAAQS
Exceedance
Level
Secondary
NAAQS
Exceedance
Level
Carbon
monoxide
1-hour Not to be exceeded more than once/year. 35 ppm -
8-hour Not to be exceeded more than once/year. 9 ppm -
Lead Three
Months Rolling 3 Month Average 0.15 g/m
3 0.15 g/m
3
Nitrogen
dioxide
Annual Annual arithmetic mean 53 ppb 53 ppb
1-hour 3yr average of the maximum daily 98
th
percentile one hour average. 100 ppb -
Ozone 8-hour 3-year average of the annual 4th highest
daily maximum 8-hour average. 0.070 ppm 0.070 ppm
PM2.5
24-hour 3-year average of the 24 hour average
daily 98th percentile.
35 g/m3 35 g/m
3
Annual
Average
3-year average of the annual arithmetic
mean 12 g/m
3 12 g/m
3
PM10 24-hour Not to be exceeded more than once per
year on average over 3 years. 150 g/m
3 150 g/m
3
Sulfur
dioxide
1-hour 3yr average of the maximum daily 99
th
percentile one hour average. 75 ppb -
3-hour Not to be exceeded more than once per
year. - 0.5 ppm
Notes: µg/m3 = micrograms of pollutant per cubic meter of air
ppm = parts per million
ppb = parts per billion
Exceedances vs. Violation Exceedances occur when the NAAQS is surpassed but is not necessarily violated. Violations occur when
the Standards described in the Table above are surpassed. An area can have multiple exceedances without
violating the NAAQS. For example, an ozone violation is the three year average of the fourth highest,
maximum daily eight hour average. For one year the fourth highest day may exceed the NAAQS but the
other two years in the average may be below the NAAQS, bringing the three year average below the
NAAQS.

46
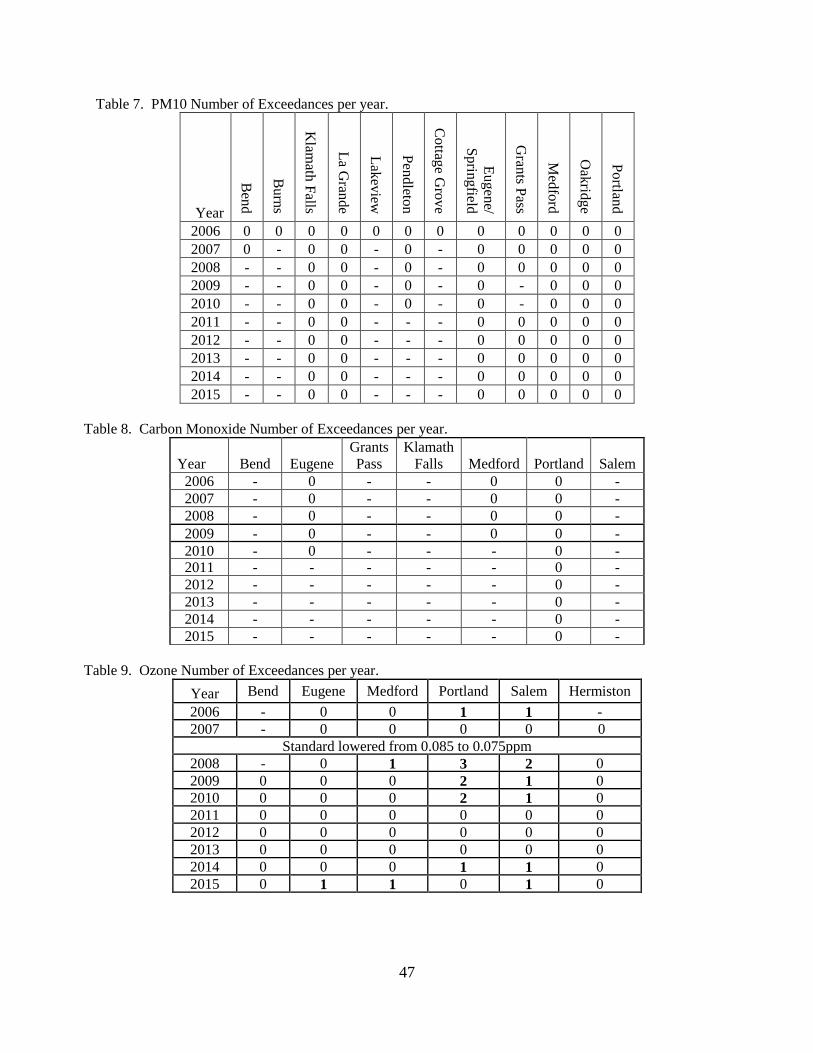
Recent NAAQS Exceedances. The following Tables summarize Oregon’s NAAQS exceedances for the last 10 years for PM2.5, PM10,
CO, and Ozone. PM2.5 comparison to the NAAQS is determined by the 98th percentile.
Table 5. PM2.5 98th Percentile – Eastern Oregon.
Year Bend Burns
Klamath
Falls
La
Grande Lakeview Pendleton Prineville
The
Dalles
2006 21.6 33.6 47.5 33.7 33.5 26.2 - 24.2
2007 17.4 36.1 39.6 14.8 37.5 27.1 - 25.9
2008 22.7 36.4 52.2 14.8 43.7 29.9 - 21.6
2009 14.0 26.5 44.0 23.3 43.2 21.8 28.0 20.1
2010 14.5 24.8 34.6 12.9 26.3 18.2 27.5 19.6
2011 17.8 39.4 37.1 26.0 37.8 25.9 37.1 19.9
2012 20.3 27.1 34.1 21.7 36.7 21.6 29.3 17.6
2013 17.7 38.0 46.5 32.9 93.6 32.0 49.2 30.1
2014 21.7 29.0 29.6 35.2 42.3 23.0 46.8 18.3
2015 17.0 25.8 25.2 26.2 32.7 17.6 41.7 16.7
Blue, italicized values are from a non Federal Reference Method and are informational.
Table 6. PM2.5 98th Percentile – Western Oregon.
Year
Alb
any
Beav
erton
Corv
allis
Cottag
e
Gro
ve
Eugen
e/
Sprin
gfield
Gran
ts
Pass
Hillsb
oro
Med
ford
Oak
ridge
Portlan
d
Salem
2006 26.2 22.2 21.5 - 31.8 - - 31.5 38.6 37.5 26.2
2007 29.9 30.0 27.1 38.8 36.3 28.8 31.3 30.3 42.7 28.8 33.8
2008 27.5 25.8 20.8 18.0 26.7 28.3 30.4 28.4 38.7 26.8 23.7
2009 26.9 21.9 21.2 30.2 36.4 34.8 33.3 32.5 41.3 21.5 25.7
2010 16.0 15.0 14.8 18.3 19.5 20.1 15.8 19.1 33.0 17.0 19.2
2011 21.2 23.4 21.2 20.5 22.2 30.0 36.2 29.0 42.0 36.1 25.2
2012 16.4 17.9 15.4 17.0 25.4 17.8 17.8 31.0 38.4 15.7 18
2013 32.3 27.3 24.5 31.1 40.2 32.4 42.8 65.6 41.0 35.6 31.8
2014 22.9 20.4 16.3 21.3 31.6 25.7 27.7 31.3 41.1 22.1 22.7
2015 25.4 17.8 18.6 20.1 26.7 18.4 33.9 35.2* 28.9 29.9 22.9
Blue, italicized values are from a non Federal Reference Method and are informational.
*Forest Fire days were excluded for this calculation
47
Table 7. PM10 Number of Exceedances per year.
Year
Ben
d
Bu
rns
Klam
ath F
alls
La G
rande
Lak
eview
Pen
dleto
n
Co
ttage G
rov
e
Eu
gen
e/
Sp
ring
field
Gran
ts Pass
Med
ford
Oak
ridg
e
Po
rtland
2006 0 0 0 0 0 0 0 0 0 0 0 0
2007 0 - 0 0 - 0 - 0 0 0 0 0
2008 - - 0 0 - 0 - 0 0 0 0 0
2009 - - 0 0 - 0 - 0 - 0 0 0
2010 - - 0 0 - 0 - 0 - 0 0 0
2011 - - 0 0 - - - 0 0 0 0 0
2012 - - 0 0 - - - 0 0 0 0 0
2013 - - 0 0 - - - 0 0 0 0 0
2014 - - 0 0 - - - 0 0 0 0 0
2015 - - 0 0 - - - 0 0 0 0 0
Table 8. Carbon Monoxide Number of Exceedances per year.
Year Bend Eugene
Grants
Pass
Klamath
Falls Medford Portland Salem
2006 - 0 - - 0 0 -
2007 - 0 - - 0 0 -
2008 - 0 - - 0 0 -
2009 - 0 - - 0 0 -
2010 - 0 - - - 0 - 2011 - - - - - 0 -
2012 - - - - - 0 -
2013 - - - - - 0 -
2014 - - - - - 0 -
2015 - - - - - 0 -
Table 9. Ozone Number of Exceedances per year.
Year Bend Eugene Medford Portland Salem Hermiston
2006 - 0 0 1 1 -
2007 - 0 0 0 0 0
Standard lowered from 0.085 to 0.075ppm
2008 - 0 1 3 2 0
2009 0 0 0 2 1 0
2010 0 0 0 2 1 0
2011 0 0 0 0 0 0
2012 0 0 0 0 0 0
2013 0 0 0 0 0 0
2014 0 0 0 1 1 0
2015 0 1 1 0 1 0

48
Appendix 1 Data Summaries for 2006 through 2015 The following pages present ambient air quality data summaries for the past 10 years.
Oregon’s Air Quality Monitors collects data for criteria pollutants using EPA Federal Reference Methods. DEQ
and LRAPA use other EPA approved methods for PM2.5 estimates used for the AQI and methods used for air
toxics. The criteria data are summarized for comparison to the NAAQS. PM2.5 estimate and ozone AQI data
are shown and Air Toxics are compared to Oregon Ambient Benchmark Concentration.
Methods used for comparison to the NAAQS or health benchmarks:
Appendix 1 -A&B. Particulate (PM10 and PM2.5)
A. The PM2.5 annual average is determined by averaging the quarterly means.
B. The PM2.5 max daily sample is determined by taking the highest daily sample for the year.
C. The PM2.5 98th percentile is the value on the 98
th percent highest day. (#of days sampled*0.98). E.g.
120 sample days*0.98 = 118; 120 is the highest day, 118th day is the third highest day.
D. The PM10 max daily sample is determined by taking the highest 24 hour sample for the year.
E. The PM10 2nd
highest daily sample is determined by taking the 2nd
highest sample for the year.
Appendix 1-C. Ozone (O3)
A. Max daily, eight hour ozone average is calculated using a rolling eight hour average.
B. Fourth highest eight hour average is determined from the data in C.
Appendix 1-D. Oxides of Nitrogen (NO2 and NO)
A. The one hour value is calculated using the 98th percentile of the maximum daily, hourly average.
B. The annual standard is determined by averaging the annual one hour values.
Appendix 1-E. Sulfur Dioxide (SO2)
A. The one hour value is calculated using the 99th percentile of the maximum daily, hourly average.
B. The maximum three hour average is calculated using three consecutive hours.
Appendix 1-F. Carbon Monoxide (CO)
A. Max eight hour CO average is determined by calculating an eight hour rolling average.
B. Second highest eight hour average CO is determined from the data in A. Only one max per CO
episode is used to count to the second highest.
Appendix 1-G. Air Quality Index based on PM2.5 and ozone
A. Where there are PM2.5 FRM filter data, that it is used rather than nephelometer data.
B. Where there is not PM2.5 FRM filter data, nephelometer data is used to estimate PM2.5.
C. The maximum eight hour average daily ozone is used to calculate the daily ozone AQI.
D. Where ozone and PM2.5 are both available, the higher AQI of the two is used for the day.
Appendix 1-H. Air Toxics (Hazardous Air Pollution)
A. Air toxic levels are compared to bench mark levels of one in a million chance of cancer.
B. The annual averages are determined by taking the arithmetic mean of the quarterly averages. Where
the values are below the minimum detection limit (MDL), the MDL is halved prior to inclusion in the
average. If the quarterly average is below the MDL, the MDL is used.
49
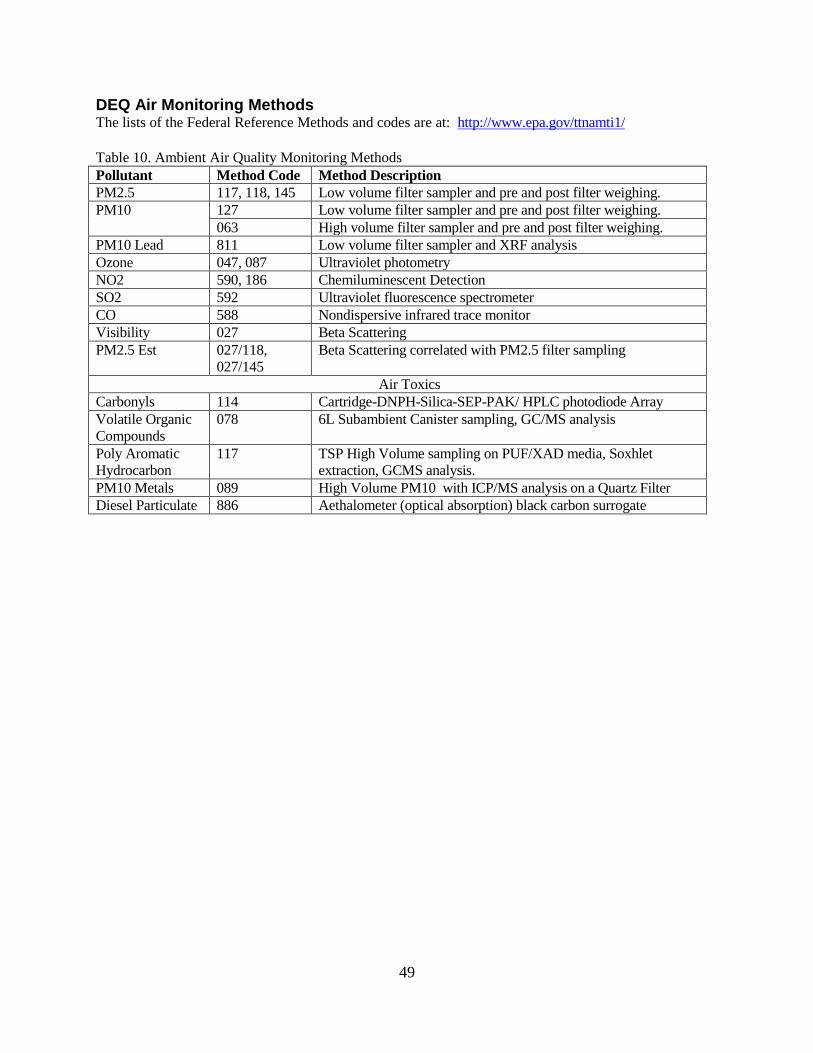
DEQ Air Monitoring Methods The lists of the Federal Reference Methods and codes are at: http://www.epa.gov/ttnamti1/
Table 10. Ambient Air Quality Monitoring Methods
Pollutant Method Code Method Description
PM2.5 117, 118, 145 Low volume filter sampler and pre and post filter weighing.
PM10 127 Low volume filter sampler and pre and post filter weighing.
063 High volume filter sampler and pre and post filter weighing.
PM10 Lead 811 Low volume filter sampler and XRF analysis
Ozone 047, 087 Ultraviolet photometry
NO2 590, 186 Chemiluminescent Detection
SO2 592 Ultraviolet fluorescence spectrometer
CO 588 Nondispersive infrared trace monitor
Visibility 027 Beta Scattering
PM2.5 Est 027/118,
027/145
Beta Scattering correlated with PM2.5 filter sampling
Air Toxics
Carbonyls 114 Cartridge-DNPH-Silica-SEP-PAK/ HPLC photodiode Array
Volatile Organic
Compounds
078 6L Subambient Canister sampling, GC/MS analysis
Poly Aromatic
Hydrocarbon
117 TSP High Volume sampling on PUF/XAD media, Soxhlet
extraction, GCMS analysis.
PM10 Metals 089 High Volume PM10 with ICP/MS analysis on a Quartz Filter
Diesel Particulate 886 Aethalometer (optical absorption) black carbon surrogate

APPENDIX 1A PM2.5 Summary (µg/m3)
50
A. PM2.5 Data Summary
STATION LOCATION SAMPLE ARITHMETIC 24-HOUR AVERAGES
AND NUMBER Years Days MEAN MAXIMUM
(date) 98
th Percentile (date)†
Burns 2007 58 9.5 37 (11/08) 36 (12/14)
Madison St. (BMS) 2008 54 11.2 41 (01/25) 36 (11/20)
EPA # 410250002 2009 94 8.4 28 (12/12) 27 (12/30)
Washington Park (BWS) 2010 118 7.9 32 (01/05) 25 (12/01)
EPA # 410250003 2011 116 10.0 47 (01/06) 39 (11/11)
2012 121 8.6 49 (09/21) 27 (11/11)
2013 119 9.9 39 (12/12) 38 (12/09)
2014 119 9.0 61(08/06) 29 (12/04) forest fire data included 2015 360 8.3 46 (08/29) 26 (01/28)
Cottage Grove 2008 119 7.1 32 (01/25) 21 (01/22)
City Shops (CGS) 2009 119 8.5 34 (12/12) 30 (01/22)
EPA # 410399004 2010 121 6.9 21 (12/07) 18 (12/22)
2011 119 7.1 32 (02/02) 21 (12/23)
2012 119 6.7 25 (01/13) 17 (11/02)
2013 120 7.5 38 (12/09) 25 (11/27)
2014 124 6.9 34 (11/19) 21 (12/04) forest fire data included 2015 118 7.3 40 (08/22) 20 (02/23)
Eugene Area
Eugene Amazon Park (EAP) 2006 123 8.4 43 (12/08) 32 (12/07)
EPA # 410390060 2007 119 7.3 43 (02/05) 36 (02/02)
2008 345 7.8 40 (01/24) 29 (01/22)
2009 357 8.5 60 (12/11) 36 (02/04)
2010 356 5.7 21 (01/29) 16 (01/03)
2011 119 6.5 25 (02/02) 21 (12/05)
2012 121 6.4 32 (01/13) 25 (02/06)
2013 122 7.8 52 (12/09) 39 (11/27)
2014 123 7.2 36 (01/26) 31 (11/16) forest fire data included 2015 121 7.4 55 (08/22) 27 (11/26)
Eugene Hwy 99 (E99) 2008 117 8.3 32 (06/29) 25 (10/27)
Pacific Hwy 99 N 2009 117 8.2 48 (12/12) 36 (12/09)
EPA# 410390058 2010 119 6.3 23 (12/07) 20 (01/29)
2011 115 6.8 27 (01/03) 22 (10/18)
2012 118 6.5 30 (02/06) 21 (10/18)
2013 122 8.3 55 (12/09) 40 (11/24)
2014 120 7.2 44 (01/26) 31 (11/16) forest fire data included 2015 122 8.0 55 (08/22) 27 (11/26)

APPENDIX 1A PM2.5 Summary (µg/m3)
51
STATION LOCATION SAMPLE ARITHMETIC 24-HOUR AVERAGES
AND NUMBER YEAR DAYS MEAN MAXIMUM
(date) 98
th Percentile (date)†
Grants Pass 2007 58 8.2 32 (02/05) 29 (01/30)
Parkside School (GPP) 2008 56 9.4 34 (06/29) 28 (01/01)
EPA # 410330114 2009 58 8.5 39 (11/09) 35 (12/09)
2010 57 6.4 36 (12/04) 20 (10/29)
2011 61 7.6 32 (12/23) 30 (11/11)
2012 61 7.1 19 (01/04) 18 (11/17)
2013 61 11.9 90 (08/02) 36 (11/24)
2013* 59 10.1 36 (11/24) 32 (12/12) forest fire data included 2014 61 7.4 43 (11/19) 26 (01/05)
* forest fire flagged data removed 2015 57 8.2 24 (08/28) 18 (08/22)
Klamath Falls 2006 112 11.1 53 (12/31) 48 (01/23)
Peterson School (KFP) 2007 116 10.8 56 (01/18) 40 (11/23)
4856 Clinton St. 2008 118 13.0 74 (12/17) 52 (12/23)
EPA # 410350004 2009 116 11.8 63 (09/25) 48 (11/15)
2009* 115 11.3 54 (12/09) 44 (01/10)
2010 118 9.8 53 (11/25) 35 (01/05)
2011 115 11.1 38 (11/26) 37 (02/11)
2012 115 10.7 43 (08/28) 34 (08/31)
2013 114 13.0 80 (07/30) 50 (01/16)
2013* 112 11.6 50 (01/16) 46 (12/09)
2014 118 8.8 31 (08/03) 30 (01/20) forest fire data included 2015 112 10.2 85 (08/01) 44 (08/19)
* forest fire flagged data removed 2015* 108 8.2 38 (11/29) 25 (11/14)
Lakeview 2007 86 8.1 44 (01/24) 38 (01/18)
Center and M Street (LCM) 2008 118 11.2 72 (12/17) 44 (12/11)
EPA # 410370001 2009 121 10.6 62 (01/13) 43 (12/09)
2010 116 7.5 34 (12/31) 26 (01/05)
2011 110 9.1 58 (01/03) 38 (01/27)
2012 113 9.7 42 (11/15) 37 (01/10)
2013 121 14.6 104 (01/19) 94 (01/16)
2014 120 8.6 47 (01/20) 42 (01/14) forest fire data included 2015 115 8.4 45 (11/29) 33 (01/06)

APPENDIX 1A PM2.5 Summary (µg/m3)
52
STATION LOCATION SAMPLE ARITHMETIC 24-HOUR AVERAGES
AND NUMBER YEAR DAYS MEAN MAXIMUM (date) 98
th Percentile (date)†
Medford 2006 102 10.0 45 (11/10) 32 (12/19)
Grant & Belmont (MGB) 2007 231 9.7 38 (01/27) 30 (11/16)
902 Grant Ave. 2008 351 10.0 51 (08/07) 33 (08/06)
EPA # 410290133 2008* 333 8.8 33 (11/25) 28 (01/17)
2009 173 10.0 54 (09/25) 38 (11/30)
2009* 172 9.6 43 (12/12) 33 (01/22)
2010 117 7.1 22 (12/04) 19 (11/19)
2011 113 9.4 43 (12/11) 29 (12/23)
2012 119 9.3 33 (01/28) 31 (01/13) 2013 121 14.2 157 (07/30) 66 (12/12) 2013* 118 12.0 66 (12/12) 43 (01/19) 2014 122 9.3 39 (01/02) 31 (01/20) 2014* 121 9.1 39 (01/02) 28 (12/31) forest fire data included 2015 119 12.1 112 (08/01) 46 (08/22) * forest fire flagged data removed 2015* 115 9.6 36 (11/23) 35 (11/14)
Oakridge 2006 118 11.1 47 (12/07) 39 (02/22)
Willamette Cntr. (OAK) 2007 118 10.5 53 (02/02) 43 (01/24)
School St. 2008 182 11.5 44 (01/22) 39 (12/06)
EPA # 410392013 2009 121 11.0 44 (12/12) 41 (01/16)
2010 119 8.9 43 (02/22) 33 (02/19)
2011 119 10.0 48 (12/23) 42 (02/02)
2012 116 7.6 50 (01/13) 38 (02/06)
2013 120 9.8 55 (12/09) 41 (01/19)
2014 122 10.0 46 (01/05) 41 (11/16)
2015 121 8.9 39 (11/29) 29 (02/23)
Pendleton 2008 119 8.3 34 (11/23) 30 (10/30)
McKay Creek Park (PMC) 2009 84 7.8 23 (12/09) 22 (12/15)
SW Marshall Place 2010 59 6.9 20 (11/28) 18 (11/04)
EPA # 410590121 2011 61 7.5 26 (01/03) 26 (12/23)
2012 60 7.3 29 (01/28) 22 (02/09)
2013 58 8.0 36 (11/30) 32 (11/24)
Prineville 2009 82 9.0 32 (01/22) 28 (01/10)
Davidson Park (PDP) 2010 75 7.8 28 (01/02) 28 (12/07)
EPA # 410130100 2011 99 9.6 40 (02/02) 37 (12/17)
2012 119 8.0 37 (11/26) 29 (09/21)
2013 122 11.0 56 (12/27) 49 (11/27)
2014 119 9.9 69 (07/19) 47 (02/10)
2014* 118 9.4 48 (01/17) 44 (11/16) forest fire data included 2015 108 8.9 83 (08/13) 42 (08/22)
* forest fire flagged data removed 2015* 104 7.5 42 (01/06) 25 (01/21)

APPENDIX 1A PM2.5 Summary (µg/m3)
53
STATION LOCATION SAMPLE ARITHMETIC 24-HOUR AVERAGES
AND NUMBER YEAR DAYS MEAN MAXIMUM (date) 98
th Percentile (date)†
Portland Area
Hillsboro (HHF) 2007 57 8.2 34 (11/26) 31 (02/05)
Hare Field 2008 65 8.9 32 (12/05) 30 (01/16)
EPA # 410670004 2009 69 8.7 35 (01/16) 33 (02/03)
2010 93 6.6 40 (11/25) 16 (10/20)
2011 111 8.6 54 (12/05) 36 (01/03)
2012 109 7.2 39 (01/13) 22 (11/11)
2013 119 9.1 55 (12/12) 43 (11/30)
2014 117 7.0 37 (01/26) 23 (12/31) forest fire data included 2015 120 8.3 58 (08/22) 34 (11/29)
* forest fire flagged data removed 2015* 119 7.6 34 (11/29) 32 (01/03)
S.E. Portland (SEL) 2006 56 9.8 39 (01/23) 38 (10/26)
SE Lafayette and 57th 2007 116 8.1 40 (01/21) 29 (01/24)
EPA # 410510080 2008 118 8.4 34 (01/16) 27 (12/15)
2009 116 7.6 22 (01/10) 22 (11/24)
2010 117 6.3 31 (11/25) 17 (02/07)
2011 111 8.3 42 (02/11) 36 (12/11)
2012 118 7.4 35 (01/28) 23 (09/18)
2013 120 8.7 42 (11/30) 36 (01/19)
2014 120 6.3 30 (02/10) 15 (01/17) forest fire data included 2015 121 7.2 56 (08/22) 29 (01/03)
* forest fire flagged data removed 2015* 120 6.8 30 (11/23) 24 (01/24)
Springfield 2006 61 7.4 30 (11/01) 28 (12/07)
City Hall (SCH) 2007 59 6.8 39 (02/05) 18 (01/30)
EPA# 410391009 2008 61 6.9 32 (06/29) 24 (01/25)
2009 60 6.8 22 (12/09) 18 (01/19)
2010 63 5.8 18 (08/06) 14 (09/29)
2011 63 5.6 19 (01/03) 15 (12/14)
2012 66 5.6 18 (10/18) 15 (09/18)
2013 61 6.3 19 (11/24) 17 (01/22)
2014 61 6.4 36 (11/19) 14 (12/07) forest fire data included 2015 60 6.3 54 (08/22) 13 (10/27)
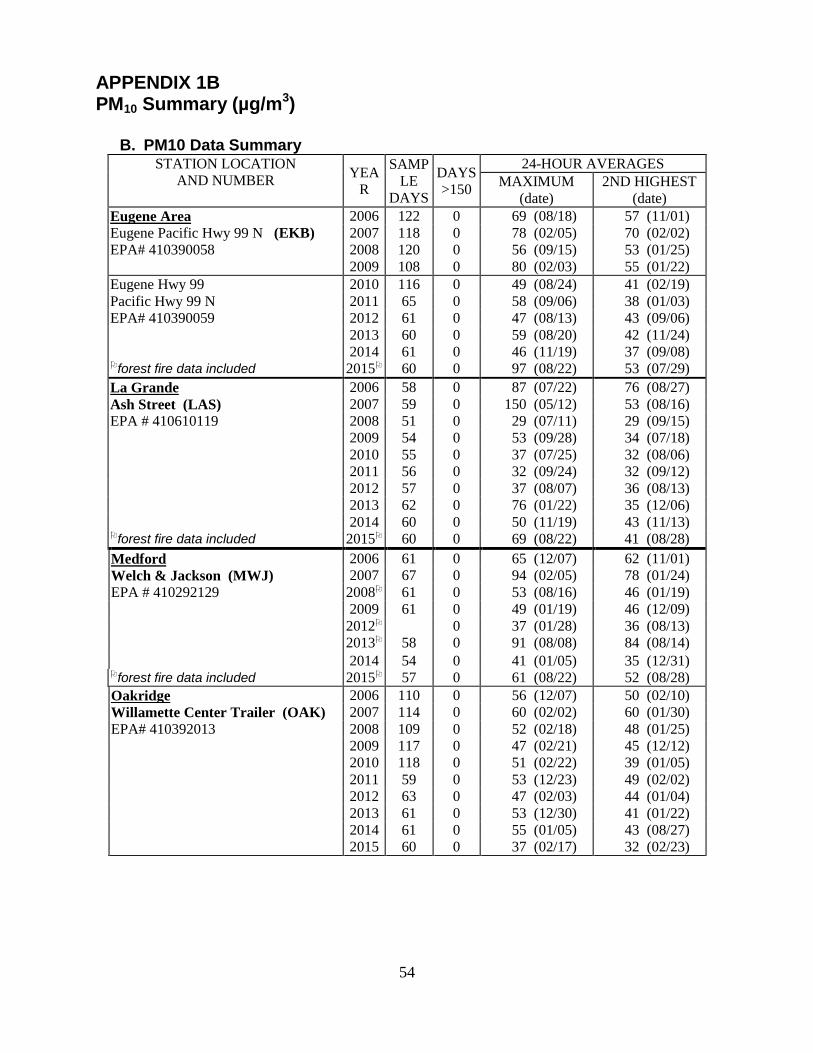
APPENDIX 1B PM10 Summary (µg/m3)
54
B. PM10 Data Summary STATION LOCATION
AND NUMBER YEA
R
SAMP
LE
DAYS
DAYS
>150
24-HOUR AVERAGES
MAXIMUM
(date)
2ND HIGHEST
(date)
Eugene Area 2006 122 0 69 (08/18) 57 (11/01)
Eugene Pacific Hwy 99 N (EKB) 2007 118 0 78 (02/05) 70 (02/02)
EPA# 410390058 2008 120 0 56 (09/15) 53 (01/25)
2009 108 0 80 (02/03) 55 (01/22)
Eugene Hwy 99 2010 116 0 49 (08/24) 41 (02/19)
Pacific Hwy 99 N 2011 65 0 58 (09/06) 38 (01/03)
EPA# 410390059 2012 61 0 47 (08/13) 43 (09/06)
2013 60 0 59 (08/20) 42 (11/24)
2014 61 0 46 (11/19) 37 (09/08) forest fire data included 2015 60 0 97 (08/22) 53 (07/29)
La Grande 2006 58 0 87 (07/22) 76 (08/27)
Ash Street (LAS) 2007 59 0 150 (05/12) 53 (08/16)
EPA # 410610119 2008 51 0 29 (07/11) 29 (09/15)
2009 54 0 53 (09/28) 34 (07/18)
2010 55 0 37 (07/25) 32 (08/06)
2011 56 0 32 (09/24) 32 (09/12)
2012 57 0 37 (08/07) 36 (08/13)
2013 62 0 76 (01/22) 35 (12/06)
2014 60 0 50 (11/19) 43 (11/13) forest fire data included 2015 60 0 69 (08/22) 41 (08/28)
Medford 2006 61 0 65 (12/07) 62 (11/01)
Welch & Jackson (MWJ) 2007 67 0 94 (02/05) 78 (01/24)
EPA # 410292129 2008 61 0 53 (08/16) 46 (01/19)
2009 61 0 49 (01/19) 46 (12/09)
2012 0 37 (01/28) 36 (08/13)
2013 58 0 91 (08/08) 84 (08/14)
2014 54 0 41 (01/05) 35 (12/31) forest fire data included 2015 57 0 61 (08/22) 52 (08/28)
Oakridge 2006 110 0 56 (12/07) 50 (02/10)
Willamette Center Trailer (OAK) 2007 114 0 60 (02/02) 60 (01/30)
EPA# 410392013 2008 109 0 52 (02/18) 48 (01/25)
2009 117 0 47 (02/21) 45 (12/12)
2010 118 0 51 (02/22) 39 (01/05)
2011 59 0 53 (12/23) 49 (02/02)
2012 63 0 47 (02/03) 44 (01/04)
2013 61 0 53 (12/30) 41 (01/22)
2014 61 0 55 (01/05) 43 (08/27)
2015 60 0 37 (02/17) 32 (02/23)

APPENDIX 1B PM10 Summary (µg/m3)
55
STATION LOCATION
AND NUMBER YEAR
SAMPLE DAYS
DAYS >150
24-HOUR AVERAGES
MAXIMUM (date) 2ND HIGHEST (date)
Portland Area 2007 90 0 46 (01/24) 40 (11/02)
SE Portland (SEL) 2008 120 0 45 (01/16) 44 (02/15)
SE Lafayette 2009 121 0 29 (01/31) 29 (12/12)
EPA# 410510080 2010 117 0 38 (11/25) 31 (11/10)
2011 111 0 56 (02/11) 51 (12/23)
2012 111 0 45 (01/28) 34 (09/18)
2013 120 0 44 (12/12) 43 (12/12)
2014 120 0 37 (02/10) 30 (09/11) forest fire data included 2015 119 0 68 (08/22) 33 (11/24)
N. Portland (PNR) 2006 77 0 43 (01/23) 43 (10/26)
N. Emerson (N. Roselawn) 2007 72 0 36 (11/02) 32 (07/11)
EPA # 410510246 2008 56 0 34 (06/29) 31 (09/11)
2009 59 0 41 (09/10) 35 (09/22)
2010 57 0 22 (08/24) 22 (01/26)
2011 59 0 38 (12/23) 35 (12/11)
2012 58 0 36 (01/28) 35 (09/18)
2013 61 0 43 (11/30) 40 (12/12)
2014 60 0 18 (09/14) 17 (11/19) forest fire data included 2015 58 0 73 (08/22) 45 (11/24)
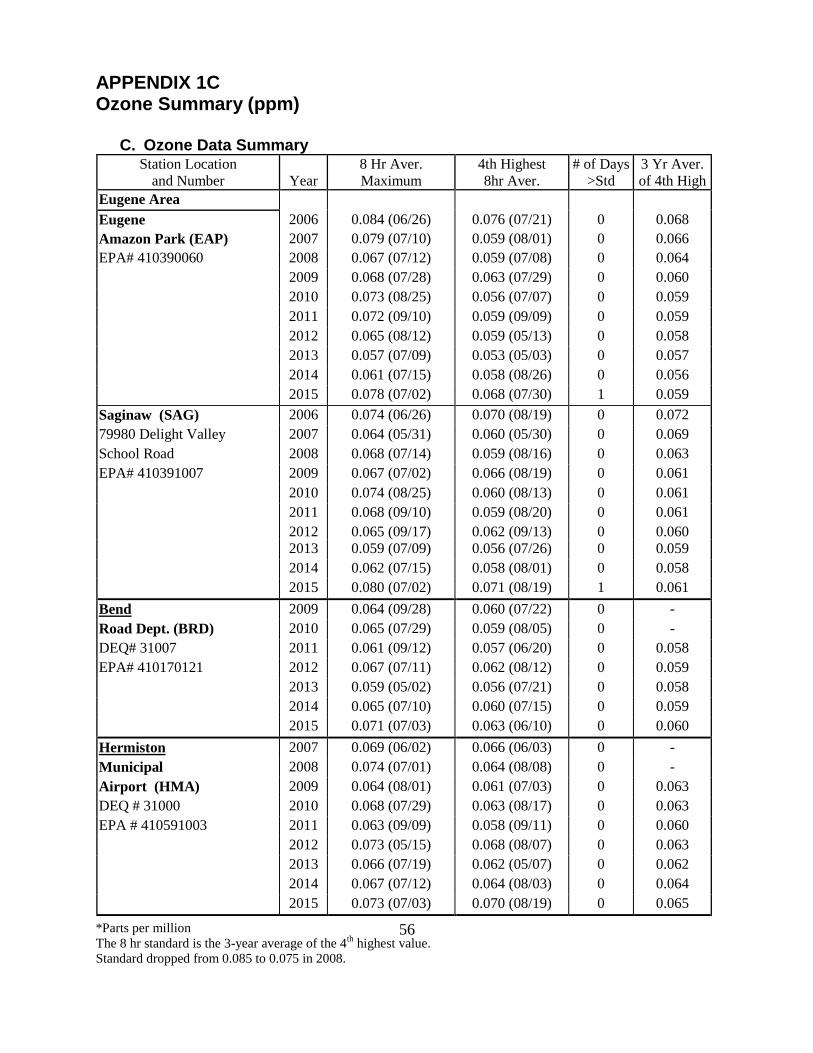
APPENDIX 1C Ozone Summary (ppm)
*Parts per million
The 8 hr standard is the 3-year average of the 4th
highest value.
Standard dropped from 0.085 to 0.075 in 2008.
56
C. Ozone Data Summary Station Location
and Number Year
8 Hr Aver.
Maximum
4th Highest
8hr Aver.
# of Days
>Std
3 Yr Aver.
of 4th High
Eugene Area
Eugene 2006 0.084 (06/26) 0.076 (07/21) 0 0.068
Amazon Park (EAP) 2007 0.079 (07/10) 0.059 (08/01) 0 0.066
EPA# 410390060 2008 0.067 (07/12) 0.059 (07/08) 0 0.064
2009 0.068 (07/28) 0.063 (07/29) 0 0.060
2010 0.073 (08/25) 0.056 (07/07) 0 0.059
2011 0.072 (09/10) 0.059 (09/09) 0 0.059
2012 0.065 (08/12) 0.059 (05/13) 0 0.058
2013 0.057 (07/09) 0.053 (05/03) 0 0.057
2014 0.061 (07/15) 0.058 (08/26) 0 0.056
2015 0.078 (07/02) 0.068 (07/30) 1 0.059
Saginaw (SAG) 2006 0.074 (06/26) 0.070 (08/19) 0 0.072
79980 Delight Valley 2007 0.064 (05/31) 0.060 (05/30) 0 0.069
School Road 2008 0.068 (07/14) 0.059 (08/16) 0 0.063
EPA# 410391007 2009 0.067 (07/02) 0.066 (08/19) 0 0.061
2010 0.074 (08/25) 0.060 (08/13) 0 0.061
2011 0.068 (09/10) 0.059 (08/20) 0 0.061
2012 0.065 (09/17) 0.062 (09/13) 0 0.060
2013 0.059 (07/09) 0.056 (07/26) 0 0.059
2014 0.062 (07/15) 0.058 (08/01) 0 0.058
2015 0.080 (07/02) 0.071 (08/19) 1 0.061
Bend 2009 0.064 (09/28) 0.060 (07/22) 0 -
Road Dept. (BRD) 2010 0.065 (07/29) 0.059 (08/05) 0 -
DEQ# 31007 2011 0.061 (09/12) 0.057 (06/20) 0 0.058
EPA# 410170121 2012 0.067 (07/11) 0.062 (08/12) 0 0.059
2013 0.059 (05/02) 0.056 (07/21) 0 0.058
2014 0.065 (07/10) 0.060 (07/15) 0 0.059
2015 0.071 (07/03) 0.063 (06/10) 0 0.060
Hermiston 2007 0.069 (06/02) 0.066 (06/03) 0 -
Municipal 2008 0.074 (07/01) 0.064 (08/08) 0 -
Airport (HMA) 2009 0.064 (08/01) 0.061 (07/03) 0 0.063
DEQ # 31000 2010 0.068 (07/29) 0.063 (08/17) 0 0.063
EPA # 410591003 2011 0.063 (09/09) 0.058 (09/11) 0 0.060
2012 0.073 (05/15) 0.068 (08/07) 0 0.063
2013 0.066 (07/19) 0.062 (05/07) 0 0.062
2014 0.067 (07/12) 0.064 (08/03) 0 0.064
2015 0.073 (07/03) 0.070 (08/19) 0 0.065

APPENDIX 1C Ozone Summary (ppm)
*Parts per million
The 8 hr standard is the 3-year average of the 4th
highest value.
Standard dropped from 0.085 to 0.075 in 2008.
57
STATION LOCATION AND NUMBER Year
8 Hr Aver.
Maximum
4th Highest
8hr Aver.
# of Days
>Std
3 Yr Aver.
of 4th High
Medford Area 2006 0.079 (07/20) 0.068 (07/26) 0 0.068
Talent (TAL) 2007 0.067 (08/01) 0.066 (08/02) 0 0.067
7112 Rapp Lane 2008 0.076 (08/15) 0.070 (07/08) 1 0.068
DEQ# 10109 2009 0.067 (07/29) 0.065 (08/26) 0 0.067
EPA# 410290201 2010 0.068 (08/25) 0.061 (08/24) 0 0.065
2011 0.063 (09/07) 0.057 (09/10) 0 0.061
2012 0.073 (08/14) 0.066 (07/11) 0 0.061
2013 0.070 (07/09) 0.067 (08/06) 0 0.063
2014 0.064 (07/16) 0.059 (07/10) 0 0.064
2015 0.086 (08/01) 0.069 (07/03) 1 0.064
Salem Area 2006 0.087 (07/21) 0.075 (06/25) 1 0.066
Cascade Jr High 2007 0.066 (07/10) 0.057 (06/02) 0 0.065
(CJH) 2008 0.085 (08/15) 0.066 (08/05) 2 0.066
Turner 2009 0.082 (07/29) 0.069 (07/03) 1 0.064
DEQ# 10130 2010 0.078 (08/25) 0.057 (08/24) 1 0.064
EPA# 410470004 2011 0.068 (09/10) 0.058 (09/09) 0 0.061
2012 0.068 (09/14) 0.063 (08/04) 0 0.059
2013 0.062 (08/21) 0.055 (05/10) 0 0.058
2014 0.081 (09/15) 0.062 (07/12) 1 0.059
2015 0.078 (08/18) 0.065 (06/27) 1 0.060
Portland Area
Carus (SPR) 2006 0.106 (07/21) 0.072 (06/26) 1 0.067
13575 Spangler Road 2007 0.070 (05/30) 0.058 (06/02) 0 0.064
Canby 2008 0.084 (08/15) 0.066 (06/30) 0 0.065
EPA# 410050004 2009 0.080 (08/19) 0.069 (09/12) 0 0.064
2010 0.094 (07/08) 0.066 (08/05) 0 0.067
2011 0.068 (09/07) 0.063 (09/10) 0 0.066
2012 0.073 (08/17) 0.065 (05/13) 0 0.064
2013 0.065 (09/11) 0.059 (05/06) 0 0.062
2014 0.072 (08/11) 0.062 (09/14) 0 0.062
2015 0.073 (08/18) 0.069 (07/30) 0 0.063

APPENDIX 1C Ozone Summary (ppm)
*Parts per million
The 8 hr standard is the 3-year average of the 4th
highest value.
Standard dropped from 0.085 to 0.075 in 2008.
58
STATION LOCATION AND NUMBER Year
8-HOUR AVERAGE MAXIMUM
4TH HIGHEST 8-HOUR AVERAGE
# OF DAYS >Std**
3 YEAR AVG OF 4TH HIGH
Portland Area
Sherwood (SLR) 2009 0.069 (08/19) 0.065 (07/29) 0 -
EPA# 410671004 2010 0.071 (08/25) 0.056 (08/24) 0 -
2011 0.067 (09/07) 0.056 (09/08) 0 0.059
2012 0.070 (08/17) 0.062 (09/14) 0 0.058
2013 0.055 (05/06) 0.052 (05/04) 0 0.056
2014 0.076 (08/11) 0.057 (05/14) 1 0.057
2015 0.070 (08/23) 0.063 (06/27) 0 0.057
SE Portland (SEL) 2006 0.079 (07/21) 0.064 (06/25) 0 0.057
SE 57 & SE Lafayette 2007 0.060 (07/11) 0.056 (07/10) 0 0.057
EPA# 410510080 2008 0.072 (08/15) 0.060 (08/05) 0 0.060
2009 0.080 (08/19) 0.061 (07/02) 0 0.059
2010 0.064 (08/25) 0.054 (08/16) 0 0.058
2011 0.076 (09/11) 0.057 (09/07) 1 0.057
2012 0.063 (08/16) 0.061 (05/14) 0 0.057
2013 0.058 (06/30) 0.053 (05/06) 0 0.057
2014 0.075 (08/11) 0.055 (05/01) 0 0.056
2015 0.062 (08/18) 0.057 (08/01) 0 0.055
Sauvie Island (SIS) 2006 0.075 (07/21) 0.063 (06/25) 0 0.058
Social Security 2007 0.064 (07/10) 0.056 (05/30) 0 0.058
Beach 2008 0.065 (08/15) 0.059 (06/28) 0 0.059
EPA# 410090004 2009 0.072 (08/19) 0.060 (07/27) 0 0.058
2010 0.061 (08/25) 0.049 (06/23) 0 0.056
2011 0.057 (09/11) 0.051 (09/07) 0 0.053
2012 0.057 (05/13) 0.053 (05/14) 0 0.051
2013 0.052 (08/21) 0.047 (05/04) 0 0.050
2014 0.056 (05/01) 0.050 (05/13) 0 0.050
2015 0.063 (07/30) 0.058 (07/01) 0 0.052

APPENDIX 1D,E,F Air Quality Index Summary
59
D. Nitrogen Dioxide Data Summary Station Location
And Number
Year # Of Days
Annual Arithmetic
Mean (ppb)
98th Percentile Of Daily
Maximum (ppb)
Portland 2008 344 11 40
SE Lafayette at 57th
2009 344 10 40
(SEL) 2010 363 9 33
EPA # 410510080 2011 348 9 33
2012 348 9 36
2013 351 10 33
2014 340 8 35
2015 365 9 20
Tualatin Bradbury Ct.
(I-5 near rd site) (TBC) 2015 352 14 23
EPA# 410670005
E. Sulfur Dioxide Data Summary Station Location
And Number
Year # Of
Days
One Hour
Aver. 99th
Percentile (ppb)
3 Hour Aver.
Maximum
(ppb)
3 Hour Aver.
2nd
Highest
(ppb)
Portland 2006 363 15 16 16
SE Lafayette at 57th
2007 365 8 12 10
(SEL) 2008 327 8 7 7
EPA # 410510080 2009 363 9 10 8
2010 365 8 8 8
2011 343 9 6 6
2012 334 10 5 5
2013 342 5 6 6
2014 343 3 4 4
2015 359 4 8 8
F. Carbon Monoxide Data Summary
Station Location
And Number Year
Days
>9ppm
8-HOUR AVERAGES
Maximum (ppm) 2ND
Highest (ppm)
Portland 2006 0 2.9 2.7
SE Lafayette at 57th
2007 0 3.1 2.7
(SEL) 2008 0 3.1 2.4
EPA # 410510080 2009 0 2.5 2.3
2010 0 2.4 2.4
2011 0 2.6 2.4
2012 0 2.3 2.2
2013 0 2.0 1.8
2014 0 1.3 1.3
2015 0 2.0 1.9
Tualatin Bradbury Ct.
(I-5 near rd site) (TBC) 2015 0 1.3 1.3
EPA# 410670005

APPENDIX 1G Air Quality Index Summary
60
G. Air Quality Index Summary Portland
Metro
Good Moderate UFSG* Unhealthy
Very
Unhealthy
Hazar
dous
Missing
days
Portland 2006 306 54 4 1 0 0 0
2007 307 50 7 1 0 0 0
2008 311 49 6 0 0 0 0
2009 309 52 4 0 0 0 0
2010 342 21 2 0 0 0 0
2011 310 49 6 0 0 0 0
2012 330 35 0 0 0 0 1
2013 282 77 5 0 0 0 1
2014 332 32 1 0 0 0 0
2015 305 58 0 2 0 0 0
Hillsboro 2006 311 48 4 0 0 0 2
2007 306 48 10 1 0 0 0
2008 310 51 4 0 0 0 1
2009 288 62 7 0 0 0 8
2010 338 17 1 0 0 0 9
2011 308 50 7 0 0 0 0
2012 334 29 1 0 0 0 2
2013 281 71 8 1 0 0 4
2014 324 40 1 0 0 0 0
2015 309 54 1 1 0 0 0
Beaverton 2006 337 23 1 0 0 0 4
2007 317 43 2 0 0 0 3
2008 330 32 1 0 0 0 3
2009 330 22 0 0 0 0 13
2010 358 6 0 0 0 0 1
2011 337 24 0 0 0 0 4
2012 354 12 0 0 0 0 0
2013 307 53 5 0 0 0 0
2014 349 16 0 0 0 0 0
2015 338 24 1 1 0 0 1
McMinnville 2009 351 8 1 0 0 0 5
2010 360 3 0 0 0 0 2
Shut down 2011 183 4 0 0 0 0 0
*Unhealthy for sensitive groups

APPENDIX 1G Air Quality Index Summary
61
Willamette
Valley
Good Moderate UFSG* Unhealthy
Very
Unhealthy
Hazar
dous
Missing
days
Salem
2006 317 42 3 0 0 0 3
2007 325 34 6 0 0 0 0
2008 322 32 2 0 0 0 10
2009 310 47 3 0 0 0 5
2010 346 18 1 0 0 0 0
2011 355 10 0 0 0 0 0
2012 340 24 0 0 0 0 2
2013 283 71 5 0 0 0 6
2014 322 42 1 0 0 0 0
2015 311 51 1 2 0 0 0
Albany
2006 334 29 0 0 0 0 2
2007 321 37 4 0 0 0 3
2008 327 37 0 0 0 0 2
2009 331 28 3 0 0 0 3
2010 348 11 0 0 0 0 6
2011 329 30 1 0 0 0 5
2012 354 12 0 0 0 0 0
2013 305 56 4 0 0 0 0
2014 335 28 2 0 0 0 0
2015 305 43 2 3 0 0 12
Sweet Home
2007 315 43 0 0 0 0 7
2008 276 73 5 0 0 0 12
2009 292 60 1 1 0 0 11
2010 310 48 0 0 0 0 7
2011 329 32 1 0 0 0 3
2012 355 9 0 0 0 0 2
2013 284 70 5 0 0 0 6
2014 336 27 0 0 0 0 2
2015 332 31 0 2 0 0 0
Corvallis
2006 341 21 0 0 0 0 3
2007 322 35 2 0 0 0 6
2008 346 20 0 0 0 0 0
2009 327 27 0 0 0 0 11
2010 358 6 0 0 0 0 1
2011 343 18 0 0 0 0 4
2012 348 7 0 0 0 0 11
2013 302 52 1 0 0 0 10
2014 344 19 1 0 0 0 1
2015 333 30 1 1 0 0 0
*Unhealthy for sensitive groups
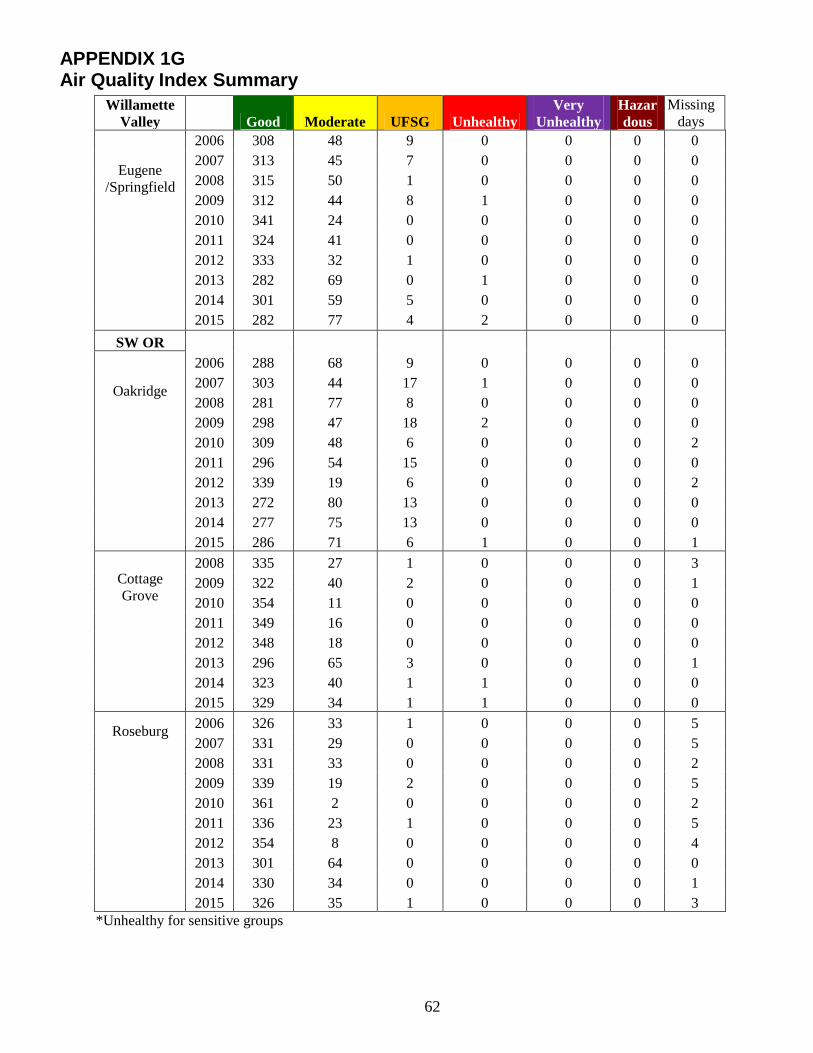
APPENDIX 1G Air Quality Index Summary
62
Willamette
Valley
Good Moderate UFSG Unhealthy
Very
Unhealthy
Hazar
dous
Missing
days
Eugene
/Springfield
2006 308 48 9 0 0 0 0
2007 313 45 7 0 0 0 0
2008 315 50 1 0 0 0 0
2009 312 44 8 1 0 0 0
2010 341 24 0 0 0 0 0
2011 324 41 0 0 0 0 0
2012 333 32 1 0 0 0 0
2013 282 69 0 1 0 0 0
2014 301 59 5 0 0 0 0
2015 282 77 4 2 0 0 0
SW OR
Oakridge
2006 288 68 9 0 0 0 0
2007 303 44 17 1 0 0 0
2008 281 77 8 0 0 0 0
2009 298 47 18 2 0 0 0
2010 309 48 6 0 0 0 2
2011 296 54 15 0 0 0 0
2012 339 19 6 0 0 0 2
2013 272 80 13 0 0 0 0
2014 277 75 13 0 0 0 0
2015 286 71 6 1 0 0 1
Cottage
Grove
2008 335 27 1 0 0 0 3
2009 322 40 2 0 0 0 1
2010 354 11 0 0 0 0 0
2011 349 16 0 0 0 0 0
2012 348 18 0 0 0 0 0
2013 296 65 3 0 0 0 1
2014 323 40 1 1 0 0 0
2015 329 34 1 1 0 0 0
Roseburg
2006 326 33 1 0 0 0 5
2007 331 29 0 0 0 0 5
2008 331 33 0 0 0 0 2
2009 339 19 2 0 0 0 5
2010 361 2 0 0 0 0 2
2011 336 23 1 0 0 0 5
2012 354 8 0 0 0 0 4
2013 301 64 0 0 0 0 0
2014 330 34 0 0 0 0 1
2015 326 35 1 0 0 0 3
*Unhealthy for sensitive groups

APPENDIX 1G Air Quality Index Summary
63
SW
Oregon
Good Moderate UFSG Unhealthy
Very
Unhealthy
Hazar
dous
Missing
days
Grants
Pass
2006 302 55 0 0 0 0 8
2007 308 56 0 0 0 0 1
2008 310 54 2 0 0 0 0
2009 298 52 4 0 0 0 11
2010 342 17 1 0 0 0 5
2011 326 34 1 0 0 0 4
2012 343 20 0 0 0 0 3
2013 262 91 2 6 2 1 1
2014 323 40 2 0 0 0 0
2015 307 55 2 1 0 0 0
Cave
Junction
2006 347 12 1 0 0 0 5
2007 349 6 0 0 0 0 10
2008 342 15 4 1 0 0 4
2009 359 6 0 0 0 0 0
2010 361 1 0 0 0 0 3
2011 337 18 0 0 0 0 10
2012 357 7 0 0 0 0 2
2013 267 83 6 7 1 1 0
2014 327 38 0 0 0 0 0
2015 275 71 3 1 0 0 15
Applegate
Valley
2006 350 7 0 0 0 0 8
2007 288 8 0 0 0 0 69
2008 344 14 3 1 0 0 4
2009 346 10 2 0 0 0 7
2010 358 6 1 0 0 0 0
2011 350 7 0 0 0 0 8
2012 356 2 0 0 0 0 8
2013 311 37 1 8 2 0 6
2014 349 16 0 0 0 0 0
2015 330 27 3 2 0 0 3
Shady
Cove
2006 353 8 0 0 0 0 4
2007 357 4 1 0 0 0 3
2008 330 31 1 0 0 0 4
2009 340 9 3 1 0 0 12
2010 362 2 0 0 0 0 1
2011 360 1 0 0 0 0 4
2012 364 0 0 0 0 0 2
2013 308 46 4 5 0 0 2
2014 341 20 1 0 0 0 3
2015 333 15 9 6 1 1 0

APPENDIX 1G Air Quality Index Summary
64
SW
Oregon
Good Moderate UFSG Unhealthy
Very
Unhealthy
Hazar
dous
Missing
days
Medford
2006 278 82 5 0 0 0 0
2007 276 86 2 0 0 0 1
2008 295 63 8 0 0 0 0
2009 277 78 7 1 0 0 2
2010 331 34 0 0 0 0 0
2011 283 74 4 0 0 0 4
2012 286 79 1 0 0 0 0
2013 222 126 10 5 2 0 0
2014 276 88 1 0 0 0 0
2015 248 99 11 7 0 0 0
Central
OR
Bend
2006 342 20 0 0 0 0 3
2007 350 12 0 0 0 0 3
2008 351 15 0 0 0 0 0
2009 349 9 1 0 0 0 6
2010 357 8 0 0 0 0 0
2011 349 16 0 0 0 0 0
2012 343 15 3 0 0 0 5
2013 332 33 0 0 0 0 0
2014 335 29 1 0 0 0 0
2015 329 33 2 1 0 0 0
Prineville 2009 304 56 5 0 0 0 0
2010 333 26 0 0 0 0 6
2011 293 56 7 0 0 0 9
2012 313 45 2 0 0 0 6
2013 255 97 11 2 0 0 0
2014 289 66 4 6 0 0 0
2015 290 63 6 2 0 0 4
Sisters 2012 334 10 1 11 2 3 4
2013 348 16 0 0 0 0 1
2014 350 15 0 0 0 0 0
2015 332 31 0 2 0 0 0
*Unhealthy for sensitive groups

APPENDIX 1G Air Quality Index Summary
65
Central
OR
Good Moderate UFSG Unhealthy
Very
Unhealthy
Hazar
dous
Missing
days
Madras 2009 309 42 0 0 0 0 14
Summer 2010 323 24 0 0 0 0 18
2011 145 19 1 0 0 0 12
2012 63 7 0 0 0 0 0
John
2013 76 16 0 0 0 0 0
2014 61 19 0 2 0 0 0
2015 75 13 3 1 0 0 0
2006 327 38 0 0 0 0 0
Day 2007 311 39 4 1 0 0 10
2008 290 36 2 0 0 0 38
2009 288 43 3 0 0 0 31
2010 331 33 1 0 0 0 0
2011 289 59 4 0 0 0 13
2012 302 58 2 1 0 0 3
2013 221 127 3 0 0 0 14
2014 266 91 1 1 0 0 6
Burns
2015 279 75 4 5 0 0 2
2006 289 65 6 1 0 0 4
2007 268 70 4 1 0 0 22
2008 284 72 8 1 0 0 1
2009 297 64 0 0 0 0 4
2010 308 51 0 0 0 0 6
2011 292 64 8 0 0 0 1
2012 314 49 1 0 0 0 2
2013 266 89 8 0 0 0 2
2014 277 83 3 2 0 0 0
Klamath
Falls
2015 282 80 3 0 0 0 0
2006 283 59 16 4 0 0 3
2007 267 73 18 5 0 0 2
2008 246 93 20 4 0 0 3
2009 268 82 9 2 0 0 4
2010 295 57 5 0 0 0 8
2011 274 75 11 0 0 0 5
2012 280 70 9 0 0 0 7
2013 220 118 21 3 0 0 3
2014 274 89 2 0 0 0 0
2015 263 92 8 2 0 0 0
*Unhealthy for sensitive groups
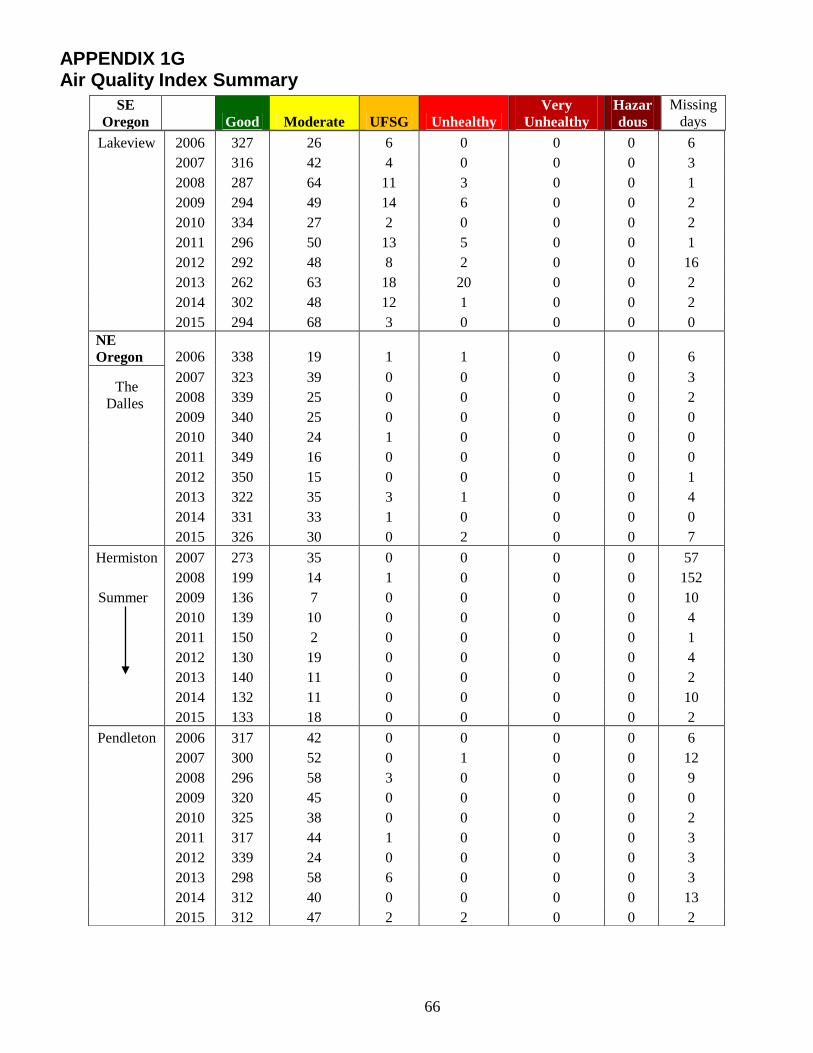
APPENDIX 1G Air Quality Index Summary
66
SE
Oregon
Good Moderate UFSG Unhealthy
Very
Unhealthy
Hazar
dous
Missing
days
Lakeview 2006 327 26 6 0 0 0 6
2007 316 42 4 0 0 0 3
2008 287 64 11 3 0 0 1
2009 294 49 14 6 0 0 2
2010 334 27 2 0 0 0 2
2011 296 50 13 5 0 0 1
2012 292 48 8 2 0 0 16
2013 262 63 18 20 0 0 2
2014 302 48 12 1 0 0 2
2015 294 68 3 0 0 0 0
NE
Oregon 2006 338 19 1 1 0 0 6
The
Dalles
2007 323 39 0 0 0 0 3
2008 339 25 0 0 0 0 2
2009 340 25 0 0 0 0 0
2010 340 24 1 0 0 0 0
2011 349 16 0 0 0 0 0
2012 350 15 0 0 0 0 1
2013 322 35 3 1 0 0 4
2014 331 33 1 0 0 0 0
2015 326 30 0 2 0 0 7
Hermiston 2007 273 35 0 0 0 0 57
2008 199 14 1 0 0 0 152
Summer 2009 136 7 0 0 0 0 10
2010 139 10 0 0 0 0 4
2011 150 2 0 0 0 0 1
2012 130 19 0 0 0 0 4
2013 140 11 0 0 0 0 2
2014 132 11 0 0 0 0 10
2015 133 18 0 0 0 0 2
Pendleton 2006 317 42 0 0 0 0 6
2007 300 52 0 1 0 0 12
2008 296 58 3 0 0 0 9
2009 320 45 0 0 0 0 0
2010 325 38 0 0 0 0 2
2011 317 44 1 0 0 0 3
2012 339 24 0 0 0 0 3
2013 298 58 6 0 0 0 3
2014 312 40 0 0 0 0 13
2015 312 47 2 2 0 0 2

APPENDIX 1G Air Quality Index Summary
67
NE
Oregon
Good Moderate UFSG Unhealthy
Very
Unhealthy
Hazar
dous
Missing
days
La Grande 2006 310 46 6 1 0 0 2
2007 337 20 0 0 0 0 8
2008 332 20 0 0 0 0 14
2009 313 40 0 0 0 0 12
2010 339 23 1 0 0 0 2
2011 318 39 3 1 0 0 4
2012 332 31 1 0 0 0 2
2013 286 73 6 0 0 0 0
2014 291 66 6 0 0 0 2
2015 285 59 8 3 0 0 10
Enterprise 2006 338 22 1 0 0 0 4
2007 340 21 2 0 0 0 2
2008 341 21 0 0 0 0 4
2009 343 19 0 0 0 0 3
2010 355 5 0 1 0 0 4
2011 342 18 0 0 0 0 5
2012 340 13 1 0 0 0 12
2013 323 41 0 0 0 0 1
2014 329 33 3 0 0 0 0
2015 322 34 3 5 0 0 1
Baker City 2006 329 25 2 0 0 0 9
2007 324 39 0 0 0 0 2
2008 331 34 1 0 0 0 0
2009 335 26 0 0 0 0 4
2010 343 13 0 0 0 0 9
2011 324 26 0 0 0 0 15
2012 349 15 2 0 0 0 0
2013 302 63 0 0 0 0 0
2014 317 48 0 0 0 0 0
2015 326 29 8 2 0 0 0
*Unhealthy for sensitive groups
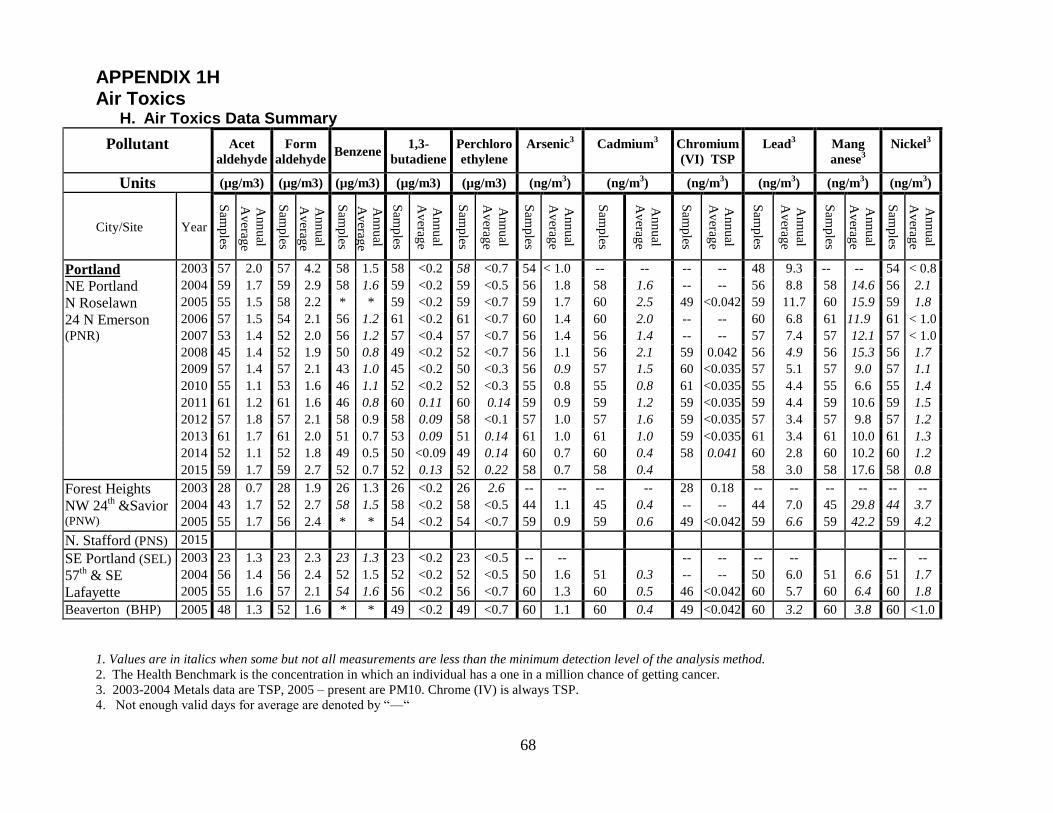
APPENDIX 1H Air Toxics
1. Values are in italics when some but not all measurements are less than the minimum detection level of the analysis method.
2. The Health Benchmark is the concentration in which an individual has a one in a million chance of getting cancer.
3. 2003-2004 Metals data are TSP, 2005 – present are PM10. Chrome (IV) is always TSP.
4. Not enough valid days for average are denoted by “—“
68
H. Air Toxics Data Summary
Pollutant
Acet
aldehyde
Form
aldehyde Benzene
1,3-
butadiene
Perchloro
ethylene
Arsenic3
Cadmium3
Chromium
(VI) TSP
Lead3
Mang
anese3
Nickel3
Units (µg/m3) (µg/m3) (µg/m3) (µg/m3) (µg/m3) (ng/m3) (ng/m
3) (ng/m
3) (ng/m
3) (ng/m
3) (ng/m
3)
City/Site Year
Sam
ples
An
nu
al
Av
erage
Sam
ples
An
nu
al
Av
erage
Sam
ples
An
nu
al
Av
erage
Sam
ples
An
nu
al
Av
erage
Sam
ples
An
nu
al
Av
erage
Sam
ples
An
nu
al
Av
erage
Sam
ples
An
nu
al
Av
erage
Sam
ples
An
nu
al
Av
erage
Sam
ples
An
nu
al
Av
erage
Sam
ples
An
nu
al
Av
erage
Sam
ples
An
nu
al
Av
erage
Portland 2003 57 2.0 57 4.2 58 1.5 58 <0.2 58 <0.7 54 < 1.0 -- -- -- -- 48 9.3 -- -- 54 < 0.8
NE Portland 2004 59 1.7 59 2.9 58 1.6 59 <0.2 59 <0.5 56 1.8 58 1.6 -- -- 56 8.8 58 14.6 56 2.1
N Roselawn 2005 55 1.5 58 2.2 * * 59 <0.2 59 <0.7 59 1.7 60 2.5 49 <0.042 59 11.7 60 15.9 59 1.8
24 N Emerson 2006 57 1.5 54 2.1 56 1.2 61 <0.2 61 <0.7 60 1.4 60 2.0 -- -- 60 6.8 61 11.9 61 < 1.0
(PNR) 2007 53 1.4 52 2.0 56 1.2 57 <0.4 57 <0.7 56 1.4 56 1.4 -- -- 57 7.4 57 12.1 57 < 1.0
2008 45 1.4 52 1.9 50 0.8 49 <0.2 52 <0.7 56 1.1 56 2.1 59 0.042 56 4.9 56 15.3 56 1.7
2009 57 1.4 57 2.1 43 1.0 45 <0.2 50 <0.3 56 0.9 57 1.5 60 <0.035 57 5.1 57 9.0 57 1.1
2010 55 1.1 53 1.6 46 1.1 52 <0.2 52 <0.3 55 0.8 55 0.8 61 <0.035 55 4.4 55 6.6 55 1.4
2011 61 1.2 61 1.6 46 0.8 60 0.11 60 0.14 59 0.9 59 1.2 59 <0.035 59 4.4 59 10.6 59 1.5
2012 57 1.8 57 2.1 58 0.9 58 0.09 58 <0.1 57 1.0 57 1.6 59 <0.035 57 3.4 57 9.8 57 1.2
2013 61 1.7 61 2.0 51 0.7 53 0.09 51 0.14 61 1.0 61 1.0 59 <0.035 61 3.4 61 10.0 61 1.3
2014 52 1.1 52 1.8 49 0.5 50 <0.09 49 0.14 60 0.7 60 0.4 58 0.041 60 2.8 60 10.2 60 1.2
2015 59 1.7 59 2.7 52 0.7 52 0.13 52 0.22 58 0.7 58 0.4 58 3.0 58 17.6 58 0.8
Forest Heights 2003 28 0.7 28 1.9 26 1.3 26 <0.2 26 2.6 -- -- -- -- 28 0.18 -- -- -- -- -- --
NW 24th &Savior 2004 43 1.7 52 2.7 58 1.5 58 <0.2 58 <0.5 44 1.1 45 0.4 -- -- 44 7.0 45 29.8 44 3.7
(PNW) 2005 55 1.7 56 2.4 * * 54 <0.2 54 <0.7 59 0.9 59 0.6 49 <0.042 59 6.6 59 42.2 59 4.2
N. Stafford (PNS) 2015
SE Portland (SEL) 2003 23 1.3 23 2.3 23 1.3 23 <0.2 23 <0.5 -- -- -- -- -- -- -- --
57th & SE 2004 56 1.4 56 2.4 52 1.5 52 <0.2 52 <0.5 50 1.6 51 0.3 -- -- 50 6.0 51 6.6 51 1.7
Lafayette 2005 55 1.6 57 2.1 54 1.6 56 <0.2 56 <0.7 60 1.3 60 0.5 46 <0.042 60 5.7 60 6.4 60 1.8
Beaverton (BHP) 2005 48 1.3 52 1.6 * * 49 <0.2 49 <0.7 60 1.1 60 0.4 49 <0.042 60 3.2 60 3.8 60 <1.0

APPENDIX 1H Air Toxics
1. Values are in italics when some but not all measurements are less than the minimum detection level of the analysis method.
2. The Health Benchmark is the concentration in which an individual has a one in a million chance of getting cancer.
3. 2003-2004 Metals data are TSP, 2005 – present are PM10. Chrome (IV) is always TSP.
4. Not enough valid days for average are denoted by “—“
69
Pollutant
Acet
aldehyde
Form
aldehyde Benzene
1,3-
butadiene
Perchloro
ethylene
Arsenic3
Cadmium3
Chromium
(VI) TSP
Lead3
Mang
anese3
Nickel3
Units (µg/m3) (µg/m3) (µg/m3) (µg/m3) (µg/m3) (ng/m3) (ng/m
3) (ng/m
3) (ng/m
3) (ng/m
3) (ng/m
3)
City/Site Year
Sam
ples
An
nu
al
Av
erage
Sam
ples
An
nu
al
Av
erage
Sam
ples
An
nu
al
Av
erage
Sam
ples
An
nu
al
Av
erage
Sam
ples
Sam
ples
Sam
ples
An
nu
al
Av
erage
Sam
ples
An
nu
al
Av
erage
Sam
ples
An
nu
al
Av
erage
Sam
ples
An
nu
al
Av
erage
Sam
ples
An
nu
al
Av
erage
Sam
ples
An
nu
al
Av
erage
SW Portland (PKC) 2005 49 1.5 52 2.2 * * 49 <0.2 49 <0.7 62 1.2 62 0.9 50 <0.042 62 5.6 62 19.1 62 1.6
Vancouver (VKT) 2005 52 1.4 53 2.0 * * 48 <0.2 48 <0.7 59 1.0 59 0.5 49 <0.042 59 3.8 59 8.1 59 < 1.0
Sauvie Is. (SIS) 07/08 52 0.8 45 1.2 49 0.6 52 <0.2 52 <0.7 62 0. 8 62 0.17 -- -- 62 2.8 62 4.1 57 < 1.0
Hillsboro (HHF) 2013 48 1.5 48 1.6 48 0.7 48 <0.1 48 <0.1 56 1.0 56 0.13 54 <0.035 56 3.0 56 3.6 56 <0.2
2014 50 1.1 50 1.8 44 0.6 44 <0.1 44 <0.1 61 0.8 61 0.07 - - 61 2.1 61 4.5 61 <0.3
Salem (SSH) 08/09 52 1.2 54 1.6 55 1.1 56 <0.2 50 <0.3 57 0.6 57 0.16 50 <0.035 56 2.8 57 4.9 57 < 1.0
09/10 52 1.2 51 1.7 31 0.6 42 <0.2 45 <0.3 53 0.9 53 0.18 54 <0.035 53 2.9 53 4.9 53 < 1.0
Eugene 2003 52 1.4 52 4.3 45 1.1 45 <0.2 45 <0.7 53 < 2.0 -- -- -- -- 53 3.7 -- -- 53 < 1.8
Amazon Park 2004 57 1.3 57 2.8 57 1.4 57 <0.2 57 <0.5 48 0.7 48 0.13 -- -- 48 2.5 48 4.8 48 <1.0
(EAP) 2005 27 1.5 28 1.9 28 1.6 28 <0.2 28 <0.7 31 0.7 31 <0.1 -- -- 31 2.5 31 6.3 31 <1.0
2006 27 1.4 27 1.8 28 1.0 28 <0.2 28 <0.7 30 0.8 30 0.1 -- -- 30 2.6 30 5.5 30 < 1.0 2007 38 1.6 33 1.5 39 1.0 41 <0.4 41 <0.7 44 0.6 44 <0.1 -- -- 44 2.0 44 5.3 44 < 1.0
2008 50 1.2 54 1.5 49 0.8 52 <0.2 48 <0.3 58 0.6 58 <0.1 -- -- 58 2.0 58 5.3 58 < 1.0 Q2 2010 –Q12011 10/11 56 1.1 46 1.6 59 1.1 58 <0.2 58 <0.3 55 0.7 54 <0.1 -- -- 55 1.4 55 3.9 55 < 1.0
2015 59 1.6 59 2.6 58 0.1 58 0.2 58 0.1 -- -- -- -- -- -- -- -- -- -- -- --
Hwy 99 (E99) 2015 59 3.2 59 2.2 59 0.6 59 0.3 59 0.2 -- -- -- -- -- -- -- -- -- -- -- --
Eugene
Peterson Park 10/11 59 1.7 59 1.9 52 0.6 48 <0.2 50 <0.3 57 0.6 57 <0.1 -- -- 57 1.9 57 4.7 57 < 1.0
Q2 2010 –Q12011
Klamath Falls
Q4 2010 –Q32011 10/11 60 2.0 60 2.6 54 1.1 54 <0.2 54 <0.3 50 0.3 50 <0.1 52 <0.035 50 1.4 50 5.2 50 < 1.0
ODEQ Benchmarks 0.45 3.0 0.13 0.03 35 0.2 0.6 0.08 150 90 2

APPENDIX 1H Air Toxics
1. Values are in italics when some but not all measurements are less than the minimum detection level of the analysis method.
2. The Health Benchmark is the concentration in which an individual has a one in a million chance of getting cancer.
3. 2003-2004 Metals data are TSP, 2005 – present are PM10. Chrome (IV) is always TSP.
4. Not enough valid days for average are denoted by “—“
70
Pollutant
Acet
aldehyde
Form
aldehyde Benzene
1,3-
butadiene
Perchloro
ethylene
Arsenic3
Cadmium3
Chromium
(VI) TSP
Lead3
Mang
anese3
Nickel3
Units (µg/m3) (µg/m3) (µg/m3) (µg/m3) (µg/m3) (ng/m3) (ng/m
3) (ng/m
3) (ng/m
3) (ng/m
3) (ng/m
3)
City/Site Year
Sam
ples
An
nu
al
Av
erage
Sam
ples
An
nu
al
Av
erage
Sam
ples
An
nu
al
Av
erage
Sam
ples
An
nu
al
Av
erage
Sam
ples
Sam
ples
Sam
ples
An
nu
al
Av
erage
Sam
ples
An
nu
al
Av
erage
Sam
ples
An
nu
al
Av
erage
Sam
ples
An
nu
al
Av
erage
Sam
ples
An
nu
al
Av
erage
Sam
ples
An
nu
al
Av
erage
La Grande 2004 52 1.9 52 3.4 50 0.6 50 <0.2 50 <0.5 48 0.33 48 0.2 -- -- 48 1.3 48 6.2 48 < 1.0
Ash St. (LAS) 2005 52 1.8 56 2.6 55 <0.3 55 <0.2 55 <0.7 60 0.33 60 <0.1 -- -- 60 1.5 60 5.7 60 < 1.0
2006 53 1.8 52 2.7 57 0.5 58 <0.2 58 <0.7 58 0.23 58 <0.1 50 <0.035 58 3.0 58 10.2 58 < 1.0
2007 53 1.4 52 2.1 54 0.8 55 <0.4 55 <0.7 56 0.19 56 <0.1 59 <0.035 56 1.4 56 8.2 56 < 1.0
2008 48 1.3 51 1.7 52 0.5 54 <0.4 54 <0.7 51 0.21 51 <0.1 48 <0.035 51 < 1.0 51 4.8 51 < 1.0
2009 58 1.4 58 1.8 42 0.7 47 <0.4 47 <0.3 53 0.14 53 <0.1 54 <0.035 53 < 1.0 53 5.0 53 < 1.0
2010 52 1.4 53 1.9 51 0.5 46 <0.2 50 <0.3 55 0.13 55 <0.1 57 <0.035 55 < 1.0 55 3.7 55 < 1.0
2011 56 1.7 56 2.2 57 0.9 57 0.09 57 <0.3 59 0.16 56 <0.1 57 <0.035 56 < 1.0 56 4.0 56 < 1.0
2012 55 2.0 55 2.5 55 0.9 55 0.09 55 <0.1 59 0.18 59 <0.1 60 <0.035 59 < 1.0 59 5.2 59 < 1.0
2013 60 2.0 60 2.6 54 0.6 57 0.1 57 0.17 62 0.22 62 0.05 61 <0.035 62 0.7 62 4.2 62 < 0.3
*1 outlier removed 2014 58 1.7 58 2.5 50 0.5 50 0.1 49 0.15* 60 0.25 60 <0.03 - - 60 0.7 60 4.3 60 < 0.3
from average 2015 51 1.8 51 2.4 40 0.5 42 0.1 42 0.19 59 0.21 59 <0.03 - -
Medford 2008 48 1.8 53 2.4 53 1.3 55 <0.2 55 0.7 54 0.54 54 <0.1 -- -- 54 1.9 54 6.0 54 < 1.0 Grant & Belmont 2009 59 1.8 59 2.2 46 1.5 53 <0.2 53 0.8 60 0.59 60 0.12 -- -- 60 2.0 60 4.9 60 < 1.0 (MGB) 2010 59 1.4 59 1.7 55 0.9 52 <0.2 55 <0.3 61 0.38 61 <0.1 -- -- 61 1.3 61 3.4 61 < 1.0 Welch & Jackson 2012 53 2.6 53 3.2 59 1.0 59 <0.1 59 <0.1 58 0.42 58 <0.1 61 <0.035 58 2.0 58 6.8 58 < 1.0
Dodge Rd. (MDR) 08/09 50 1.2 55 1.5 58 0.4 58 <0.2 58 <0.3 51 0.27 51 <0.1 -- -- 51 2.1 51 4.7 51 < 1.0
ODEQ Benchmarks 0.45 3.0 0.13 0.03 35 0.2 0.6 0.08 150 90 2

APPENDIX 2 Oregon Ambient Air Monitoring Network
71
Appendix 2. Oregon Air Quality Surveillance Network
The following tables and map describe the air quality monitoring network.
The following abbreviations are used in the network location tables and maps:
SO2 Sulfur dioxide
CO Carbon monoxide
NO2 Nitrogen dioxide
O3 Ozone
VIS/PMest Visibility/PM2.5 estimate (continuous particulate monitor)
HAPS Air Toxics (Hazardous Air Pollutants)
PM10 Fine particulate (10 micron)
PM2.5 Fine particulate (2.5 micron)
PM2.5 Spec PM2.5 chemically speciated
WS/WD Wind direction and speed
Temp Temperature
DT Delta temperature (inversion indicator)
BP Barometric pressure
RH Relative humidity
SR Solar radiation
IMPROVE EPA visibility program
NADP National Atmospheric Deposition Program
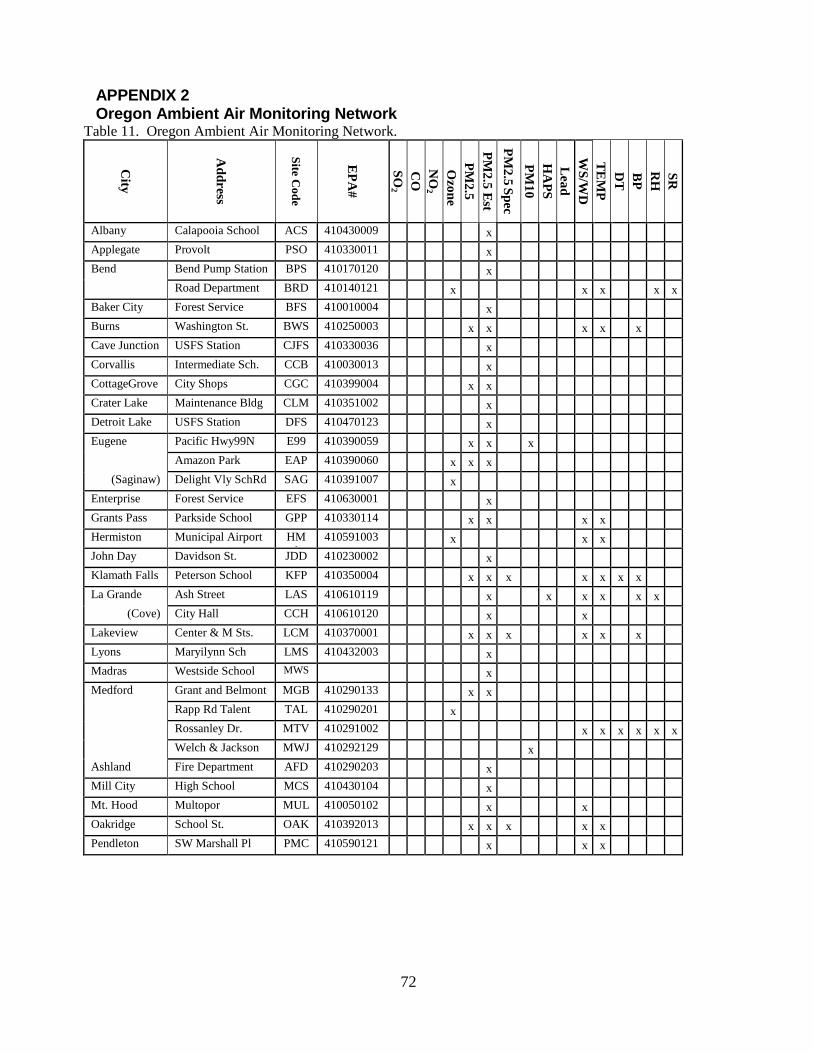
APPENDIX 2 Oregon Ambient Air Monitoring Network
72
Table 11. Oregon Ambient Air Monitoring Network.
City
Ad
dress
Site C
od
e
EP
A#
SO
2
CO
NO
2
Ozo
ne
PM
2.5
PM
2.5
Est
PM
2.5
Sp
ec
PM
10
HA
PS
Lea
d
WS
/WD
TE
MP
DT
BP
RH
SR
Albany Calapooia School ACS 410430009 x
Applegate Provolt PSO 410330011 x
Bend Bend Pump Station BPS 410170120 x
Road Department BRD 410140121 x x x x x
Baker City Forest Service BFS 410010004 x
Burns Washington St. BWS 410250003 x x x x x
Cave Junction USFS Station CJFS 410330036 x
Corvallis Intermediate Sch. CCB 410030013 x
CottageGrove City Shops CGC 410399004 x x
Crater Lake Maintenance Bldg CLM 410351002 x
Detroit Lake USFS Station DFS 410470123
x
Eugene Pacific Hwy99N E99 410390059 x x x
Amazon Park EAP 410390060 x x x
(Saginaw) Delight Vly SchRd SAG 410391007 x
Enterprise Forest Service EFS 410630001 x
Grants Pass Parkside School GPP 410330114 x x x x
Hermiston Municipal Airport HM
A
410591003 x x x
John Day Davidson St. JDD 410230002 x
Klamath Falls Peterson School KFP 410350004 x x x x x x x
La Grande Ash Street LAS 410610119 x x x x x x
(Cove) City Hall CCH 410610120 x x
Lakeview Center & M Sts. LCM 410370001 x x x x x x
Lyons Maryilynn Sch LMS 410432003
x
Madras Westside School MWS x
Medford Grant and Belmont MGB 410290133 x x
Rapp Rd Talent TAL 410290201 x
Rossanley Dr. MTV 410291002 x x x x x x
Welch & Jackson MWJ 410292129 x
Ashland Fire Department AFD 410290203 x
Mill City High School MCS 410430104 x
Mt. Hood Multopor MUL 410050102 x x
Oakridge School St. OAK 410392013 x x x x x
Pendleton SW Marshall Pl PMC 410590121 x x x
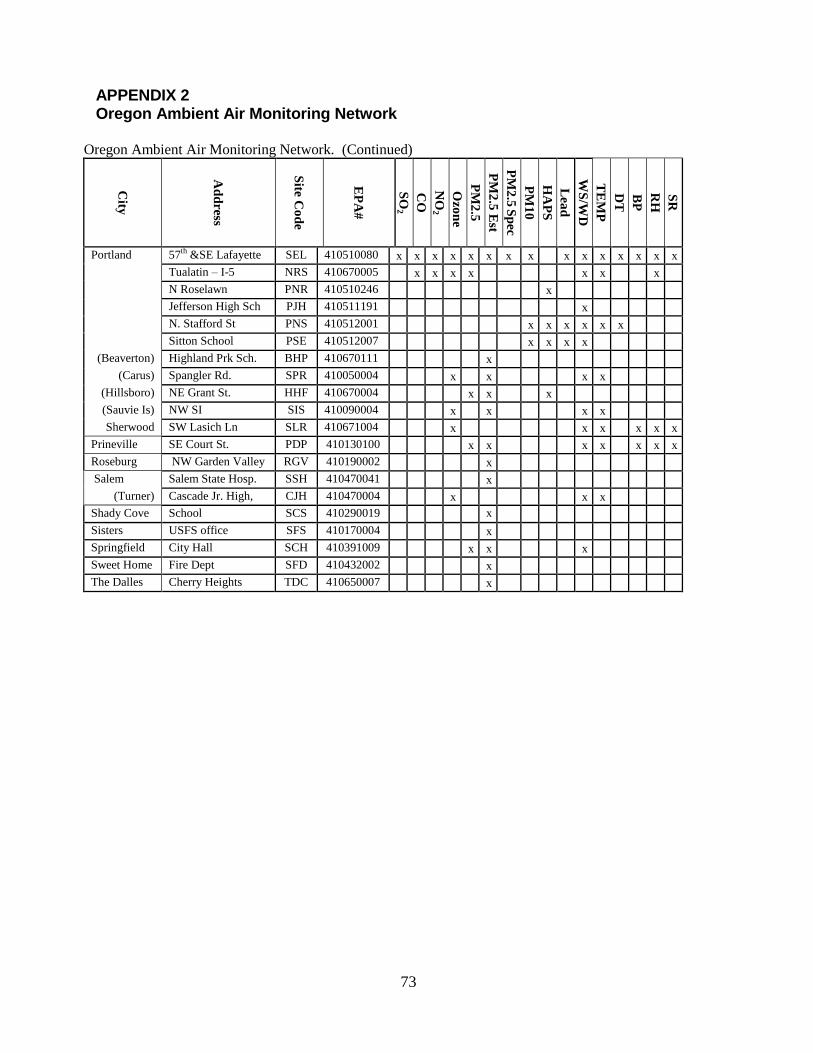
APPENDIX 2 Oregon Ambient Air Monitoring Network
73
Oregon Ambient Air Monitoring Network. (Continued)
City
Ad
dress
Site C
od
e
EP
A#
SO
2
CO
NO
2
Ozo
ne
PM
2.5
PM
2.5
Est
PM
2.5
Sp
ec
PM
10
HA
PS
Lea
d
WS
/WD
TE
MP
DT
BP
RH
SR
Portland 57th &SE Lafayette SEL 410510080 x x x x x x x x x x x x x x x
Tualatin – I-5 NRS 410670005 x x x x x x x
N Roselawn PNR 410510246 x
Jefferson High Sch PJH 410511191 x
N. Stafford St PNS 410512001 x x x x x x
Sitton School PSE 410512007 x x x x
(Beaverton) Highland Prk Sch. BHP 410670111 x
(Carus) Spangler Rd. SPR 410050004 x x x x
(Hillsboro) NE Grant St. HHF 410670004 x x x
(Sauvie Is) NW SI SIS 410090004 x x x x
Sherwood SW Lasich Ln SLR 410671004 x x x x x x
Prineville SE Court St. PDP 410130100 x x x x x x x
Roseburg NW Garden Valley RGV 410190002 x
Salem Salem State Hosp. SSH 410470041 x
(Turner) Cascade Jr. High, CJH 410470004 x x x
Shady Cove School SCS 410290019
x
X
Sisters USFS office SFS 410170004 x
Springfield City Hall SCH 410391009 x x x
Sweet Home Fire Dept SFD 410432002 x
The Dalles Cherry Heights TDC 410650007 x
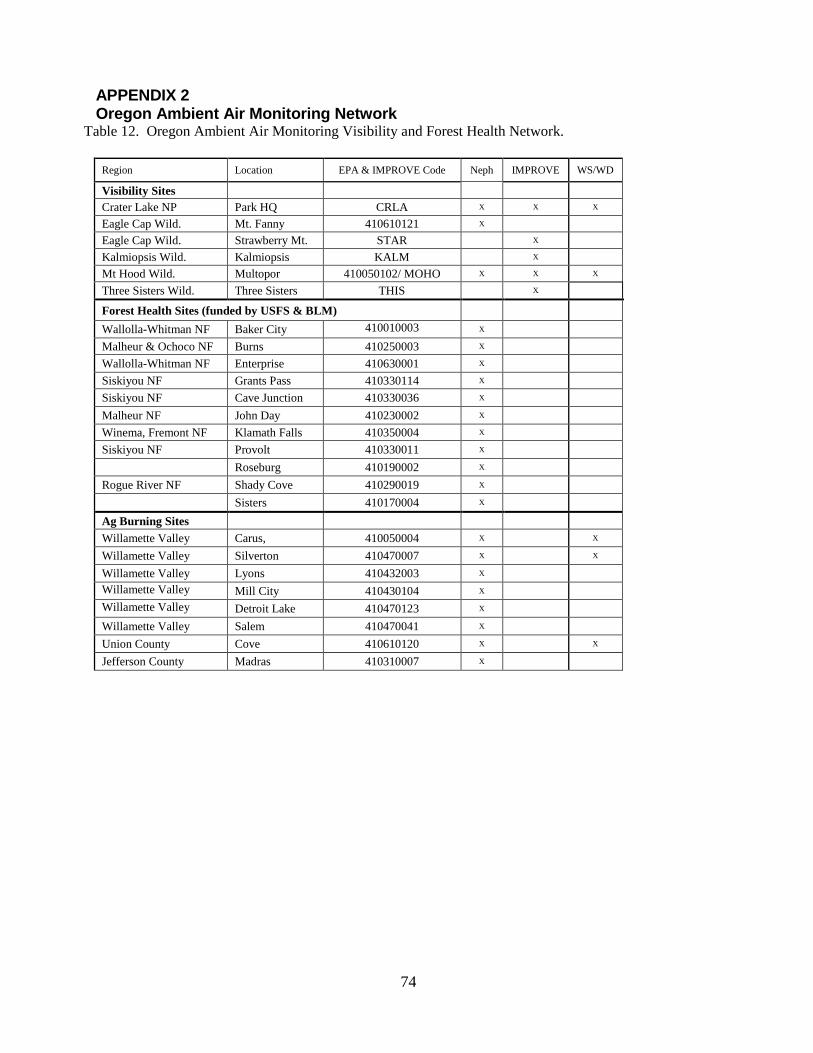
APPENDIX 2 Oregon Ambient Air Monitoring Network
74
Table 12. Oregon Ambient Air Monitoring Visibility and Forest Health Network.
Region Location EPA & IMPROVE Code Neph IMPROVE WS/WD
Visibility Sites
Crater Lake NP Park HQ CRLA X X X
Eagle Cap Wild. Mt. Fanny 410610121 X
Eagle Cap Wild. Strawberry Mt. STAR X
Kalmiopsis Wild. Kalmiopsis KALM X
Mt Hood Wild. Multopor 410050102/ MOHO X X X
Three Sisters Wild. Three Sisters THIS X
Forest Health Sites (funded by USFS & BLM)
Wallolla-Whitman NF Baker City 410010003 X
Malheur & Ochoco NF Burns 410250003 X
Wallolla-Whitman NF Enterprise 410630001 X
Siskiyou NF Grants Pass 410330114 X
Siskiyou NF Cave Junction 410330036 X
Malheur NF John Day 410230002 X
Winema, Fremont NF Klamath Falls 410350004 X
Siskiyou NF Provolt 410330011 X
Roseburg 410190002 X
Rogue River NF Shady Cove 410290019 X
Sisters 410170004 X
Ag Burning Sites
Willamette Valley Carus, 410050004 X X
Willamette Valley Silverton 410470007 X X
Willamette Valley Lyons 410432003 X
Willamette Valley Mill City 410430104 X
Willamette Valley Detroit Lake 410470123 X
Willamette Valley Salem 410470041 X
Union County Cove 410610120 X X
Jefferson County Madras 410310007 X

75
Figure 80. 2014 Ambient Air Monitoring Network.

Appendix 3 Data Quality Quality Assurance It is a policy of DEQ that all data used by the Department will be of sufficient quality to support the
regulatory decisions based upon them. The minimum quality assurance requirements set by EPA are
consistently met or exceeded by DEQ.
The continued assurance of data quality requires carrying out the two complimentary tasks discussed below:
Quality Control
The ambient air quality monitoring and sampling done by the Department follows a number of procedures
intended to maintain the system within control. Standard operating procedures are documented and
followed throughout. Federal Reference or Equivalent Methods are used wherever applicable. Care in
using accepted methodology is what makes the Department's air quality data representative and also
comparable to the data collected in other states. Routine preventative maintenance and periodic calibrations,
using National Institute of Standards Technology gases or other primary standards, are used to achieve a
data base which is sufficient in quantity and quality to meet the needs of the Air Quality Program.
Quality Assessment Evaluations of data quality are made in several ways. At least each quarter a system audit is conducted in
which each sampling and monitoring site is visited to evaluate whether the site location is still appropriate,
whether procedures are being followed, and to ensure that documentation is complete. Data quality is
assessed in terms of precision, accuracy, and completeness. Precision, or repeatability, is determined by
analysis of a known control sample or by replicate analyses. Accuracy, or the ability to measure a "true"
value, is assessed by quarterly audits of analyzer performance or sampler flow. These assessments are
reported to EPA as summary statistics. Completeness is measured by the amount of data actually captured
relative to the amount which ideally could have been collected. EPA also hires independent contractors to
evaluate Oregon’s sites for accuracy.