2015 practitioner report: campcraft · web viewincidents are rated in terms of their actual...
TRANSCRIPT

CAMPCRAFT: UPLOADS DATA 1st June 2014 – 31st May 2015
UPLOADS Key Issue Report: CAMPCRAFT
UPLOADS Twelve Months Campcraft Dataset: 1st June 2014 to 31st May 2015
Authors
Dr Michelle van Mulken
Amanda Clacy
Dr Natassia Goode
Professor Caroline Finch
Professor Paul Salmon
CENTRE FOR HUMAN FACTORS AND SOCIOTECHNICAL SYSTEMS
1

CAMPCRAFT: UPLOADS DATA 1st June 2014 – 31st May 2015
The UPLOADS Research Team
Professor Paul Salmon1
Professor Caroline Finch3
Dr Natassia Goode1
Dr Michelle van Mulken1
Amanda Clacy1
1Centre for Human Factors and Sociotechnical Systems, University of the Sunshine Coast
2Australian Centre for Research into Injury in Sport and its Prevention, Federation University
3Monash University Accident Research Centre, Monash University
Funders and Partner Organisations
This project was supported by funding from the Australia Research Council (ARC) in partnership with
Australian Camps Association, Outdoor Educators’ Association of South Australia, Outdoors South
Australia, United Church Camping, Outdoors Victoria, Outdoor Council of Australia, Recreation South
Australia, Outdoor Recreation Industry Council, Outdoors WA, YMCA Victoria, The Outdoor
Education Group, Girl Guides Australia, Wilderness Escape Outdoor Adventures, Venture Corporate
Recharge, Queensland Outdoor Recreation Federation, Christian Venues Association, Parks Victoria,
Victorian Department of Planning and Community Development, Outdoor Education Australia and
the Department of National Parks, Recreation, Sport and Racing Australia (LP110100037). Caroline
Finch was supported by a NHMRC Principal Research Fellowship (ID: 565900). The Australian Centre
for Research into Injury in Sport and its Prevention (ACRISP) is one of the International Research
Centres for Prevention of Injury and Protection of Athlete Health supported by the International
Olympic Committee (IOC). Paul Salmon’s contribution was funded through his current Australian
Research Council Future Fellowship (FT140100681).
2

CAMPCRAFT: UPLOADS DATA 1st June 2014 – 31st May 2015
3

CAMPCRAFT: UPLOADS DATA 1st June 2014 – 31st May 2015
Executive Summary
Aim
Campcraft-related injuries, near misses and illnesses emerged within the UPLOADS dataset
as frequently occurring incidents with potentially severe outcomes. The aims of this report are: to
present a detailed overview of all the campcraft (e.g. cooking and campfires) data contributed to the
UPLOADS National Incident Dataset during its first 12 months; to provide a holistic and in-depth
understanding of these campcraft-related incidents that occurred within led outdoor activities in
Australia; and to promote discussion within the sector regarding potential prevention strategies and
countermeasures.
Method
Organisations collected incident and participation data using the UPLOADS Software Tool
and UPLOADS Lite for 12 months (1st June 2014 to 31st May 2015). De-identified data were submitted
to the research team on a three monthly basis. The data was merged and the qualitative data,
describing the contributory factors involved in the incidents from each report, was coded using the
UPLOADS Accident Analysis Method (see Figure 1).
Organisations involved
Thirty-one (31) organisations from across Australia contributed data. These organisations
were operating in the following states and territories (note some organisations operate in multiple
states and territories): ACT (n = 1); NT (n = 1); NSW (n = 8); QLD (n = 6); VIC (n = 12); SA (n = 6); TAS
(n =2); and WA (n = 3).
4

CAMPCRAFT: UPLOADS DATA 1st June 2014 – 31st May 2015
Data collected
Of the 1020 incidents reported over the 12-month period, 117 were related to campcraft
activities. Thirty-six of these incident reports had sufficient detail to be code further using the
UPLOADS accident analysis method (see Figure 1). Of the 36 incidents, 67% (n = 24) involved an
injury, 17% (n = 6) involved an illness and another 17% (n = 6) involved a near miss. Injuries and
illnesses noticed during campcraft, but not related to campcraft activities (e.g. dehydration, severe
muscle soreness), were not included in this report.
Results
Incident rate
In the overall UPLOADS dataset, campcraft had the second highest injury-causing incidence
rate (5.6 incidents per 1000 participants) with walking/running in the outdoors as the highest injury-
causing incidence rate (7.9 incidents per 1000 participants). The average reported injury rate for all
led outdoor activities was 2.1 per 1000 participants. This means that there was approximately 3.5
more injury-causing incidents reported for every thousand participants involved in campcraft
activities, compared to all led outdoor activities overall.
Occurring at an incidence rate of 3.0 incidents per 1000 participants, campcraft had the
second highest illness incidence rate in all outdoor led activities (camping in tents had the highest
illness rate with 6.3 incidents per 1000 participants reported). Across all activities, the mean
reported illness rate was .57 incidents per 1000 participants. This means that, on average, there
were 2.4 more incidents of illness reported for every thousand participants involved in campcraft
alone, compared to all led outdoor activities combined.
In total, 8 campcraft-related near miss incidents were reported over the 12-month period,
occurring at an incidence rate of .77 incidents per 1000 participants. In comparison, across all
activities the mean reported illness rate was .23 incidents per 1000 participants. This means that, on
5

CAMPCRAFT: UPLOADS DATA 1st June 2014 – 31st May 2015
average, there were .54 more near miss incidents reported for every thousand participants involved
in campcraft alone, compared to all led outdoor activities combined.
Contributory factors
Just over one third (n = 36) of the reported incidents associated with campcraft had
sufficient detailed information to support further analysis with the UPLOADS Accident Analysis
Method. Contributory factors were found at the four lower levels of the UPLOADS Accident Analysis
Framework (1. Equipment, environment and meteorological conditions; 2. Decisions and actions of
leaders, participants and other actors at the scene; 3. Supervisory and management decisions and
actions; and 4. Local area government, schools, parents & carers and higher level management). The
most frequently identified factors at each level were: Equipment, Clothing and Personal Protective
Equipment (identified in 58% of incidents analysed); Activity Participant Experience and Competence
(identified in 33% of incidents analysed); Supervisors/Field Managers Activity or Program Design
(identified in 8% of incidents analysed); Parents & Carers: Communication (identified in 6% of
incidents analysed).
Conclusion
There are a number of important conclusions that can be drawn from these analyses
presented. Firstly, based on analysis of the first 12 months of incident data reported through
UPLOADS, campcraft activities represent an important area of focus for incident prevention efforts in
the Australian led outdoor activity sector. Secondly, campcraft-related incidents have various
contributory factors related to the activity environment and equipment (e.g. cooking equipment,
boiling water, fire), the activity leader (e.g. instructions provided), activity participants (e.g.
experience and competence), supervisors/field managers (e.g. program design), and parents/carers
(e.g. the communication of important dietary information). Thirdly, these findings suggest that
campcraft incident prevention interventions should focus on the equipment being used during
6

CAMPCRAFT: UPLOADS DATA 1st June 2014 – 31st May 2015
campcraft activities (e.g. cooking equipment), the ability of participants to safely undertake
campcraft activities (e.g. ability to handle cooking equipment, utensils), briefing and supervisory
activities related to campcraft activities, and the information requirements surrounding campcraft
activities, such as dietary needs, existing illnesses, and allergies. Finally, preventing future campcraft-
related incidents through targeted countermeasures that address the whole system is a complex
endeavour. It is therefore recommended that a network of countermeasures be used to tackle
campcraft-related incidents. This network should include interventions targeted at least at the four
lower levels of the led outdoor sector system (see Figure 1).
7

CAMPCRAFT: UPLOADS DATA 1st June 2014 – 31st May 2015
CONTENTS
The UPLOADS Research Team..............................................................................................................2
Funders and Partner Organisations......................................................................................................2
Executive Summary..............................................................................................................................4
Method...............................................................................................................................................10
Design..............................................................................................................................................11
Recruitment.....................................................................................................................................11
Data collection................................................................................................................................11
Incident data...................................................................................................................................12
Participation data...........................................................................................................................14
Data analysis...................................................................................................................................15
How to read this report......................................................................................................................17
Results.................................................................................................................................................18
Sample of organisations contributing data....................................................................................18
System administrator demographics..............................................................................................18
Overview of data collected.............................................................................................................19
Incidents by reporting quarter........................................................................................................19
Overview of incidents associated with campcraft-related injuries................................................20
Overview of incidents associated with campcraft-related illnesses..............................................25
Overview of campcraft-related near miss incidents.......................................................................29
Contributing factors of campcraft-related incidents......................................................................33
Discussion...........................................................................................................................................40
Incidence rates, contributing factors and solutions.......................................................................40
What now?......................................................................................................................................41
Limitations......................................................................................................................................44
Conclusion...........................................................................................................................................45
8

CAMPCRAFT: UPLOADS DATA 1st June 2014 – 31st May 2015
LIST OF TABLES
Table 1: Definitions provided for incident, adverse outcome and near miss....................................12Table 2: Incident Severity Scale..........................................................................................................13Table 3: Information captured concerning incidents by UPLOADS....................................................14Table 4: The relationships between “Parents & Carers: Communication” and “Activity Equipment &
Resources: Documentation”, influencing the conduct of activities.....................................35Table 5: Contributing factors related to each category represented on the Accimap at the
“Supervisory and management decisions and actions” level................................................35Table 6: The relationships between ‘Supervisor/Field Manager: Activity or Program Design’ and
factors at lower levels, influencing the conduct of activities................................................36Table 7: Contributing factors related to the “Activity Leader” categories........................................36Table 8: The relationships between Activity Leader factors and factors at lower levels, influencing
the conduct of activities.........................................................................................................37Table 9: Contributing factors related to the Activity Participant categories.....................................37Table 10: The relationships between Activity Leader factors and factors at lower levels, influencing
the conduct of activities......................................................................................................38Table 11: Contributing factors related to “Activity Equipment & Resources” categories.................39Table 12: Contributing factors related to “Activity Environment” categories...................................39
LIST OF FIGURES
Figure 1: UPLOADS Accident Analysis Method...................................................................................16Figure 2: Number of campcraft-related incident reports associated with each type of incident
outcome...............................................................................................................................19Figure 3: Number of reports associated with campcraft-related incidents.......................................20Figure 4: Injury-causing incidence rates per 1000 participants by activity type................................21Figure 5: Actual severity ratings for campcraft-related injuries........................................................22Figure 6: Type of campcraft-related injuries sustained according to body location.........................23Figure 7: Number of people with a campcraft-related injury by role, partitioned by gender...........24Figure 8: Illness rates per 1000 participants by activity type.............................................................26Figure 9: Actual severity ratings for campcraft-related illnesses.......................................................27Figure 10: Number of people with a campcraft-related illness by role, partitioned by gender........28Figure 11: Near miss incidence rates per 1000 participants by activity type.....................................30Figure 12: Potential severity ratings for campcraft-related near miss incidents...............................31Figure 13: Number of people involved in campcraft-related near miss incidents by role, partitioned
by gender...........................................................................................................................32Figure 14: Factors and relationships identified which contributed to incidents...............................34
9

CAMPCRAFT: UPLOADS DATA 1st June 2014 – 31st May 2015
Introduction
For the past six years, the authors have been engaged in a major program of research that aims to
tackle issues around injury causation and incident reporting and analysis in the led outdoor activity
(LOA) sector in Australia. Known as UPLOADS, one of the major goals is to develop an incident
reporting system that allows LOA providers in Australia to contribute incident data to a National
Incident Dataset. An important component of this involves reporting trends or key issues to the
sector as and when they emerge in the data. Analysis of the UPLOADS National Incident Dataset for
the period between the 1st of June 2014 and 31st of May 2015 (see van Mulken et al, 2016) showed
that campcraft (e.g. cooking and campfires) represented the second highest category of injury-
causing incidents, with an incidence rate of 5.6 incidents per 1000 participants. The average overall
injury-causing incidence rate across the dataset was 2.1 incidents per 1000 participants. This means
that there were approximately 3.5 more injury-causing incidents reported for every thousand
participants involved in campcraft activities, compared to all led outdoor activities overall.
Accordingly, it was decided to further examine the campcraft-related incident data to produce a
detailed report. This report provides the key findings and themes around the injuries, illnesses and
near miss incidents related to campcraft. The aims of this report are: to present the findings from an
analysis of the campcraft incident data contributed in the period between the 1st of June 2014 and
31st May 2015; to provide a holistic and in-depth understanding of these campcraft-related
incidents that occurred within led outdoor activities in Australia; and to promote discussion within
the sector regarding potential prevention strategies.
10

CAMPCRAFT: UPLOADS DATA 1st June 2014 – 31st May 2015
Method
Design
Self-nominated personnel from participating organisations used the incident reporting
system to collect data for 12 months (1st June 2015 to 31st May 2015). The University of the Sunshine
Coast Human Ethics Committee approved the study.
Recruitment
Organisations were invited to participate via peak body and professional membership
association newsletters. Interested organisations were asked to invite a senior staff member who
held a safety-related role to participate in the study. This person, thereafter referred to as the
‘system administrator’, was responsible for undertaking training in the system (described below),
collecting and entering all data, and providing training to other staff within their organisations on
reporting incidents. Forty-three (43) organisations signed up to participate for the 1st June 2014 –
31st May 2015 period.
Data collection
Two incident reporting and learning systems were developed to meet the needs of the
diverse Australian outdoor education and recreation sector: the UPLOADS Software tool and
UPLOADS Lite. The mandatory information captured by both systems is the same.
The UPLOADS Software Tool allows organisations to: 1) systematically track their incident
and participation data; 2) analyse their own incidents using a systems analysis framework; 3)
generate automatic reports on the data they collect; and 4) contribute de-identified data (i.e. names
removed) to the National Incident Dataset. The software tool is installed on a computer within the
organisation and the data is not directly accessible by the research team.
11

CAMPCRAFT: UPLOADS DATA 1st June 2014 – 31st May 2015
UPLOADS Lite was designed for organisations who only want to contribute data to the
National Incident Dataset. An online survey tool allows organisations to contribute completely
anonymous incident reports. Organisations are also able to save the data they enter for their own
records. Participation data is submitted at three monthly intervals using an Excel spreadsheet.
Incident data
Organisations were instructed to record incidents associated with adverse outcomes and
near miss incidents. Definitions of incident, adverse outcomes, and near miss are presented in Table
1.
Table 1: Definitions provided for incident, adverse outcome and near miss
Term Definition within UPLOADSIncident Any event that results in an adverse outcome or a near miss.Adverse outcome Any event resulting in a negative impact, including: missing/overdue
people; equipment or environmental damage; injury; illness; fatality; or social or psychological impacts.
Near miss Any serious mishap that has the potential to cause an adverse event but fails to do so because of chance or because it is intercepted. For example, during a rock climbing activity an instructor notices that a participant’s carabineer was not locked. If the student had fallen, this may have led to a serious injury.
Incidents are rated in terms of their actual severity (e.g. the actual outcome of the event)
and potential severity (e.g. the worst possible outcome, given the scenario), using the incident
severity scale as shown in Table 2. So the data contained in the National Incident Dataset is not
biased towards more serious events, organisations were instructed to report any:
Adverse Outcome with an Actual Severity of 1 or greater; and
Near Miss with a Potential Severity of 2 or greater.
12

CAMPCRAFT: UPLOADS DATA 1st June 2014 – 31st May 2015
Table 2: Incident Severity Scale
Severity Rating Definition for Actual Severity Ratings
Definition for Potential Severity Ratings
0 No impact Requires no treatment. An incident where the potential outcome has a negligible consequence.
1 Minor Requires localised care (non-evacuation) with short term effects.
An incident where the potential outcome to risks has a low consequence.
2 Moderate Requires ongoing care (localised or external, i.e. evacuation or not) with short to medium term effects.
An incident where the potential outcome to risks can cause moderate injuries or illnesses.
3 Serious Requires timely external care (evacuation) with medium to long term effects.
An incident where the potential outcome to risks encountered is such that it may cause major irreversible damage or threaten life.
4 Severe Requires urgent emergency assistance with long term effects.
An incident where the potential outcome to risks encountered is certain death.
5 Critical Requires urgent emergency assistance with serious ongoing long term effects.
NA
6 Unsurvivable Fatality. NA
The UPLOADS software tool captures the incident-related information described in Table 3.
13

CAMPCRAFT: UPLOADS DATA 1st June 2014 – 31st May 2015
Table 3: Information captured concerning incidents by UPLOADS
1. Incident characteristicsWas the reporter present at the incident?Date/TimeState/TerritoryType of incident (adverse outcome/near miss)Actual severity ratingPotential severity ratingActivity associated with the incidentNumber of people involved in activity (participants, activity leaders, supervisors, volunteers)Did the activity leader have relevant qualifications?2. Adverse outcomes (if applicable)2.1. Outcomes involving injuries, illnesses or social/psychological damagePerson affectedExperience in activity associated with the incidentWas the incident fatal?Injury typeInjury locationIllnessSocial/psychological impactsTreatment at the scene of the incidentEvacuation methodWas emergency services called?2.2 Outcomes involving missing or overdue peopleWere clients or staff missing or overdue?Were Emergency Services contacted/engaged in search?2.3 Outcomes involving equipment loss/damageWas equipment lost/damaged?2.4 Outcomes involving environmental damageWas there environmental damage?3. DescriptionDescribe the incident in detail, include: who was involved, what happened, when it happened, where it happened and any equipment involved.Describe any relevant events leading up to incident4. Contributing factors and relationshipsReporter: explain in detail what you think caused the incident, including any relationships between causes, include suggestions, comments and recommendations.Manager: explain in detail what you think caused the incident, including any relationships between causes, include suggestions, comments and recommendations.
14

CAMPCRAFT: UPLOADS DATA 1st June 2014 – 31st May 2015
Participation data
Organisations recorded the total number of participants and participation days for each
activity conducted during a calendar month. A participation day was defined as a day on which a
participant was exposed to the activity (Dickson, 2012). In this report, the total number of
participants was summed for each activity to provide a denominator for incidence rate calculations
(i.e. rate per 1000 participants). Participation days were not included in the analysis, as the initial
check of the data revealed that some values were outside the range of possible values (i.e. indicating
that data had been entered incorrectly).
Data analysis
Demographic statistics were calculated in SPSS statistics (version 21) using the participation
data supplied by each organisation. This included participant age and gender; size of group; number
of supervisors present; and the qualifications of group leaders. The de-identified incident data from
all organisations was merged into a central database. The actual severity scores for all adverse
outcomes were verified against the incident description, and re-coded as required. Descriptive
analyses were performed to calculate frequencies for each variable.
Two researchers from the University of the Sunshine Coast used the UPLOADS accident
analysis method (see Figure 1) to code the qualitative data provided in each report. This involved
identifying contributing factors and relationships from each report, and using the taxonomy in Figure
1 to classify them. Each researcher checked the other’s coding and the few disagreements were
resolved through discussion. Frequency counts of the number of incidents associated with each
factor and relationship were then calculated. The factors and relationships were then represented
on the framework for injuries, illnesses and near misses incident reports.
Participation data was merged into a single Excel file. For campcraft, incidence rates and
severity ratings were calculated for each incident type. Incidence rates were calculated per 1000
participants ((number of incidents/number of participants) x 1000)) for each activity. Locations of
15

CAMPCRAFT: UPLOADS DATA 1st June 2014 – 31st May 2015
physical injuries were mapped using data from the incident reports to inform anatomical diagrams
constructed in Visio. Frequencies of confounding factors such as weather conditions and activity
goals were also calculated for all incident types.
16

CAMPCRAFT: UPLOADS DATA 1st June 2014 – 31st May 2015
Figure 1: UPLOADS Accident Analysis Method, with framework and taxonomy, which was used to code the qualitative data provided in each incident report.
17

CAMPCRAFT: UPLOADS DATA 1st June 2014 – 31st May 2015
How to read this report
The report begins by presenting an overview of the organisations that contributed data and
the data collected. The report then provides an overview of the data collected and a summary of the
characteristics of the campcraft-related incidents involved. This is followed by an analysis of the
contributing factors involved in the campcraft-related incidents. The analysis of the contributing
factors includes a diagram of the contributing factors and relationships between them (referred to
as an Accimap), and tables which provide specific examples of the contributing factors and
relationships that are represented in the diagram.
Reading the Accimaps and Tables
The Accimaps represent a summary of the network of contributing factors and relationships
that were identified in the incidents. The boxes include information detailing the number of times
each category of contributing factor was identified across all of the incidents reported. The boxes
shaded in grey represent categories of contributory factors that were identified in more than one
incident. The lines linking the boxes represent relationships between the contributing factors as
identified by the activity providers. These relationships describe how contributing factors are
influenced by other contributing factors. For example, a line between “Activity Equipment &
Resources: Equipment, clothing and Personal Protective Equipment” and “Higher Level
Management: Financial Constraints” could indicate (the corresponding Tables provide a more
detailed description of each relationship) that old equipment was not replaced by new equipment
due to financial constraints. The lines also show the number of times a relationship was identified
across all of the incidents, and are bold when a relationship was identified in more than one
incident.
To better understand the Accimaps, it is recommended that you look at the corresponding
Tables which provide specific examples of contributing factors and relationships derived from the
incidents reported. This information describes the specific problems that were identified by the
18

CAMPCRAFT: UPLOADS DATA 1st June 2014 – 31st May 2015
activity providers as causing the incidents. The Tables discuss the contributing factors and
relationships from top (i.e. higher levels in Accimap) to bottom (i.e. lower levels in Accimap) and
(generally) from left to right. This means that if you, for example, wish to find more information
around the relationship between “Supervisor/Field Manager: Activity Design” and “Activity
Participant: Mental and Physical Condition”, then you would have to look in the relationships Table
related to “Supervisor/Field Manager: Activity Design”. By reading the Accimaps and Tables
together, you can get an overview of all the factors that are contributing to incidents during led
outdoor activities, and the specific issues underpinning them.
Results
Sample of organisations contributing data
Thirty-one organisations from across Australia contributed data. These organisations were
operating in the following states and territories (note that some organisations operate in multiple
states and territories): ACT (n = 1); NT (n = 1); NSW (n = 8); QLD (n = 6); VIC (n = 12); SA (n = 6); TAS
(n =2); and WA (n = 3). Five organisations identified as schools, and eight organisations identified as
registered training organisations (e.g. TAFE, University). Eleven organisations identified as not-for-
profits, 13 identified as commercial enterprises, and four as government agency or public sector
organisations.
System administrator demographics
The majority (71%) of system administrators were male (22 male, 9 female), with a median
of 16.9 years’ experience in the outdoor sector (range: 4 to 28 years). Thirty held a management role
within their organisation, and 24 led activities as part of their current role.
19

CAMPCRAFT: UPLOADS DATA 1st June 2014 – 31st May 2015
Overview of data collected
In total, 117 incidents relating to campcraft activities were recorded over the reporting
period. The number of reports associated with each type of incident outcome (e.g. near miss, injury,
illness etc.) is presented in Figure 2.
Incidents associated with social or psychological outcomes (n = 3), equipment damage (n =
0), and environmental damage (n = 0) were excluded from further analysis due to the low number of
reports.
Social/Psychological Outcomes
Near Miss
Illness
Injury
0 10 20 30 40 50 60 70 80
3
8
37
69
Number of incident reports
Out
com
e Ty
pe
Figure 2: Number of campcraft-related incident reports associated with each type of incident outcome.
Incidents by reporting quarter
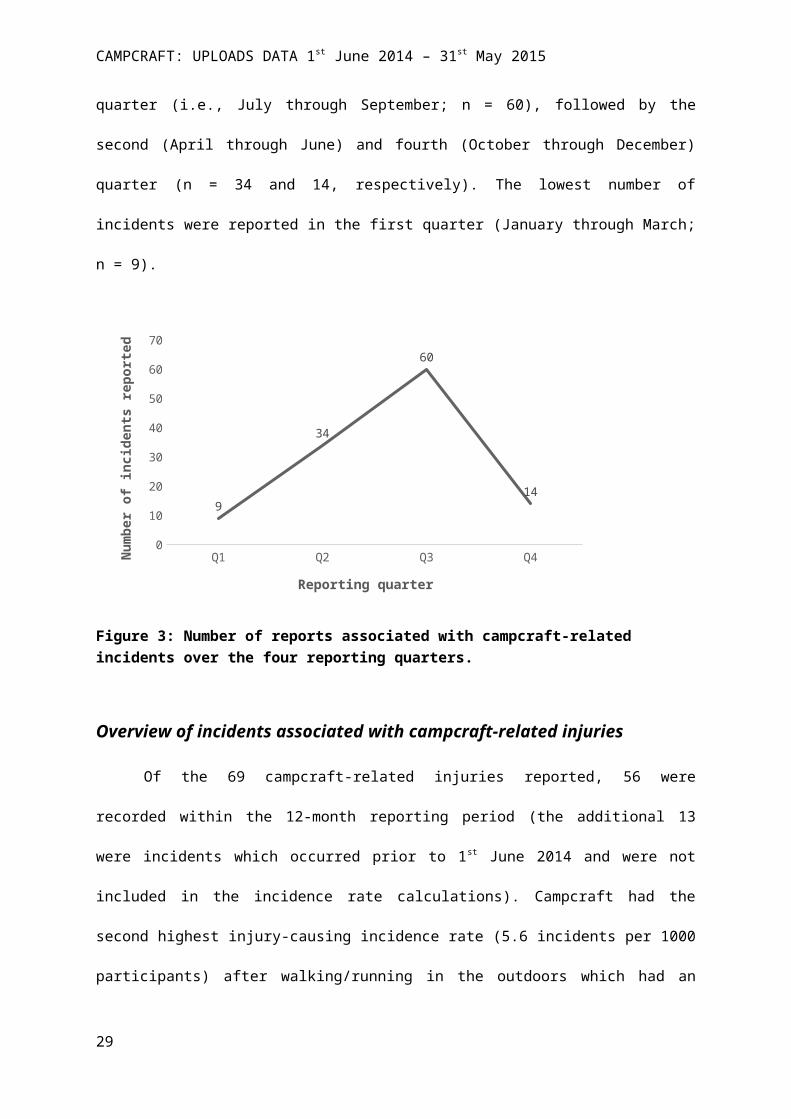
Figure 3 shows the number of incidents reported in each quarter. The majority of the
incidents occurred during the third quarter (i.e., July through September; n = 60), followed by the
second (April through June) and fourth (October through December) quarter (n = 34 and 14,
respectively). The lowest number of incidents were reported in the first quarter (January through
March; n = 9).
20

CAMPCRAFT: UPLOADS DATA 1st June 2014 – 31st May 2015
Q1 Q2 Q3 Q40
10
20
30
40
50
60
70
9
34
60
14
Reporting quarter
Num
ber o
f inc
iden
ts re
port
ed
Figure 3: Number of reports associated with campcraft-related incidents over the four reporting quarters.
Overview of incidents associated with campcraft-related injuries
Of the 69 campcraft-related injuries reported, 56 were recorded within the 12-month
reporting period (the additional 13 were incidents which occurred prior to 1 st June 2014 and were
not included in the incidence rate calculations). Campcraft had the second highest injury-causing
incidence rate (5.6 incidents per 1000 participants) after walking/running in the outdoors which had
an incidence rate of 7.9 incidents per 1000 participants. The average reported injury rate for all led
outdoor activities was 2.1 per 1000 participants. This means that there was approximately 3.5 more
injury-causing incidents reported for every thousand participants involved in campcraft activities,
compared to all led outdoor activities overall. Figure 4 presents a summary of the injury-causing
incidence rate per 1000 participants by activity type for the past 12-month reporting period. Injury-
causing incidents not related to an activity or program are excluded from the figure below (n = 27).
Notably, just over half (55%) of all activities recorded had an injury-causing incidence rate of ≤1 per
1000 participants.
21

CAMPCRAFT: UPLOADS DATA 1st June 2014 – 31st May 2015
Arts & CraftsBeach activities
Horse/Camel ridingTravelling
ArcheryHarness: indoors
Residential campsHarness: outdoors
CavingTeambuilding gamesCurriculum activities
Ocean activitiesRiver activitiesCamping tentsWheel sports
TrampolineFree time outdoors
SnowsportsCampcraft
Walking/running
0 1 2 3 4 5 6 7 8 9
(0/1,180)(0/2,375)(0/436)(0/6,177)
(2/18,491)(2/10,014)(4/15,740)
(34/79,037)(2/4,009)
(26/28,723)(5/5,469)
(17/16,336)(39/27,345)
(29/7,820)(69/18,488)
(3/706)(44/10,168)
(2/378)(56/10,067)
(265/33,757)
Reported injury rate per 1000 participants; (Number injury-causing incidents/Number of participants)/1000
Activ
ity ty
pe
Figure 4: Injury-causing incidence rates per 1000 participants by activity type (June 2014 – May 2015). Numbers in brackets represent the number of reported injury-causing incidents and the number of reported participants associated with the activity, respectively.
22
55% of all activities had an injury-causing incidence rate of ≤1 per 1000 participants.

CAMPCRAFT: UPLOADS DATA 1st June 2014 – 31st May 2015
Actual severity ratings for injury-causing incidents
Figure 5 shows a histogram of actual severity scores for all of the reported campcraft-related
injuries (n = 69). The median severity was 1 (range: 1 to 3) indicating that the majority of injuries
required only localised care with short term effects.
1 2 30
10
20
30
40
50
60
7063
6
0
Actual severity rating
Num
ber o
f inj
ury-
caus
ing
incid
ents
Figure 5: Actual severity ratings for campcraft-related injuries.
These ratings are supported by the findings regarding evacuation, hospitalisation and
emergency services. Six (9%) injury-causing incidents were reported as requiring evacuation (Vehicle
= 4; Walked out = 1; Boat = 1). Of which, only 4 required hospitalisation and none required
Emergency Services.
Injury type and location of campcraft-related injuries
Figure 6 shows the type of campcraft-related injuries sustained according to body location
and number of people injured. Highlighted in red are the body locations associated with the most
injury causing incidents. In addition to those shown on the diagram, 6% of the sample sustained
injuries to unspecified body regions (n = 4).
23

CAMPCRAFT: UPLOADS DATA 1st June 2014 – 31st May 2015
Figure 6: Type of campcraft-related injuries sustained according to body location. Most frequently injured location/s are highlighted by a red circle.
Demographic information for people injured during campcraft activities
The reports included details on 47 injured people (22 of the reports had missing details on
the person injured); Figure 7 shows the number of people injured by role, partitioned by gender. The
majority of the injured Activity Participants were female (29 female, 11 male), with a median age of
16 years (range: 12 to 45 years). The other roles (e.g., Activity Leaders, Staff) were evenly split in
terms of gender (female = 3, male = 4) with a median age of 23 (range: 15 to 58 years).
24

CAMPCRAFT: UPLOADS DATA 1st June 2014 – 31st May 2015
Participant Activity Leader Other0
5
10
15
20
25
30
35
11
41
29
30
Male Female
Role of injured person by gender
Num
ber o
f peo
ple
inju
red
Figure 7: Number of people with a campcraft-related injury by role, partitioned by gender.
Weather for injury-causing incidents related to campcraft
Weather at the time of the incident was rated on a 4-point scale across three dimensions
(Rain, Temperature, and Wind). The majority of injury-causing incidents occurred when there was an
absence of rain (66%); a moderate temperature (66%), and no or minimal wind (59%).
Goals for injury-causing incidents related to campcraft
Eighteen incident reports provided sufficient details regarding activity objectives and were
within the goals of the activity (e.g., cooking, preparing meals). In the remaining 52 reports, data
around activity goals were missing. No further analysis was undertaken.
Profile of activity group for injury-causing incidents related to campcraft
The mean number of participants involved in campcraft activities associated with injury-
causing incidents was 20.6 (range: 1 to 145, n = 70 incidents), the mean number of activity leaders
was 1.7 (range: 1 to 3, n = 60 incidents), supervisors (e.g. teachers) was .9 (range: 1 to 4, n = 56
25

CAMPCRAFT: UPLOADS DATA 1st June 2014 – 31st May 2015
incidents) and there were 4 volunteers (e.g. parents). There was a ratio of 1 activity leader for every
9 participants in campcraft-related injuries.
In 86% of incidents (n = 59), the Activity Leader was reported to have relevant qualifications.
In the remaining 14% of incidents (n = 10) qualifications were reported to be “not applicable”. It is
unclear why campcraft was deemed to not require a leader with appropriate qualifications.
Overview of incidents associated with campcraft-related illnesses
Of the 37 reported campcraft-related incidents associated with illness, 31 were recorded
within the 12-month reporting period. Occurring at an incidence rate of 3.0 incidents per 1000
participants, this was the second highest illness incidence rate in all outdoor led activities, after
camping in tents (6.3 incidents per 1000 participants). Across all activities, the mean reported illness
rate was .57 incidents per 1000 participants. This means that, on average, there are 2.4 more
incidents of illness reported for every thousand participants involved in campcraft alone, compared
to led outdoor activities combined.
Figure 8 presents a summary of the illness rate per 1000 participants by activity type.
Incidents associated with illnesses not related to an activity or program (n = 30) are excluded from
the figure below. Notably, just under half (40%) of all activities recorded were not associated with
any illnesses.
26

CAMPCRAFT: UPLOADS DATA 1st June 2014 – 31st May 2015
ArcheryArts & Crafts
Beach activitiesCaving
Harness: indoorsHorse/Camel riding
SnowsportsTrampoline
Teambuilding gamesHarness: outdoors
Travelling Wheel sports
Curriculum activitiesOcean activitiesRiver activities
Residential campsWalking/running
Free time outdoorsCampcraft
Camping tents
0 1 2 3 4 5 6 7
(0/18,491)(0/1,180)(0/2,375)(0/4,009)(0/10,014)(0/436)(0/378)(0/706)(1/28,723)(3/79,037)
(1/6,177)(3/18,488)(1/5,469)
(4/16,336)(7/27,345)
(6/15,740)(46/33,757)
(17/10,168)(31/10,067)
(49/7,820)
Reported illness rate per 1000 participants; (Number of illness incidents/Number of participants)/1000
Activ
ity ty
pe
Figure 8: Illness rates per 1000 participants by activity type (June 2014 – May 2015). Numbers in brackets represent the number of reported incident associated with illnesses and the number of reported participants associated with the activity, respectively.
27
40% of all activities were not associated with any illnesses.

CAMPCRAFT: UPLOADS DATA 1st June 2014 – 31st May 2015
Actual severity ratings for incidents associated with campcraft-related illnesses
Almost all (n = 35) campcraft-related incidents had an actual severity rating of 1 (range: 0 to
3), indicating that the majority of illnesses required only localised care with short term effects. The
remaining two incidents had a severity rating of 2 (see Figure 9). These ratings are supported by the
findings regarding evacuation, hospitalisation and emergency services as none of the campcraft-
related illness incidents required these services.
1 2 30
5
10
15
20
25
30
35
4035
20
Actual severity rating
Num
ber o
f inj
ury-
caus
ing
incid
ents
Figure 9: Actual severity ratings for campcraft-related illnesses.
Illness type
Of the 37 incidents associated with illnesses, 14 reported illness type (21 incidents were
reported as “unknown”; 2 had missing data). The following illness types were reported: abdominal
problem (n = 4); allergic reaction (n = 4); menstrual (n = 4); respiratory/chest pain (n = 1); and non-
specific fever (n = 1).
Demographic information for ill people
The reports included details on 27 ill people (see Figure 10). In terms of their roles, 19 ill
people were classified as Participants, 6 were Activity Leaders, and there was one Teacher and one
28
CAMPCRAFT: UPLOADS DATA 1st June 2014 – 31st May 2015
Casual Staff Member. All ill Participants were female, with a median age of 16 years (range: 13 to
18). Gender was evenly split in all other roles (4 female, 4 male). The median age of people within
these roles was 27 (range: 15 to 44 years).
Participant Activity Leader Other02468
101214161820
03
1
19
31
Male FemaleRole of ill person by gender
Num
ber o
f ill
peop
le
Figure 10: Number of people with a campcraft-related illness by role, partitioned by gender.
Weather for incidents associated with campcraft-related illnesses
Weather at the time of the incident was rated on a 4-point scale across three dimensions
(Rain, Temperature, and Wind). The majority of illnesses occurred when there was an absence of
rain (71%); a moderate temperature (84%), and no or minimal wind (68%).
Goals for incidents associated with campcraft-related illnesses
The majority of incidents associated with illnesses were missing details regarding the goals
associated with the activity (n = 34 missing classification). Of the goals that were listed, goals were
related to mealtimes (i.e., having breakfast, lunch, or dinner; n = 3). No further analysis was
undertaken.
29

CAMPCRAFT: UPLOADS DATA 1st June 2014 – 31st May 2015
Profile of activity group for incidents associated with campcraft-related illnesses
The mean number of participants involved in activities associated with illnesses was 17
(range: 9 to 23), the mean number of Activity Leaders was 1.8 (range: 0 to 2), Supervisors (e.g.
teachers) was .8 (range: 0 to 2). There were no volunteers (e.g. parents) involved with campcraft-
related incidents associated with illnesses. There was a ratio of 1 Activity Leader for every 8
participants in campcraft-related illness incidents. In almost all incidents (n = 35), the Activity Leader
was reported to have relevant qualifications, in the remaining two incidents qualifications were
reported to be “not applicable”. It is unclear why campcraft is deemed to not require a leader with
appropriate qualifications.
Overview of campcraft-related near miss incidents
In total, eight campcraft-related near misses were reported over the 12-month period,
occurring at an incidence rate of .77 incidents per 1000 participants. In comparison, across all
activities the mean reported near miss incidence rate was .20 incidents per 1000 participants. This
means that, on average, there are .57 more near miss incidents reported for every thousand
participants involved in campcraft alone, compared to led outdoor activities combined.
Figure 11 presents a summary of the near miss incidence rate per 1000 participants by
activity type. Five near miss incidents were not related to an activity or program, so were excluded
from the figure. Notably, 35% of the activity types were not associated with any near miss incidents.
30

CAMPCRAFT: UPLOADS DATA 1st June 2014 – 31st May 2015
Arts & CraftsBeach activities
Curriculum activitiesSnowsports
Teambuilding gamesTrampoline
Residential campsArchery
Free time outdoorsHarness: indoors
Ocean activitiesHarness: outdoors
Wheel sportsWalking/running
CavingRiver activitiesCamping tents
CampcraftTravelling
Horse/Camel riding
0 0.5 1 1.5 2 2.5
(0/1,180)(0/2,375)(0/5,469)(0/378)(0/28,723)(0/706)(0/15,740)
(1/18,491)(1/10,168)(1/10,014)(2/16,336)(11/79,037)
(4/18,488)(8/33,757)(1/4,009)
(11/27,345)(6/7,820)
(8/10,067)(6/6,177)
(1/436)
Reported near miss rate per 1000 participants; (Number of near misses/Number of participants)/1000
Activ
ity ty
pe
Figure 11: Near miss incidence rates per 1000 participants by activity type (June 2014 – May 2015). Numbers in brackets represent the number of reported incidents associated with near misses and the number of reported participants associated with the activity, respectively.
31
35% of all activities were not associated with any near misses.

CAMPCRAFT: UPLOADS DATA 1st June 2014 – 31st May 2015
Potential severity of campcraft-related near miss incidents
Near misses were rated in terms of potential severity (i.e. the worst possible outcome, given
the scenario). Figure 12 shows a histogram of potential severity scores for near miss incidents. The
median severity was 3 (range: 0 to 6). A severity rating of 3 indicates an incident where the potential
outcome to risks encountered is such that it may cause major irreversible damage or threaten life.
1 2 3 4 5 60
0.5
1
1.5
2
2.5
3
3.5
0
2
3
2
0
1
Potential severity rating
Num
ber o
f nea
r miss
incid
ents
Figure 12: Potential severity ratings for campcraft-related near miss incidents.
Demographic information for campcraft-related near miss incidents
The reports included details on 6 people involved in near miss incidents. In terms of their
roles, 2 identified as participants; 2 were activity leaders; one was a field/program manager; and one
was a first year intern. Both participants were male, with a mean age of 12.5 years (range: 12-24
years). Both the intern and the field manager were male; and gender was evenly split in the activity
leader role (see Figure 13).
32

CAMPCRAFT: UPLOADS DATA 1st June 2014 – 31st May 2015
Participant Activity Leader Other0
0.5
1
1.5
2
2.5
3
3.5
2
1
3
0
1 1
Male Female
Role of person involved by gender
Num
ber o
f peo
ple
Figure 13: Number of people involved in campcraft-related near miss incidents by role, partitioned by gender.
Weather at the time of the campcraft-related incidents
Weather at the time of the incident was rated on a 4-point scale across three dimensions
(Rain, Temperature and Wind). The majority of near misses occurred when there was an absence of
or minimal rain (50%; “1” = 3, “2” = 1, “3” = 2, “4” = 0, missing = 2); a moderate temperature (50%;
“1” = 0, “2” = 3, “3” = 1, “4” = 0, missing = 4), and no or minimal wind (50%; “1” = 4, missing = 4).
Goals for campcraft-related near miss incidents
The majority of incidents associated with near miss incidents were missing details regarding
the goals associated with the activity (n = 6 missing classification). No further analysis was
undertaken.
Profile of activity group for campcraft-related near miss incidents
The mean number of participants involved in activities associated with near misses was 12.8
(range: 0 to 23, n = 8 incidents) and the mean number of Activity Leaders was .9 (range: 0 to 2, n = 5
incidents). There were no Supervisors (e.g. teachers) or volunteers (e.g. parents) involved campcraft-
33

CAMPCRAFT: UPLOADS DATA 1st June 2014 – 31st May 2015
related incidents associated with near misses. There was a ratio of 1 Activity Leader for every 12
participants in campcraft-related near miss incidents.
In almost all campcraft-related near miss incidents (n = 7), qualifications were reported to be
“not applicable” for the Activity Leader (only one incident reported that the Activity Leader had
relevant qualifications). This is potentially a cause for concern, as it is unclear why campcraft was
deemed to not require a leader with appropriate qualifications.
Contributing factors of campcraft-related incidents
One-hundred-seventeen campcraft (e.g. camping and cooking) incidents related to injury,
illness or near miss occurred in the period from the 1st of June 2014 through to the 31st of May 2015.
Of these incidents, only 31% (n = 36) of the incident reports included sufficient detail to be coded
further using the UPLOADS accident analysis method (See Figure 1). Of these 36 incidents, 67% (n=
24) involved an injury, 17% (n = 6) involved an illness and another 17% (n = 6) involved a near miss. A
summary of the contributory factors and relationships identified is presented in Figure 14.
34

CAMPCRAFT: UPLOADS DATA 1st June 2014 – 31st May 2015
Government department decisions and actions
Regulatory bodies and associations
Local area government, schools, parents & carers,
and higher level management
Supervisory and management decisions and
actions
Decisions and actions of leaders, participants and
other actors at the scene of the incident
Equipment, environment and meteorological
conditions
Supervisors/Field Managers: Activity or Program Design
(3) 8.3%
Activity Equipment & Resources:
Equipment, Clothing and Personal
Protective Equipment (21) 58.3%
Activity Environment: Infrastructure and Terrain (1) 2.8%
Activity Leader: Communication, Instruction and Demonstration
(5) 13.9%
Parents & Carers: Communication (2)
5.6%
Activity Equipment & Resources:
Documentation (2) 5.6%
Activity Environment: Animal and Insect Hazards (1) 2.8%
Activity Leader: Judgement and Decision-
making (1) 2.8%
Activity Leader: Supervision and Leadership of Activity
(2) 5.6%
Activity Leader: Planning and
Preparation (1) 2.8%
Activity Participant: Communication and
Following Instructions (5) 13.9%
Activity Participant: Compliance with Procedures, Violations and Unsafe Acts
(5) 13.9%
Activity Participant: Experience and
Competence (12) 33.3%
Activity Participant: Judgement and Decision-making
(11) 30.6%
Activity Participant: Mental and Physical Condition (2) 5.6%
Activity Participant: Situation Awareness
(7) 19.4%
Activity Participant: Other (1) 2.8%
Activity Equipment & Resources: Food and
Drink (9) 25.0%
Activity Environment: Weather (2) 5.6%
Activity Leader: Compliance with Procedures, Violations and Unsafe Acts (1) 2.8%
Activity Leader: Situation Awareness
(1) 2.8% (2) 5.6%
(1) 2.8%
(1) 2.8%
(1) 2.8%
(1) 2.8%
(1) 2.8%
(1) 2.8%
Activity Participant: Planning and
Preparation (1) 2.8%
(1) 2.8%
35
Figure 14: Factors and relationships identified which contributed to incidents (n=36). Factors identified in more than one report are shaded in grey, and relationships identified in more than one report are bolded.

CAMPCRAFT: UPLOADS DATA 1st June 2014 – 31st May 2015
Government Department Decisions and Actions, and Regulatory Bodies and Associations
No reports identified factors at the Government Department or Regulatory Body levels that
contributed to an injury.
Local Area Government, Schools, Parents & Carers, Higher Level Management
Two reports identified a factor at the ‘Local Area Government, Schools, Parents & Carers,
Higher Level Management’ level, which contributed to an illness. Both reports stated that the
parents had not listed certain information on the medical form, which had contributed to the
participants’ illness.
One relationship was identified between ‘Parents & Carers: Communication’, and ‘Activity
Equipment & Resources: Documentation’, which influenced the conduct of activities. This is shown
in Table 4.
Table 4: The relationships between “Parents & Carers: Communication” and “Activity Equipment & Resources: Documentation”, influencing the conduct of activities
Factor 1 Factor 2 Examples n
Parents & Carers: Communication
Activity Equipment & Resources: Documentation
Parents did not notify this on the student’s medical or dietary form 2
Supervisory and Management Decisions and Actions
Four reports identified factors at the ‘Supervisory and Management Decisions and Actions’
level which contributed to an injury. Table 5 shows the contributing factors underpinning each
category at this level of the Accimap.
Table 5: Contributing factors related to each category represented on the Accimap at the “Supervisory and management decisions and actions” level
Category and contributing factors nSupervisor/Field Manager: Activity or Program DesignStudents were too inexperienced for program and no education or training was provided 2Inherent risk of activity 2
36

CAMPCRAFT: UPLOADS DATA 1st June 2014 – 31st May 2015
One relationships was identified between ‘Supervisor/Field Manager: Activity or Program
Design’ and a lower level factor in the system, which impacted the conduct of the activity and led to
an injury. This is presented in Table 6.
Table 6: The relationships between ‘Supervisor/Field Manager: Activity or Program Design’ and factors at lower levels, influencing the conduct of activities
Factor 1 Factor 2 Examples n
Supervisor/Field Manager: Activity or Program Design
Activity Leader: Communication, Instruction and Demonstration
Prior to activity, it was not identified whether students had previous experience with food preparation, so the design did not include training on safe cutting techniques
1
Decisions and Actions of Leaders, Participants, and Other Actors at the Scene of the Incident
Thirty-one reports identified factors at the ‘Activity Leader, Participant and other Actors at
the Scene’ level, which contributed to an incident (20 injuries, 6 illnesses and 5 near miss incidents).
The role of Activity Leaders
Table 7 shows examples of the contributing factors related to the Activity Leader categories.
Table 7: Contributing factors related to the “Activity Leader” categories
Category and contributing factors nActivity Leader: Communication, Instruction and DemonstrationMore instruction or briefing required for activity 4Unclear instructions provided by Activity Leader 1Dangers of activity were not communicated 1Activity Leader: Supervision and Leadership of ActivityInadequate supervision or leadership (general) 2Activity Leader: Judgement and Decision-makingDecision to provide a known allergen food source to a participant 1Activity Leader: Planning and PreparationGas lead to BBQ was connected correctly 1Activity Leader: Situation AwarenessInsufficient awareness around hot water 1Activity Leader: Compliance with Procedures, Violations and Unsafe ActsFailed to check whether cooking equipment was assembled correctly prior to use 1
37

CAMPCRAFT: UPLOADS DATA 1st June 2014 – 31st May 2015
Two relationships were identified between Activity Leader factors and a factor at an equal or
lower levels in the system, which impacted the conduct of activities. These are presented in Table 8,
including the type of incident involved.
Table 8: The relationships between Activity Leader factors and factors at lower levels, influencing the conduct of activities
Factor 1 Factor 2 Examples n
Activity Leader: Supervision and Leadership of Activity
Activity Leader: Judgement and Decision-making
Due to incorrect supervision, participant was not removed from the group earlier (injury)
1
Activity Leader: Planning and Preparation
Activity Equipment & Resources: Equipment, Clothing and Personal Protective Equipment
Gas lead to BBQ was not connected correctly (near miss) 1
The role of Activity Participants
Table 9 shows examples of the contributing factors related to the Activity Participant
categories.
Table 9: Contributing factors related to the Activity Participant categories
Category and contributing factors nActivity Participant: Communication and Following InstructionsNot following instructions (general) 3Not attentive to activity briefing 1Did not follow direction for correct sitting position 1Activity Participant: Compliance with Procedures, Violations and Unsafe ActsNot using PPE gloves 2Not complying with activity procedures 1Not engaging with equipment safely 1Accidently hitting other participant with equipment 1Activity Participant: Experience and CompetenceLack of experience (general) 7Inexperience with a trangia 2Inexperience with a can opener 1Inexperience with lighting matches 1Lack of experience with using a knife 1
38

CAMPCRAFT: UPLOADS DATA 1st June 2014 – 31st May 2015
Table 9 (cont.): Contributing factors related to the Activity Participant categories
Activity Participant: Judgement and Decision-makingActions and decisions around heat and fires involving food preparation 7Judgement and decision-making (general) 3Decision to remove hot marshmallow from stick 2Activity Participant: Mental and Physical ConditionAnxiety during campcraft activities 1Food allergy 1Activity Participant: Planning and PreparationStudent was not sufficiently prepared for cooking on fires 1Activity Participant: Situation AwarenessNot paying attention to surroundings 4Equipment inattention 2Distraction 1Activity Participant: OtherCarelessness 1
Five relationships were identified between Activity Participant factors and factor at lower
levels in the system, which impacted the conduct of activities. These are presented in Table 10.
Table 10: The relationships between Activity Leader factors and factors at lower levels, influencing the conduct of activities
Factor 1 Factor 2 Examples n
Activity Participant: Experience and Competence
Activity Equipment & Resources: Equipment, Clothing and Personal Protective Equipment
Inexperience with this type of can opener was certainly a contributing factor (injury)
1
Activity Participant: Experience and Competence
Activity Participant: Planning and Preparation
Insufficient time spent in the camp and therefore insufficient readiness for cooking on fire (injury)
1
Activity Participant: Judgement and Decision-making
Activity Equipment & Resources: Food and Drink
Participant’s haste to try our food combined with a lack of judgement on heat and hazard of fires (injury)
1
Activity Participant: Mental and Physical Condition
Activity Equipment & Resources: Food and Drink
Participant reported he had vomited in the past after eating creamy or cheesy food (illness)
1
39

CAMPCRAFT: UPLOADS DATA 1st June 2014 – 31st May 2015
Equipment, Environment and Meteorological Conditions
Thirty-two reports identified factors at the ‘Equipment, Environment and Meteorological
Conditions’ level which contributed to an incident (20 injuries, 6 illnesses and 6 near-miss incidents).
The factors associated with Activity Equipment & Resources are presented in Table 11. The factors
associated with Activity Environment are presented in Table 12.
Table 11: Contributing factors related to “Activity Equipment & Resources” categories
Category and contributing factors nActivity Equipment & Resources: DocumentationNot enough detail on medical or dietary form 2Activity Equipment & Resources: Equipment, Clothing and Personal Protective EquipmentBurns related to cooking equipment (e.g. trangia or hot pan) 13Cuts or lacerations related to sharp equipment (e.g. knife, saw) 5Lack of appropriate equipment 2Faulty equipment 1Slippery equipment 1Activity Equipment & Resources: Food and DrinkHot food or water causing burns 6Consumption of foods with allergy 2Anxiety related to new or different food 1
Table 12: Contributing factors related to “Activity Environment” categories
Category and contributing factors nActivity Environment: Animal and Insect hazardsInsect (unknown) bite during cooking 1Activity Environment: Infrastructure and TerrainTripped due to uneven terrain with exposed rocks 1Activity Environment: WeatherRain necessitated the use of trangia stoves 2
Four relationships were identified between factors at this level and higher levels in the
system as shown in Table 8 and Table 10. No relationships were identified between ‘Activity
Equipment & Resources’ and ‘Activity Environment’.
40

CAMPCRAFT: UPLOADS DATA 1st June 2014 – 31st May 2015
Discussion
Campcraft activities were found to have the second highest incidence rate in the UPLOADS
12-month National Trial (van Mulken et al, 2016). The aims of this report are to: present a detailed
overview of all the campcraft (e.g. cooking and campfires) data identified in the UPLOADS National
Incident Dataset during its first 12 months; to provide a holistic and in-depth understanding of these
campcraft-related incidents that occurred within led outdoor activities in Australia; and to promote
discussion within the sector regarding potential prevention strategies and countermeasures. To
further promote this discussion, the following sections reflect on the key findings and themes and
outline some of the key implications for the sector that can serve as guidance for future
countermeasure development.
Incidence rates, contributing factors and solutions
Compared to the average incidence rates of 2.1 injuries per 1000 participants for all led
outdoor activities combined, campcraft-related activities had an incidence rate of 5.6 injuries per
1000 participants. This means that, during the 12 month reporting period, there was approximately
3.5 more injury-causing incidents reported for every thousand participants involved in campcraft
activities, compared to all led outdoor activities overall.
An analysis of the contributing factors underpinning campcraft injury, illness and near miss
incidents identified contributing factors across the lower four levels of the UPLOADS accident
analysis framework (see Figure 14). This means that the known contributing factors that interact to
create campcraft-related incidents involve many actors including the activity environment,
equipment, activity leaders, activity participants, supervisors/field managers, and parents/carers. It
can therefore be concluded that the network of events preceding campcraft-related incidents
involve the decisions and actions of many actors from across the overall system, rather than simply
the outcome of participant or instructor actions. A key implication of this finding is that interventions
developed by organisations and the sector need to focus on factors across the whole sector, rather
41

CAMPCRAFT: UPLOADS DATA 1st June 2014 – 31st May 2015
than only on instructors, equipment, and the environment. An example of this from the present
analysis is the need for parents or carers to provide sufficient information requiring the dietary
needs of activity participants.
Although a range of contributing factors were identified, it is worth examining those that
were most frequently involved in the incidents analysed. The most frequently identified contributing
factors at each level were: Level 1: Equipment, Clothing and Personal Protective Equipment
(identified in 58% of incidents analysed); Level 2: Activity Participant Experience and Competence
(identified in 33% of incidents analysed); Level 3: Supervisors/Field Managers Activity or Program
Design (identified in 8% of incidents analysed); Level 4: Parents & Carers: Communication (identified
in 6% of incidents analysed). These findings suggest that campcraft incident prevention interventions
should focus on: the equipment being used during campcraft activities (e.g. cooking equipment); the
ability of participants to safely undertake campcraft activities (e.g. ability to handle cooking
equipment, utensils); briefing and supervisory activities related to campcraft activities; and the
information requirements surrounding campcraft activities, such as dietary needs, existing illnesses,
and allergies. Potential countermeasures are discussed in the following section.
What now?
Implications for intervention design
Understanding campcraft-related incidents is a complex endeavour and the same is true for
developing countermeasures that target the overall system. While the most frequently identified
contributory factors (outlined above) provide an indication of the key areas for targeted
countermeasures, it is recommended that a network of countermeasures be used to tackle
campcraft-related incidents. It is proposed that this network should include interventions targeted at
least at the four lower levels of the LOA system (see Figure 1).
That said, it appears that some simple interventions could prove beneficial. For example, the
majority of the factors associated with equipment, food and drink relate to the fact that cooking
42

CAMPCRAFT: UPLOADS DATA 1st June 2014 – 31st May 2015
equipment is either hot or dangerous (e.g. heat source, sharp knife) or that the food or drink is hot
(e.g. boiling water), which cannot be removed via interventions as cooking always requires these
features. Targeted interventions should therefore focus on ensuring that participants are better able
to operate cooking equipment and handle hot/dangerous utensils and food. Additionally,
supervision of campcraft activities could be improved as well as field staff’s awareness and
understanding of the risks associated with campcraft activities.
In addition to these simple targeted interventions, the following system-wide
countermeasures provide a more sustainable and therefore more effective approach to campcraft
incident prevention. First, programs could incorporate a campcraft educational component whereby
a dedicated portion of the activity or camp is used to demonstrate and teach participants how to
cook outdoors (e.g. with fires) and operate cooking equipment such as trangias, can openers, and
sharp knives. Fire safe behaviours and safe handling of hot water, hot food and hot utensils should
also be included. In this sense, campcraft activities including campfires and cooking should be
treated as led outdoor activities rather than free-time and should have briefings similar to other
formal or structured activities. From a risk management perspective, there is no reason why
abseiling down the side of a mountain should be treated differently to cooking dinner for the group
(Dallat, 2016).
Second, care should be taken to ensure that the instructions or briefings given before
campcraft activities are: a) comprehensive, and b) fully attended to by participants. It may be
worthwhile using measures such as incorporating demonstrations by participants to ensure that they
have understood what is required of them during the campcraft activity. This should cover the entire
activity; for example, in the case of cooking, this would include all activities from the setup of
cooking equipment and food preparation, to cooking, serving and cleaning up. Again, it is
recommended that the instructions and briefings are treated in the same manner as the instructions
and briefings given for other structured outdoor activities such as kayaking, high ropes courses, and
abseiling.
43

CAMPCRAFT: UPLOADS DATA 1st June 2014 – 31st May 2015
Third, it appears that supervision around campcraft activities could also be improved (Dallat,
2016). This could be driven through changes to policy and program design. For example, policies
around campcraft activities could be modified to ensure minimum supervision levels are adhered to.
Designing programs so that campcraft activities are included as a structured activity rather than free
time would also be beneficial, and in turn would ensure that supervision does not wane during
campcraft-related activities. It is important to note here that activity leader qualifications and
training may also need to be addressed. Of the 117 campcraft-related incidents reported in the 12-
month dataset, qualifications were reported to be “not applicable” for the activity leader in 16% (n =
19) of the reported incidents. Although this was reported in a relatively small percentages of the
reports, it is potentially a cause for concern, as it is unclear why campcraft was considered to not
require an appropriately qualified leader.
In response to the campcraft-related incidents reported in the UPLOADS 12 month National
Trial report, Dallat (2016) provided an experience-based account of campcraft-related incidents in
relation to these findings. In doing so, a series of key issues were outlined as significant contributing
factors in campcraft-related incidents, for example:
cooking is treated not like an activity and thus is afforded a more relaxed approach both in
participant briefing and supervision;
activity supervisory practices may not be maintained during cooking activities;
cooking, heat, and food preparation is a foreign activity to many activity participants;
there is a lack of policy around stove positions and seating positions in front of stoves; and
risk assessments do not sufficiently cover cooking hazards.
When applying Dallat’s (2016) conclusions to the countermeasure suggested in this report, it
would appear that avenues such as improving campcraft activity risk assessments, providing better
instructions and demonstrations to participants, and ensuring appropriate levels of supervision
would all be beneficial in preventing campcraft-related incidents. The overriding conclusion of both
44

CAMPCRAFT: UPLOADS DATA 1st June 2014 – 31st May 2015
the UPLOADS campcraft analyses and Dallat’s (2016) discussion is that the management of
campcraft activities as a structured led outdoor activity (as opposed to a free time-related activity)
will enhance safe practice and remove some of the key risks identified.
Limitations
It should be acknowledged that UPLOADS is a relatively new initiative and that there remain
opportunities for improvement. Accordingly, there are several limitations worthy of mention in
relation the analyses presented. First, generalisability to the wider LOA sector is potentially limited
due to the short period of data collection and limited number of organisations who contributed
data. This will improve as more organisations begin to use UPLOADS and a larger dataset is
developed over time.
Second, the reported incidence rates may underestimate the actual incidence of injuries,
illnesses, and near misses for various reasons, such as underreporting of incidents that do not
require treatment or organisations choosing not to report more serious incidents. However, the
large number of minor incidents that were reported indicates that the organisations involved in the
study do report this type of incident.
Third, the low number of reported near miss incidents (relative to injury and illness reports)
suggests that this area warrants further attention within organisations and from the UPLOADS
research team. It may indicate that there is not a strong culture of reporting near miss incidents
within the sector.
Fourth, the overall participation data does not include gender specific information. The
organisations that contribute data only provide a total number of people who were involved in the
incident. Caution is therefore urged when reviewing the demographic information for campcraft-
related injuries, illnesses and near miss incidents presented in this report.
Finally, less than a third (31%) of all reported campcraft-related incidents contained
sufficient associated information to support further analysis with the UPLOADS Accident Analysis
45

CAMPCRAFT: UPLOADS DATA 1st June 2014 – 31st May 2015
Method. Consequently, critical information regarding incident causation could not be gleaned from
approximately a third of injury incident reports. Further work with the LOA sector is required to
increase the quality of the incident descriptions. Despite these limitations, the analysis presented
represents the most comprehensive incident data available for led outdoor activities in Australia to
date.
Conclusion
There are a number of important conclusions that can be drawn from the analysis
presented. First, based on analysis of the first 12 months of incident data reported through
UPLOADS (see van Mulken et al, 2016), campcraft-related activities represent an important area of
focus for injury prevention efforts in the Australian LOA sector. Second, campcraft-related incidents
have various contributory factors related to the activity environment and equipment (e.g. cooking
equipment, boiling water, fire), the activity leader (e.g. instructions provided), activity participants
(e.g. experience and competence), supervisors/field managers (e.g. program design), and
parents/carers (e.g. the communication of important dietary information. Third, whilst there are a
series of targeted interventions that may provide a short term benefit, in the long term a network of
countermeasures designed to enhance campcraft practice is required. These countermeasures
should focus on all levels of the Australian LOA system.
46

CAMPCRAFT: UPLOADS DATA 1st June 2014 – 31st May 2015
References
Dallat, C. (2016, April 29). All Burnt Out: Extinguishing Old Assumptions around Outdoor Cooking [Web log post]. Retrieved from http://uploadsproject.org.
Dickson, T. J. (2012). Learning from injury surveillance and incident analysis. In T. J. Dickson & T. Gray (Eds.), Risk Management in the Outdoors: A Whole-of-Organisation Approach for Education, Sport and Recreation (pp. 204-230). Cambridge University Press: Cambridge, GB.
van Mulken, M., Clacy, A., Grant, E., Goode, N., Stevens, E., Salmon, P. (2016). The UPLOADS National Incident Dataset, The First Twelve Months: 1st June 2014 to 31st May 2015. Retrieved from https://uploadsproject.files.wordpress.com/2016/03/first-12-month-report_final.pdf
47