2015 q3 report - randgold resources for...report for the third quarter ended 30 september 2015...
TRANSCRIPT

London, 5 November 2015 – Randgold Resources boosted production to a new record level in the third quarter of the year on the back of a steady all-round operational performance while stepping up exploration programmes designed to find its next world-class discovery as well as to expand its existing reserves.
Gold production for the quar ter was 305 288 ounces, up more than 5 000 ounces on Q2, with Kibali and Morila doing exceptionally well. Heavy rains in Mali resulted in a pump system failure at Loulo, which temporarily cut off access to the high grade ore sections underground at Yalea. This resulted in lower than forecast grades and production, impacting on total cash cost per ounce, which rose to $699/oz (Q2: $684/oz). A further drop in the gold price also depressed profits, which were $48.8 million against the previous quarter’s $59.2 million.
November 20152
015Q3 Report
KIBALI SHAFT SIGNALS SUCCESS13 RESEARCH &
TECHNOLOGY DRIVE DISCOVERIES1614 EXPANDING LOCAL
DEVELOPMENT20
In t
his
issu
e... MAJOR AGRI-TRAINING
INITIATIVE
Continued on page 19
CEO Mark Bristow at the Loulo mine
Key Performance Indicators
Another record gold production quarter
Cash cost per ounce up slightly quarter on quarter, in line with corresponding quarter of prior year
Profit down due to lower average grade and gold price received
Increase in cash from operations strengthens balance sheet
Good performance by Loulo-Gounkoto despite operational challenges
Kibali on track to beat 600 000oz full year guidance
Morila continues to deliver on plan and advances Domba project
Tongon improves all-round operational performance and repays shareholder loans
Exploration team plans regional VTEM survey in Côte d’Ivoire and gears up for new field season
Positive drill results from Sofia point to additional potential at Massawa
RANDGOLD POSTS NEW PRODUCTION RECORD, SPEEDS UP EXPLORATION DRIVE

Report for the third quarter ended 30 September 2015
Randgold Resources Limited (‘Randgold’) had 93.2 million shares in issue as at 30 September 2015.
PAGE TWO
SUMMARISED FINANCIAL INFORMATION
$000
Quarterended30 Sep
2015
Quarter ended 30 Jun
2015
Quarterended
30 Sep2014
9 monthsended30 Sep
2015
9 monthsended
30 Sep2014
Average gold price received ($/oz) 1 122 1 189 1 277 1 174 1 288
Gold sales1 340 723 354 776 376 796 1 040 131 1 094 933
Total cash costs1 212 300 204 012 204 140 617 087 589 163
Profit from mining activity1 128 423 150 764 172 656 423 044 505 770
Exploration and corporate expenditure 9 791 12 992 8 897 31 460 33 284
Profit for the period 48 761 59 173 66 032 159 248 216 781
Profit attributable to equity shareholders 42 345 53 601 58 008 144 149 185 351
Net cash generated from operations 109 678 71 446 125 149 282 844 248 289
Cash and cash equivalents2 168 434 109 249 63 424 168 434 63 424
Gold on hand at period end3 12 812 11 688 11 993 12 812 11 993
Group production (oz) 305 288 300 039 299 320 884 858 860 366
Group sales1 (oz) 303 718 298 421 295 018 885 763 850 410
Group total cash cost per ounce1 ($) 699 684 692 697 693
Group cash operating cost per ounce1 ($) 643 627 632 642 630
Basic earnings per share ($) 0.45 0.58 0.63 1.55 2.00
1 Refer to explanation of non-GAAP measures provided. Randgold consolidates 100% of Loulo, Gounkoto and Tongon, 40% of Morila and 45% of Kibali in the consolidated non-GAAP measures.
2 Cash and cash equivalents excludes $8.3 million of cash at 30 September 2015 (an overdraft of $0.2 million at 30 September 2014 and $16.7 million of cash at 30 June 2015) that relates to the group’s attributable cash held in Morila, Kibali and the group’s asset leasing companies which are equity accounted.
3 Gold on hand represents gold in doré at the mines (attributable share) multiplied by the prevailing spot gold price at the end of the period.
The results in this report have been neither reviewed nor audited. All financial numbers are in US dollars ($) unless otherwise stated.
COMMENTSGold sales for the quarter of $340.7 million decreased by 4% compared to the previous quarter, on the back of a 6% drop in the average gold price received of $1 122/oz (Q2 2015: $1 189/oz). This was partially offset by the increased gold production quarter on quarter, following another record quarter of production for the group. The increase in gold production resulted from an increase in ounces sold at the Loulo complex, due to improved recoveries quarter on quarter, as well as at Tongon, driven by increased throughput, grade and recovery.
Compared to the corresponding quarter of 2014, gold sales were down 10% as a result of a 12% decrease in the average gold price received (Q3 2014: $1 277/oz), partially offset by the increase in the number of ounces sold.
Total cash costs for the quarter of $212.3 million were up 4% compared with the previous quarter, as well as with the corresponding quarter in 2014, in line with the increased throughput. Total cash costs increased
at Gounkoto, where additional stripping was undertaken during the rainy season, and at Tongon and Kibali as a result of additional throughput. Total cash cost per ounce was slightly up from the previous quarter, mainly due to lower grades and production at Kibali and Morila, and in line with the corresponding quarter of 2014.
Profit from mining was down 15% quarter on quarter and by 26% from the corresponding quarter of 2014, due to the drop in gold prices received as well as increased cash costs, as described above.
Exploration and corporate expenditure of $9.8 million for the current quarter decreased by 25% from the previous quarter due to decreased exploration fieldwork and drilling activity, in line with plan for the rainy season in West Africa. Expenditure increased by 10% compared to the corresponding quarter in 2014, in line with a relative increase in exploration activity.
Depreciation and amortisation of $39.4 million decreased by 8% against the previous quarter and was in line with the corresponding quarter in 2014, reflecting revisions made to estimates associated with the unit of production calculations.
Other income of $6.7 million increased by 76% from the previous quarter’s $3.8 million and by 429% from the corresponding quarter in 2014 of $1.3 million. Other income includes management fees from Morila and Kibali. Other income also includes operational exchange gains. These arise from the settlement of invoices in currencies other than the US dollar, as well as the translation of balances denominated in currencies such as South African rand, Canadian dollar and the euro to the US dollar rate and reflect movements in these currencies during the quarter.
Share of profits from equity joint ventures decreased by $20.2 million from the previous quarter and by $4.4 million from the corresponding quarter in 2014, to $13.4 million. The decrease quarter on quarter is the result of reduced production and profits at Kibali during the quarter, as a result of a planned drop in grade and recovery. In addition, profits from Morila decreased quarter on quarter in line with production at the mine.
Income tax expenses of $8.6 million decreased by 33% quarter on quarter and by 37% from the corresponding quarter in 2014. The decrease from the prior quarter is in line with lower profitability at the Loulo complex.
Basic earnings per share dropped 22% to $0.45 (Q2 2015: $0.58) quarter on quarter, and by 29% from the corresponding quarter in 2014, following the movements in profit mentioned above.
OPERATIONSLOULO-GOUNKOTO COMPLEXThe combined quarterly gold production for the Loulo-Gounkoto complex was 162 246oz ( Loulo 93 202oz and Gounkoto 69 044oz), an increase of 4% compared to the previous quarter (Q2 2015: 155 989oz). Tonnes processed during the quarter decreased slightly by 1% to 1 140kt (Q2 2015: 1 148kt), while the head grade milled was in line at 4.8g/t. Recoveries improved significantly by 3% to 91.4%, resulting in a decrease in total cash cost per ounce to $683/oz (Q2 2015: $686/oz) following the increase in ounces produced.
The significant increase in plant recovery resulted from additional interventions by management, including the implementation of improved blending based on advanced bottle roll recovery prediction, similar to advanced grade control. Laboratory test work was conducted on

PAGE THREE
each individual ore source to predict recoveries ahead of mining. A recovery committee consisting of geologists, metallurgists and miners is actively working to build a geo-metallurgical database to improve our understanding of the orebodies. Yalea orebodies previously defined in two areas (inside and outside the Purple Patch) were revisited and requalified into five distinct domains based on copper and arsenic threshold. Composites were collected to conduct offsite test work to better understand the metallurgical response. Two technical audits were also conducted during the quarter, on the gravity circuit and to identify gaps to enhance plant performance.
LOULO-GOUNKOTO COMPLEX RESULTS
Quarterended30 Sep
2015
Quarterended30 Jun
2015
Quarterended
30 Sep2014
9 monthsended30 Sep
2015
9 monthsended
30 Sep2014
Mining
Tonnes mined (000) 8 208 7 779 7 301 22 912 20 101
Ore tonnes mined (000) 1 019 1 203 1 018 3 410 3 454
Milling
Tonnes processed (000) 1 140 1 148 1 091 3 358 3 321
Head grade milled (g/t) 4.8 4.8 5.1 4.6 5.2
Recovery (%) 91.4 88.8 90.4 89.5 90.4
Ounces produced 162 246 155 989 160 285 447 468 503 090
Ounces sold 160 156 154 737 158 047 449 314 498 238
Average price received ($/oz) 1 121 1 187 1 278 1 172 1 287
Cash operating costs1 ($/oz) 615 615 599 641 570
Total cash costs1 ($/oz) 683 686 675 712 647
Gold on hand at period end2 ($000) 6 987 4 897 5 901 6 987 5 901
Profit from mining activity1 ($000) 70 201 77 600 95 263 206 882 318 930
Gold sales1 ($000) 179 520 183 709 201 994 526 574 641 0941 Refer to explanation of non-GAAP measures provided.2 Gold on hand represents gold in doré at the mines multiplied by the prevailing spot
gold price at the end of the period.
LOULOOne LTI was recorded during the quarter with an LTIFR of 0.69 per million hours worked versus 1.42 recorded in the previous quarter. No major environmental incident or social grievance occurred this quarter. A legal environmental audit showed that the mine is compliant with national legal requirements. The other requirements, which the mine has subscribed to, will be audited in Q4. A microfinance business was opened during the quarter in order to reinforce local economic development.
On a standalone basis, Loulo produced 93 202oz of gold (Q2 2015: 97 460oz) at a total cash cost of $750/oz (Q2 2015: $730/oz). The decrease in production was due to a 3% decrease in tonnes processed, a 4% decrease in head grade milled and partially offset by a 2.6% improvement in recoveries, following an increased focus on the ore blend and proactive adjustment of reagents according to the ore feed ratio.
Profit from mining of $34.2 million was 22% lower than the previous quarter of $43.9 million, reflecting the lower gold production and gold sales, increased cost of production resulting from the lower head grade milled and lower average gold price received.
LOULO STANDALONE RESULTS
Quarterended30 Sep
2015
Quarterended30 Jun
2015
Quarterended
30 Sep2014
9 monthsended30 Sep
2015
9 monthsended
30 Sep2014
Mining
Tonnes mined (000) 630 667 713 1 989 2 141
Ore tonnes mined (000) 616 642 693 1 930 2 036
Milling
Tonnes processed (000) 680 702 714 1 983 1 948
Head grade milled (g/t) 4.7 4.9 5.1 4.6 5.1
Recovery (%) 91.4 88.8 90.4 89.5 90.4
Ounces produced 93 202 97 460 105 238 261 728 288 299
Ounces sold 92 379 96 196 103 195 263 952 285 073
Average price received ($/oz) 1 121 1 187 1 277 1 173 1 287
Cash operating costs1 ($/oz) 683 659 593 701 606
Total cash costs1 ($/oz) 750 730 670 771 683
Gold on hand at period end2 ($000) 3 967 3 206 3 924 3 967 3 924
Profit from mining activity1 ($000) 34 243 43 939 62 653 105 896 172 026
Gold sales1 ($000) 103 541 114 192 131 787 309 509 366 760Randgold owns 80% of Société des Mines de Loulo SA (Loulo) and the State of Mali 20%. Randgold has funded the whole investment in Loulo by way of shareholder loans and therefore controls 100% of the cash flows from Loulo until the shareholder loans are repaid.Randgold consolidates 100% of Loulo and shows the non-controlling interest separately.1 Refer to explanation of non-GAAP measures provided.2 Gold on hand represents gold in doré at the mines multiplied by the prevailing spot
gold price at the end of the period.
Loulo undergroundLoulo underground production for the quarter was slightly lower than the previous quarter, hoisting 330 681 tonnes at Yalea and 285 182 tonnes at Gara. At the same time, development metres decreased at Yalea due to lower plant availability and flooding of the decline after pump failures following a particularly heavy rainy period. This impacted the mine’s ability to deliver the higher grade ore feed that had been planned for the quarter. In Gara the development was 6% ahead of plan in line with the strategy of building flexibility ahead of the transition to owner mining.
The transition to owner mining continued according to plan, including the completion of the labour structure and associated recruitment of employees. 22 items of the new Sandvik fleet of equipment have arrived on site; 8 TH663 trucks, 7 LH621 loaders, 3 solos and 4 jumbos, with 3 loaders and 2 trucks already having been introduced in production.
A vendor management supply chain has been established in conjunction with Sandvik, and 80% of the spares and consumables are now available on site.
UNDERGROUND RESULTS
Quarterended30 Sep
2015
Quarterended30 Jun
2015
Quarterended
30 Sep2014
9 monthsended30 Sep
2015
9 monthsended
30 Sep2014
YALEA
Ore tonnes mined 330 681 358 231 414 139 1 073 276 1 212 996
Development metres 2 043 2 381 2 260 6 708 7 115
GARA
Ore tonnes mined 285 182 284 010 279 051 856 946 554 914
Development metres 2 356 2 374 1 410 6 740 5 712
PAGE FOUR
OPERATIONS (continued)
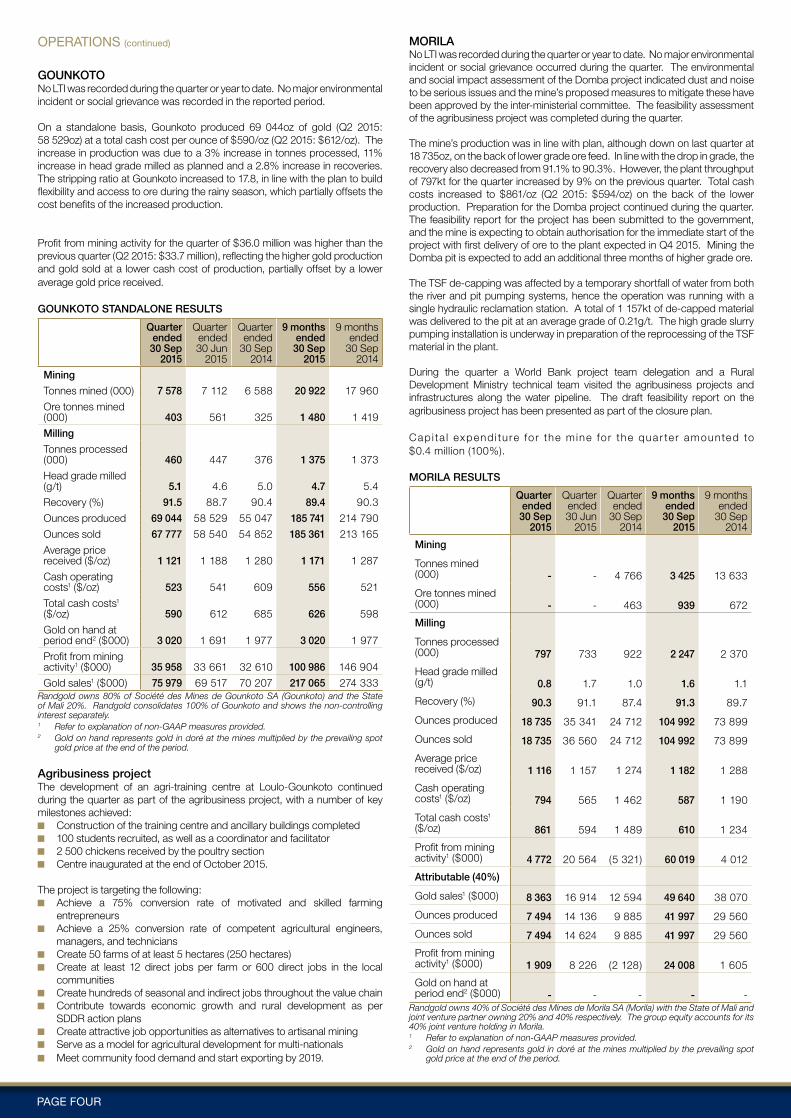
GOUNKOTONo LTI was recorded during the quarter or year to date. No major environmental incident or social grievance was recorded in the reported period.
On a standalone basis, Gounkoto produced 69 044oz of gold (Q2 2015: 58 529oz) at a total cash cost per ounce of $590/oz (Q2 2015: $612/oz). The increase in production was due to a 3% increase in tonnes processed, 11% increase in head grade milled as planned and a 2.8% increase in recoveries. The stripping ratio at Gounkoto increased to 17.8, in line with the plan to build flexibility and access to ore during the rainy season, which partially offsets the cost benefits of the increased production.
Profit from mining activity for the quarter of $36.0 million was higher than the previous quarter (Q2 2015: $33.7 million), reflecting the higher gold production and gold sold at a lower cash cost of production, partially offset by a lower average gold price received.
GOUNKOTO STANDALONE RESULTS
Quarterended30 Sep
2015
Quarterended30 Jun
2015
Quarterended
30 Sep2014
9 monthsended30 Sep
2015
9 monthsended
30 Sep2014
Mining
Tonnes mined (000) 7 578 7 112 6 588 20 922 17 960
Ore tonnes mined (000) 403 561 325 1 480 1 419
Milling
Tonnes processed (000) 460 447 376 1 375 1 373
Head grade milled (g/t) 5.1 4.6 5.0 4.7 5.4
Recovery (%) 91.5 88.7 90.4 89.4 90.3
Ounces produced 69 044 58 529 55 047 185 741 214 790
Ounces sold 67 777 58 540 54 852 185 361 213 165
Average price received ($/oz) 1 121 1 188 1 280 1 171 1 287
Cash operating costs1 ($/oz) 523 541 609 556 521
Total cash costs1 ($/oz) 590 612 685 626 598
Gold on hand at period end2 ($000) 3 020 1 691 1 977 3 020 1 977
Profit from mining activity1 ($000) 35 958 33 661 32 610 100 986 146 904
Gold sales1 ($000) 75 979 69 517 70 207 217 065 274 333Randgold owns 80% of Société des Mines de Gounkoto SA (Gounkoto) and the State of Mali 20%. Randgold consolidates 100% of Gounkoto and shows the non-controlling interest separately.1 Refer to explanation of non-GAAP measures provided.2 Gold on hand represents gold in doré at the mines multiplied by the prevailing spot
gold price at the end of the period.
Agribusiness projectThe development of an agri-training centre at Loulo-Gounkoto continued during the quarter as part of the agribusiness project, with a number of key milestones achieved:
Construction of the training centre and ancillary buildings completed 100 students recruited, as well as a coordinator and facilitator 2 500 chickens received by the poultry section Centre inaugurated at the end of October 2015.
The project is targeting the following: Achieve a 75% conversion rate of motivated and skilled farming
entrepreneurs Achieve a 25% conversion rate of competent agricultural engineers,
managers, and technicians Create 50 farms of at least 5 hectares (250 hectares) Create at least 12 direct jobs per farm or 600 direct jobs in the local
communities Create hundreds of seasonal and indirect jobs throughout the value chain Contribute towards economic growth and rural development as per
SDDR action plans Create attractive job opportunities as alternatives to artisanal mining Serve as a model for agricultural development for multi-nationals Meet community food demand and start exporting by 2019.
MORILANo LTI was recorded during the quarter or year to date. No major environmental incident or social grievance occurred during the quarter. The environmental and social impact assessment of the Domba project indicated dust and noise to be serious issues and the mine’s proposed measures to mitigate these have been approved by the inter-ministerial committee. The feasibility assessment of the agribusiness project was completed during the quarter.
The mine’s production was in line with plan, although down on last quarter at 18 735oz, on the back of lower grade ore feed. In line with the drop in grade, the recovery also decreased from 91.1% to 90.3%. However, the plant throughput of 797kt for the quarter increased by 9% on the previous quarter. Total cash costs increased to $861/oz (Q2 2015: $594/oz) on the back of the lower production. Preparation for the Domba project continued during the quarter. The feasibility report for the project has been submitted to the government, and the mine is expecting to obtain authorisation for the immediate start of the project with first delivery of ore to the plant expected in Q4 2015. Mining the Domba pit is expected to add an additional three months of higher grade ore.
The TSF de-capping was affected by a temporary shortfall of water from both the river and pit pumping systems, hence the operation was running with a single hydraulic reclamation station. A total of 1 157kt of de-capped material was delivered to the pit at an average grade of 0.21g/t. The high grade slurry pumping installation is underway in preparation of the reprocessing of the TSF material in the plant.
During the quarter a World Bank project team delegation and a Rural Development Ministry technical team visited the agribusiness projects and infrastructures along the water pipeline. The draft feasibility report on the agribusiness project has been presented as part of the closure plan.
Cap i ta l expend i tu re fo r the mine fo r the quar te r amounted to $0.4 million (100%).
MORILA RESULTS
Quarterended30 Sep
2015
Quarterended30 Jun
2015
Quarterended
30 Sep2014
9 monthsended30 Sep
2015
9 monthsended
30 Sep2014
Mining
Tonnes mined (000) - - 4 766 3 425 13 633
Ore tonnes mined (000) - - 463 939 672
Milling
Tonnes processed (000) 797 733 922 2 247 2 370
Head grade milled (g/t) 0.8 1.7 1.0 1.6 1.1
Recovery (%) 90.3 91.1 87.4 91.3 89.7
Ounces produced 18 735 35 341 24 712 104 992 73 899
Ounces sold 18 735 36 560 24 712 104 992 73 899
Average price received ($/oz) 1 116 1 157 1 274 1 182 1 288
Cash operating costs1 ($/oz) 794 565 1 462 587 1 190
Total cash costs1 ($/oz) 861 594 1 489 610 1 234
Profit from mining activity1 ($000) 4 772 20 564 (5 321) 60 019 4 012
Attributable (40%)
Gold sales1 ($000) 8 363 16 914 12 594 49 640 38 070
Ounces produced 7 494 14 136 9 885 41 997 29 560
Ounces sold 7 494 14 624 9 885 41 997 29 560
Profit from mining activity1 ($000) 1 909 8 226 (2 128) 24 008 1 605
Gold on hand at period end2 ($000) - - - - -
Randgold owns 40% of Société des Mines de Morila SA (Morila) with the State of Mali and joint venture partner owning 20% and 40% respectively. The group equity accounts for its 40% joint venture holding in Morila.1 Refer to explanation of non-GAAP measures provided.2 Gold on hand represents gold in doré at the mines multiplied by the prevailing spot
gold price at the end of the period.

PAGE FIVE
TONGONNo LTI was recorded during the quarter compared to two LTIs in the previous quarter. No major environmental incident or social grievance occurred during the quarter. The mine has started the feasibility assessment of its agribusiness project together with the Government.
Tongon produced 63 519oz of gold in Q3 2015, 16% higher than the previous quarter, primarily as a result of a 10% increase in tonnes processed. Recovery continues to show an upward trend quarter on quarter with a further 1.8% improvement achieved in Q3 as a result of further stabilisation of the new Rougher Flotation Circuit. Optimising the mass pull and concentrate grade from the Rougher and Scavenger cells and improvement in the Ultra-Fine-Grind (UFG) operation is expected to improve recovery further.
Total cash cost per ounce decreased to $850/oz (Q2 2015: $941/oz) on the back of the higher throughput, increased grade and recovery, leading to increased production.
Tongon’s power supply continued to be impacted in July by CIE grid power supply reductions and a step up of CIE power outages experienced as a result of the unavailability of sufficient gas and hydro resources to power up the national grid. Supply returned to the targeted 97:3 ratio of grid to generated power by the end of September as increased rainfall restored hydro capacity to the grid. Increased communication between the government, CIE national supply authority and Tongon continued in Q3 to ensure grid utilisation is increased and smooth synchronisation during extended planned power outage periods is achieved.
Total mined tonnes increased by 3% compared to Q2, mainly as a result of continued mining in the planned cutbacks in the South Zone pit and ramping up mining of softer, free dig oxides and transitional material in the North Zone pit as per plan. Mining costs were well contained and have decreased further quarter on quarter.
The additional 4th Stage Hydrocone Crushing installation, required to produce a finer sized crusher product to achieve design mill throughput, is on track for Phase 1 commissioning in Q4 2015. In conjunction with the crusher supplier, the mine has completed the designs for the crushing circuit at the tail end of the total crushing plant, completed the excavations and earthworks and progressed well with all long lead items procured.
Profit from mining activity increased by 29% to $17.2 million, reflecting the higher sales and lower costs, partially offset by the lower average gold price received.
Tongon mine received the President of Côte d’Ivoire Award for the best operating mine for the second year running. In addition, the mine completed repayment of its shareholder loans at the end of Q3.
TONGON RESULTS
Quarterended30 Sep
2015
Quarterended30 Jun
2015
Quarterended
30 Sep2014
9 monthsended30 Sep
2015
9 monthsended
30 Sep2014
MiningTonnes mined (000) 7 700 7 479 6 431 21 572 19 412Ore tonnes mined (000) 896 674 958 2 536 2 629MillingTonnes processed (000) 1 034 941 1 038 2 986 3 042Head grade milled (g/t) 2.3 2.2 2.4 2.2 2.3Recovery (%) 83.9 82.4 78.8 82.2 77.3Ounces produced 63 519 54 685 63 832 175 475 170 740Ounces sold 63 254 53 708 63 960 173 033 170 538Average price received ($/oz) 1 122 1 189 1 270 1 172 1 286Cash operating costs1 ($/oz) 816 905 761 826 854Total cash costs1 ($/oz) 850 941 799 861 892Gold on hand at period end2 ($000) 2 667 2 554 128 2 667 128Profit from mining activity1 ($000) 17 239 13 352 30 159 53 745 67 158Gold sales1 ($000) 70 996 63 881 81 241 202 760 219 327
Randgold owns 89% of Société des Mines de Tongon SA (Tongon) with the State of Côte d’Ivoire and outside shareholders owning 10% and 1% respectively. Randgold has funded the whole investment in Tongon by way of shareholder loans and therefore controls 100% of the cash flows from Tongon until the shareholder loans are repaid. The shareholder loans have been repaid at 30 September 2015. Randgold consolidates 100% of Tongon and shows the non-controlling interest separately.1 Refer to explanation of non-GAAP measures provided.2 Gold on hand represents gold in doré at the mines multiplied by the prevailing spot
gold price at the end of the period.
KIBALI There were two LTIs recorded at Kibali during the quarter, with a corresponding LTIFR of 0.73 compared with zero LTIs in Q2. The mine passed the Stage 1 ISO 14001 audit and no major environmental incident or social grievance occurred. The mine’s energy efficiency has increased this quarter on the back of the improved hydropower performance. The mine has completed its feasibility study for a large scale palm oil business.
Kibali produced 160 065oz in Q3, a decrease of 4% compared to the prior quarter, following the planned 12% drop in head grade milled, partially offset by increased throughput. The increased throughput reflected the continued steady operation of the plant with increases in plant availability. The 1% drop in recoveries reflected the change in ore feed, including additional transitional material from the Mengu Hill pit. Total cash costs for the quarter increased on the back of lower gold production from $553/oz in Q2 to $634/oz in the current quarter.
Profit from mining activity decreased to $79.3 million in the current quarter, in line with the lower production, higher costs and lower average gold price received.
Kibali started a local economic development programme with its communities during the quarter, with approximately $0.5 million spent on stimulating sustainable business initiatives and entrepreneur training.
KIBALI RESULTS
Quarterended30 Sep
2015
Quarterended30 Jun
2015
Quarterended
30 Sep2014
9 monthsended30 Sep
2015
9 monthsended
30 Sep2014
Mining
Tonnes mined (000) 7 806 7 995 7 930 24 496 20 842
Ore tonnes mined (000) 1 569 1 635 1 331 4 934 3 849
Milling
Tonnes processed (000) 1 830 1 667 1 485 5 109 3 913
Head grade milled (g/t) 3.3 3.7 4.0 3.5 3.6
Recovery (%) 83.0 84.0 77.0 84.2 77.8
Ounces produced 160 065 167 174 145 152 488 707 348 838
Ounces sold 161 807 167 450 140 279 492 042 337 944
Average price received ($/oz) 1 124 1 198 1 283 1 179 1 292
Cash operating costs1 ($/oz) 586 507 513 553 540
Total cash costs1 ($/oz) 634 553 557 599 586
Profit from mining activity1 ($000) 79 271 108 018 101 798 285 649 238 617
Attributable (45%)
Gold sales1 ($000) 81 843 90 273 80 969 261 157 196 430
Ounces produced 72 029 75 228 65 318 219 918 156 977
Ounces sold 72 813 75 353 63 126 221 419 152 075
Gold on hand at period end2 ($000) 3 158 4 237 5 964 3 158 5 964
Profit from mining activity1 ($000) 35 672 48 608 45 809 128 542 107 378
Randgold owns 45% of Kibali Goldmines SPRL (Kibali) with the DRC State and joint venture partner owning 10% and 45% respectively. The group equity accounts for its 45% joint venture holding in Kibali.1 Refer to explanation of non-GAAP measures provided.2 Gold on hand represents gold in doré at the mines multiplied by the prevailing spot
gold price at the end of the period.
Construction of the metallurgical facility and infrastructureIn order to facilitate the increase in sulphide ore treatment from 2016 onwards, a concentrate de-sliming cyclone circuit providing more capacity at the UFG circuit was commissioned during the quarter. The first phase of the new lined tailings storage facility was also completed during Q3, providing capacity for 2016 CIL tailings deposition. The first phase of Ambarau, the second hydropower station, was completed and commissioning is currently in progress.

PAGE SIX
OPERATIONS (continued)
DeclinesTotal ore produced from underground operations decreased from Q2 but remains above the plan for the year, with sufficient stopes available to allow for the increased production planned for Q4 2015. Development remains on track with plan. The paste plant is now operating according to plan, with the first two stopes successfully backfilled.
KIBALI UNDERGROUND DECLINE RESULTS
Quarterended30 Sep
2015
Quarterended30 Jun
2015
Quarterended
30 Sep2014
9 monthsended30 Sep
2015
9 monthsended
30 Sep2014
Ore tonnes mined 169 647 207 490 24 715 515 178 27 558
Development metres 2 698 2 619 2 066 7 789 5 526
Vertical shaftShaft sinking was completed in July 2015 and the remainder of Q3 focused on equipping the shaft, with the programme currently 15 days ahead of schedule. The next milestone for Q4 2015 will be the completion of the equipping from lode level to crusher level and the swinging down of the equipment for the off-shaft development.
KIBALI VERTICAL SHAFT RESULTS
Quarterended30 Sep
2015
Quarterended30 Jun
2015
Quarterended
30 Sep2014
9 monthsended30 Sep
2015
9 monthsended
30 Sep2014
Vertical metres 39 6 149 45 479
Off shaft development 98 298 152 734 282
Capital expenditureCapital expenditure for the project for the quarter amounted to $55.5 million (at 100%). The Phase 2 capital estimate of the project remains in line with previous guidance.
EXPLORATION ACTIVITIESThe group has continued with its exploration programme this quarter, notwithstanding the West African wet season which makes access to most exploration projects difficult. Eight drill rigs have been active across the portfolio, testing a range of greenfields and brownfields targets. The Sofia target in Senegal has returned strong intersections as the team progresses the Massawa feasibility study with further modelling and metallurgical sampling of the Central Zone ore. In the Loulo district, ongoing drilling at Gara continues to confirm the potential for the addition of significant resources to replace mining depletion. Meanwhile, exploration on satellite targets around all our mines is being fast tracked to provide the operations with added flexibility in this low gold price environment. A good example of this is the completion of the Domba grade control programme at Morila. We have completed the gradient array IP survey over the Fonondara/Sani corridor in the Boundiali permit in Côte d’Ivoire, greatly assisting further interpretation and paving the way for the large airborne VTEM survey which will be flown over the highly prospective Boundiali belt margin in Q4 2015. At Kibali, an extensive re-logging programme across the KCD deposit is highlighting upside at the margins of the ore lodes and exploration work this quarter has returned positive results from the Tete Bakangwe and Sessenge SW targets.
The company continues the drive to advance its understanding of the district scale structures which control the location of world class orebodies and, as part of this project, we have become a major sponsor of Amira’s West African Exploration Initiative programme this quarter in addition to continuing our own in-house research.
MALILoulo projectSeven exploration holes for 6 353m have been completed in the southern exploration area at Gara. Drill results received to date show the mineralisation has an average true width of 5.86m and a weighted average grade of 5.09g/t, which is in line with the Gara reserve currently being mined. Infill drilling continues on this target with the aim of establishing an inferred resource in 2015. Separately, conversion drilling at depth in the central portion of Gara has concluded with the completion of seven holes for a total of 6 852m. The mineralised system has been confirmed in terms of lithology and alteration, however the tenor and continuity of mineralisation is lower than expected, particularly in the north of the conversion area.
The greenfields focus during the quarter has largely shifted to the assessment of additional resource potential across the Loulo permit to provide the mining operation with further flexibility. A number of existing satellites have been reviewed (P125-Loulo 3 Gap, Baboto North and South, Loulo 2 South, Loulo 3, and Loulo 1) and exploration work this quarter has focused on the priority advancement of the Yalea Ridge South and Gara South targets which are not currently in resource. Drilling on these targets is scheduled for Q4 2015.
Gounkoto projectFollowing the conclusion of underground feasibility drilling at MZ1 in Q2, results of exploration and grade control drilling have been used to update the geological model in flitch and section to use as a basis for a revised resource model for Gounkoto MZ1 to MZ4 and P64E. At P64W, re-logging in detail for lithology, alteration and structure continues with the aim to update the geological model on which a revised resource estimate will be based, using results of recent advanced grade control drilling.
As with Loulo, the greenfields focus during the quarter has largely shifted to the assessment of additional resource potential across the Gounkoto permit. Drilling was scheduled at Toronto for October to test oxide potential at intersections of the Faraba structure with cross cutting NE chlorite-sericite shears. Trenching at Gounkoto North early in Q3, returned an intercept of 3.7m at 1.44g/t (31.7m), including 1.2m at 3.94g/t (GNWTR02) from a heterolithic breccia with silica-carbonate veinlets, and this programme will resume after the wet season.
Mali explorationField work on the Mali exploration properties was paused during the wet season. Geological interpretations, prospectivity studies and target generation work were carried out. The work programme at Bakolobi now focuses on the definition of targets along the identified mineralised structures for drill testing as well as eliminating untested targets lying beneath thick transported cover which cannot be transgressed by traditional surface exploration methods such as pitting and trenching. At the Legend JV, on the Souroukoto East target, 8 of the 12 pits excavated late in Q2 2015 at the Souroukoto East target confirmed the continuity over 600m strike length of in-situ gold anomalism within a 30m wide alteration zone with values of 0.16g/t to 11.3g/t in sheared greywackes with silica-carbonate-hematite alteration.
MorilaDuring the quarter the grade control drilling for the Domba deposit at 10 x 15m spacing was completed. The results of the programme are being integrated into an updated model and drill intersections indicate that an increase in grade, compared to the existing model, is possible.
SENEGALMassawaAt Sofia, five RC holes were completed to eliminate supergene enrichment as a possible cause of high grades seen in the south of the deposit. Three of the five holes returned strong results for the main zone sulphide ore with a weighted average intersection of 31m at 4.7g/t (true width) confirming a hypogene source for the high grade mineralisation. The main ore zone is hosted in a strongly sheared gabbro and felsic intrusive units with silica flooding and carbonate-sericite alteration.
The results confirm the extension of the main ore zone over a 650m strike length and up to 100m vertical depth. Potential exists along strike to the north of the area drilled this quarter where the main zone may extend and forms a priority target for further work in Q4 2015.
Bottle roll leach test work on 11 Sofia fresh rock ore samples completed during the quarter show gold recoveries between 86% and 95%, with the main ore zone showing recoveries above 90%, confirming that Sofia is a non-refractory ore source on the permit with good potential to increase the grade of the existing inferred resource of 736 000oz at 1.7g/t.
At Massawa Central Zone (CZ) three test work programmes were initiated during the quarter as part of the ongoing feasibility study and results are expected in Q4. These include multi-element analysis of the ore, a gold deportment study on BLEG residues to help understand the variable leach gold recoveries along the orebody and detailed CIL and gravity test-work of mainly high grade ore samples from the drill orientation area. A new block model for the orientation area was completed during the quarter, further indicated that the CZ will ultimately contain fewer tonnes at a higher grade than the existing Massawa model. The modelling of the remaining CZ ore and lithologies is still in progress.
CÔTE D’IVOIREAt Nielle, the team has spent the quarter re-logging core from the deposit and creating an updated model incorporating recent grade control and exploration drilling results. This has resulted in a larger $1 000/oz pit optimisation and the identification of a number of opportunities on footwall structures which are only widely drilled compared to the main ore zones.

PAGE SEVEN
The Tongon satellites and the low grade near-mine prospects have been reviewed during the quarter and an infill drilling programme on the two most advanced satellites of Sekala and Seydou South is planned for Q4 2015. This drilling phase aims to confirm whether infill drilling increases the grade and tonnage of the deposits, as we have seen at Tongon. All satellites have a similar anastomosing form to Tongon. Greenfields fieldwork was paused during the wet season.
On the Boundiali permit, the encouraging results from the Fonondara drilling reported previously (16.53m at 3.83g/t including 7.40m at 5.88g/t and 8.83m at 28.62g/t including 4.10m at 61.05g/t) have demonstrated the prospectivity of the permit and outlined the controls of the significant surface anomalism along the Boundiali belt margin which hosts a number of existing targets. The subsequent reconnaissance diamond drilling undertaken at the Sani target (9km north of Fonondara) has confirmed a wide and consistent low grade system with best results received from SNDH003: 54.41m at 1.21g/t (from 132.84m) including 9.45m at 3.28g/t within a +200m wide anomalous zone. Mineralisation is linked to coarse grained pyrite and chalcopyrite and initial metallurgical tests conducted on the fresh material returned an average recovery of 87%. Given these positive results and the scale and prospectivity of the Boundiali belt margin, a helicopter VTEM programme is planned in Q4 2015 to cover the full strike of the Boundiali permit and the Mankono permit to the south. An IP survey completed during the wet season over the 20km Fonondara-Sani corridor showed that there is significant potential to change our interpretation of the key structures and identify new targets with additional remote data.
The 13km long Fapoha North target and the wide, low grade bulk mining target at Gbongogo on the Mankono permit will be further investigated by trenching once access is possible following the wet season.
DEMOCRATIC REPUBLIC OF CONGOKibaliWork this quarter focused on advancing brownfields targets along the KZ trend to provide mining flexibility and to contribute to resource addition/replacement while exploration work continued on the Kalimva/Ikamva target.
At Tete-Bakangwe, which is an old artisanal pit 4km from the plant, trenching returned significant results including 52m at 1.8g/t (Trench 0006), 43.2 at 1.7g/t (Trench 0011) and 10.8m at 3.3g/t (Trench 0012) highlighting the potential for a near mine satellite which will be further tested in Q4 2015. Initial interpretations are of a large, open, NE plunging fold system with higher grade located in the axial plane and mineralisation hosted by banded iron formation. Preliminary observations indicate two high grade stacked lodes which may be projected down plunge for more than 300m. An estimation based on historical drill holes and new trenches results shows a potential of 40 000oz at 3g/t for 70m of lateral extension.
At Bakangwe Aval, a programme of 15 close spaced RC holes was undertaken to confirm the potential of 429 976t at 5.76g/t for 79koz over 260m down plunge length and 90m width. Results from the 15 RC holes failed to return high grade mineralisation as indicated by the historical Barrick drill holes, however the results still enabled the completion of the contiguous Pakaka/Pamao model.
At Megi, three holes were cored to evaluate a 100m wide higher grade zone in the 1001 Lode. The holes targeted mineralisation below the base of the conceptual $1 000/oz pit shell and returned 7.75m at 6.5g/t from 112.25m (MIDD0013), 13.53m at 2.65g/t from 131.29m (MIDD0014) and 12.86m at 2.5g/t from 163.98m (MIDD0015) confirming the down plunge extension of the orebody and the potential to host high grade mineralisation.
The team completed the rebuilding of lithological, alteration and mineralisation wireframes to enable the evaluation of potential super-pit optimisations at Pakaka, Pamao and Bakangwe Aval for the Pakaka pit, whilst Kombokolo, Sessenge, Gorumbwa and Durba Hill were remodelled and combined for the KCD pit. Optimisations are in progress and results will guide further infill drilling around both pits.
The Sessenge SW target to the south of Gorumbwa and KCD was advanced this quarter with programmes of infill trenching, hand auger and a ground magnetic survey. The results from trenching continue to confirm mineralisation beneath the large 100ppb soil anomaly. Auger drill results and ground-mag interpretations are pending and results will be used to optimise the interpretation and develop a drilling strategy going forward.
CONSOLIDATED STATEMENT OF COMPREHENSIVE INCOME
$000
Quarterended30 Sep
2015
Quarterended30 Jun
2015
Quarterended
30 Sep2014
9 monthsended30 Sep
2015
9 monthsended
30 Sep2014
REVENUES
Gold sales on spot 250 516 247 590 283 234 729 334 860 433
Total revenues 250 516 247 590 283 234 729 334 860 433
Share of profits of equity accounted joint ventures 13 385 33 600 17 810 75 380 45 361
Other income 6 667 3 788 1 260 12 209 6 356
Total income 270 568 284 978 302 304 816 923 912 150
COST AND EXPENSES
Mine production costs 130 977 127 302 133 100 375 871 395 485
Movement in production inventory and ore stockpiles 3 928 981 (6 165) 9 606 (14 160)
Depreciation and amortisation 39 356 42 991 38 496 118 422 106 815
Other mining and processing costs 15 292 15 439 16 340 45 606 48 055
Mining and processing costs 189 553 186 713 181 771 549 505 536 195
Royalties 12 878 12 914 14 533 37 611 44 963
Exploration and corporate expenditure 9 791 12 992 8 897 31 460 33 284
Other expenses - - 16 652 5 725 16 877
Total costs 212 222 212 619 221 853 624 301 631 319
Finance income 42 41 - 106 320
Finance costs (1 040) (442) (818) (2 444) (1 408)
Finance costs – net (998) (401) (818) (2 338) (1 088)
Profit before income tax 57 348 71 958 79 633 190 284 279 743
Income tax expense (8 587) (12 785) (13 601) (31 036) (62 962)
Profit for the period 48 761 59 173 66 032 159 248 216 781
Other comprehensive income
Gain/(loss) on available-for-sale financial assets (451) 46 (782) (530) 4
Share of equity accounted joint ventures other comprehensive loss (15) (10) (571) (25) (20)
Total other comprehensive income/(expense) (466) 36 (1 353) (555) (16)
Total comprehensive income 48 295 59 209 64 679 158 693 216 765
Profit attributable to:
Owners of the parent 42 345 53 601 58 008 144 149 185 351
Non-controlling interests 6 416 5 572 8 024 15 099 31 430
48 761 59 173 66 032 159 248 216 781
Total comprehensive income attributable to:
Owners of the parent 41 879 56 637 56 655 143 594 185 335
Non-controlling interests 6 416 5 572 8 024 15 099 31 430
48 295 59 209 64 679 158 693 216 765
Basic earnings per share ($) 0.45 0.58 0.63 1.55 2.00
Diluted earnings per share ($) 0.45 0.57 0.62 1.53 1.98
Average shares in issue (000) 93 209 93 081 92 663 93 048 92 580

PAGE EIGHT
CONSOLIDATED STATEMENT OF FINANCIAL POSITION
$000
Quarterended30 Sep
2015
Quarterended30 Jun
2015
Quarterended
31 Dec2014
Assets
Non-current assets
Property, plant and equipment 1 481 368 1 488 234 1 482 736
Cost 2 175 106 2 142 616 2 018 105
Accumulated depreciation and amortisations (693 738) (654 382) (535 369)
Deferred tax - 398 1 294
Long term ore stockpiles 173 993 178 381 151 708
Trade and other receivables 6 629 5 655 10 794
Investments in equity accounted joint ventures 1 433 868 1 430 594 1 364 579
Other investments in joint ventures 46 599 46 669 45 469
Total investments in joint ventures 1 480 467 1 477 263 1 410 048
Total non-current assets 3 142 457 3 149 931 3 056 580
Current assetsInventories and ore stockpiles 129 478 121 016 154 956
Trade and other receivables 242 473 248 412 235 208
Cash and cash equivalents 168 434 109 249 63 424
Available-for-sale financial assets 937 1 388 1 835
Total current assets 541 322 480 065 455 423
Total assets 3 683 779 3 629 996 3 512 003
Equity attributable to owners of the parent 3 226 862 3 177 794 3 048 250
Non-controlling interests 211 843 206 839 204 999
Total equity 3 438 705 3 384 633 3 253 249
Non-current liabilities
Loans from minority shareholders 2 765 2 765 2 765
Deferred tax 33 900 32 650 29 775
Provision for rehabilitation 55 904 55 904 49 177
Total non-current liabilities 92 569 91 319 81 717
Current liabilities
Trade and other payables 136 640 137 426 139 805
Current income tax payable 15 865 16 618 37 232
Total current liabilities 152 505 154 044 177 037
Total equity and liabilities 3 683 779 3 629 996 3 512 003
These results are presented as the third quarter ended 30 September 2015. They have been prepared in accordance with International Financial Reporting Standards as adopted by the European Union (IFRS) on a basis that is consistent with the accounting policies applied by the group in its audited consolidated financial statements for the year ended 31 December 2014, and which will form the basis of the 2015 annual report. No new or amended accounting standards effective for 2015 have had a significant impact on the group. This announcement has been prepared in compliance with IAS 34 - Interim Financial Reporting. These results do not include all the notes of the type normally included in an annual financial report. Accordingly, this condensed report is to be read in conjunction with the annual report for the year 31 December 2014, and any public announcements made by the group during the reporting period. While the information included in this announcement has been prepared in accordance with the recognition and measurement criteria of IFRS, this announcement does not itself contain sufficient information to comply with IFRS. The auditors’ report for the year ended 31 December 2014 was unqualified and did not include references to any matters which the auditor drew attention to by way of emphasis without qualifying their report.
Property, plant and equipment cost increased by $32.5 million for the three months ended 30 September 2015. This is mainly attributed to capital expenditure at the Loulo complex of $31.6 million, including the development of the Yalea and Gara underground mines ($26.0 million).
The group’s capital commitments (including its share of equity
accounted joint ventures) at 30 September 2015 amounted to
$100.2 million with the majority relating to Kibali ($16.9 million) and the
Loulo complex ($78.5 million).
CONSOLIDATED CASH FLOW STATEMENT
$000
3 monthsended30 Sep
2015
3 monthsended30 Jun
2015
9 monthsended30 Sep
2015
9 monthsended
30 Sep2014
Profit after tax 48 761 59 173 159 248 216 781
Income tax expense 8 587 12 785 31 036 62 962
Profit before income tax 57 348 71 958 190 284 279 743
Share of profits of equity accounted joint ventures (13 385) (33 600) (75 380) (45 361)
Adjustment for non-cash items 58 360 59 241 169 286 130 690
Effects of change in operating working capital items 8 575 (27 339) 6 360 (37 722)
Receivables 10 305 (24 503) (22 935) (35 355)
Inventories and ore stockpiles (4 074) 756 1 059 15 761
Trade and other payables 2 344 (3 592) 28 236 (18 128)
Cash generated from operations 110 898 70 260 290 550 327 350
Dividends received from equity accounted joint ventures 10 000 20 272 35 272 -
Income tax paid (11 220) (19 086) (42 978) (79 061)
Net cash generated from operating activities 109 678 71 446 282 844 248 289
Additions to property, plant and equipment (49 247) (63 428) (148 021) (132 051)
Funds invested in equity accounted joint ventures (174) 175 (2 828) (51 462)
Loans repaid by equity accounted joint ventures 340 - 340 6 990
Net cash used by investing activities (49 081) (63 253) (150 509) (176 523)
Proceeds from issue of ordinary shares - - 67 2 035
Dividends paid to company’s shareholders - (38 600) (38 600) (43 284)
Dividends paid to non-controlling interests (1 412) (1 582) (8 120) (5 244)
Proceeds from borrowings - - - -
Net cash used by financing activities (1 412) (40 182) (46 653) (46 493)
Net increase / (decrease) in cash and cash equivalents 59 185 (31 989) 85 682 25 273
Cash and cash equivalents at beginning of period 109 249 141 238 82 752 38 151
Cash and cash equivalents at end of period 168 434 109 249 168 434 63 424
PAGE NINE
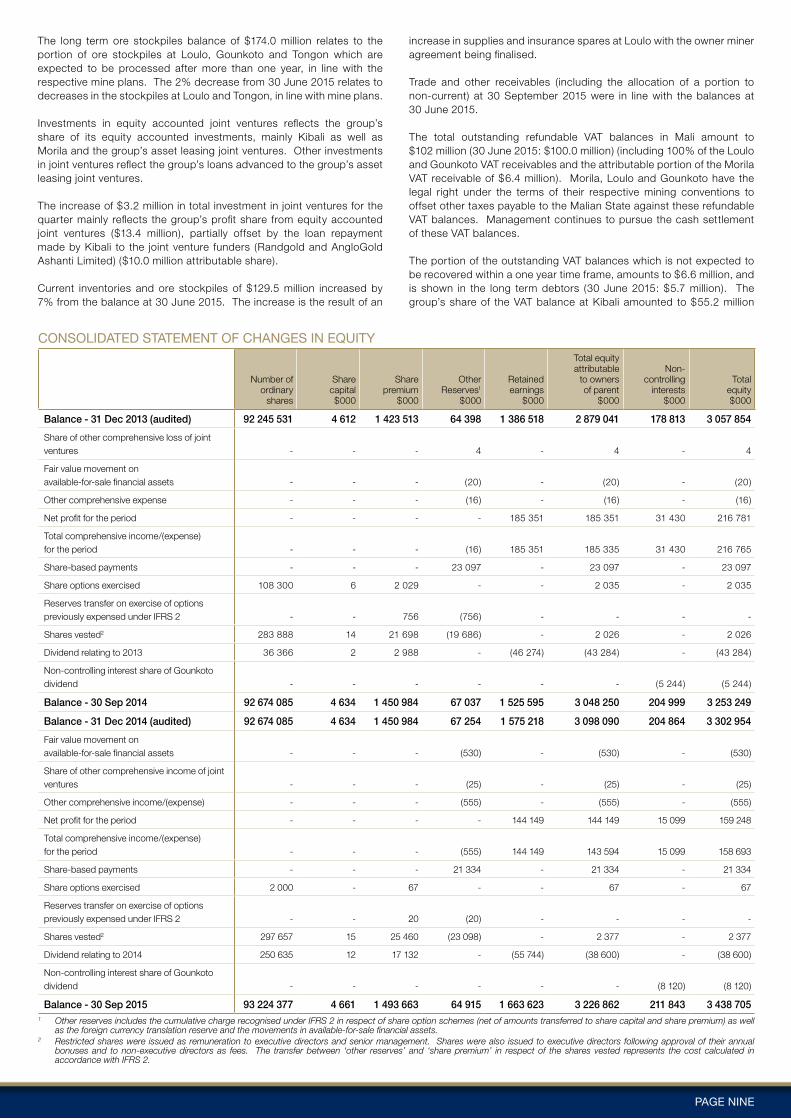
The long term ore stockpiles balance of $174.0 million relates to the portion of ore stockpiles at Loulo, Gounkoto and Tongon which are expected to be processed after more than one year, in line with the respective mine plans. The 2% decrease from 30 June 2015 relates to decreases in the stockpiles at Loulo and Tongon, in line with mine plans.
Investments in equity accounted joint ventures reflects the group’s share of its equity accounted investments, mainly Kibali as well as Morila and the group’s asset leasing joint ventures. Other investments in joint ventures reflect the group’s loans advanced to the group’s asset leasing joint ventures.
The increase of $3.2 million in total investment in joint ventures for the quarter mainly reflects the group’s profit share from equity accounted joint ventures ($13.4 million), partially offset by the loan repayment made by Kibali to the joint venture funders (Randgold and AngloGold Ashanti Limited) ($10.0 million attributable share).
Current inventories and ore stockpiles of $129.5 million increased by 7% from the balance at 30 June 2015. The increase is the result of an
increase in supplies and insurance spares at Loulo with the owner miner agreement being finalised. Trade and other receivables (including the allocation of a portion to non-current) at 30 September 2015 were in line with the balances at 30 June 2015.
The total outstanding refundable VAT balances in Mali amount to $102 million (30 June 2015: $100.0 million) (including 100% of the Loulo and Gounkoto VAT receivables and the attributable portion of the Morila VAT receivable of $6.4 million). Morila, Loulo and Gounkoto have the legal right under the terms of their respective mining conventions to offset other taxes payable to the Malian State against these refundable VAT balances. Management continues to pursue the cash settlement of these VAT balances.
The portion of the outstanding VAT balances which is not expected to be recovered within a one year time frame, amounts to $6.6 million, and is shown in the long term debtors (30 June 2015: $5.7 million). The group’s share of the VAT balance at Kibali amounted to $55.2 million
CONSOLIDATED STATEMENT OF CHANGES IN EQUITY
Number ofordinary
shares
Sharecapital$000
Sharepremium
$000
OtherReserves1
$000
Retainedearnings
$000
Total equityattributable
to ownersof parent
$000
Non-controlling
interests$000
Totalequity$000
Balance - 31 Dec 2013 (audited) 92 245 531 4 612 1 423 513 64 398 1 386 518 2 879 041 178 813 3 057 854
Share of other comprehensive loss of joint ventures - - - 4 - 4 - 4
Fair value movement on available-for-sale financial assets - - - (20) - (20) - (20)
Other comprehensive expense - - - (16) - (16) - (16)
Net profit for the period - - - - 185 351 185 351 31 430 216 781
Total comprehensive income/(expense)for the period - - - (16) 185 351 185 335 31 430 216 765
Share-based payments - - - 23 097 - 23 097 - 23 097
Share options exercised 108 300 6 2 029 - - 2 035 - 2 035
Reserves transfer on exercise of options previously expensed under IFRS 2 - - 756 (756) - - - -
Shares vested2 283 888 14 21 698 (19 686) - 2 026 - 2 026
Dividend relating to 2013 36 366 2 2 988 - (46 274) (43 284) - (43 284)
Non-controlling interest share of Gounkoto dividend - - - - - - (5 244) (5 244)
Balance - 30 Sep 2014 92 674 085 4 634 1 450 984 67 037 1 525 595 3 048 250 204 999 3 253 249
Balance - 31 Dec 2014 (audited) 92 674 085 4 634 1 450 984 67 254 1 575 218 3 098 090 204 864 3 302 954
Fair value movement on available-for-sale financial assets - - - (530) - (530) - (530)
Share of other comprehensive income of joint ventures - - - (25) - (25) - (25)
Other comprehensive income/(expense) - - - (555) - (555) - (555)
Net profit for the period - - - - 144 149 144 149 15 099 159 248
Total comprehensive income/(expense) for the period - - - (555) 144 149 143 594 15 099 158 693
Share-based payments - - - 21 334 - 21 334 - 21 334
Share options exercised 2 000 - 67 - - 67 - 67
Reserves transfer on exercise of options previously expensed under IFRS 2 - - 20 (20) - - - -
Shares vested2 297 657 15 25 460 (23 098) - 2 377 - 2 377
Dividend relating to 2014 250 635 12 17 132 - (55 744) (38 600) - (38 600)
Non-controlling interest share of Gounkoto dividend - - - - - - (8 120) (8 120)
Balance - 30 Sep 2015 93 224 377 4 661 1 493 663 64 915 1 663 623 3 226 862 211 843 3 438 7051 Other reserves includes the cumulative charge recognised under IFRS 2 in respect of share option schemes (net of amounts transferred to share capital and share premium) as well
as the foreign currency translation reserve and the movements in available-for-sale financial assets.2 Restricted shares were issued as remuneration to executive directors and senior management. Shares were also issued to executive directors following approval of their annual
bonuses and to non-executive directors as fees. The transfer between ‘other reserves’ and ‘share premium’ in respect of the shares vested represents the cost calculated in accordance with IFRS 2.

PAGE TEN
NON-GAAP
$000
Quarterended30 Sep
2015
Quarterended30 Jun
2015
Quarterended
30 Sep2014
9 monthsended30 Sep
2015
9 monthsended
30 Sep2014
Gold sales per IFRS1 250 516 247 590 283 234 729 334 860 433
Gold sales adjustments for joint ventures2 90 207 107 186 93 562 310 797 234 500
Gold sales3 340 723 354 776 376 796 1 040 131 1 094 933
Mine production costs 130 977 127 302 133 100 375 871 395 485
Movement in production inventory and ore stockpiles1 3 928 981 (6 165) 9 606 (14 160)
Royalties including adjustment for joint ventures 16 911 16 800 17 597 48 829 53 124
Royalty adjustment for joint ventures2 (4 033) (3 886) (3 064) (11 218) (8 161)
Total royalties1
Other mining and processing costs1
12 87815 292
12 91415 439
14 53316 340
37 61145 606
44 96348 055
Cash costs adjustments for joint ventures2 49 225 47 376 46 332 148 393 114 820
Total cash costs3 212 300 204 012 204 140 617 087 589 163
Profit from mining activity3 128 423 150 764 172 656 423 044 505 770
Ounces sold 303 718 298 421 295 018 885 763 850 410
Total cash cost per ounce sold3 699 684 692 697 693
Cash operating cost per ounce sold3 643 627 632 642 630
Gold on hand at period end3 12 812 11 688 11 993 12 812 11 993
1 Figures extracted from IFRS results.2 The group includes the gold sales and cash costs associated with the joint venture
results in its non-GAAP measures. The gold sales adjustments per quarter reflect our 40% share of Morila’s gold sales and 45% share of Kibali’s gold sales. The cash costs adjustments per quarter primarily reflect our 40% share of Morila’s cash costs, 45% of Kibali’s cash costs, as well as our 50.1% share in RAL 1 Limited’s (RAL 1) cash cost adjustments.
3 Refer to explanation of non-GAAP measures provided.
(30 June 2015: $54.0 million). The Morila and Kibali VAT balances are included in the group’s investment in joint ventures line.
The group had received claims for various taxes from the State of Mali totalling $310.0 million (30 June 2015: $310.0 million), in respect of its Mali operations. Having taken professional advice, the group considers the claims to be without merit or foundation and is strongly defending its position, including following the appropriate legal process for disputes within Mali. Accordingly, no provision has been made for the material claims. Loulo, Gounkoto and Morila have legally binding mining conventions which guarantee fiscal stability, govern the taxes applicable to the companies and allow for international arbitration in the event a dispute cannot be resolved in the country. Management continues to engage with the Malian authorities at the highest level to resolve this issue. During the prior year, Loulo submitted a request for arbitration at the International Centre for the Settlement of Investment Disputes against the State of Mali in relation to certain of the disputed tax claims. The arbitration process is ongoing with hearings having taken place in Q1 2015, and the outcome of this process is expected to be concluded before year end.
The increase in cash of $59.2 million since 30 June 2015 largely reflects strong operational cash flows from the Loulo-Gounkoto complex and Tongon mines ($109.7 million), and cash returned from Kibali, partially offset by the group’s continued investment in capital expenditure in its subsidiaries ($49.2 million). This includes $16.7 million of down payments for equipment at Loulo related to the owner mining transition.
Based on the company’s current cash resources and facilities, projected operating cash flows and capital expenditure, the company is confident it will be able to meet its obligations at the prevailing gold price.
Trade and other payables of $136.6 million were in line with the balance at 30 June 2015 of $137.4 million.
Current tax payable of $15.9 million decreased from 30 June 2015 due to corporation tax payments made at Loulo and Gounkoto during the quarter. Tongon benefits from a five year tax holiday from the start of production in December 2010.
NON-GAAP MEASURESRandgold has identified certain measures that it believes will assist understanding of the performance of the business. As the measures are not defined under IFRS they may not be directly comparable with other companies’ adjusted measures. The non-GAAP measures are not intended to be a substitute for, or superior to, any IFRS measures of performance but management has included them as these are considered to be important comparables and key measures used within the business for assessing performance.
These measures are explained further below:
Total cash costs and cash cost per ounce are non-GAAP measures. Total cash costs and total cash cost per ounce are calculated using guidance issued by the Gold Institute. The Gold Institute was a non-profit industry association comprising leading gold producers, refiners, bullion suppliers and manufacturers. This institute has now been incorporated into the National Mining Association. The guidance was first issued in 1996 and revised in November 1999. Total cash costs, as defined in the Gold Institute’s guidance, include mine production, transport and refinery costs, general and administrative costs, movement in production inventories and ore stockpiles, transfers to and from deferred stripping where relevant and royalties. Total cash costs and total cash cost per ounce also include our share of our equity accounted joint ventures’ total cash costs and total cash cost per ounce.
Total cash cost per ounce is calculated by dividing total cash costs, as determined using the Gold Institute guidance, by gold ounces sold for the periods presented. Total cash costs and total cash cost per ounce are calculated on a consistent basis for the periods presented. Total cash costs and total cash cost per ounce should not be considered by investors as an alternative to operating profit or net profit attributable to shareholders, as an alternative to other IFRS measures or an indicator
of our performance. The data does not have a meaning prescribed by IFRS and therefore amounts presented may not be comparable to data presented by gold producers who do not follow the guidance provided by the Gold Institute. In particular depreciation and amortisation would be included in a measure of total costs of producing gold under IFRS, but are not included in total cash costs under the guidance provided by the Gold Institute.
Furthermore, while the Gold Institute has provided a definition for the calculation of total cash costs and total cash cost per ounce, the calculation of these numbers may vary from company to company and may not be comparable to other similarly titled measures of other companies. However, Randgold believes that total cash cost per ounce is a useful indicator to investors and management of a mining company’s performance as it provides an indication of a company’s profitability and efficiency, the trends in cash costs as the company’s operations mature,
PAGE ELEVEN
Profit from mining activity is calculated by subtracting total cash costs from gold sales for all periods presented. Profit from mining includes our share of our equity accounted joint ventures.
Gold on hand represents gold in doré at the mines multiplied by the prevailing spot gold price at the end of the period. Gold on hand includes our share of our equity accounted joint ventures’ gold on hand.
The group non-GAAP measures presented in the ‘Summarised Financial Information’ in the accompanying table include the group’s share of each operating mine, together with adjustments to eliminate inter-group transactions.
The accompanying table reconciles gold sales, total cash costs and profit from mining activity as non-GAAP measures, to the information provided in the statement of comprehensive income, determined in accordance with IFRS, for each of the periods set out therein.
and a benchmark of performance to allow for comparison against other companies.
Cash operating costs and cash operating cost per ounce are calculated by deducting royalties from total cash costs. Cash operating cost per ounce is calculated by dividing cash operating costs by gold ounces sold for the periods presented.
Gold sales is a non-GAAP measure. It represents the sales of gold at spot and the gains/losses on hedge contracts which have been delivered into at the designated maturity date. It excludes gains/losses on hedge contracts which have been rolled forward to match future sales. This adjustment is considered appropriate because no cash is received/paid in respect of these contracts. Randgold currently does not have any hedge positions. Gold sales include our share of our equity accounted joint ventures’ gold sales.
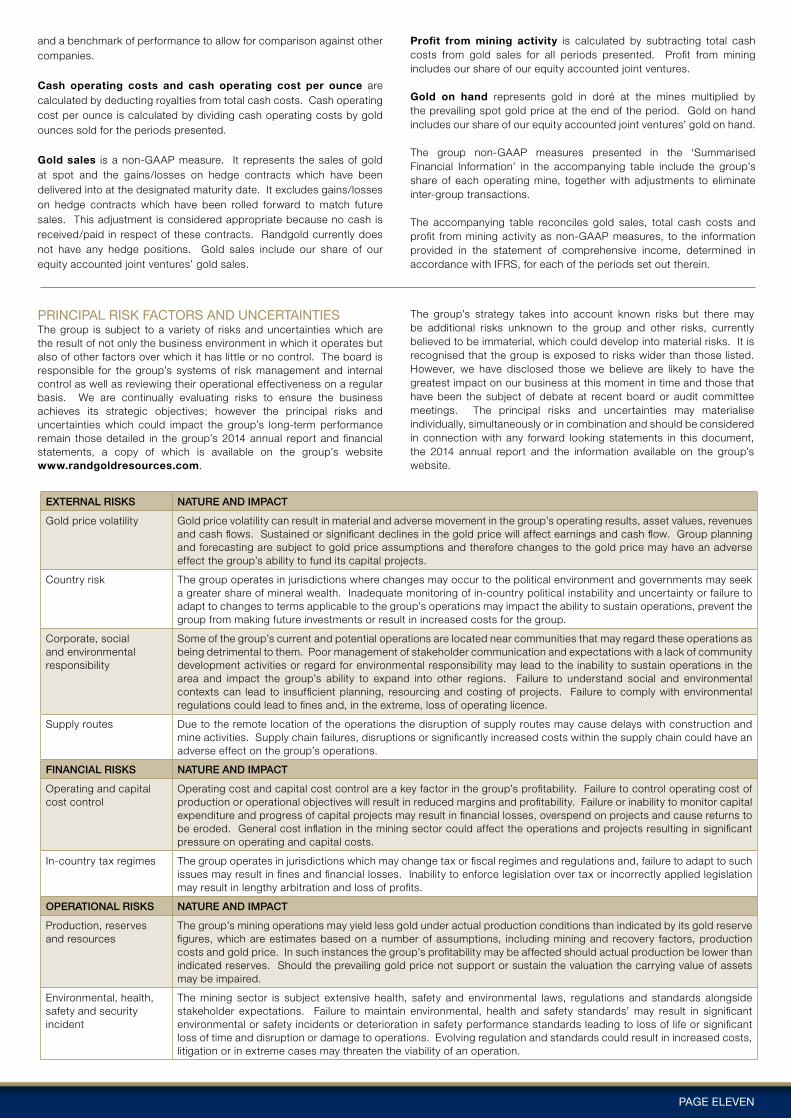
PRINCIPAL RISK FACTORS AND UNCERTAINTIESThe group is subject to a variety of risks and uncertainties which are the result of not only the business environment in which it operates but also of other factors over which it has little or no control. The board is responsible for the group’s systems of risk management and internal control as well as reviewing their operational effectiveness on a regular basis. We are continually evaluating risks to ensure the business achieves its strategic objectives; however the principal risks and uncertainties which could impact the group’s long-term performance remain those detailed in the group’s 2014 annual report and financial statements, a copy of which is available on the group’s website www.randgoldresources.com.
The group’s strategy takes into account known risks but there may be additional risks unknown to the group and other risks, currently believed to be immaterial, which could develop into material risks. It is recognised that the group is exposed to risks wider than those listed. However, we have disclosed those we believe are likely to have the greatest impact on our business at this moment in time and those that have been the subject of debate at recent board or audit committee meetings. The principal risks and uncertainties may materialise individually, simultaneously or in combination and should be considered in connection with any forward looking statements in this document, the 2014 annual report and the information available on the group’s website.
EXTERNAL RISKS NATURE AND IMPACT
Gold price volatility Gold price volatility can result in material and adverse movement in the group’s operating results, asset values, revenues and cash flows. Sustained or significant declines in the gold price will affect earnings and cash flow. Group planning and forecasting are subject to gold price assumptions and therefore changes to the gold price may have an adverse effect the group’s ability to fund its capital projects.
Country risk The group operates in jurisdictions where changes may occur to the political environment and governments may seek a greater share of mineral wealth. Inadequate monitoring of in-country political instability and uncertainty or failure to adapt to changes to terms applicable to the group’s operations may impact the ability to sustain operations, prevent the group from making future investments or result in increased costs for the group.
Corporate, social and environmental responsibility
Some of the group’s current and potential operations are located near communities that may regard these operations as being detrimental to them. Poor management of stakeholder communication and expectations with a lack of community development activities or regard for environmental responsibility may lead to the inability to sustain operations in the area and impact the group’s ability to expand into other regions. Failure to understand social and environmental contexts can lead to insufficient planning, resourcing and costing of projects. Failure to comply with environmental regulations could lead to fines and, in the extreme, loss of operating licence.
Supply routes Due to the remote location of the operations the disruption of supply routes may cause delays with construction and mine activities. Supply chain failures, disruptions or significantly increased costs within the supply chain could have an adverse effect on the group’s operations.
FINANCIAL RISKS NATURE AND IMPACT
Operating and capital cost control
Operating cost and capital cost control are a key factor in the group’s profitability. Failure to control operating cost of production or operational objectives will result in reduced margins and profitability. Failure or inability to monitor capital expenditure and progress of capital projects may result in financial losses, overspend on projects and cause returns to be eroded. General cost inflation in the mining sector could affect the operations and projects resulting in significant pressure on operating and capital costs.
In-country tax regimes The group operates in jurisdictions which may change tax or fiscal regimes and regulations and, failure to adapt to such issues may result in fines and financial losses. Inability to enforce legislation over tax or incorrectly applied legislation may result in lengthy arbitration and loss of profits.
OPERATIONAL RISKS NATURE AND IMPACT
Production, reserves and resources
The group’s mining operations may yield less gold under actual production conditions than indicated by its gold reserve figures, which are estimates based on a number of assumptions, including mining and recovery factors, production costs and gold price. In such instances the group’s profitability may be affected should actual production be lower than indicated reserves. Should the prevailing gold price not support or sustain the valuation the carrying value of assets may be impaired.
Environmental, health, safety and security incident
The mining sector is subject extensive health, safety and environmental laws, regulations and standards alongside stakeholder expectations. Failure to maintain environmental, health and safety standards’ may result in significant environmental or safety incidents or deterioration in safety performance standards leading to loss of life or significant loss of time and disruption or damage to operations. Evolving regulation and standards could result in increased costs, litigation or in extreme cases may threaten the viability of an operation.

PAGE TWELVE
Risks associated with underground mining and geotechnical failure
The group has a number of underground projects which are subject to the extensive risks associated with underground mining. Failure to monitor or mitigate such risks may affect the profitability of the group and the operational performance. Failure to consider geotechnical failure in planning and then monitor the impact during operations may impact the geotechnical stability of pits and underground mining operations. Extreme weather conditions such as high rainfall may also impact the geotechnical stability of the pits and therefore could impact mining operations.
STRATEGIC RISKS NATURE AND IMPACT
Lack of identification of new exploration targets and exploration failure
The replacement of reserves and resources is key to the long term delivery of the group’s exploration led growth strategy and therefore the lack of identification of new exploration targets may lead to a loss of revenue and an inability to grow and meet strategic objectives. Exploration and development are costly activities with no guarantee of success, but are necessary for future growth of the group.
GENERALDuring the quarter, Randgold performed well across all its operations and projects. At Kibali, production is now expected to exceed the annual guidance provided at the start of the year, while at Loulo-Gounkoto, the complex may fall short of its annual target, given the lower grades achieved during the quarter. As such, the group continues to forecast production and cash costs within the guidance range set out at the start of the year. Capital expenditure for the year is now expected to be slightly less than the previous guidance, owing to the timing of commitments and payments, with the balance rolling over into 2016.
As is customary, Randgold will be finalising its 2016 budget during the fourth quarter and guidance for 2016 will be given with the year end results. The group remains focused on its strategy to deliver value for all its stakeholders through the discovery and development of world class orebodies and has a pipeline of high quality projects and exploration targets. Notwithstanding this core strategy, management routinely reviews corporate and asset acquisition opportunities, focused on Africa.
On 16 September 2015, Randgold announced that it had concluded an investment agreement (the ‘Agreement’) with AngloGold Ashanti Limited (‘AngloGold Ashanti’) aimed at the formation of a joint venture to redevelop and operate AngloGold Ashanti’s Obuasi gold mine in Ghana. In terms of the Agreement, Randgold will lead and fund a development plan study designed to rebuild Obuasi as a viable long-life mining business with an attractive cost structure and returns.
Obuasi, located in the Ashanti region of Ghana, 320km northwest of the capital, Accra, is a large, high grade deposit with proven and probable ore reserves (as reported by AngloGold Ashanti in their 2014 Annual Report) of 24.53Mt at 6.70g/t for 5.29Moz, part of a substantial mineral resource base. In 2012, AngloGold Ashanti initiated a programme to modernise the mine, principally by starting to develop a ramp access that will ultimately run from surface to high grade blocks of ore underground. The ramp will supplement current vertical hoisting infrastructure and help debottleneck the underground operation by allowing for greater ease in transporting people and materials underground, and transporting ore to surface. This was considered by AngloGold Ashanti to be a necessary step ahead of the envisaged transformation of the mine into a modern, mechanised operation. At the end of 2014, AngloGold Ashanti converted Obuasi to limited operations, ceasing underground production, retrenching the workforce but continuing to process tailings, and starting a feasibility study
on the redevelopment of the mine. Development of the decline ramp has continued over this period.
The development plan will build on the feasibility study work completed with the intention of establishing a more focused, efficient, mechanised high grade operation, and is expected to take about four months to complete. If Randgold completes due diligence to its satisfaction and the development plan meets both parties’ investment criteria, and assuming all other conditions are satisfied, Randgold and AngloGold Ashanti will form a new joint venture company.
Randgold and AngloGold Ashanti will then be jointly responsible for funding the redevelopment of Obuasi in line with the agreed development plan. A Randgold group entity will be appointed as operator of the mine, and Randgold and AngloGold Ashanti will appoint an equal number of directors to the board of the joint venture company, with board and shareholder decisions to be approved by both parties.
Randgold is expected to complete and deliver a new development plan to both parties’ boards by 31 January 2016, should its work demonstrate a viable plan. Consequently, the Randgold team together with a multi-disciplinary team of experts managed by Randgold, are currently on site at Obuasi undertaking this work. Randgold expects to be in a position to update the market further on this opportunity by the next quarterly report.
The directors confirm to the best of their knowledge that: These third quarter results have been prepared in accordance with IAS
34 as adopted by the European Union; and The interim management report includes a fair review of the information
required by the FCA’s Disclosure and Transparency Rules (4.2.7R and 4.2.8R).
By order of the board
CAUTIONARY NOTE REGARDING FORWARD-LOOKING STATEMENTS: Except for the historical information contained herein, the matters discussed in this news release are forward-looking statements within the meaning of Section 27A of the US Securities Act of 1933 and Section 21E of the US Securities Exchange Act of 1934, and applicable Canadian securities legislation. Forward-looking statements include, but are not limited to, statements with respect to the future price of gold, the estimation of mineral reserves and resources, the realisation of mineral reserve estimates, the timing and amount of estimated future production, costs of production, reserve determination and reserve conversion rates. Generally, these forward-looking statements can be identified by the use of forward-looking terminology such as ‘will’, ‘plans’, ‘expects’ or ‘does not expect’, ‘is expected’, ‘budget’, ‘scheduled’, ‘estimates’, ‘forecasts’, ‘intends’, ‘anticipates’ or ‘does not anticipate’, or ‘believes’, or variations of such words and phrases or state that certain actions, events or results ‘may’, ‘could’, ‘would’, ‘might’ or ‘will be taken’, ‘occur’ or ‘be achieved’. Assumptions upon which such forward-looking statements are based are in turn based on factors and events that are not within the control of Randgold Resources Limited (‘Randgold’) and there is no assurance they will prove to be correct. Forward-looking statements are subject to known and unknown risks, uncertainties and other factors that may cause the actual results, level of activity, performance or achievements of Randgold to be materially different from those expressed or implied by such forward-looking statements, including but not limited to: risks related to mining operations, including political risks and instability and risks related to international operations, actual results of current exploration activities, conclusions of economic evaluations, changes in project parameters as plans continue to be refined, as well as those factors discussed in Randgold’s filings with the US Securities and Exchange Commission (the ‘SEC’). Although Randgold has attempted to identify important factors that could cause actual results to differ materially from those contained in forward-looking statements, there may be other factors that cause results not to be as anticipated, estimated or intended. There can be no assurance that such statements will prove to be accurate, as actual results and future events could differ materially from those anticipated in such statements. Accordingly, readers should not place undue reliance on forward-looking statements. Randgold does not undertake to update any forward-looking statements herein, except in accordance with applicable securities laws. CAUTIONARY NOTE TO US INVESTORS: The SEC permits companies, in their filings with the SEC, to disclose only proven and probable ore reserves. We use certain terms in this report, such as ‘resources’, that the SEC does not recognise and strictly prohibits us from including in our filings with the SEC. Investors are cautioned not to assume that all or any parts of our resources will ever be converted into reserves which qualify as ‘proven and probable reserves’ for the purposes of the SEC’s Industry Guide number 7.
D M BristowChief Executive
5 November 2015
G P ShuttleworthFinancial Director
OPERATIONAL RISKS NATURE AND IMPACT
PRINCIPAL RISK FACTORS AND UNCERTAINTIES (continued)
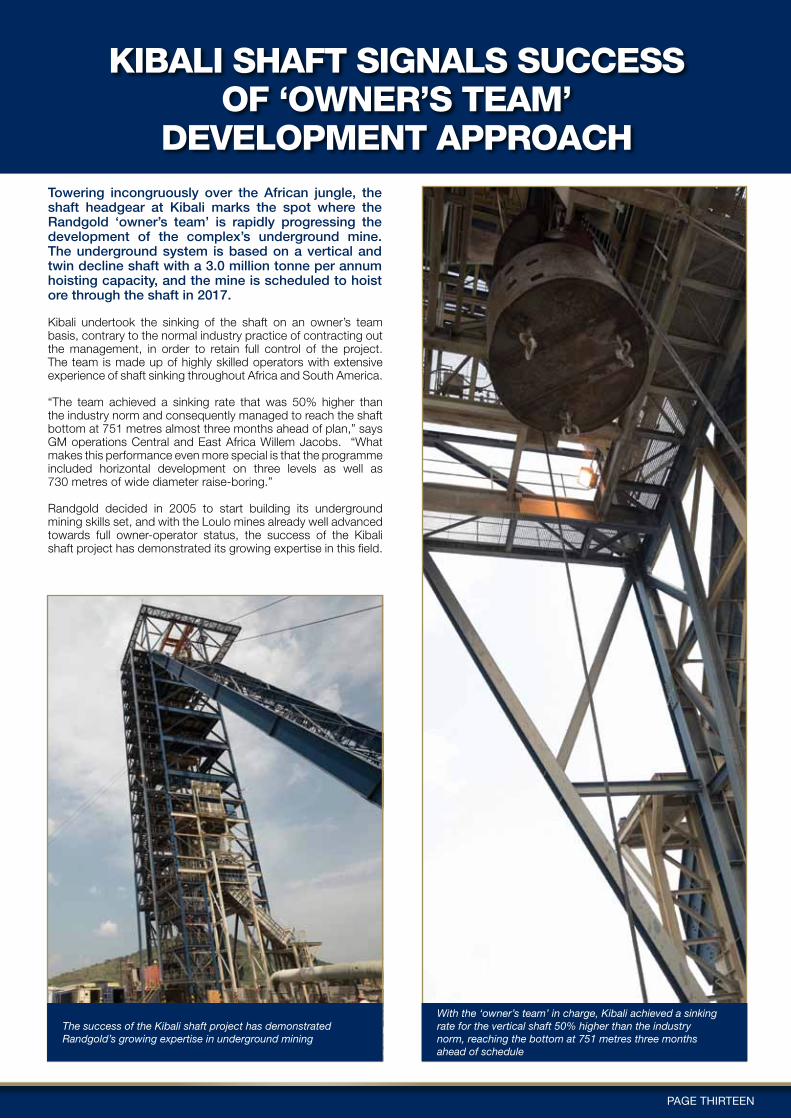
Towering incongruously over the African jungle, the shaft headgear at Kibali marks the spot where the Randgold ‘owner’s team’ is rapidly progressing the development of the complex’s underground mine. The underground system is based on a vertical and twin decline shaft with a 3.0 million tonne per annum hoisting capacity, and the mine is scheduled to hoist ore through the shaft in 2017.
Kibali undertook the sinking of the shaft on an owner’s team basis, contrary to the normal industry practice of contracting out the management, in order to retain full control of the project. The team is made up of highly skilled operators with extensive experience of shaft sinking throughout Africa and South America.
“The team achieved a sinking rate that was 50% higher than the industry norm and consequently managed to reach the shaft bottom at 751 metres almost three months ahead of plan,” says GM operations Central and East Africa Willem Jacobs. “What makes this performance even more special is that the programme included horizontal development on three levels as well as 730 metres of wide diameter raise-boring.”
Randgold decided in 2005 to start building its underground mining skills set, and with the Loulo mines already well advanced towards full owner-operator status, the success of the Kibali shaft project has demonstrated its growing expertise in this field.
KIBALI SHAFT SIGNALS SUCCESSOF ‘OWNER’S TEAM’
DEVELOPMENT APPROACH
With the ‘owner’s team’ in charge, Kibali achieved a sinking rate for the vertical shaft 50% higher than the industry norm, reaching the bottom at 751 metres three months ahead of schedule
The success of the Kibali shaft project has demonstrated Randgold’s growing expertise in underground mining
PAGE thirtEEN

The centre will provide a 12-month agricultural and entrepreneurial training programme on a five hectare farm, close to the mines, for 100 students selected by the local community development committee and sponsored by their villages. The concept and the programme were devised in conjunction with the SDDR, the National Malian Strategy for Rural Development.
At the launch, chief executive Mark Bristow said agribusiness was the core initiative in Randgold’s commitment to creating viable local economies as a legacy to the communities which host its operations. In addition to the Loulo-Gounkoto project, it is also developing agribusinesses at its Morila, Tongon and Kibali mines.
“A mine is relatively short-lived but a successful farm is forever, and that is why we are focusing on an agricultural heritage for our operations. Agribusiness will not only create employment but will also provide food security, which is one of the prime requirements of any community,” he said.
After completion of their 12-month course, groups of trainees will be set up as profit-sharing micro-enterprises under the
LAUNCH OF AGRI-TRAINING CENTREMARKS MAJOR NEW LEGACY INITIATIVE
The Loulo-Gounkoto agribusiness training centre, a project designed by Randgold Resources to provide the local community with a sustainable source of economic activity, was officially launched on 30 October in a ceremony attended by two Malian cabinet ministers and local government officials.
supervision of the centre management, and those who complete this incubation period successfully will be equipped and funded to start their own ventures. Each of them by then will have the ability to manage a productive, profitable and sustainable farm.
Bristow said it was intended to involve government and local investors in the development of agricultural manufacturing units and distribution systems.
Group community and environmental officer Hilaire Diarra said while conventional aid programmes merely propped people up for a while, Randgold’s investment in agribusinesses was providing local communities with a real opportunity to build a better future for themselves.
West African operations officer Chiaka Berthe said the agribusiness would also provide alternative employment opportunities to people currently engaged in illegal mining which was rife in the area as elsewhere in Africa’s mining countries. “We are working closely with the Malian government in an effort to stamp this out and to regulate small-scale or artisanal mining more effectively,” he said.
Left: The Malian Minister of employment, vocational training, youth and citizenship construction, Mahamane Baby, officially opens the customs building at the Mahinamine Customs Post on the border between Mali and Senegal, which was erected by Randgold, on 30 October 2015
Bottom left: On 30 October, Minister Mahamane Baby also opened the +$1 million Loulo-Gounkoto agri-training project which Randgold CEO Mark Bristow said “was in line with the Minister of Mine’s vision to make the mining industry a catalyst for community development and President Ibrahim Boubacar Keita and his Government‘s vision to make the country a reference for agriculture”. Also officiating at the ceremonies were representatives from the Ministries of Mines, Finance and Rural Development, the Governor of Kayes, the President of the Regional Council, the Prefect of Kenieba and numerous mayors, chiefs and local dignitaries
Bottom right: Students at the agricultural college
PAGE fourtEEN

Randgold’s Tongon mine has repaid its shareholder’s loans of $448 million, used to partially fund its capital investment of $580 million, thereby moving it into a dividend-paying position.
TONGON PASSES MAJOR MILESTONEAS RANDGOLD CONTINUES TO HUNT FOR MORE
Speaking at the mine’s quarterly briefing for local media, chief executive Mark Bristow described this as a significant achievement, particularly in the context of a global gold mining industry currently characterised by capital write-downs and impairments.
“Tongon has already paid close to $90 million to the Ivorian state in the form of royalties and taxes and the country will now benefit even more from the dividends the government will receive through its 10% carried interest in the mine as well as the increased revenue when Tongon starts paying full corporate tax at the end of this year,” Bristow said. He noted that since its commissioning five years ago, Tongon had also contributed more than $600 million to the Ivorian economy in the form of
payments to local suppliers and had invested almost $6 million in community upliftment projects.
“Ongoing exploration around Tongon has increased its reserves after depletion by 18% since 2009, extending its remaining life by another year. We also continue to look for more multi-million ounce deposits elsewhere in this highly prospective country, and we are about to launch our biggest-ever exploration drive in Côte d’Ivoire. This will include a fresh look at the Nielle permit, which hosts Tongon, and a geophysical survey, followed by a diamond drilling programme, across our holdings in the north of the country,” he said.
He also cited Tongon as a particularly good example of the success of Randgold’s policy of recruiting, training and empowering nationals of its host countries to run world-class mines in Africa. The mine’s workforce is 97% Ivorian and only two members of its management team are not Ivorians.
Tongon has won the President’s Award as the best mine in Côte d’Ivoire for two successive years.
PAGE fiftEEN
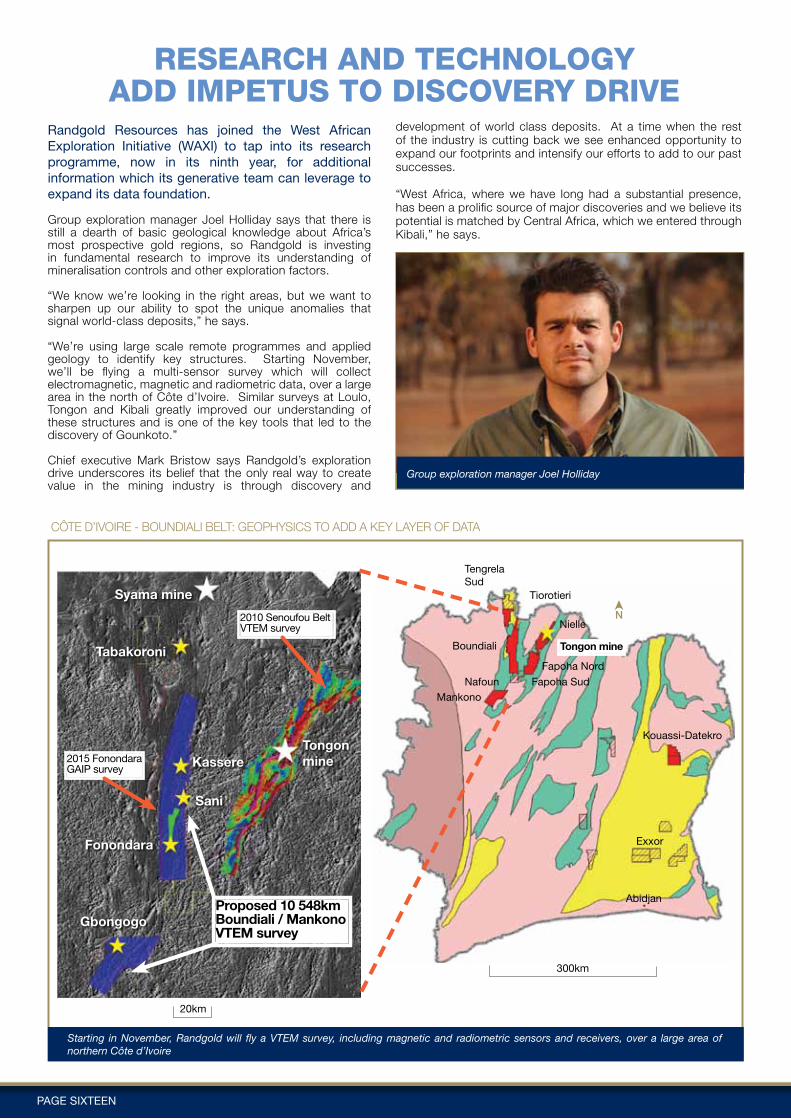
Group exploration manager Joel Holliday says that there is still a dearth of basic geological knowledge about Africa’s most prospective gold regions, so Randgold is investing in fundamental research to improve its understanding of mineralisation controls and other exploration factors.
“We know we’re looking in the right areas, but we want to sharpen up our ability to spot the unique anomalies that signal world-class deposits,” he says.
“We’re using large scale remote programmes and applied geology to identify key structures. Starting November, we’ll be flying a multi-sensor survey which will collect electromagnetic, magnetic and radiometric data, over a large area in the north of Côte d’Ivoire. Similar surveys at Loulo, Tongon and Kibali greatly improved our understanding of these structures and is one of the key tools that led to the discovery of Gounkoto.”
Chief executive Mark Bristow says Randgold’s exploration drive underscores its belief that the only real way to create value in the mining industry is through discovery and
RESEARCH AND TECHNOLOGYADD IMPETUS TO DISCOVERY DRIVE
Randgold Resources has joined the West African Exploration Initiative (WAXI) to tap into its research programme, now in its ninth year, for additional information which its generative team can leverage to expand its data foundation.
development of world class deposits. At a time when the rest of the industry is cutting back we see enhanced opportunity to expand our footprints and intensify our efforts to add to our past successes.
“West Africa, where we have long had a substantial presence, has been a prolific source of major discoveries and we believe its potential is matched by Central Africa, which we entered through Kibali,” he says.
CôTE D’IvOIRE - BOuNDIALI BELT: GEOPHySICS TO ADD A KEy LAyER Of DATA
N
Tongonmine
Gbongogo
Fonondara
Sani
Kassere
Tabakoroni
Syama mine
TengrelaSud
Tiorotieri
Nielle
Boundiali
Fapoha Nord
Fapoha SudNafounMankono
Kouassi-Datekro
Exxor
Abidjan
300km
20km
Tongon mine
2010 Senoufou Belt VTEM survey
2015 Fonondara GAIP survey
Proposed 10 548km Boundiali / Mankono VTEM survey
Group exploration manager Joel Holliday
PAGE sixtEEN
Starting in November, Randgold will fly a VTEM survey, including magnetic and radiometric sensors and receivers, over a large area of northern Côte d’Ivoire

Senior appointments in MaliChiaka Berthe, formerly GM of the Loulo-Gounkoto mine complex, has been promoted to West African operations officer. Chiaka has a Master’s degree in geological engineering from the Malian National School of Engineering and began his career with Randgold as a young graduate 20 years ago. He has been involved in the exploration, evaluation and production phases of the Loulo project, having served as production and resources geologist before being appointed mineral resources manager in 2006. Chiaka was appointed GM of Loulo-Gounkoto in 2012 and is a member of AusIMM and GASA. In 2015, Chiaka attended the Senior Executive Programme at the London Business School.
Tahirou Ballo, the former mine manager at Gounkoto, has assumed the position of GM at the Loulo-Gounkoto complex. He is a mining economics engineer with 21 years’ experience and served as mining superintendent for Randgold at the Syama mine from 1999. In 2009 Tahirou underwent the Randgold executive training programme. In 2010, he was promoted to operations manager at Loulo and then appointed GM at Gounkoto in 2011.
Chiaka Berthe, West African operations managerTahirou Ballo, GM of the Loulo Gounkoto mining complex
PAGE sEvENtEEN
The programmes start at feeder level, where operators and unskilled workers are given training on site as well as at technical schools. The aim, says Pretorius, is not only to give them the necessary work-related competencies but to imbue them with an understanding of Randgold’s business culture.
Then there is the Staigiare project, which provides work experience to students in mining-related disciplines at African universities. At present, more than 120 of these students are engaged in three-month practical training programmes at Randgold mines, with a new intake every quarter.
As well as rendering a service to the community and the industry, this project allows Randgold to identify particularly promising candidates for its bursary programme, which currently has recipients studying at universities in South Africa, Morocco, the uK and the uSA. Randgold also runs sponsorship schemes to assist talented undergraduates studying at university in our host countries, and is also currently funding two students to complete
INVESTMENT IN TRAINING AND DEVELOPMENTYIELDS HIGH HUMAN RETURNS
Randgold Resources’ extensive training programmes, run in conjunction with leading educational institutions, are designed to produce a workforce with world-class skills, says group human resources executive Philip Pretorius.
PhD research programmes in geologica l sc iences at Kingston university in the uK.
The continuing education of senior employees, in terms of technical skills as well as business acumen, is structured in partnership with internationally renowned inst i tut ions, notably the un i ve rs i t y o f P re to r i a engineering and mining faculty and the university of Cape Town’s business school. Senior group and operational executives — some of whom have come up through every tier of the training structure, from the entry level up — are also enrolled in executive development programmes which makes use of a number of the leading business schools in South Africa, the uSA and the uK.
“In line with Randgold’s policy of local employment, the aim of our investment in education and development is essentially to ensure that our world-class operations can be run by competent in-country managers, supported by skilled locally recruited workforces — and, beyond that, to cultivate the future leaders of the company,” says Randgold’s CEO Mark Bristow.
Group human resources executive Philip Pretorius
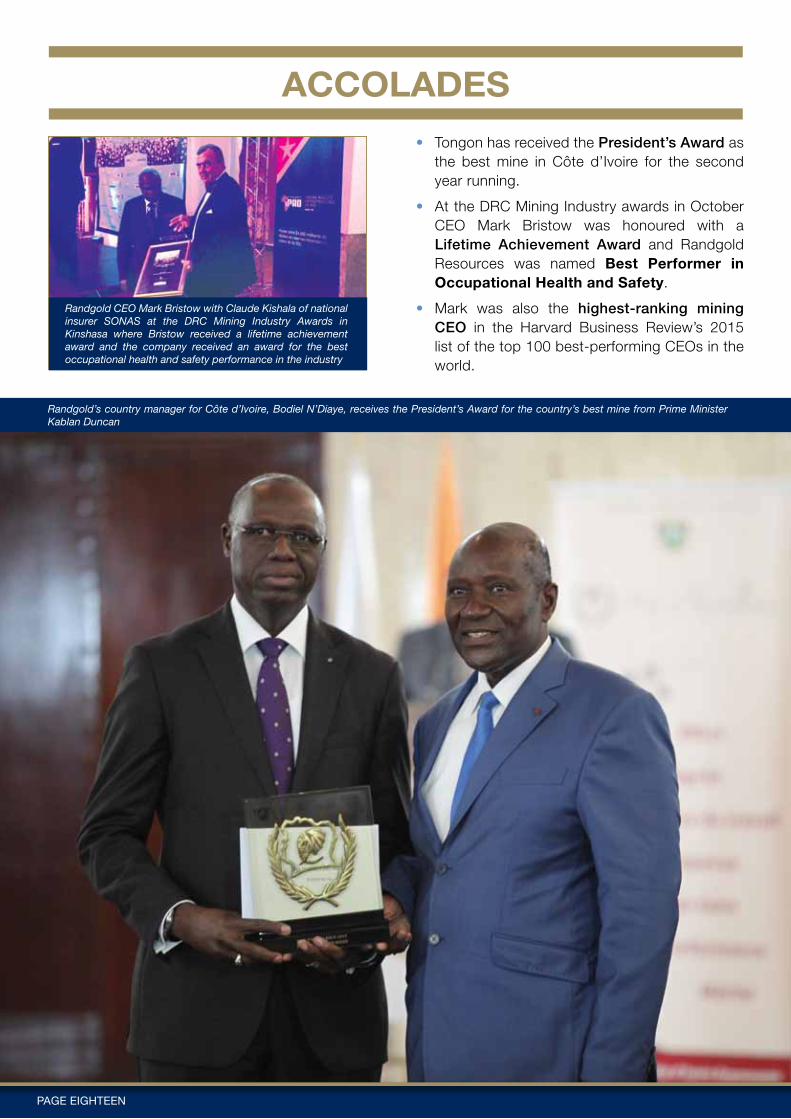
• Tongon has received the President’s Award as the best mine in Côte d’Ivoire for the second year running.
• At the DRC Mining Industry awards in October CEO Mark Bristow was honoured with a Lifetime Achievement Award and Randgold Resources was named Best Performer in Occupational Health and Safety.
• Mark was also the highest-ranking mining CEO in the Harvard Business Review’s 2015 list of the top 100 best-performing CEOs in the world.
ACCOLADES
Randgold CEO Mark Bristow with Claude Kishala of national insurer SONAS at the DRC Mining Industry Awards in Kinshasa where Bristow received a lifetime achievement award and the company received an award for the best occupational health and safety performance in the industry
Randgold’s country manager for Côte d’Ivoire, Bodiel N’Diaye, receives the President’s Award for the country’s best mine from Prime Minister Kablan Duncan
PAGE EiGhtEEN

Continued from page 1
Chief executive Mark Bristow said considering that the gold price had declined by 6% over this period to its lowest point since the first quarter of 2010, Randgold’s profit performance continued to be creditable. He noted that the company remained debt-free, with net cash increasing significantly from $109 million to $168 million, further strengthening its balance sheet.
During the quarter, Tongon paid back the last of its shareholders’ loans of $448 million, and can now start paying dividends, Kibali repaid another tranche of its shareholders’ loans and Gounkoto declared a dividend of $11 million, bringing its total for the year to date to $51.7 million. Kibali remains on track to exceed its full-year production guidance of 600 000 ounces and the group as a whole is expected to be within its guidance range.
Bristow said the group’s intensified exploration drive was producing positive results across the board, and in the new field season its generative team would be chasing opportunities to expand its footprint in its West and Central African target areas.
“Key developments to date have been the good results from Sofia in Senegal, which have significantly enhanced the prospects of our Massawa project, the ongoing brownfields drilling at Gara and yalea, the extension of resources and reserves around the Gounkoto and Tongon orebodies, and our improved understanding of the controls and styles of
mineralisation across the Kibali permit, which I believe will deliver substantial additional resources,” he said.
“In the fourth quarter we’ll be putting a big effort into our highly prospective holdings in Côte d’Ivoire, with a vTEM survey scheduled across the Boundiali and Makono permits in the north of the country. We’ll also be progressing the due diligence study on our Obuasi opportunity.”
Bristow said despite the state of the gold market Randgold continued to invest in its structured sustainability programmes, designed in line with its philosophy that mining companies had a moral obligation to put part of the value of the orebodies they exploit back into the creation of sustainable economic activities for the local communities.
These initiatives included the development of an agribusiness training centre between Loulo and Gounkoto, officially inaugurated last week, the establishment of microfinance businesses at all Randgold’s operations, completed feasibility studies on an agribusiness at Morila and a large-scale palm oil business at Kibali, and an entrepreneur training programme, also at Kibali.
“The gold mining industry is severely stressed and Randgold is certainly not immune to the pressure. Relative to our peers, however, we are still doing well. We have a proven strategy against which we constantly test our businesses, and we are relentless in our drive to deliver on our plans,” he said.
PAGE NiNEtEEN
Flying an earlier VTEM survey over the greater Tongon area
RANDGOLD POSTS NEW PRODUCTION RECORD, SPEEDS UP EXPLORATION DRIVE

dPA 5930
Bristow said the recent completion of the vertical shaft sinking, ahead of schedule, marked a major advance in the development of the underground mine which will complement Kibali’s existing open pit operation. The other remaining capital projects were also making good progress, with the mine’s second hydropower station in the process of commissioning the first of two phases.
“With the mine settling down, we have been able to intensify our focus on sustainability issues such as the mine’s ISO certifications in the field of the environment, health and safety,” Bristow said.
“Despite tough market conditions, Kibali also continues to invest in its extensive local development programme, which includes the introduction of the region’s first free-to-air television station, an entrepreneurship training programme led by the university of Cape Town’s Graduate School of Business and a local economic development facility to give loans to smallholding farmers and local entrepreneurs. The latter is a product of the recent cooperation agreement between Kibali, the local community and the local authorities.”
In related initiatives, a proposal on the development of a palm oil business in the region has been submitted to the DRC government
The Kibali gold mine in the north-east of the Democratic Republic of Congo is sustaining its operating momentum, and at this point looks set to exceed its 2015 production target of 600 000 ounces of gold, Randgold chief executive Mark Bristow said at the quarterly update for local media in Kinshasa.
and an 82 hectare maize project trial has been successfully launched.
Bristow said he hoped that both these projects would be backed by the state, and that the government would also roll out more support for Kibali’s efforts to promote economic activity in this remote and deprived region. He noted that the delay in implementing the DRC’s current move to a more federal structure was causing some dysfunction in the provincial administration and appealed for this issue to be addressed.
“Together with the other mining companies operating in the DRC we applaud the government’s decision to take another look at the proposed changes to the country’s mining code, which in our view are deeply flawed. The DRC possesses enormous mineral resources, and has the potential to become one of Africa’s wealthiest countries. With the drop in commodity prices, however, international capital providers will need the security of a transparent and equitable mining code before they invest further in what we believe could grow into a world-class mining industry,” he said.
KIBALI SUSTAINS MOMENTUM ANDEXPANDS LOCAL ECONOMIC DEVELOPMENT PROGRAMME
REGISTERED OFFICE 3rd floor, unity Chambers, 28 Halkett Street, St Helier, Jersey, JE2 4WJ, Channel Islands REGISTRARS Computershare Investor Services (Jersey) Limited, Queensway House. Hilgrove Street, St Helier, Jersey JE1 1ES, Channel IslandsTRANSFER AGENTS Computershare Services PLC, PO Box 663, 7th floor, Jupiter House, Triton Court, 14 finsbury Square, London EC2A 1BRINVESTOR AND MEDIA RELATIONS for further information contact Kathy du Plessis on telephone: +44 20 7557 7738, e-mail: [email protected]
PAGE twENty www.randgoldresources.com