2015 real estate forecast - home - naiop chicago · 2015 real estate forecast . speaker: ... the...
TRANSCRIPT

2015 Real Estate Forecast
Guest Speaker: Mark J. Eppli
Interim James H. Keyes Dean of Business Administration, Robert B. Bell, Sr., Chair in
Real Estate and Professor of Finance, Marquette University

2015 Board of Directors
2
President & Awards Co-Chair: Dan McCarthy, JLL President-Elect & Membership Chair: Carter Andrus, Prologis, Inc. Secretary: Fred Regnery, Colliers International Treasurer & Sponsorship Chair: Molly McShane, Conor Commercial Real Estate Program Chair: Mike Powers, Molto Properties LLC Awards Co-Chair: Anthony Pricco, Bridge Development Partners, LLC Developing Leaders & University Liaison: Greg Warsek, Associated Bank Legislative Chair: Kevin Matzke, Clarius Partners, LLC Summer Programs Chair: Johnny Carlson, Trammell Crow Company Downtown Initiative Co-Chairs: Jim Carris, CBRE Dan Shapiro, John Hancock Real Estate Developing Leaders President: Christine Choi, John Hancock Real Estate

2015 Board of Directors (Cont.)
Directors: Emeritus Board Members:
Susan Bergdoll, Duke Realty Jim Clewlow, CenterPoint Properties
Dan Leahy, NAI Hiffman Kevin Clifton, CBRE, Inc.
Dave Riefe, Seefried Properties Grady Hamilton, Trammell Crow Company
Adam Showalter, J.F. McKinney & Associates, Ltd. John Heiberger, The PrivateBank
Keith Stauber, JLL Ryan O’Leary, Duke Realty
Mike Tenteris, Cushman & Wakefield Steve Schnur, Duke Realty
Dan Walsh, Bank of America Merrill Lynch Sean Spellman, Opus Development Company
Hugh Williams, Avison Young

DON’T MISS YOUR OPPORTUNITY – Program Sponsorship information will be
emailed next week. Watch your inbox!
Become a 2015 NAIOP Chicago Program Sponsor

NAIOP Chicago Legislative Committee
MAKE YOUR VOICE HEARD!
NAIOP Chicago Legislative Committee will advance candidates and legislation favorable to NAIOP and
its membership.
Join our Committee today – see someone at the registration desk!
5

Mark J. Eppli Interim James H. Keyes Dean of Business Administration, Robert B. Bell, Sr., Chair in Real Estate & Professor of Finance Marquette University
• Coauthor of the bestselling real estate development text in the nation • Prior to obtaining doctorate, worked in commercial real estate for PM
Realty Advisors and GE Capital • Awards from Greater Washington Urban League and the Urban Land
Institute for his efforts to attract minorities to the real estate profession • Board member for the Federal Home Loan Bank of Chicago • Ph.D. from the University of Wisconsin, in Real Estate and Urban Land
Economics • Native of Fond Du Lac, Wisconsin

2015 Real Estate Forecast
Speaker: Mark J. Eppli
Interim James H. Keyes Dean of Business Administration, Robert B. Bell, Sr., Chair in
Real Estate and Professor of Finance Marquette University

Economic and Real Estate Forecast 2015
Presented to: NAIOP Chicago
Presented by: Mark J. Eppli Interim Keyes Dean and Bell Chair in Real Estate
Marquette University
January 15, 2015

Presentation Outline
I. The Third Great Wave II. GDP and Employment III. Inflation, Interest Rates, and Equity Investment IV. Space Markets
A. Single and Multifamily Housing B. Retail C. Office and Industrial
The Third Great Wave
For a while, after the second world war everybody seemed to benefit from the large U.S. corporate model:
– Workers got security, benefits, and steady wage rises;
– Companies got a stable workforce in which they could invest with fair expectation of returns.
– That model ran into trouble in the 1970s, thanks to growth in the U.S. labor force, then deteriorating industrial relations, then globalization and now computerization.
The Third Great Wave
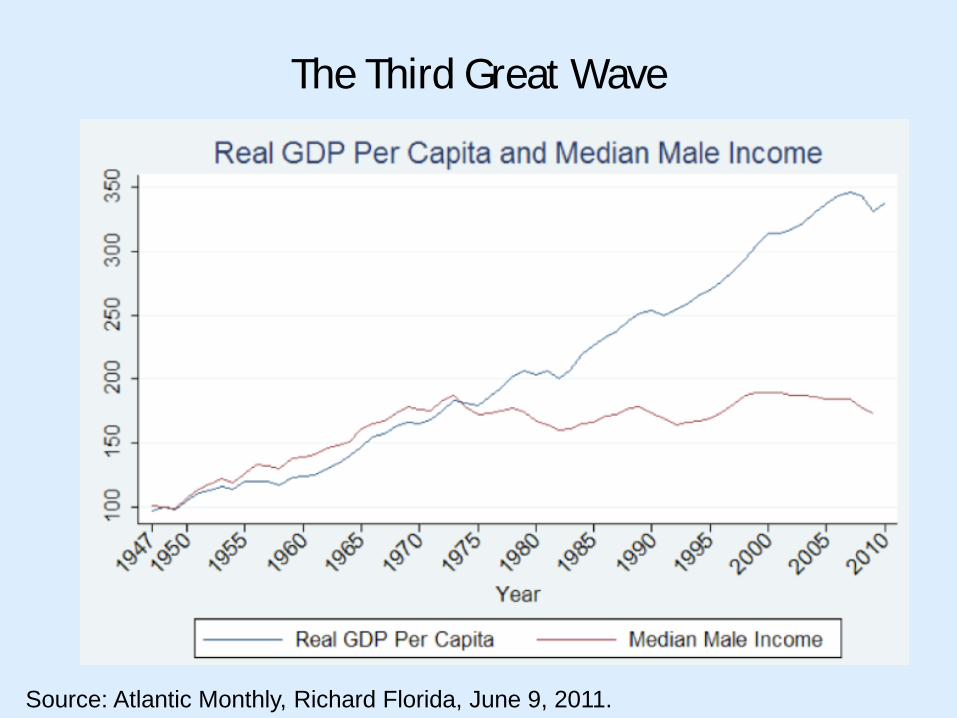
Source: Atlantic Monthly, Richard Florida, June 9, 2011.
The Third Great Wave
The smartphone will deliver labor and services in new ways that will challenge many of the fundamental assumptions of 20th century capitalism, from the sourcing of information to nature of the firm to the structure of careers. The new iPhones sold over the weekend can access 25 times more computing power than the whole world had at its disposal in 1995.
Source: The Economist, January 3, 2015, p. 17.
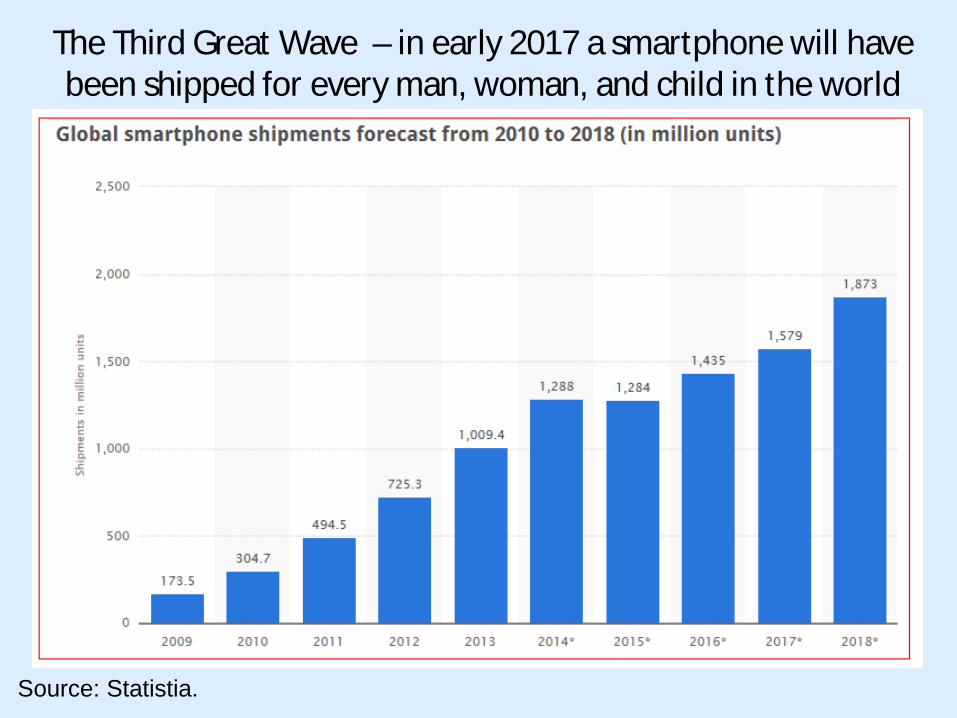
The Third Great Wave – in early 2017 a smartphone will have been shipped for every man, woman, and child in the world
Source: Statistia.
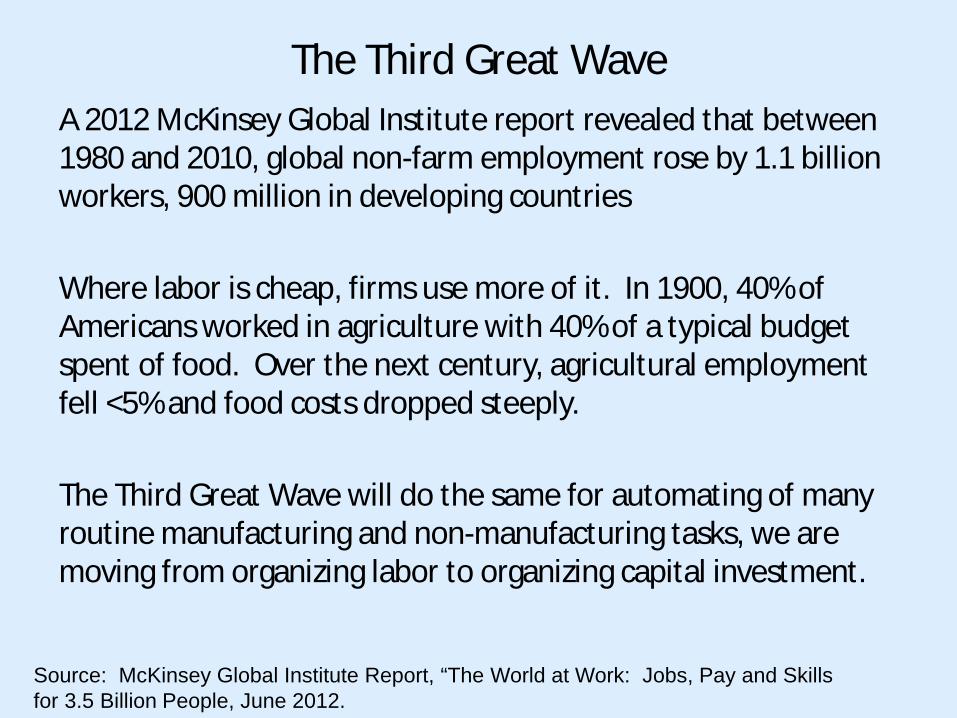
The Third Great Wave A 2012 McKinsey Global Institute report revealed that between 1980 and 2010, global non-farm employment rose by 1.1 billion workers, 900 million in developing countries Where labor is cheap, firms use more of it. In 1900, 40% of Americans worked in agriculture with 40% of a typical budget spent of food. Over the next century, agricultural employment fell <5% and food costs dropped steeply. The Third Great Wave will do the same for automating of many routine manufacturing and non-manufacturing tasks, we are moving from organizing labor to organizing capital investment.
Source: McKinsey Global Institute Report, “The World at Work: Jobs, Pay and Skills for 3.5 Billion People, June 2012.

The Third Great Wave
Source: The Economist, Special Report, October 4, 2014, p. 5

The Third Great Wave
• Highly skilled work has become increasingly concentrated in jobs requiring complex and/or interpersonal skills
• The wage premium for cognitively complex jobs, jobs beyond the abilities of people with reasonable qualifications, will be in significant demand
• Simultaneously, a growing reservoir of less-skilled labor will have their jobs automated, forcing them into a small share of the global economic pie.
• How will the Third Great Wave impact you?
The Economist, Special Edition, October 4, 2014, p. 11.

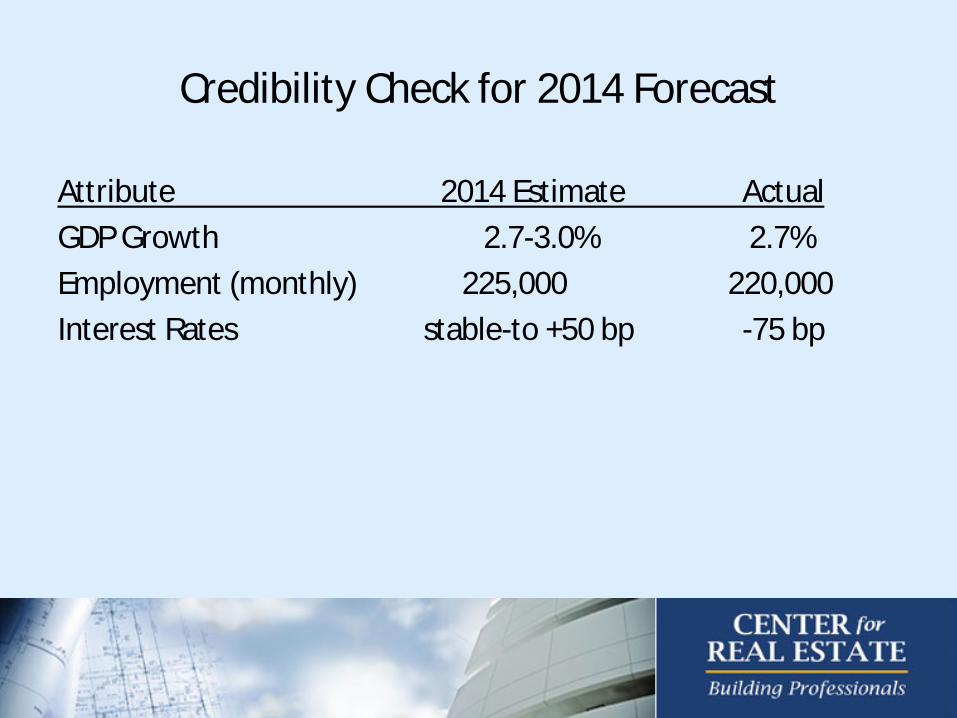
Credibility Check for 2014 Forecast
Attribute 2014 Estimate Actual GDP Growth 2.7-3.0% 2.7% Employment (monthly) 225,000 220,000 Interest Rates stable-to +50 bp -75 bp

Since 2000, GDP has an average annual growth rate of 1.85%, GDP grew 2.7% over the previous four quarters . . . .
Source: Federal Reserve.

. . . . oil prices will stay low in 2015 helping economic growth . . . .
Source: The Economist, The World in 2015, p. 94.

. . . . and the drop in oil prices will put dollars in our pockets and reduce inflation . . . .
• The drop in oil prices will put an average of $550 in the pockets of each household next year, and boost GDP by 0.35% (assuming a $2.57 per gallon gas price)
• Additionally, consumers see the lower gas prices and more broadly reduce their expectations of inflation, as gas prices are an every day reminder
Source: U.S. Energy Information Administration

. . . . A 1/3 reduction in the pump price of gas increases household income between 1% and 3% . . . .

. . . . a strong dollar hurts economic growth. Firms in the S&P 500 make 40% of their profits abroad . . . .
Source: WSJ, January 3-4, 2015, p. A2.

. . . . foreign currency weakness is partially explain demographically . . . . .
Source: The Economist, November 22, 2014, p. 72

Since 2010 the U.S. economy has grown by 10 million jobs (about 170,000 per month) . . . .
Source: Federal Reserve.
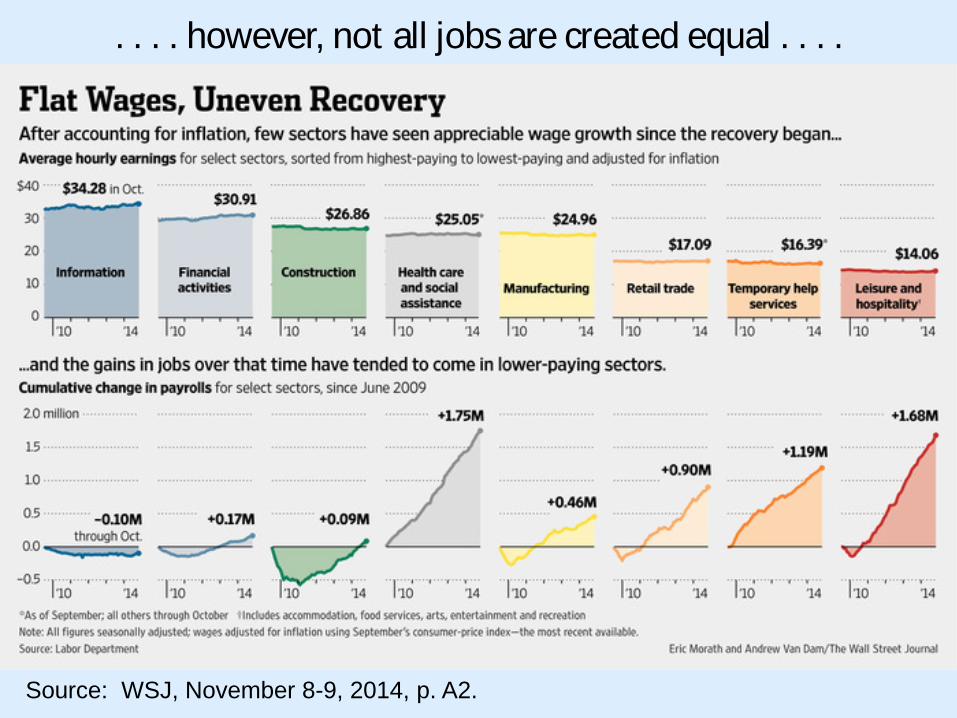
. . . . however, not all jobs are created equal . . . .
Source: WSJ, November 8-9, 2014, p. A2.

. . . . on a positive prospective note, unemployed workers per job openings is at a 13 year low . . . .
Source: WSJ, October 8, 2014, p. A2.
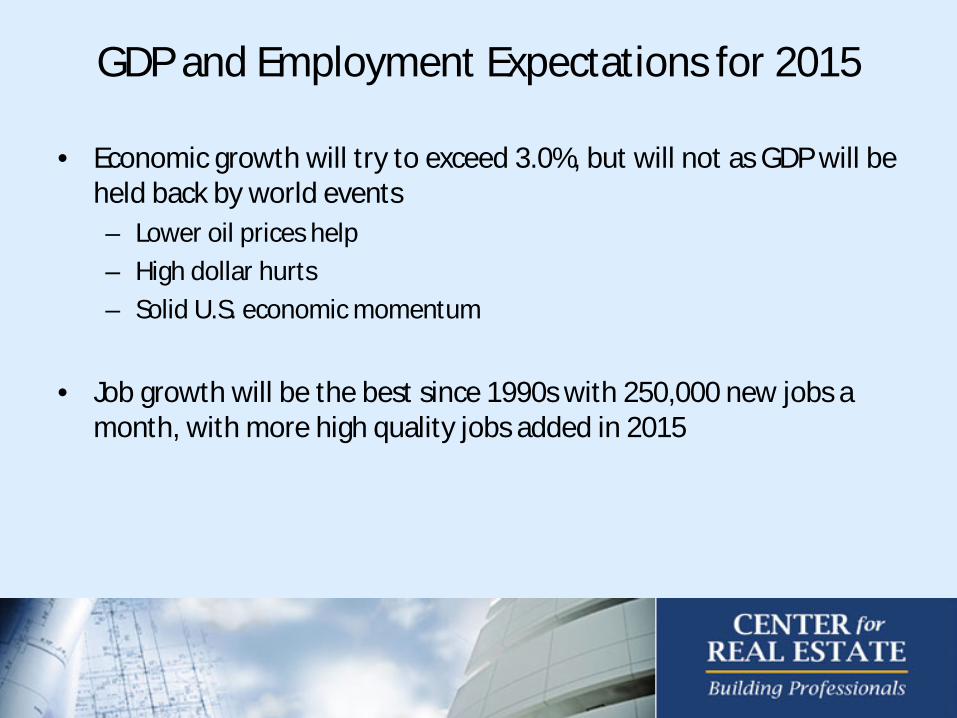
GDP and Employment Expectations for 2015
• Economic growth will try to exceed 3.0%, but will not as GDP will be held back by world events – Lower oil prices help – High dollar hurts – Solid U.S. economic momentum
• Job growth will be the best since 1990s with 250,000 new jobs a
month, with more high quality jobs added in 2015

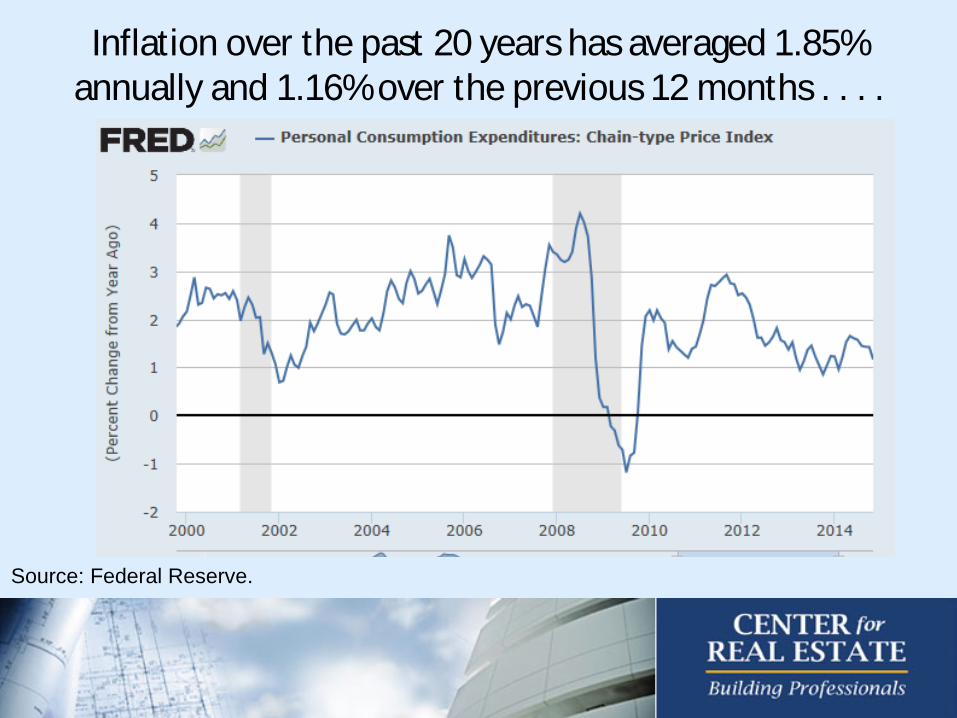
Inflation over the past 20 years has averaged 1.85% annually and 1.16% over the previous 12 months . . . .
Source: Federal Reserve.

. . . . allowing interest rates to remain low . . . .
Source: Federal Reserve.
. . . . other impacts on U.S. rates . . . .
• A strong dollar reduces import prices
• Low oil prices directly reduce headline inflation and indirectly reduces core inflation
• Weakness in Europe and Japan has pushed foreign investors into U.S. markets, lowering rates as a strong dollar impacts the global flow of capital
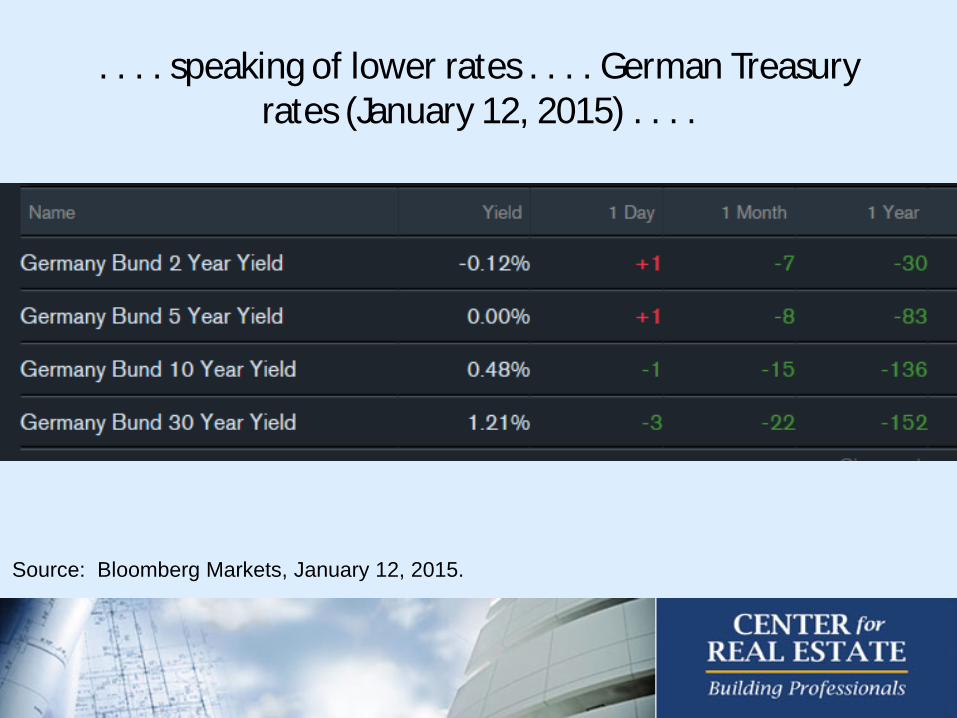
. . . . speaking of lower rates . . . . German Treasury rates (January 12, 2015) . . . .
Source: Bloomberg Markets, January 12, 2015.

In the U.S.
• Commercial real estate loans a U.S. banks is up more than $100 billion to $1.65 trillion
• Multifamily is up 14.5% totaling $289 billion while non-residential lending is up 6% totally in $655 billion
• Charge off rates have fallen to $30 billion or 1.8% of loans outstanding.
Source: The FDIC CoStar, Mark Heschmeyer, December 10, 2014

. . . . and equity investment and transactions sales are back to the healthy and sustainable levels of 2006 . . .
.
Source: Lawrence Yun, NAR.
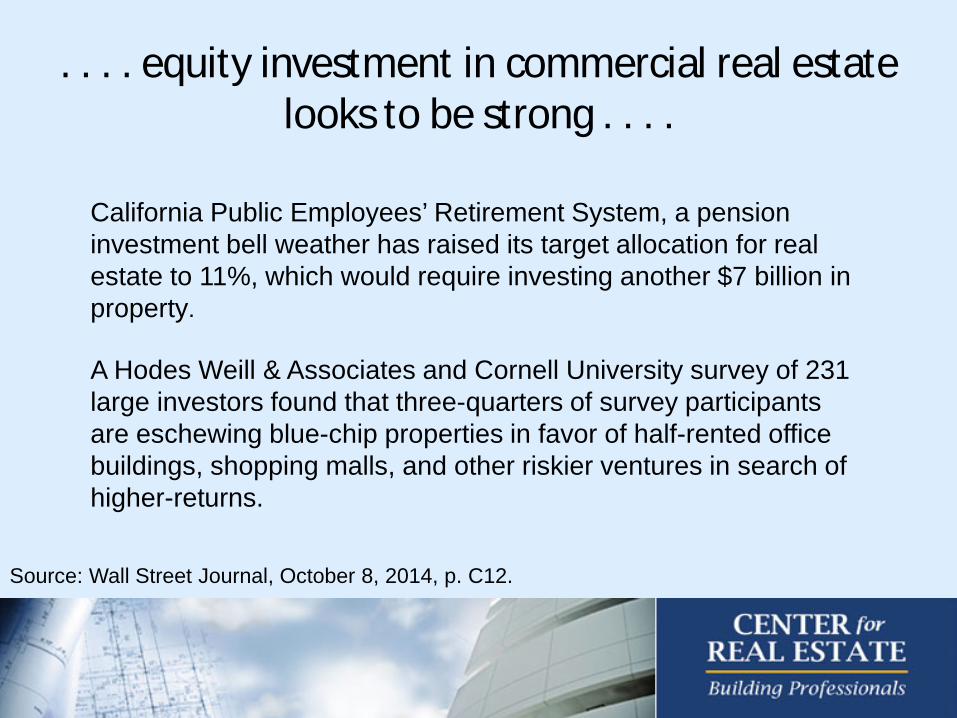
. . . . equity investment in commercial real estate looks to be strong . . . .
A Hodes Weill & Associates and Cornell University survey of 231 large investors found that three-quarters of survey participants are eschewing blue-chip properties in favor of half-rented office buildings, shopping malls, and other riskier ventures in search of higher-returns.
California Public Employees’ Retirement System, a pension investment bell weather has raised its target allocation for real estate to 11%, which would require investing another $7 billion in property.
Source: Wall Street Journal, October 8, 2014, p. C12.

. . . . the Midwest property returns are mean-reverting . . . .
Source: NCREIF Third Quarter 2014 Real Estate Performance Report.
PeriodNational
Property Index East Midwest South West1 Year 11.3% 9.2% 10.4% 12.8% 10.0%10 Year 8.6% 8.3% 7.2% 8.7% 9.2%20 Year 9.6% 9.8% 7.9% 8.9% 10.5%
National Property Index Returns By Region (through 2014Q3)

Interest Rate, Debt, and Equity Expectations for 2015 • Current 10-year Treasury interest rates are unsustainably low, and by
mid-year will push back toward 2.5% (capital flows issues)
• The will do so slowly pushing UST toward 2.75% by year end (deflation fears in Europe and Japan and low inflation will allow the Fed some flexibility)
• Bank lending will continue much like in 2014 with healthy competition, relatively health underwriting, and generally reasonable risk spreads (thanks to low Treasury rates)
• Equity investment in commercial real estate will grow with private equity, institutional, international, and REIT money all in play

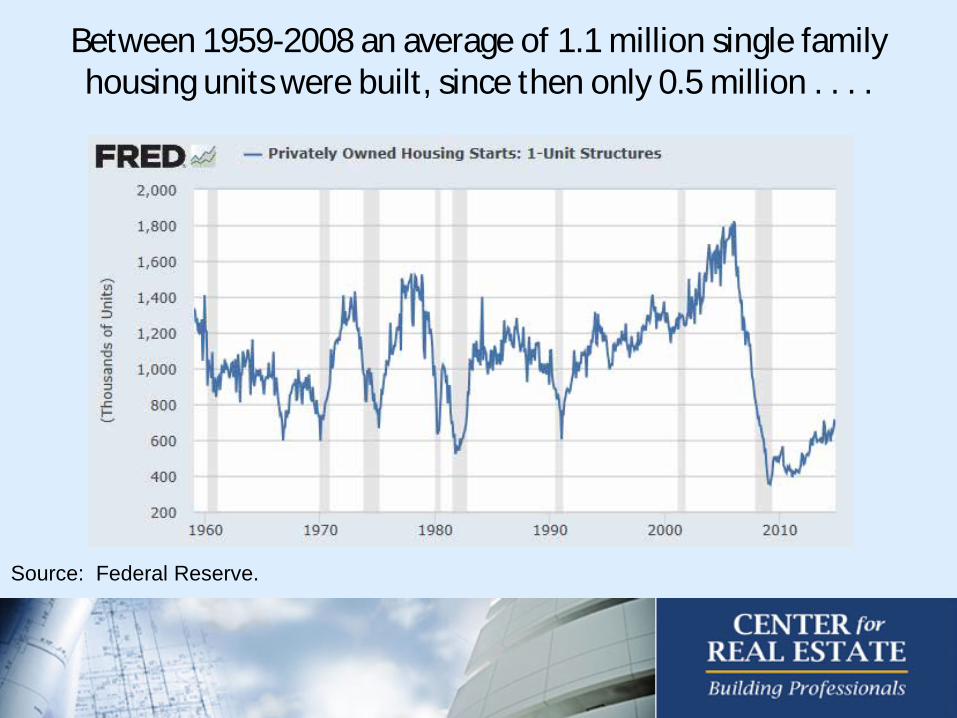
Between 1959-2008 an average of 1.1 million single family housing units were built, since then only 0.5 million . . . .
Source: Federal Reserve.

. . . . with the supply of existing homes have edging up . . . .
Source: Federal Reserve.

Share of first-time home buyers is the lowest in 27 years with the most recent share being 29%.
Source WSJ, November 4, 2014, p. A3.

. . . . of the 18-40 age cohort, 32% have credit score off less than 600 and 44% have a credit score of less than 650 . . . .
Source: WSJ, September 22, 2014, p. A2.

. . . . in addition, young adults have increased debt loads and stagnant net worth . . . .
Source: WSJ, November 10, 2014, p. A3.

. . . . Finally, the percent of married men between 20-49 has fallen along with income . . . .
Source: NYT, December 7, p. 3.

Expect continued weakness similar to 2014 with a modest growth rate in the single-family housing market

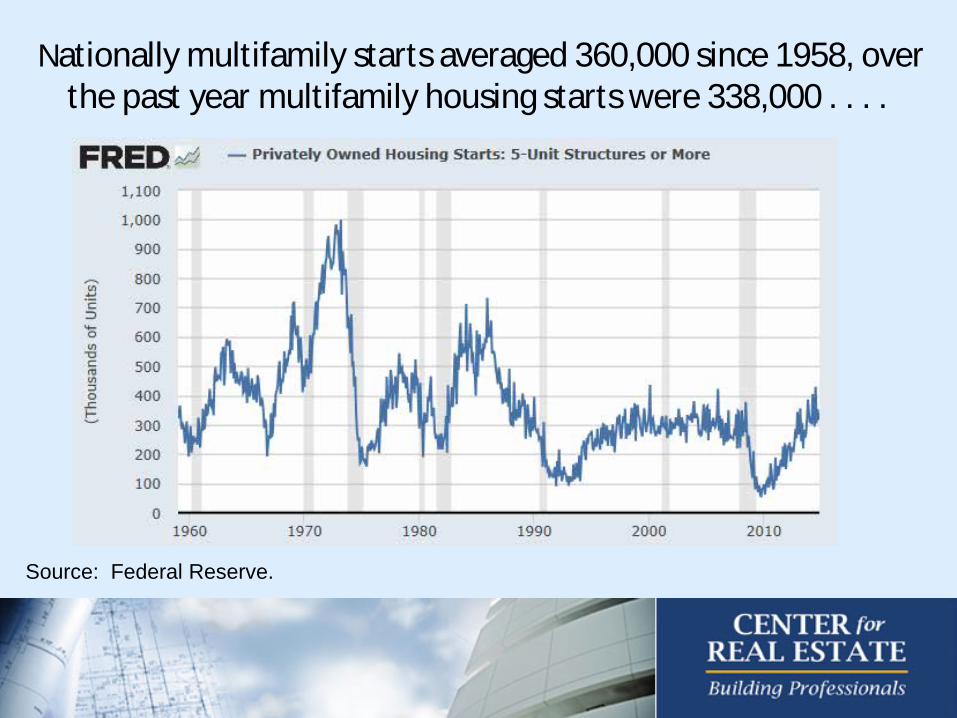
Nationally multifamily starts averaged 360,000 since 1958, over the past year multifamily housing starts were 338,000 . . . .
Source: Federal Reserve.
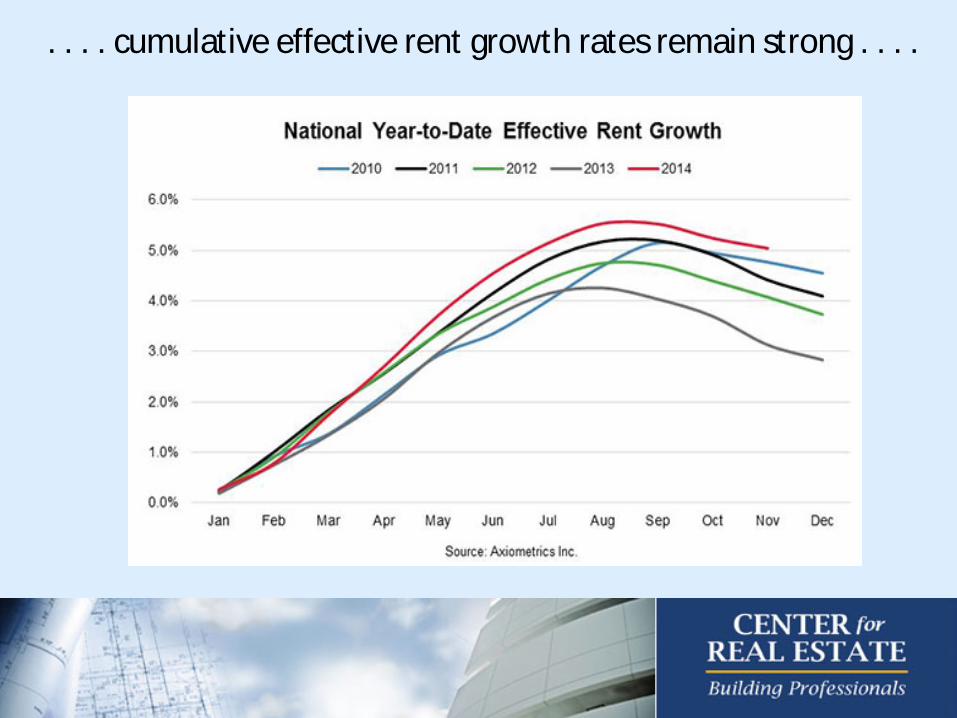
. . . . cumulative effective rent growth rates remain strong . . . .
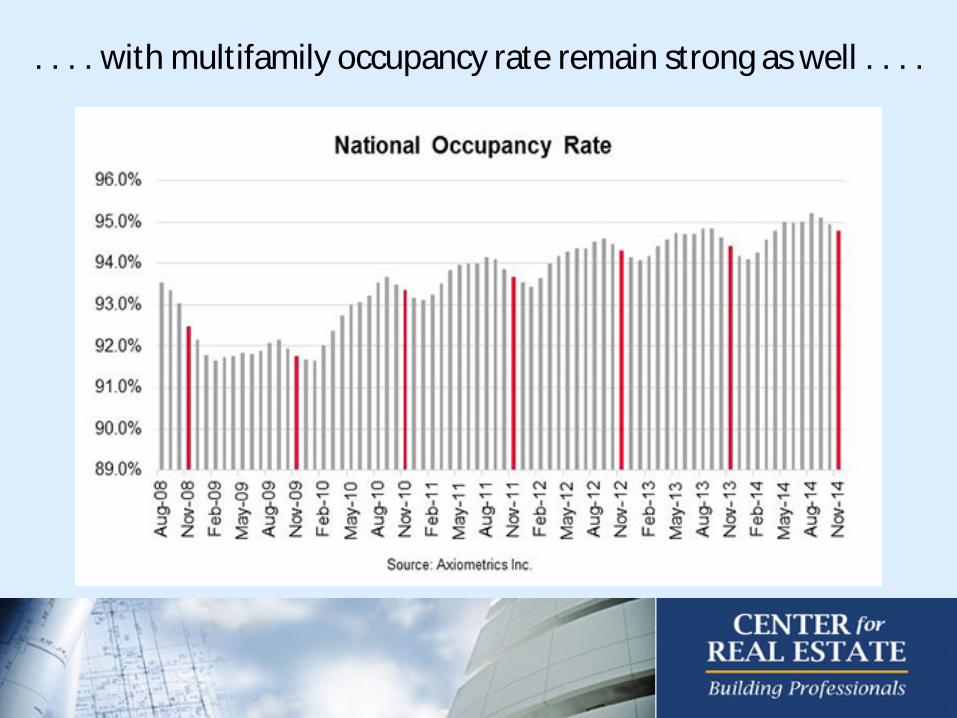
. . . . with multifamily occupancy rate remain strong as well . . . .

. . . . and apartment cap rates have stabilized.
Source: CoStar.
Apartment Capitalization Rates 2009Q2-2014Q2

Apartment pricing and space fundamentals will remain very strong in 2015.


Real retail sales fundamentals are solid and on an uptick (and don’t forget the $550 lower gas price bonus) . . . .
Source: Federal Reserve.

. . . . and households have “dry powder” . . . .
Source: Federal Reserve.

. . . . as consumer sentiment strengthens, consumption expenditures will remain solid (the fall in oil prices will help) . . .
.
Source: Federal Reserve.

MarketRentable Building
AreaYTD Net
AbsorptionYTD Percent Net
Absorption Vacancy Rate Quoted RatesChicago 508,629,677 4,887,514 0.96% 8.50% $15.62Milwaukee 137,389,961 629,888 0.46% 6.70% $10.80Minneapolis 198,794,321 293,665 0.15% 5.20% $13.08Green Bay 31,550,040 190,146 0.60% 6.80% $9.80 National 12,543,939,753 72,606,603 0.58% 6.30% $14.84
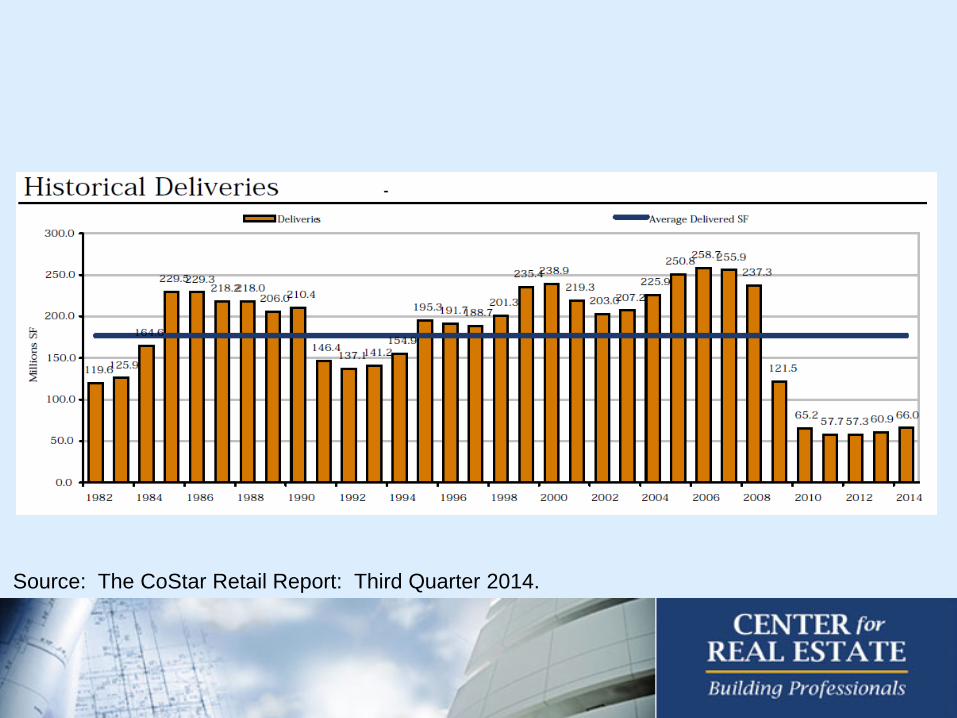
Total Retail Market Statistics (YTD, 2014Q3)
Source: The CoStar Retail Report: Third Quarter 2014.

. . . . retail cap rates have stabilized. . . .
Source: Reis Reports.
Retail Capitalization Rates 2009Q2-2014Q2

. . . . with cap rates varying by property size.
Source: The CoStar Retail Report: Third Quarter 2014.

Retail pricing and absorption fundamentals in 2015 will remain strong.

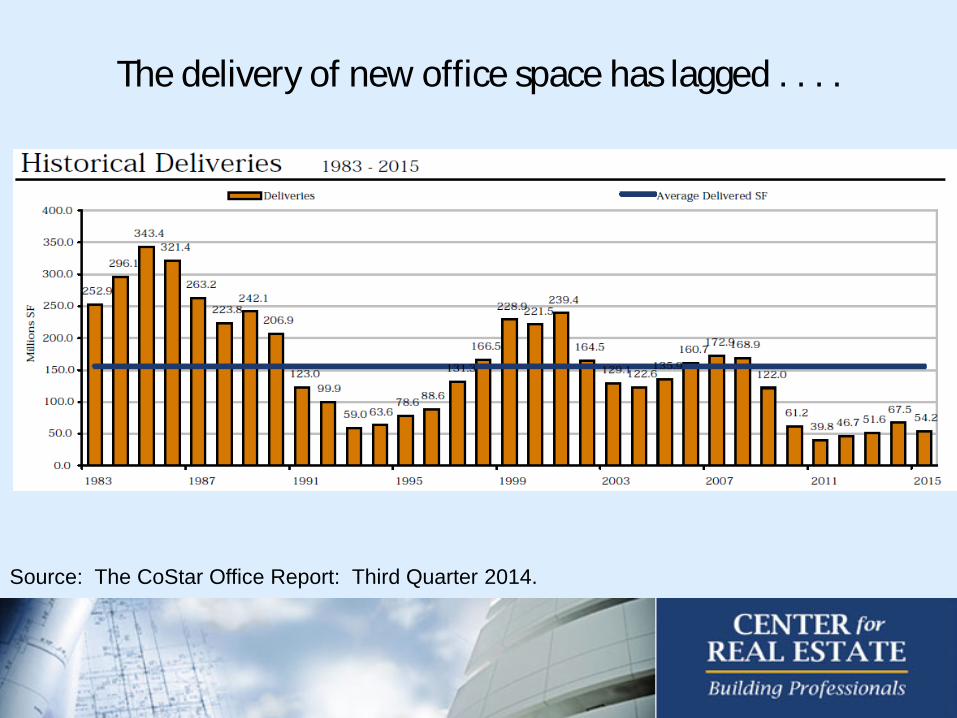
The delivery of new office space has lagged . . . .
Source: The CoStar Office Report: Third Quarter 2014.
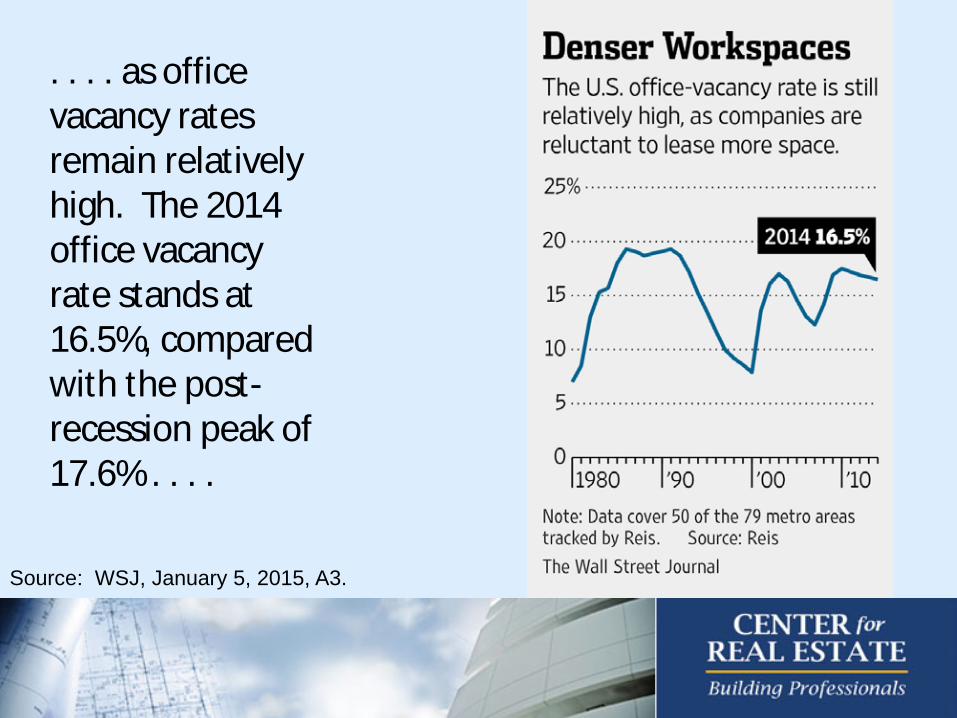
. . . . as office vacancy rates remain relatively high. The 2014 office vacancy rate stands at 16.5%, compared with the post-recession peak of 17.6% . . . .
Source: WSJ, January 5, 2015, A3.

. . . . with office rent growth in all classes largely stagnant. . . .
Source: CoStar Office Report, 2014Q3.

. . . . net office absorption remains weak in Chicago and Milwaukee . . . .
Class A MarketRentable Building
AreaYTD Net
AbsorptionYTD Percent Net
Absorption Vacancy Rate Quoted RatesChicago 171,554,935 (51,414) -0.03% 15.80% $26.78Milwaukee 12,762,844 73,329 0.57% 10.00% $19.49Minneapolis 49,397,363 1,440,814 2.92% 7.90% $23.88Green Bay 1,204,643 61,885 5.14% 12.70% $15.42 National 3,243,848,031 35,121,400 1.08% 12.50% $28.55Class B MarketChicago 208,931,627 1,105,363 0.53% 13.40% $20.41Milwaukee 48,283,520 (287,949) -0.60% 11.50% $15.33Minneapolis 98,324,391 52,277 0.05% 10.40% $16.13Green Bay 10,168,200 (16,121) -0.16% 11.70% $12.08 National 4,857,634,779 27,175,309 0.56% 11.70% $20.07
Total Office Market Statistics (YTD, 2014Q3)
Source: The CoStar Office Report: Third Quarter 2014.
. . . . with urban and suburban office rent growth diverging . . . .
• Over the past four years CBD office rents rose 18.7% while suburban office rents rose just 3.3%.
• Employers want to be where talent young talent resides • Young talent want:
– To live differently from their parents – Walkable neighborhood in with vibrant night life – To marry later, do not believe as strongly in home ownership – To pay off student loans
Source: CoStar Group.

. . . . however, corporate profits continue to be very strong, suggesting future demand . . . . . . .
Source: Federal Reserve.

. . . . with office cap rates reveal investor bullishness . . .
Source: Reis Reports.
Office Capitalization Rates 2009Q2-2014Q2
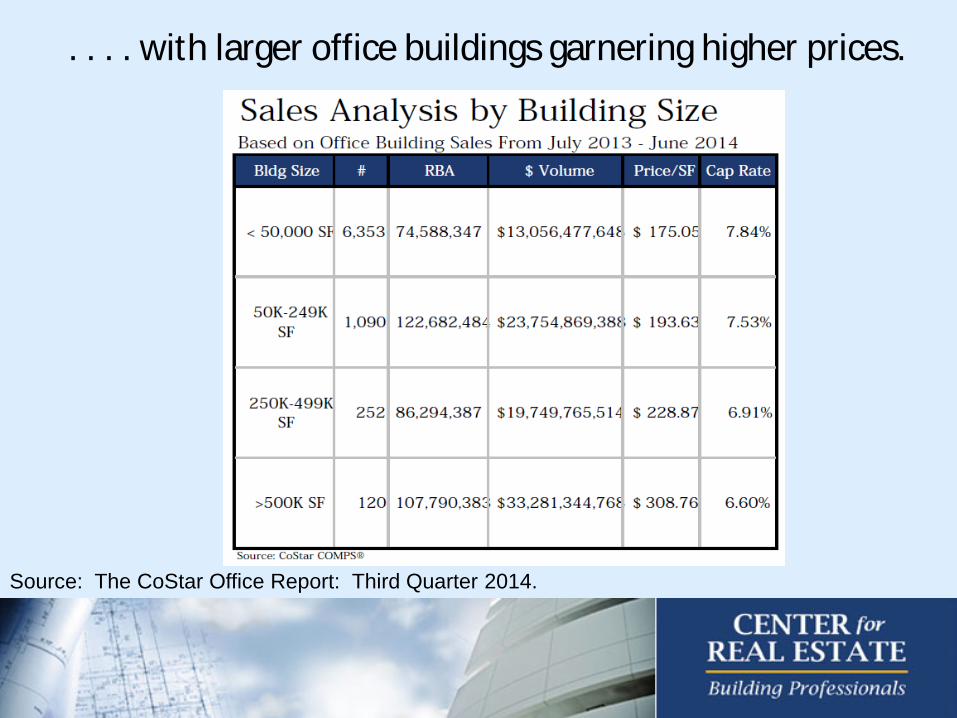
. . . . with larger office buildings garnering higher prices.
Source: The CoStar Office Report: Third Quarter 2014.

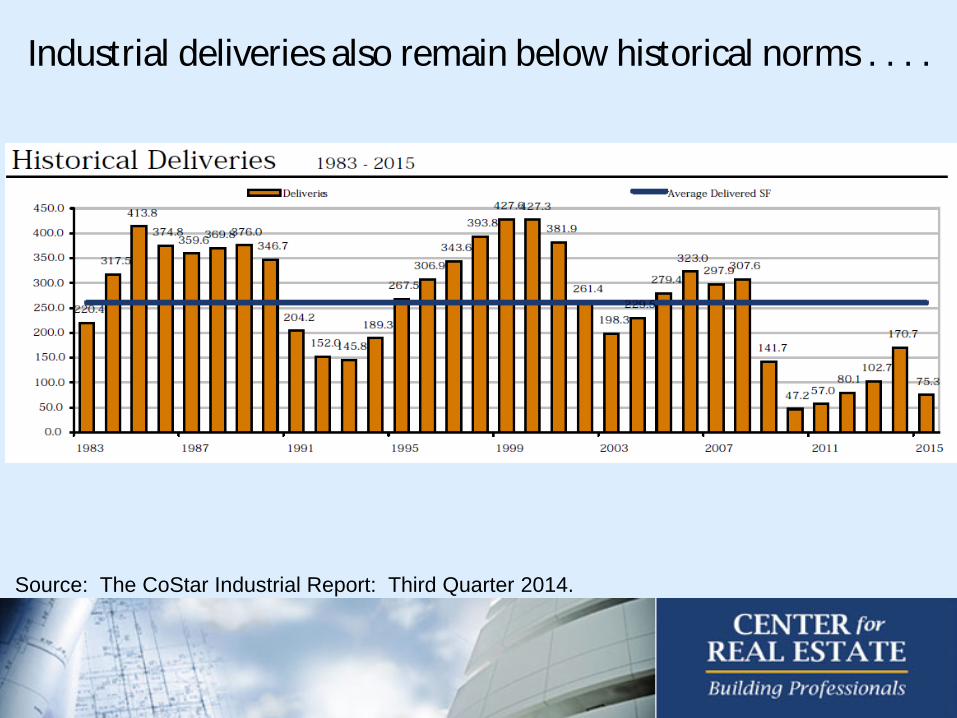
Industrial deliveries also remain below historical norms . . . .
Source: The CoStar Industrial Report: Third Quarter 2014.

. . . . capacity utilization remains solid, which is comforting to industrial space owners . . . .
Source: Federal Reserve.
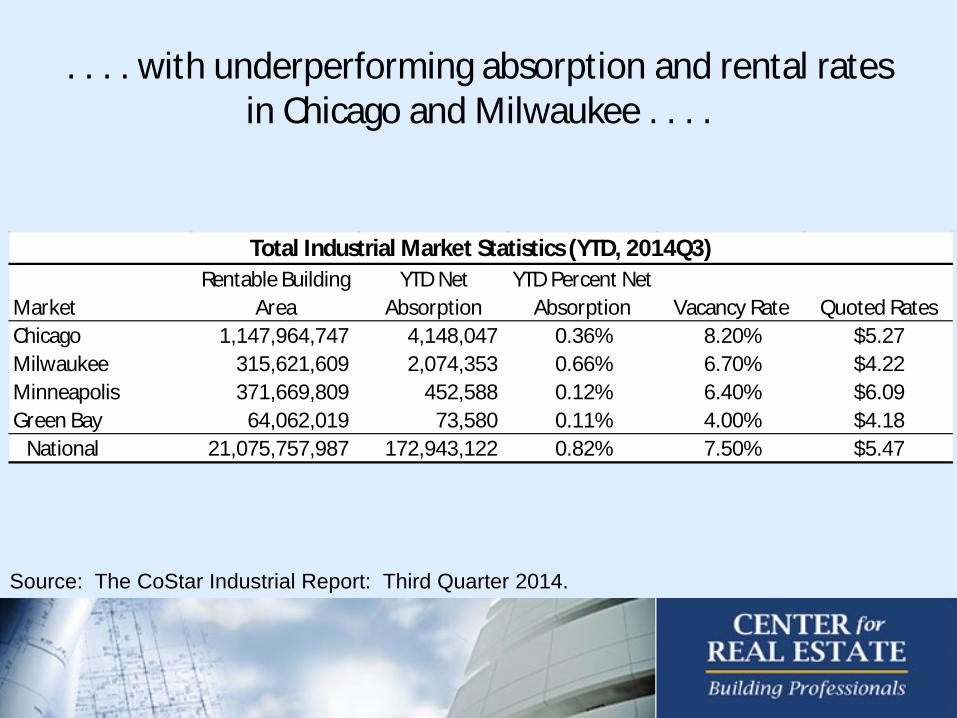
. . . . with underperforming absorption and rental rates in Chicago and Milwaukee . . . .
MarketRentable Building
AreaYTD Net
AbsorptionYTD Percent Net
Absorption Vacancy Rate Quoted RatesChicago 1,147,964,747 4,148,047 0.36% 8.20% $5.27Milwaukee 315,621,609 2,074,353 0.66% 6.70% $4.22Minneapolis 371,669,809 452,588 0.12% 6.40% $6.09Green Bay 64,062,019 73,580 0.11% 4.00% $4.18 National 21,075,757,987 172,943,122 0.82% 7.50% $5.47
Total Industrial Market Statistics (YTD, 2014Q3)
Source: The CoStar Industrial Report: Third Quarter 2014.

. . . . only 8 of the last 73 readings in the previous economic expansion were as high as the November 2014 reading, all coming prior to 2005 . . .
.
Source: Federal Reserve.

. . . . with cap rates declining with size.
Source: The CoStar Industrial Report: Third Quarter 2014.

Office absorption fundamentals will remain weak, but cap rate compression indicates market pricing
optimism in 2015.
Industrial pricing and absorption fundamentals will stabilize.

Summary I. Macro Economy
A. The smart phone will challenge the fundamental assumptions of capitalism, labor markets, and firm structure
B. GDP growth will approach 3.0%; C. 250,000 jobs will be created per month; D. 10-year UST rates will revert to 2.5% by mid-year closing out the year at
approximately 2.755
II. Capital and Space Markets A. Debt markets are back with lenders easing underwriting standards and
looking to lend more money; B. Equity markets will be awash with capital from most all real estate capital
market participants. C. All space markets except office will have a solid if not very good year, not
overbuilding in apartments – yet.

Economic and Real Estate Forecast 2015
Presented to: NAIOP Chicago
Presented by: Mark J. Eppli Interim Keyes Dean and Bell Chair in Real Estate
Marquette University
January 15, 2015