2015 third quarter financial results & overview · regarding our financial position, results of...
TRANSCRIPT

www.group1auto.com
October 27, 2015
‘VALUE DRIVEN’
2015 Third Quarter
Financial Results & Overview
Copyright © 2014 Group 1 Automotive, Inc. All rights reserved.
www.group1auto.com
This presentation contains "forward-looking statements“ within the meaning of the Private Securities Litigation
Reform Act of 1995, which are statements related to future, not past, events and are based on our current
expectations and assumptions regarding our business, the economy and other future conditions. While
management believes that these forward-looking statements are reasonable as and when made, there can be
no assurance that future developments affecting us will be those that we anticipate. In this context, the
forward-looking statements often include statements regarding our goals, plans, projections and guidance
regarding our financial position, results of operations, market position, pending and potential future
acquisitions and business strategy, and often contain words such as “expects,” “anticipates,” “intends,”
“plans,” “believes,” “seeks,” “should,” “foresee,” “may” or “will” and similar expressions. Any such forward-
looking statements are not assurances of future performance and involve risks and uncertainties that may
cause actual results to differ materially from those set forth in the statements. These risks and uncertainties
include, among other things, (a) general economic and business conditions, (b) the level of manufacturer
incentives, (c) the future regulatory environment, (d) our ability to obtain an inventory of desirable new and
used vehicles, (e) our relationship with our automobile manufacturers and the willingness of manufacturers to
approve future acquisitions, (f) our cost of financing and the availability of credit for consumers, (g) our ability
to complete acquisitions and dispositions and the risks associated therewith, (h) foreign exchange controls
and currency fluctuations, and (i) our ability to retain key personnel. For additional information regarding
known material factors that could cause our actual results to differ from our projected results, please see our
filings with SEC, including our Annual Report on Form 10-K, Quarterly Reports on Form 10-Q and Current
Reports on Form 8-K. Readers are cautioned not to place undue reliance on forward-looking statements,
which speak only as of the date hereof. We undertake no obligation to publicly update or revise any forward-
looking statements after the date they are made, whether as a result of new information, future events or
otherwise.
2
Forward Looking Statement

www.group1auto.com
Company Overview
www.group1auto.com
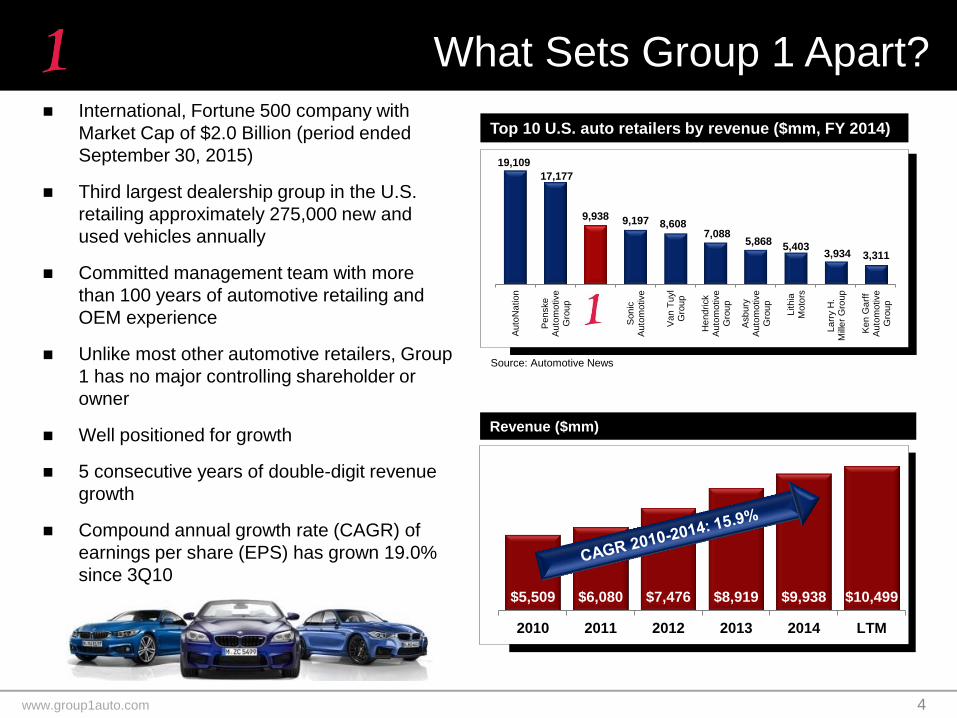
International, Fortune 500 company with
Market Cap of $2.0 Billion (period ended
September 30, 2015)
Third largest dealership group in the U.S.
retailing approximately 275,000 new and
used vehicles annually
Committed management team with more
than 100 years of automotive retailing and
OEM experience
Unlike most other automotive retailers, Group
1 has no major controlling shareholder or
owner
Well positioned for growth
5 consecutive years of double-digit revenue
growth
Compound annual growth rate (CAGR) of
earnings per share (EPS) has grown 19.0%
since 3Q10
What Sets Group 1 Apart?
4
Source: Automotive News
Top 10 U.S. auto retailers by revenue ($mm, FY 2014)
Revenue ($mm)
19,109
17,177
9,938 9,197 8,608 7,088
5,868 5,403
3,934 3,311
Auto
Na
tion
Pen
ske
Auto
motive
Gro
up
Son
icA
uto
motive
Van
Tuyl
Gro
up
He
nd
rick
Auto
motive
Gro
up
Asb
ury
Auto
motive
Gro
up
Lithia
Moto
rs
La
rry H
.M
ille
r G
roup
Ken
Ga
rff
Auto
motive
Gro
up
$5,509 $6,080 $7,476 $8,919 $9,938 $10,499
2010 2011 2012 2013 2014 LTM
www.group1auto.com
Geographic Footprint
5
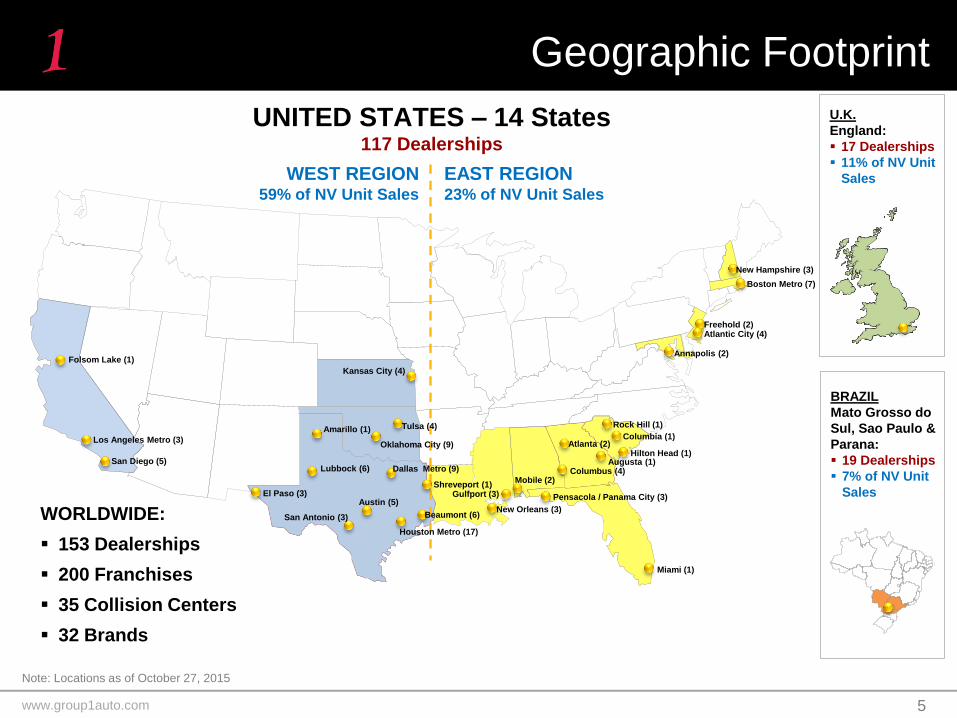
U.K.
England:
17 Dealerships
11% of NV Unit
Sales
Folsom Lake (1)
Los Angeles Metro (3)
San Diego (5)
Houston Metro (17)
Tulsa (4)
Lubbock (6)
Shreveport (1)
New Orleans (3) Beaumont (6)
Atlanta (2)
Mobile (2)
Gulfport (3)
Columbia (1)
Augusta (1) Hilton Head (1)
Pensacola / Panama City (3)
Annapolis (2)
New Hampshire (3)
Boston Metro (7)
Rock Hill (1)
Columbus (4)
Kansas City (4)
Freehold (2) Atlantic City (4)
BRAZIL
Mato Grosso do
Sul, Sao Paulo &
Parana:
19 Dealerships
7% of NV Unit
Sales
UNITED STATES – 14 States 117 Dealerships
Dallas Metro (9)
Amarillo (1)
Austin (5)
San Antonio (3)
Oklahoma City (9)
El Paso (3)
EAST REGION 23% of NV Unit Sales
WEST REGION 59% of NV Unit Sales
Note: Locations as of October 27, 2015
WORLDWIDE:
153 Dealerships
200 Franchises
35 Collision Centers
32 Brands
Miami (1)
www.group1auto.com
Geographic Diversity
6
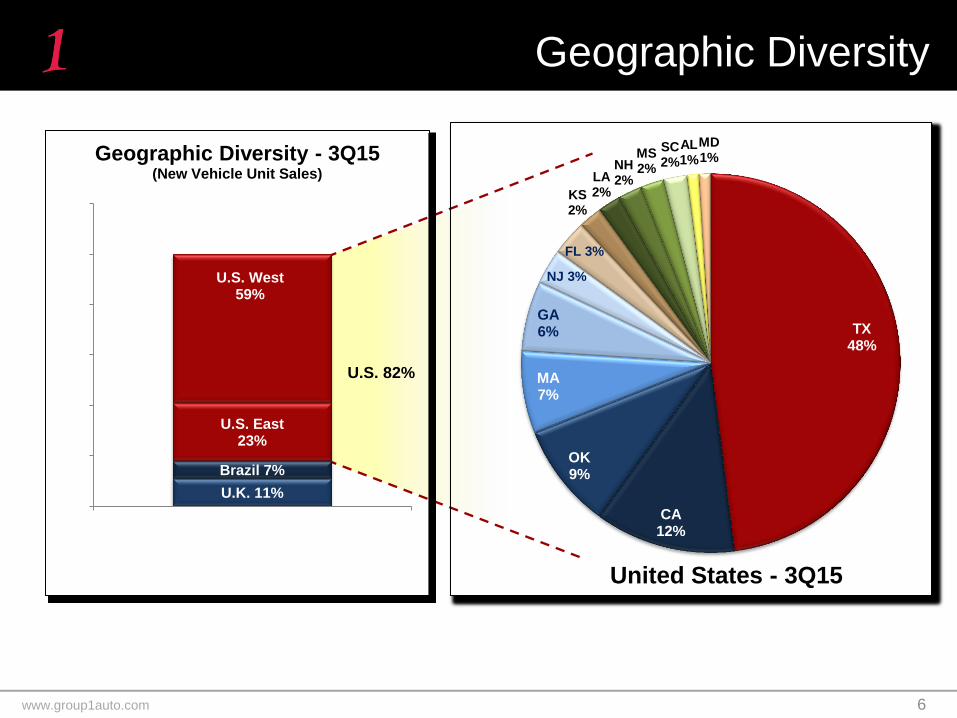
U.S. 82%
U.K. 11%
Brazil 7%
U.S. East 23%
U.S. West 59%
0%
20%
40%
60%
80%
100%
120%
New Vehicle Unit Sales
Geographic Diversity - 3Q15 (New Vehicle Unit Sales)
TX 48%
CA 12%
OK 9%
MA 7%
GA 6%
NJ 3%
FL 3%
KS 2%
LA 2%
NH 2%
MS 2%
SC 2%
AL 1%
MD 1%
United States - 3Q15
www.group1auto.com
Geographic Diversity - Texas
7
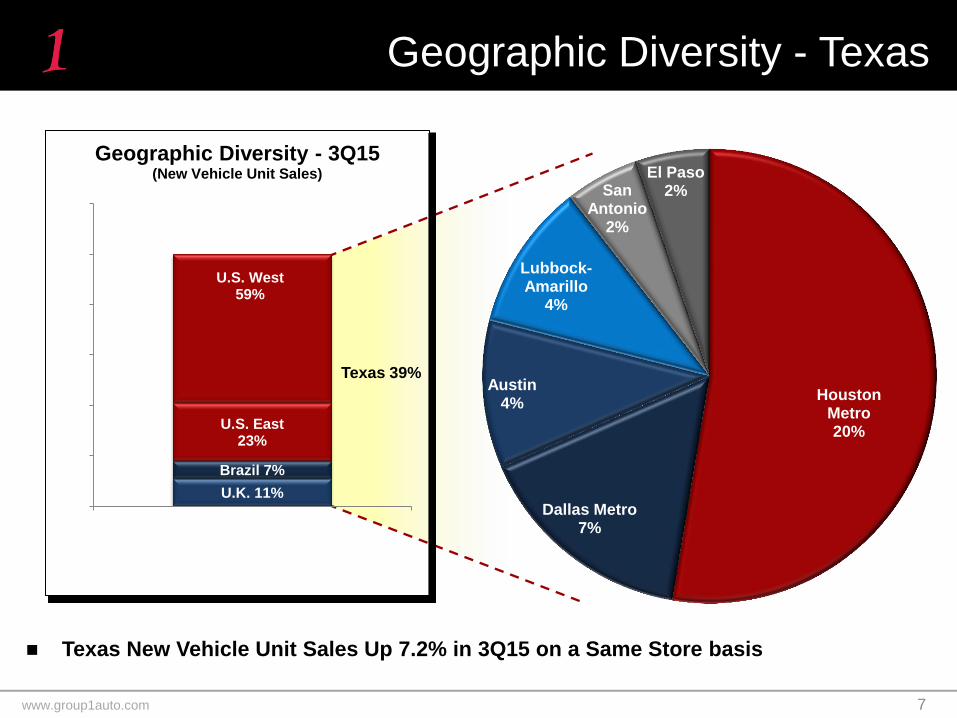
Texas 39%
U.K. 11%
Brazil 7%
U.S. East 23%
U.S. West 59%
0%
20%
40%
60%
80%
100%
120%
New Vehicle Unit Sales
Geographic Diversity - 3Q15 (New Vehicle Unit Sales)
Houston Metro 20%
Dallas Metro 7%
Austin 4%
Lubbock-Amarillo
4%
San Antonio
2%
El Paso 2%
Texas New Vehicle Unit Sales Up 7.2% in 3Q15 on a Same Store basis
www.group1auto.com
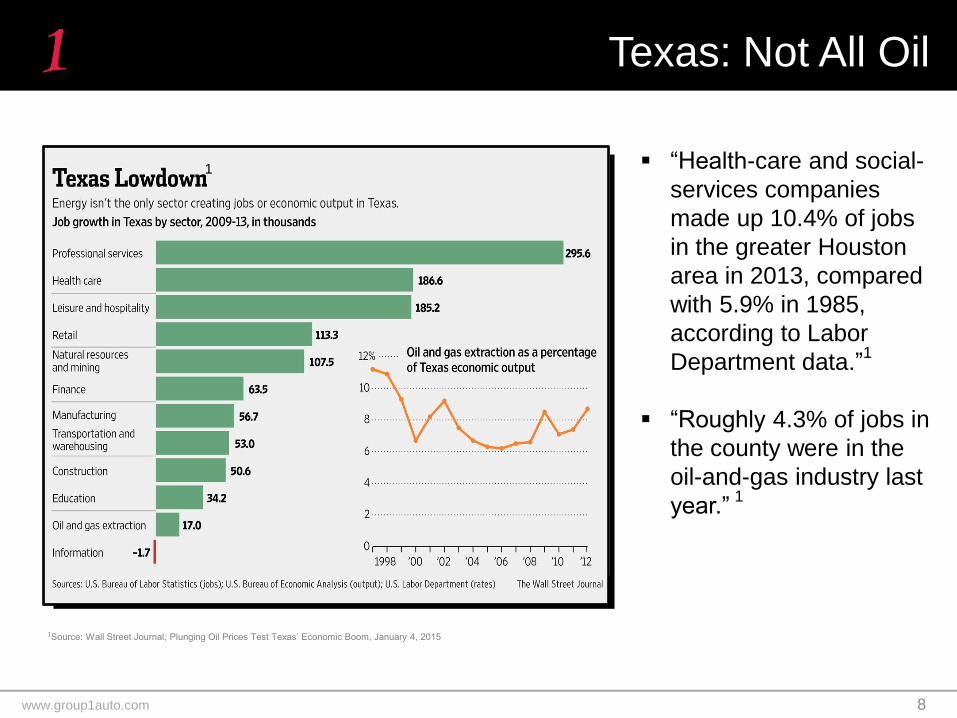
Texas: Not All Oil
1Source: Wall Street Journal, Plunging Oil Prices Test Texas’ Economic Boom, January 4, 2015
“Health-care and social-
services companies
made up 10.4% of jobs
in the greater Houston
area in 2013, compared
with 5.9% in 1985,
according to Labor
Department data.”1
“Roughly 4.3% of jobs in
the county were in the
oil-and-gas industry last
year.” 1
1
8
www.group1auto.com
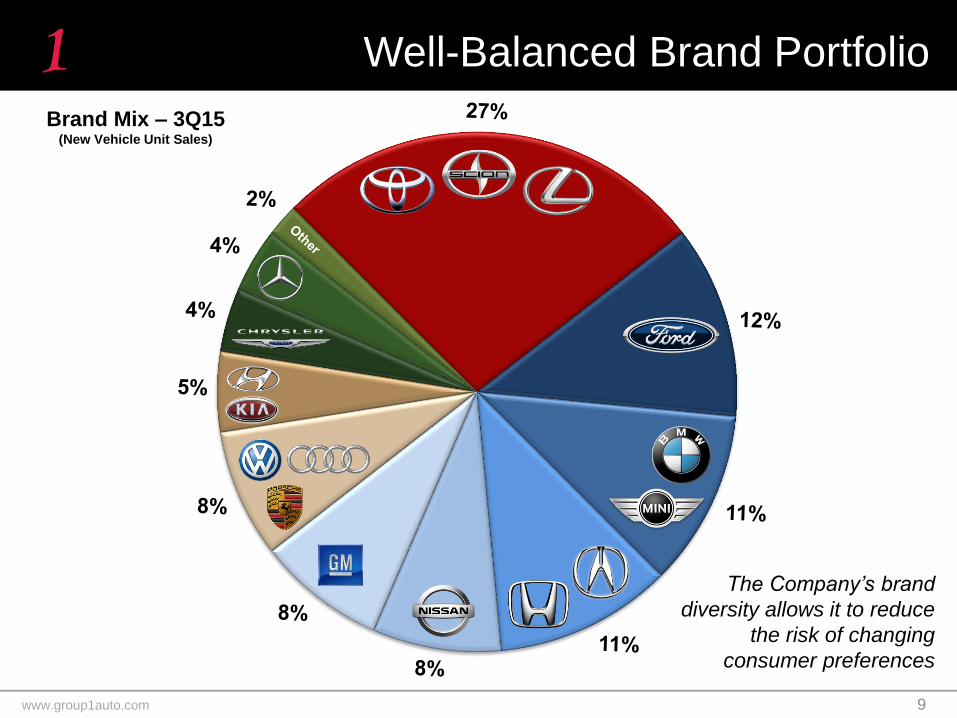
Well-Balanced Brand Portfolio
Brand Mix – 3Q15 (New Vehicle Unit Sales)
The Company’s brand
diversity allows it to reduce
the risk of changing
consumer preferences
9
www.group1auto.com
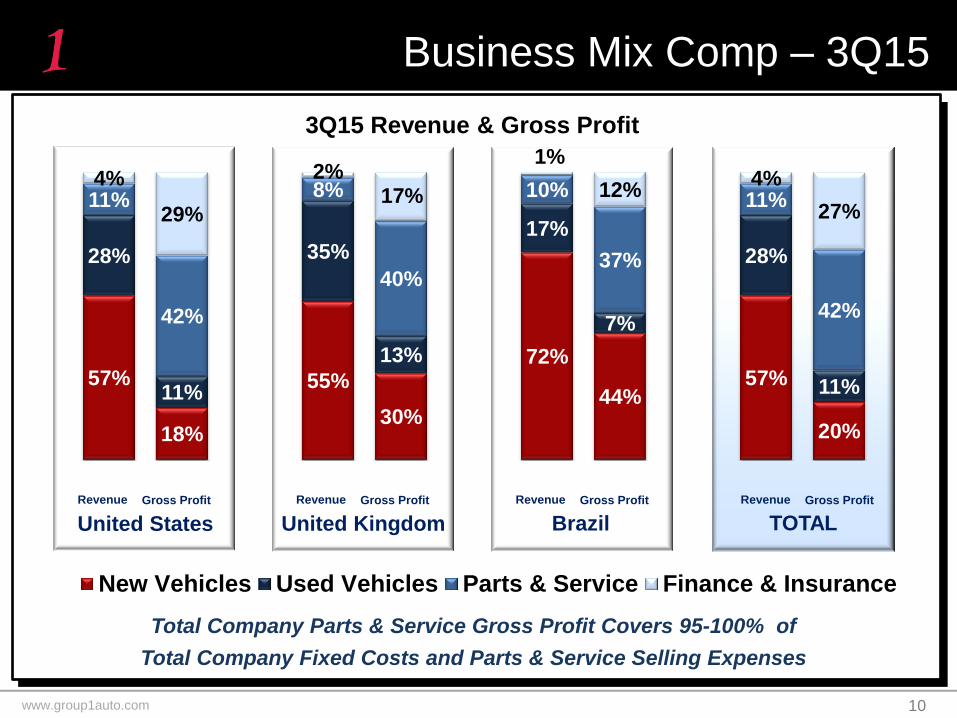
Business Mix Comp – 3Q15
3Q15 Revenue & Gross Profit
10
Total Company Parts & Service Gross Profit Covers 95-100% of
Total Company Fixed Costs and Parts & Service Selling Expenses
United States United Kingdom Brazil TOTAL
Gross Profit Revenue Gross Profit Revenue Gross Profit Revenue Gross Profit Revenue
57%
18%
55%
30%
72%
44% 57%
20%
28%
11%
35%
13%
17%
7%
28%
11%
11%
42%
8%
40%
10%
37%
11%
42%
4%
29%
2% 17%
1%
12% 4%
27%
New Vehicles Used Vehicles Parts & Service Finance & Insurance
www.group1auto.com
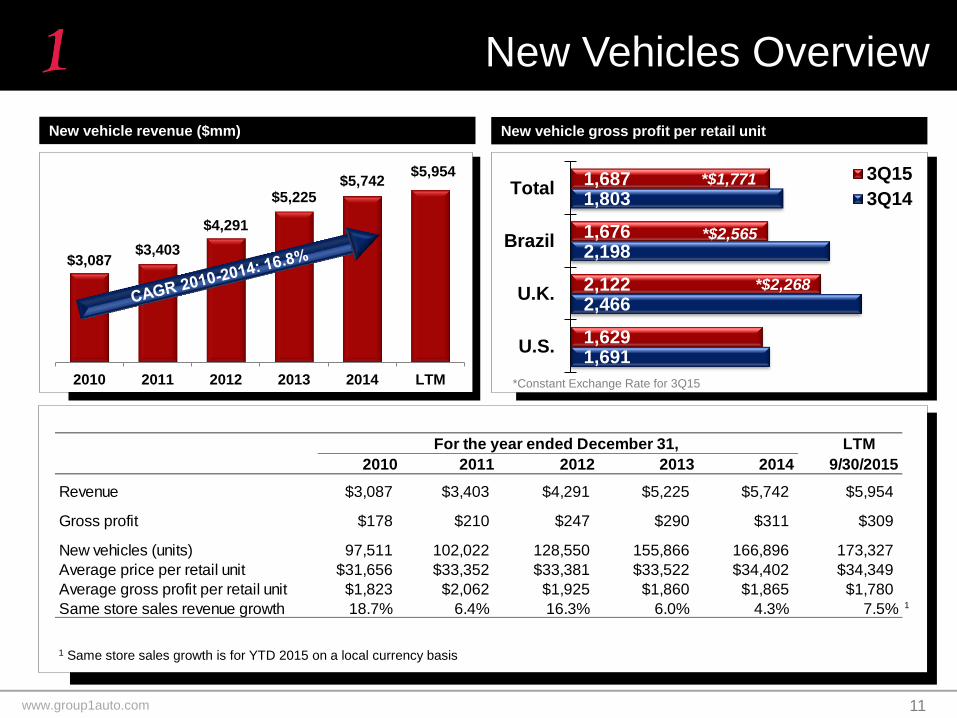
New Vehicles Overview
New vehicle revenue ($mm) New vehicle gross profit per retail unit
11
*Constant Exchange Rate for 3Q15
1 Same store sales growth is for YTD 2015 on a local currency basis
*2,289
$3,087 $3,403
$4,291
$5,225 $5,742
$5,954
2010 2011 2012 2013 2014 LTM
1,691
2,466
2,198
1,803
1,629
2,122
1,676
1,687
U.S.
U.K.
Brazil
Total3Q15
3Q14
*$2,268
*$1,771
*$2,565
For the year ended December 31, LTM
2010 2011 2012 2013 2014 9/30/2015
Revenue $3,087 $3,403 $4,291 $5,225 $5,742 $5,954
Gross profit $178 $210 $247 $290 $311 $309
New vehicles (units) 97,511 102,022 128,550 155,866 166,896 173,327
Average price per retail unit $31,656 $33,352 $33,381 $33,522 $34,402 $34,349
Average gross profit per retail unit $1,823 $2,062 $1,925 $1,860 $1,865 $1,780
Same store sales revenue growth 18.7% 6.4% 16.3% 6.0% 4.3% 7.5% 1
www.group1auto.com
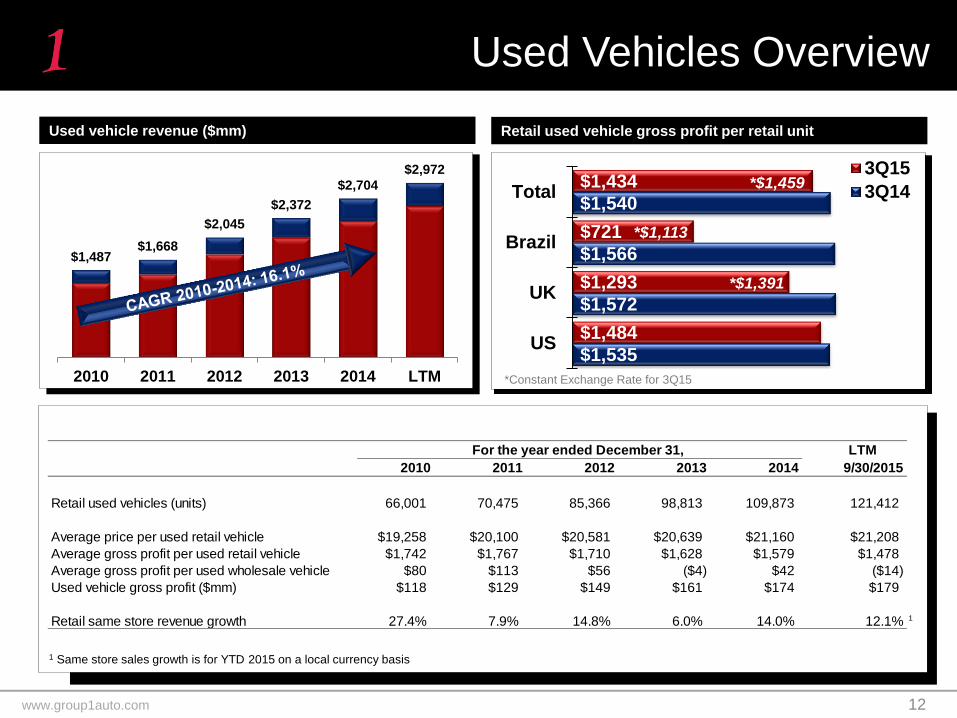
Used Vehicles Overview
12
Used vehicle revenue ($mm) Retail used vehicle gross profit per retail unit
*Constant Exchange Rate for 3Q15
1 Same store sales growth is for YTD 2015 on a local currency basis
$1,434
$721
$1,293
$1,484
$1,540
$1,566
$1,572
$1,535
Total
Brazil
UK
US
3Q15
3Q14*$1,459
*$1,113
*$1,391
$1,487 $1,668
$2,045
$2,372
$2,704
$2,972
2010 2011 2012 2013 2014 LTM
For the year ended December 31, LTM
2010 2011 2012 2013 2014 9/30/2015
Retail used vehicles (units) 66,001 70,475 85,366 98,813 109,873 121,412
Average price per used retail vehicle $19,258 $20,100 $20,581 $20,639 $21,160 $21,208
Average gross profit per used retail vehicle $1,742 $1,767 $1,710 $1,628 $1,579 $1,478
Average gross profit per used wholesale vehicle $80 $113 $56 ($4) $42 ($14)
Used vehicle gross profit ($mm) $118 $129 $149 $161 $174 $179
Retail same store revenue growth 27.4% 7.9% 14.8% 6.0% 14.0% 12.1% 1
www.group1auto.com
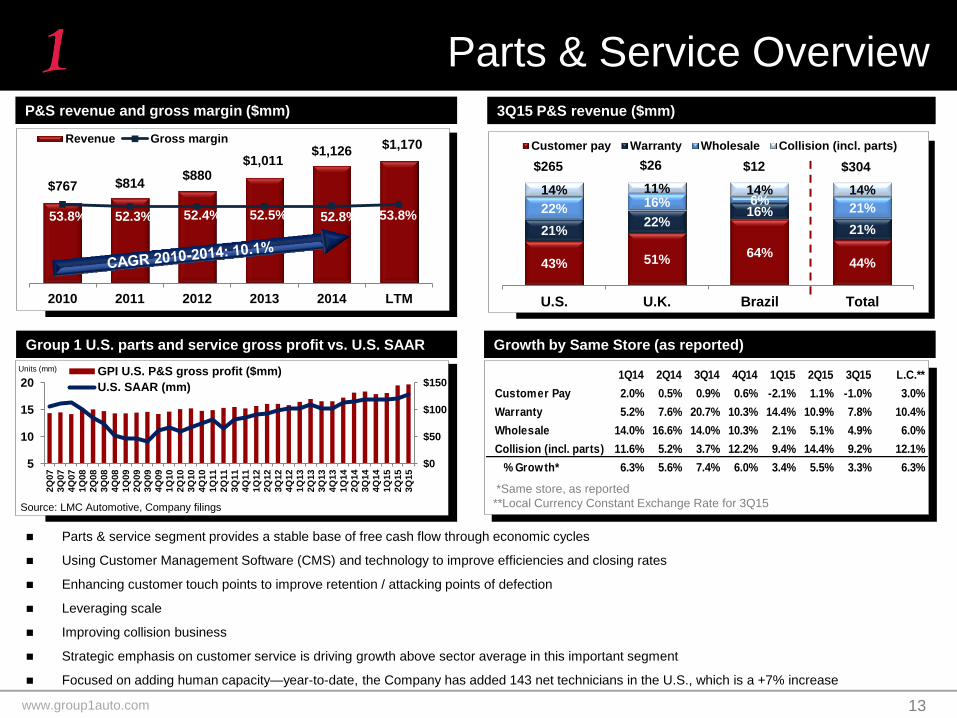
Parts & Service Overview
13
P&S revenue and gross margin ($mm) 3Q15 P&S revenue ($mm)
Parts & service segment provides a stable base of free cash flow through economic cycles
Using Customer Management Software (CMS) and technology to improve efficiencies and closing rates
Enhancing customer touch points to improve retention / attacking points of defection
Leveraging scale
Improving collision business
Strategic emphasis on customer service is driving growth above sector average in this important segment
Focused on adding human capacity—year-to-date, the Company has added 143 net technicians in the U.S., which is a +7% increase
Group 1 U.S. parts and service gross profit vs. U.S. SAAR
Source: LMC Automotive, Company filings
Growth by Same Store (as reported)
Units (mm) 1Q14 2Q14 3Q14 4Q14 1Q15 2Q15 3Q15 L.C.**
Customer Pay 2.0% 0.5% 0.9% 0.6% -2.1% 1.1% -1.0% 3.0%
Warranty 5.2% 7.6% 20.7% 10.3% 14.4% 10.9% 7.8% 10.4%
Wholesale 14.0% 16.6% 14.0% 10.3% 2.1% 5.1% 4.9% 6.0%
Collision (incl. parts) 11.6% 5.2% 3.7% 12.2% 9.4% 14.4% 9.2% 12.1%
% Growth* 6.3% 5.6% 7.4% 6.0% 3.4% 5.5% 3.3% 6.3%
*Same store, as reported
**Local Currency Constant Exchange Rate for 3Q15
$767 $814 $880
$1,011 $1,126
$1,170
53.8% 52.3% 52.4% 52.5% 52.8% 53.8%
2010 2011 2012 2013 2014 LTM
Revenue Gross margin
43% 51% 64%
44%
21% 22%
16%
21%
22% 16% 6% 21%
14% 11% 14% 14%
U.S. U.K. Brazil Total
Customer pay Warranty Wholesale Collision (incl. parts)
$265 $26 $12 $304
5
10
15
20
$0
$50
$100
$150
2Q
07
3Q
07
4Q
07
1Q
08
2Q
08
3Q
08
4Q
08
1Q
09
2Q
09
3Q
09
4Q
09
1Q
10
2Q
10
3Q
10
4Q
10
1Q
11
2Q
11
3Q
11
4Q
11
1Q
12
2Q
12
3Q
12
4Q
12
1Q
13
2Q
13
3Q
13
4Q
13
1Q
14
2Q
14
3Q
14
4Q
14
1Q
15
2Q
15
3Q
15
GPI U.S. P&S gross profit ($mm)
U.S. SAAR (mm)
www.group1auto.com
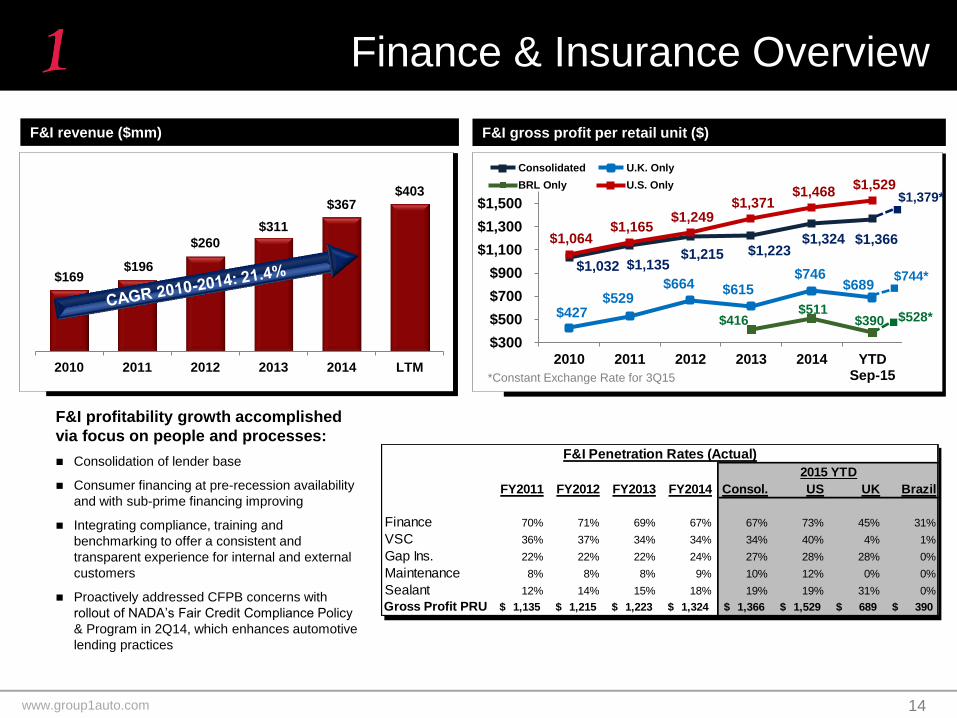
Finance & Insurance Overview
F&I revenue ($mm) F&I gross profit per retail unit ($)
F&I profitability growth accomplished
via focus on people and processes:
Consolidation of lender base
Consumer financing at pre-recession availability
and with sub-prime financing improving
Integrating compliance, training and
benchmarking to offer a consistent and
transparent experience for internal and external
customers
Proactively addressed CFPB concerns with
rollout of NADA’s Fair Credit Compliance Policy
& Program in 2Q14, which enhances automotive
lending practices
14
■
■
$528*
$744*
$1,379* ■
$1,032 $1,135 $1,215 $1,223
$1,324 $1,366
$427 $529
$664 $615 $746
$689
$416 $511
$390
$1,064 $1,165
$1,249 $1,371
$1,468 $1,529
$300
$500
$700
$900
$1,100
$1,300
$1,500
2010 2011 2012 2013 2014 YTDSep-15
Consolidated U.K. Only
BRL Only U.S. Only
$169 $196
$260
$311
$367 $403
2010 2011 2012 2013 2014 LTM*Constant Exchange Rate for 3Q15
FY2011 FY2012 FY2013 FY2014 Consol. US UK Brazil
Finance 70% 71% 69% 67% 67% 73% 45% 31%
VSC 36% 37% 34% 34% 34% 40% 4% 1%
Gap Ins. 22% 22% 22% 24% 27% 28% 28% 0%
Maintenance 8% 8% 8% 9% 10% 12% 0% 0%
Sealant 12% 14% 15% 18% 19% 19% 31% 0%
Gross Profit PRU 1,135$ 1,215$ 1,223$ 1,324$ 1,366$ 1,529$ 689$ 390$
F&I Penetration Rates (Actual)
2015 YTD
www.group1auto.com
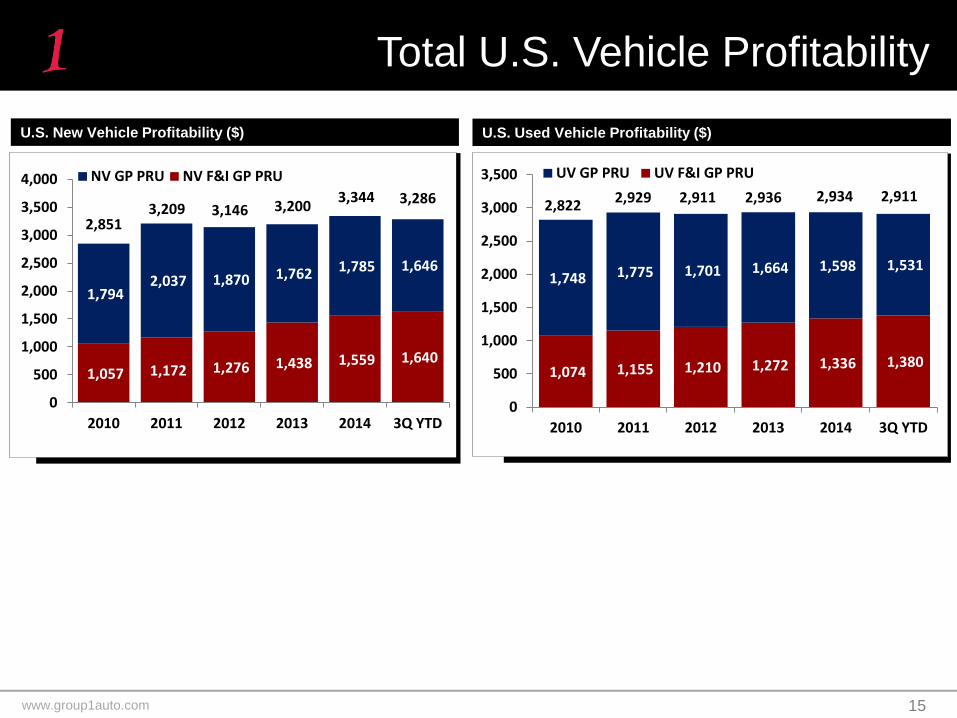
Total U.S. Vehicle Profitability
U.S. New Vehicle Profitability ($) U.S. Used Vehicle Profitability ($)
15
1,057 1,172 1,276 1,438 1,559 1,640
1,794 2,037 1,870 1,762 1,785 1,646
0
500
1,000
1,500
2,000
2,500
3,000
3,500
4,000
2010 2011 2012 2013 2014 3Q YTD
NV GP PRU NV F&I GP PRU
3,200 3,344 3,286
2,851 3,209 3,146
1,074 1,155 1,210 1,272 1,336 1,380
1,748 1,775 1,701 1,664 1,598 1,531
0
500
1,000
1,500
2,000
2,500
3,000
3,500
2010 2011 2012 2013 2014 3Q YTD
UV GP PRU UV F&I GP PRU
2,822 2,929 2,911 2,936 2,934 2,911

www.group1auto.com
Financial Overview
www.group1auto.com
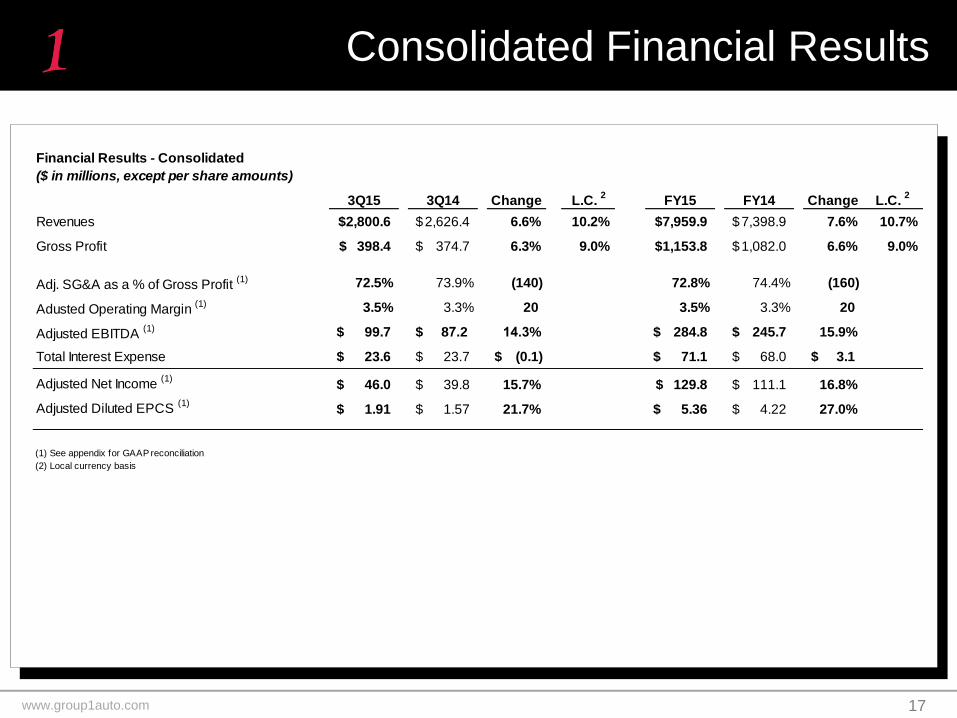
Consolidated Financial Results
17
Financial Results - Consolidated
($ in millions, except per share amounts)
3Q15 3Q14 Change L.C. 2
FY15 FY14 Change L.C. 2
Revenues 2,800.6$ 2,626.4$ 6.6% 10.2% 7,959.9$ 7,398.9$ 7.6% 10.7%
Gross Profit 398.4$ 374.7$ 6.3% 9.0% 1,153.8$ 1,082.0$ 6.6% 9.0%
Adj. SG&A as a % of Gross Profit (1) 72.5% 73.9% (140) 72.8% 74.4% (160)
Adusted Operating Margin (1) 3.5% 3.3% 20 3.5% 3.3% 20
Adjusted EBITDA (1) 99.7$ 87.2$ 14.3% 284.8$ 245.7$ 15.9%
Total Interest Expense 23.6$ 23.7$ (0.1)$ 71.1$ 68.0$ 3.1$
Adjusted Net Income (1)
46.0$ 39.8$ 15.7% 129.8$ 111.1$ 16.8%
Adjusted Diluted EPCS (1)
1.91$ 1.57$ 21.7% 5.36$ 4.22$ 27.0%
(1) See appendix for GAAP reconciliation
(2) Local currency basis
www.group1auto.com
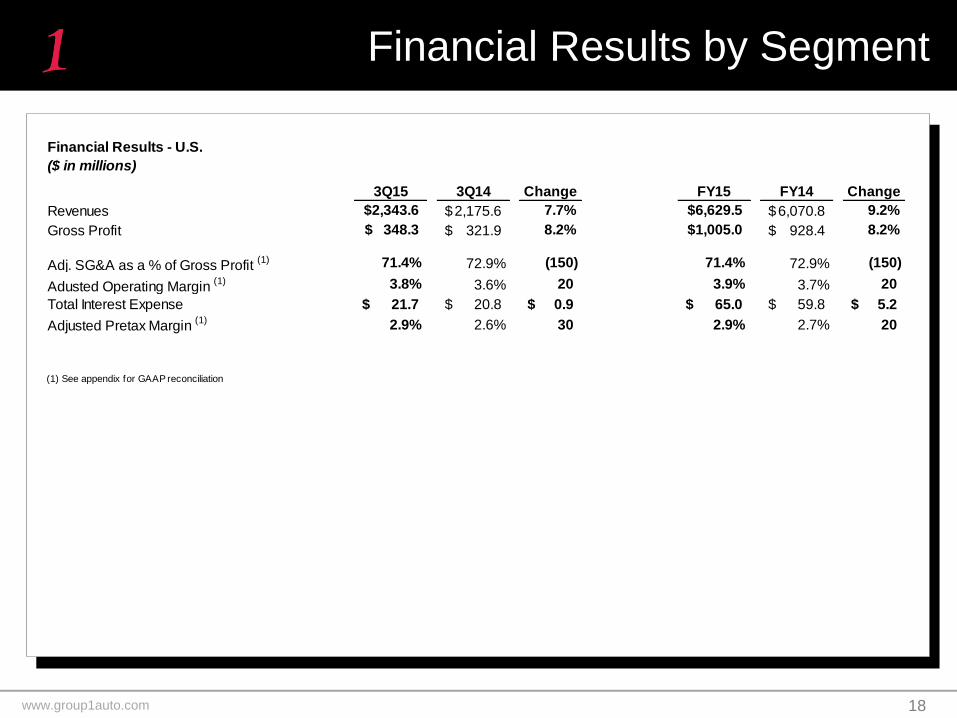
Financial Results by Segment
18
Financial Results - U.S.
($ in millions)
3Q15 3Q14 Change FY15 FY14 Change
Revenues 2,343.6$ 2,175.6$ 7.7% 6,629.5$ 6,070.8$ 9.2%
Gross Profit 348.3$ 321.9$ 8.2% 1,005.0$ 928.4$ 8.2%
Adj. SG&A as a % of Gross Profit (1) 71.4% 72.9% (150) 71.4% 72.9% (150)
Adusted Operating Margin (1) 3.8% 3.6% 20 3.9% 3.7% 20
Total Interest Expense 21.7$ 20.8$ 0.9$ 65.0$ 59.8$ 5.2$
Adjusted Pretax Margin (1) 2.9% 2.6% 30 2.9% 2.7% 20
(1) See appendix for GAAP reconciliation
www.group1auto.com
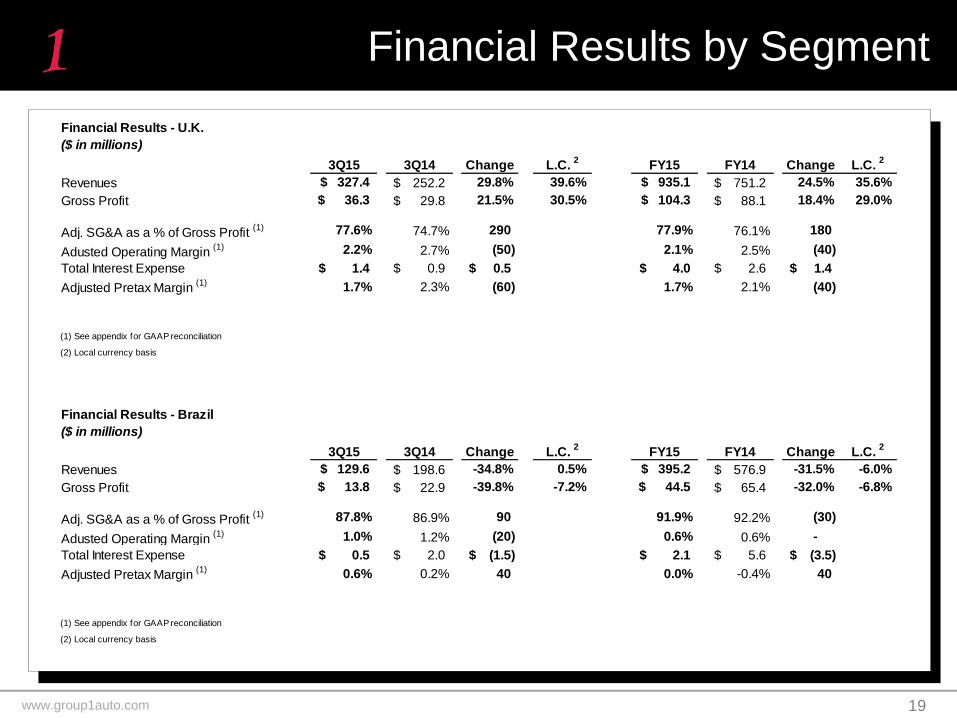
Financial Results by Segment
19
Financial Results - U.K.
($ in millions)
3Q15 3Q14 Change L.C. 2
FY15 FY14 Change L.C. 2
Revenues 327.4$ 252.2$ 29.8% 39.6% 935.1$ 751.2$ 24.5% 35.6%
Gross Profit 36.3$ 29.8$ 21.5% 30.5% 104.3$ 88.1$ 18.4% 29.0%
Adj. SG&A as a % of Gross Profit (1) 77.6% 74.7% 290 77.9% 76.1% 180
Adusted Operating Margin (1) 2.2% 2.7% (50) 2.1% 2.5% (40)
Total Interest Expense 1.4$ 0.9$ 0.5$ 4.0$ 2.6$ 1.4$
Adjusted Pretax Margin (1) 1.7% 2.3% (60) 1.7% 2.1% (40)
(1) See appendix for GAAP reconciliation
(2) Local currency basis
Financial Results - Brazil
($ in millions)
3Q15 3Q14 Change L.C. 2
FY15 FY14 Change L.C. 2
Revenues 129.6$ 198.6$ -34.8% 0.5% 395.2$ 576.9$ -31.5% -6.0%
Gross Profit 13.8$ 22.9$ -39.8% -7.2% 44.5$ 65.4$ -32.0% -6.8%
Adj. SG&A as a % of Gross Profit (1) 87.8% 86.9% 90 91.9% 92.2% (30)
Adusted Operating Margin (1) 1.0% 1.2% (20) 0.6% 0.6% -
Total Interest Expense 0.5$ 2.0$ (1.5)$ 2.1$ 5.6$ (3.5)$
Adjusted Pretax Margin (1) 0.6% 0.2% 40 0.0% -0.4% 40
(1) See appendix for GAAP reconciliation
(2) Local currency basis
www.group1auto.com
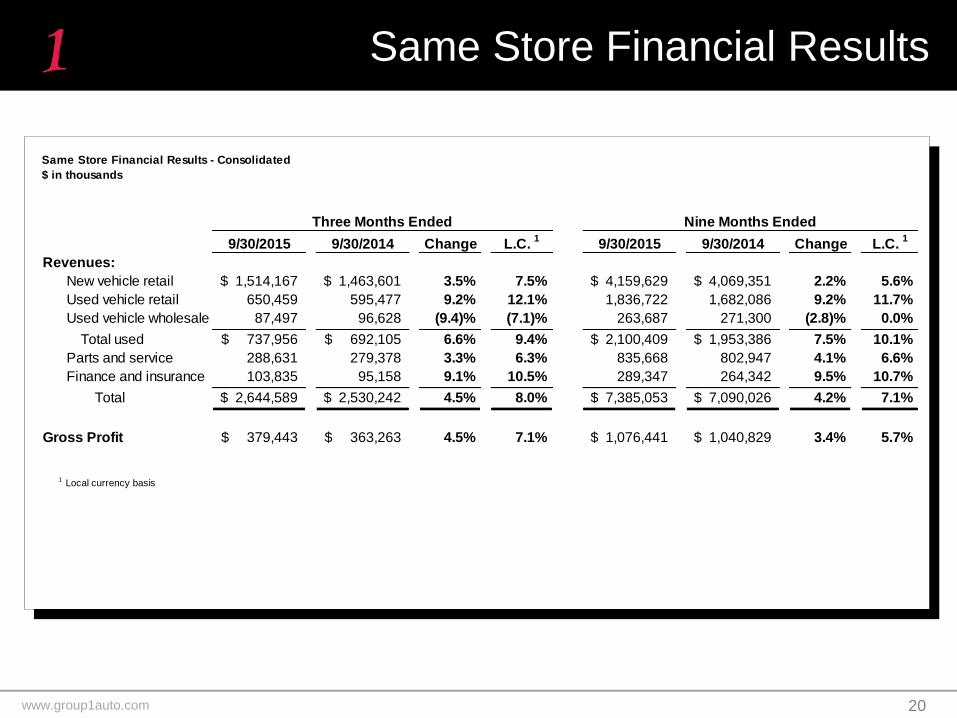
Same Store Financial Results
20
Same Store Financial Results - Consolidated
$ in thousands
9/30/2015 9/30/2014 Change L.C. 1
9/30/2015 9/30/2014 Change L.C. 1
Revenues:
New vehicle retail 1,514,167$ 1,463,601$ 3.5% 7.5% 4,159,629$ 4,069,351$ 2.2% 5.6%
Used vehicle retail 650,459 595,477 9.2% 12.1% 1,836,722 1,682,086 9.2% 11.7%
Used vehicle wholesale 87,497 96,628 (9.4)% (7.1)% 263,687 271,300 (2.8)% 0.0%
Total used 737,956$ 692,105$ 6.6% 9.4% 2,100,409$ 1,953,386$ 7.5% 10.1%
Parts and service 288,631 279,378 3.3% 6.3% 835,668 802,947 4.1% 6.6%
Finance and insurance 103,835 95,158 9.1% 10.5% 289,347 264,342 9.5% 10.7%
Total 2,644,589$ 2,530,242$ 4.5% 8.0% 7,385,053$ 7,090,026$ 4.2% 7.1%
Gross Profit 379,443$ 363,263$ 4.5% 7.1% 1,076,441$ 1,040,829$ 3.4% 5.7%
1 Local currency basis
Three Months Ended Nine Months Ended
www.group1auto.com
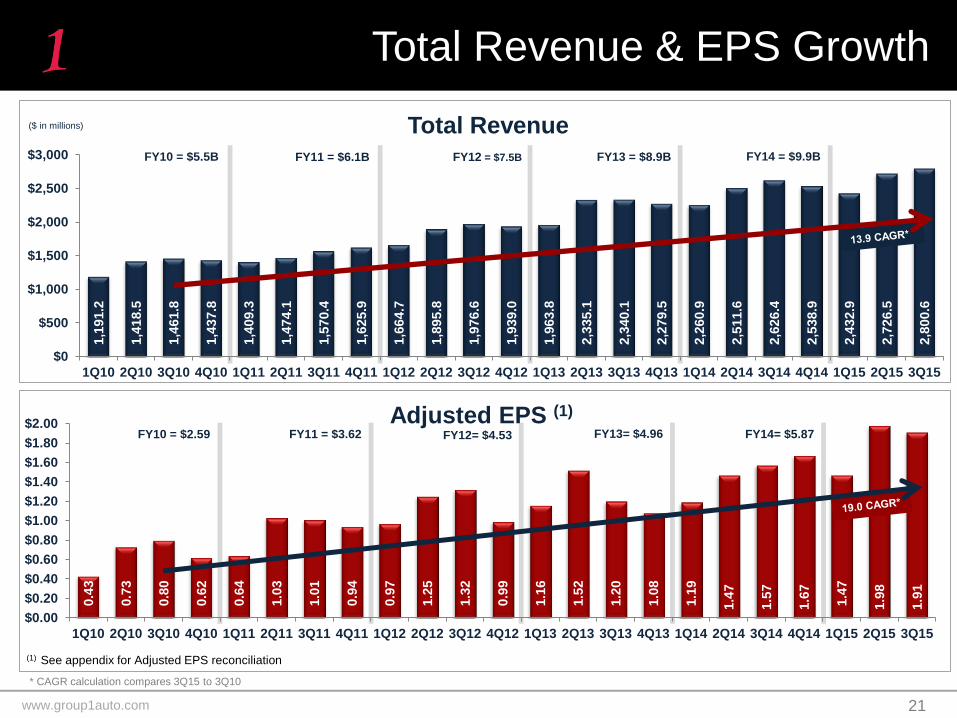
Total Revenue & EPS Growth
21
* CAGR calculation compares 3Q15 to 3Q10
1,1
91.2
1,4
18.5
1,4
61.8
1,4
37.8
1,4
09.3
1,4
74.1
1,5
70.4
1,6
25.9
1,6
64.7
1,8
95.8
1,9
76.6
1,9
39.0
1,9
63.8
2,3
35.1
2,3
40.1
2,2
79.5
2,2
60.9
2,5
11.6
2,6
26.4
2,5
38.9
2,4
32.9
2,7
26.5
2,8
00.6
$0
$500
$1,000
$1,500
$2,000
$2,500
$3,000
1Q10 2Q10 3Q10 4Q10 1Q11 2Q11 3Q11 4Q11 1Q12 2Q12 3Q12 4Q12 1Q13 2Q13 3Q13 4Q13 1Q14 2Q14 3Q14 4Q14 1Q15 2Q15 3Q15
Total Revenue ($ in millions)
FY10 = $5.5B FY11 = $6.1B FY12 = $7.5B FY13 = $8.9B FY14 = $9.9B
0.4
3
0.7
3
0.8
0
0.6
2
0.6
4
1.0
3
1.0
1
0.9
4
0.9
7
1.2
5
1.3
2
0.9
9
1.1
6
1.5
2
1.2
0
1.0
8
1.1
9
1.4
7
1.5
7
1.6
7
1.4
7
1.9
8
1.9
1
$0.00
$0.20
$0.40
$0.60
$0.80
$1.00
$1.20
$1.40
$1.60
$1.80
$2.00
1Q10 2Q10 3Q10 4Q10 1Q11 2Q11 3Q11 4Q11 1Q12 2Q12 3Q12 4Q12 1Q13 2Q13 3Q13 4Q13 1Q14 2Q14 3Q14 4Q14 1Q15 2Q15 3Q15
Adjusted EPS (1)
(1) See appendix for Adjusted EPS reconciliation
FY10 = $2.59 FY12= $4.53 FY11 = $3.62 FY13= $4.96 FY14= $5.87
www.group1auto.com
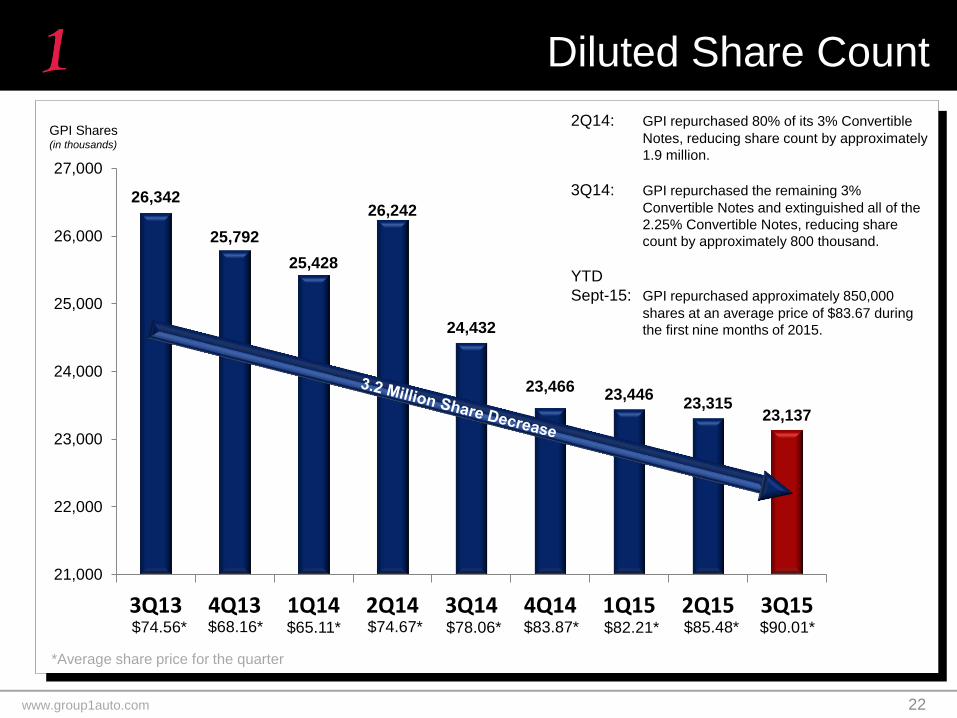
Diluted Share Count
26,342
25,792
25,428
26,242
24,432
23,466 23,446
23,315 23,137
21,000
22,000
23,000
24,000
25,000
26,000
27,000
3Q13 4Q13 1Q14 2Q14 3Q14 4Q14 1Q15 2Q15 3Q15
GPI Shares (in thousands)
2Q14: GPI repurchased 80% of its 3% Convertible
Notes, reducing share count by approximately
1.9 million.
3Q14: GPI repurchased the remaining 3%
Convertible Notes and extinguished all of the
2.25% Convertible Notes, reducing share
count by approximately 800 thousand.
YTD
Sept-15: GPI repurchased approximately 850,000
shares at an average price of $83.67 during
the first nine months of 2015.
$74.56* $68.16* $65.11* $74.67* $78.06* $83.87*
*Average share price for the quarter
22
$82.21* $85.48* $90.01*

www.group1auto.com
Balance Sheet
www.group1auto.com
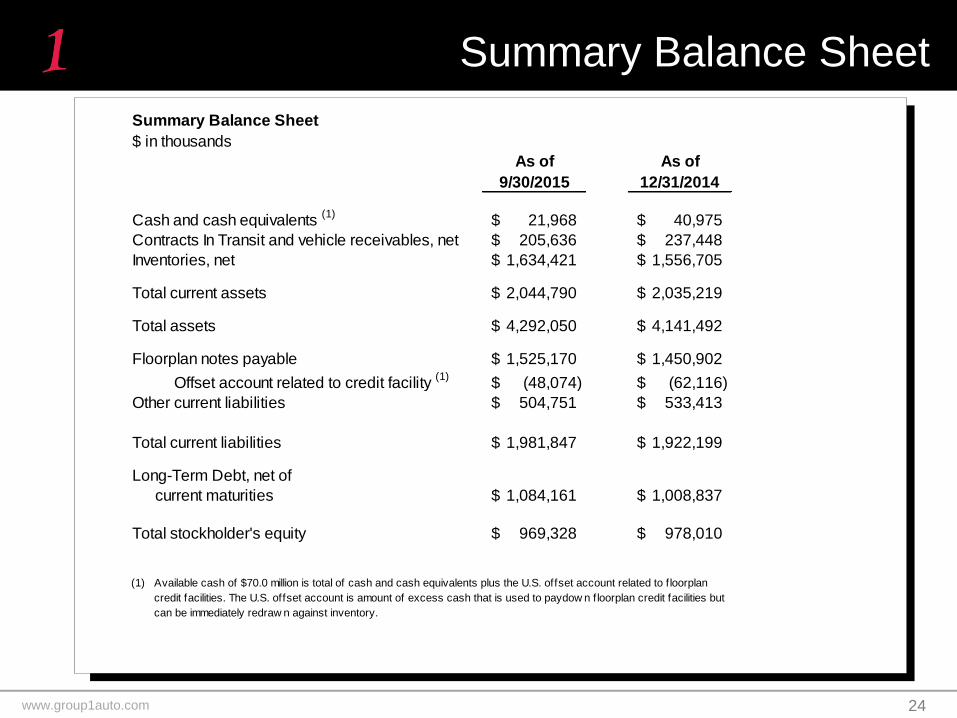
Summary Balance Sheet
24
Summary Balance Sheet
$ in thousands
As of As of
9/30/2015 12/31/2014
Cash and cash equivalents (1)
21,968$ 40,975$
Contracts In Transit and vehicle receivables, net 205,636$ 237,448$
Inventories, net 1,634,421$ 1,556,705$
Total current assets 2,044,790$ 2,035,219$
Total assets 4,292,050$ 4,141,492$
Floorplan notes payable 1,525,170$ 1,450,902$
Offset account related to credit facility (1)
(48,074)$ (62,116)$
Other current liabilities 504,751$ 533,413$
Total current liabilities 1,981,847$ 1,922,199$
Long-Term Debt, net of
current maturities 1,084,161$ 1,008,837$
Total stockholder's equity 969,328$ 978,010$
(1) Available cash of $70.0 million is total of cash and cash equivalents plus the U.S. offset account related to f loorplan
credit facilities. The U.S. offset account is amount of excess cash that is used to paydow n floorplan credit facilities but
can be immediately redraw n against inventory.
www.group1auto.com
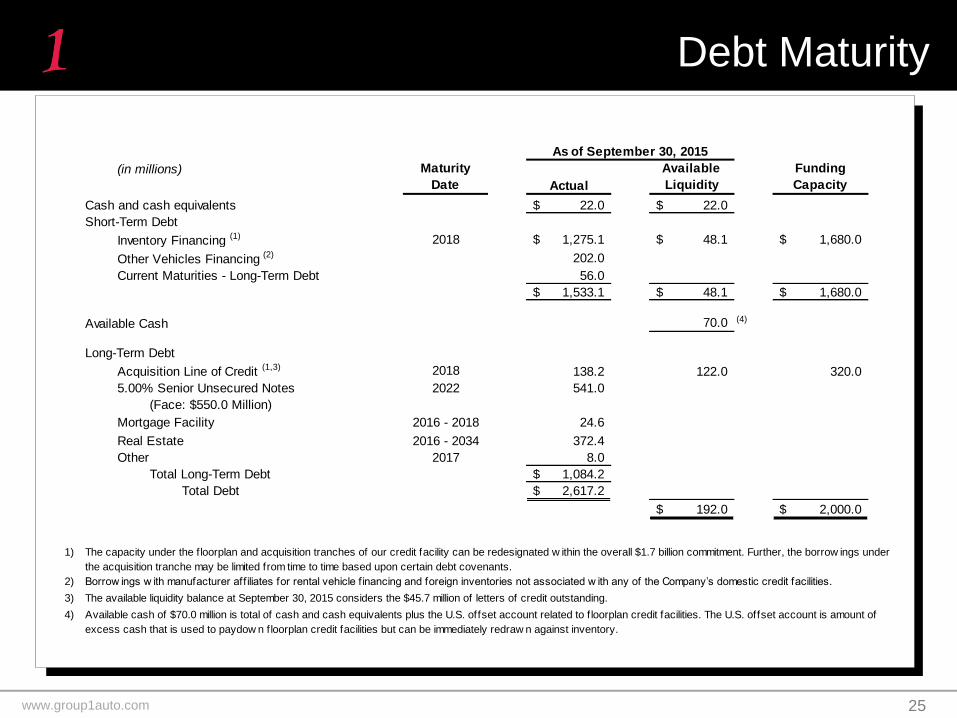
Debt Maturity
25
(in millions) Maturity
Date Actual
Available
Liquidity
Funding
Capacity
Cash and cash equivalents 22.0$ 22.0$
Short-Term Debt
Inventory Financing (1) 2018 1,275.1$ 48.1$ 1,680.0$
Other Vehicles Financing (2) 202.0
Current Maturities - Long-Term Debt 56.0
1,533.1$ 48.1$ 1,680.0$
Available Cash 70.0 (4)
Long-Term Debt
Acquisition Line of Credit (1,3) 2018 138.2 122.0 320.0
5.00% Senior Unsecured Notes 2022 541.0
(Face: $550.0 Million)
Mortgage Facility 2016 - 2018 24.6
Real Estate 2016 - 2034 372.4
Other 2017 8.0
Total Long-Term Debt 1,084.2$
Total Debt 2,617.2$
192.0$ 2,000.0$
1)
2)
3)
4) Available cash of $70.0 million is total of cash and cash equivalents plus the U.S. offset account related to f loorplan credit facilities. The U.S. offset account is amount of
excess cash that is used to paydow n floorplan credit facilities but can be immediately redraw n against inventory.
As of September 30, 2015
The capacity under the f loorplan and acquisition tranches of our credit facility can be redesignated w ithin the overall $1.7 billion commitment. Further, the borrow ings under
the acquisition tranche may be limited from time to time based upon certain debt covenants.
Borrow ings w ith manufacturer aff iliates for rental vehicle f inancing and foreign inventories not associated w ith any of the Company’s domestic credit facilities.
The available liquidity balance at September 30, 2015 considers the $45.7 million of letters of credit outstanding.

www.group1auto.com
Growth Outlook
www.group1auto.com
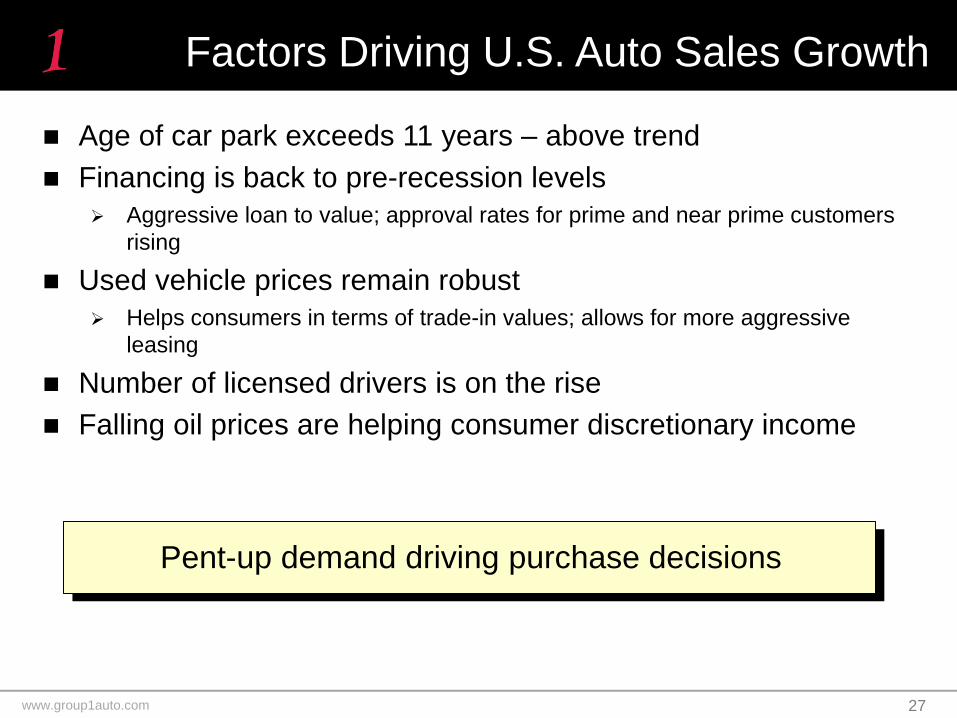
Factors Driving U.S. Auto Sales Growth
Age of car park exceeds 11 years – above trend
Financing is back to pre-recession levels
Aggressive loan to value; approval rates for prime and near prime customers
rising
Used vehicle prices remain robust
Helps consumers in terms of trade-in values; allows for more aggressive
leasing
Number of licensed drivers is on the rise
Falling oil prices are helping consumer discretionary income
Pent-up demand driving purchase decisions
27
www.group1auto.com
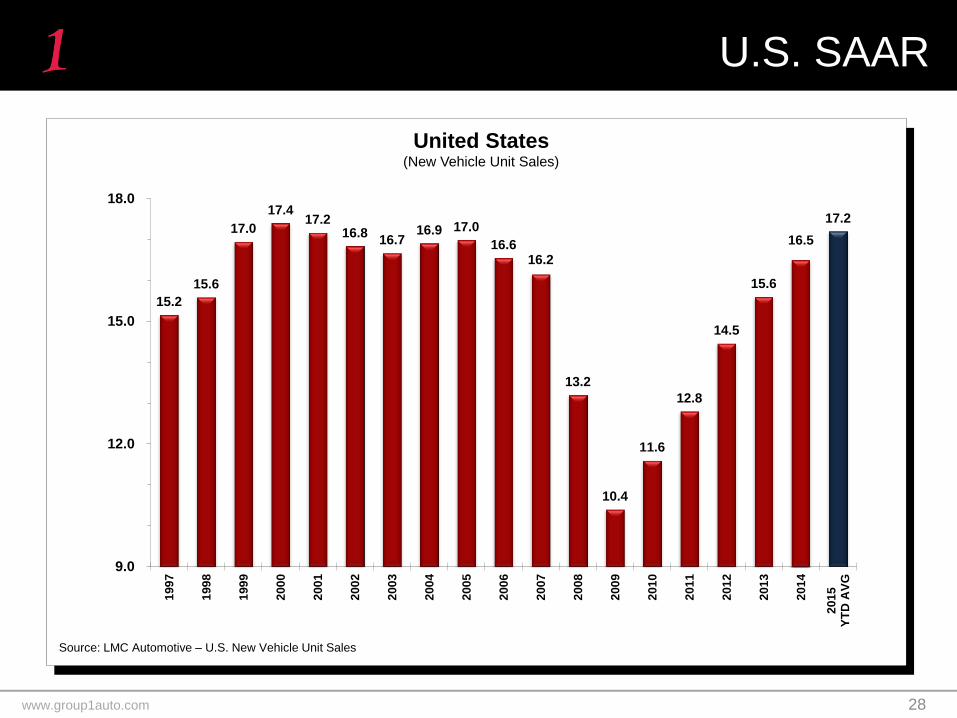
U.S. SAAR
15.2
15.6
17.0
17.4 17.2
16.8 16.7
16.9 17.0
16.6 16.2
13.2
10.4
11.6
12.8
14.5
15.6
16.5
17.2
9.0
12.0
15.0
18.0
199
7
199
8
199
9
200
0
200
1
200
2
200
3
200
4
200
5
200
6
200
7
200
8
200
9
201
0
201
1
201
2
201
3
201
4
201
5Y
TD
AV
G
Source: LMC Automotive – U.S. New Vehicle Unit Sales
United States (New Vehicle Unit Sales)
28
www.group1auto.com
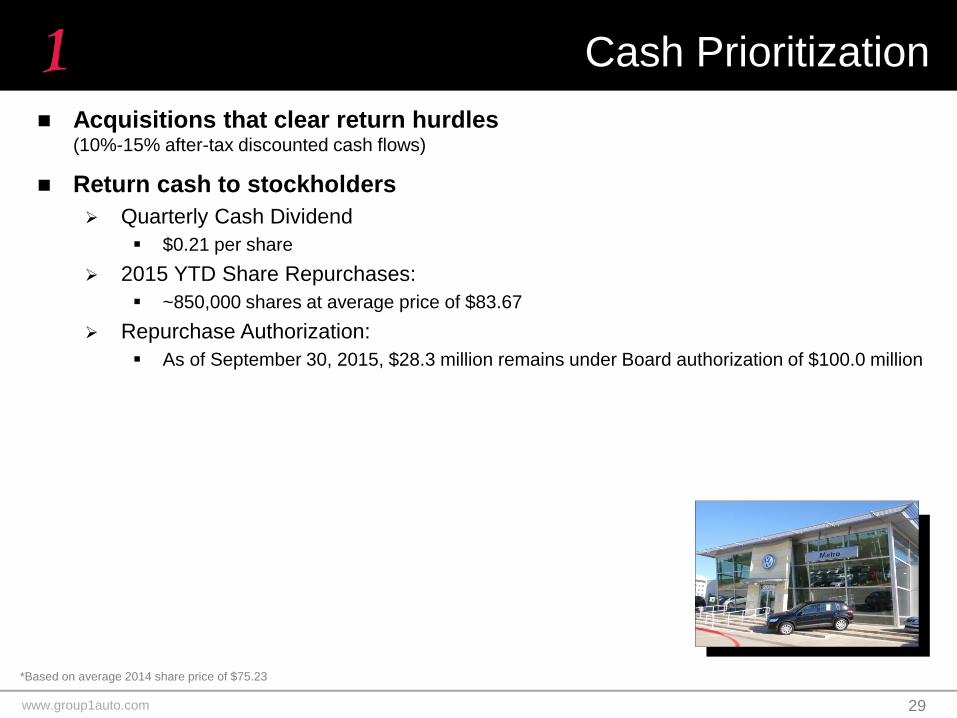
Acquisitions that clear return hurdles (10%-15% after-tax discounted cash flows)
Return cash to stockholders
Quarterly Cash Dividend
$0.21 per share
2015 YTD Share Repurchases:
~850,000 shares at average price of $83.67
Repurchase Authorization:
As of September 30, 2015, $28.3 million remains under Board authorization of $100.0 million
Cash Prioritization
29
*Based on average 2014 share price of $75.23
www.group1auto.com
$80 $160 $100
2014 $135 $20 $85 $55 $15 $225 $135 $225
3Q
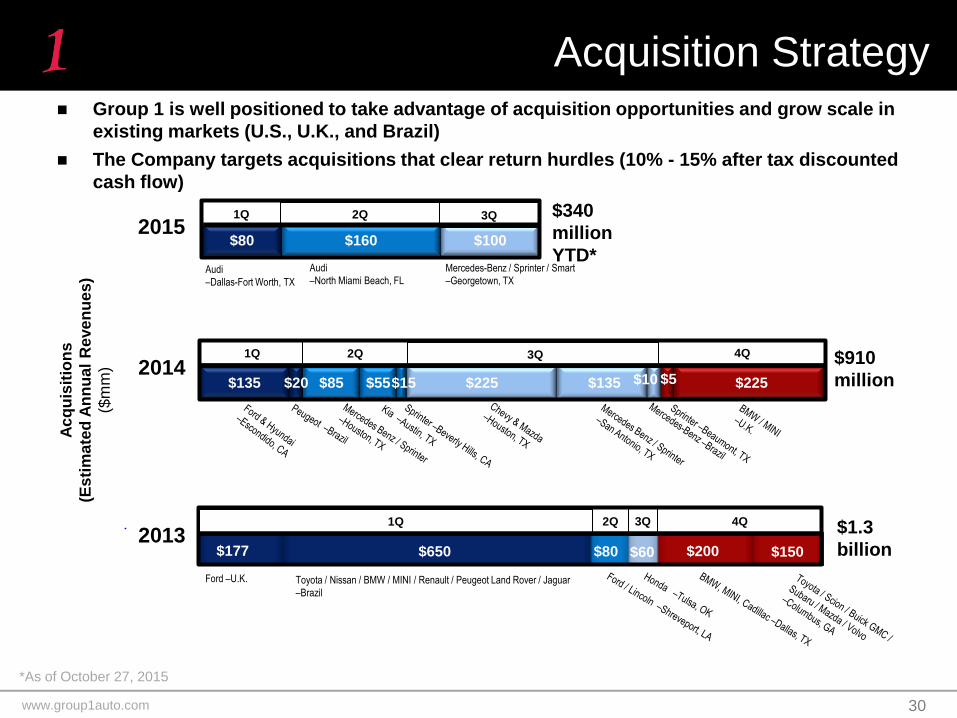
Acquisition Strategy
30
Group 1 is well positioned to take advantage of acquisition opportunities and grow scale in
existing markets (U.S., U.K., and Brazil)
The Company targets acquisitions that clear return hurdles (10% - 15% after tax discounted
cash flow)
Ford –U.K. Toyota / Nissan / BMW / MINI / Renault / Peugeot Land Rover / Jaguar
–Brazil
$1.3
billion
Ac
qu
isit
ion
s
(Es
tim
ate
d A
nn
ual
Reve
nu
es
)
($m
m)
$177 $650 $80 $60 $200 $150 2013
3Q 2Q 4Q
$910
million
1Q 2Q 4Q
$10 $5
1Q
2015 $340
million
YTD* Audi
–Dallas-Fort Worth, TX
Audi
–North Miami Beach, FL
*As of October 27, 2015
3Q 2Q 1Q
Mercedes-Benz / Sprinter / Smart
–Georgetown, TX
www.group1auto.com
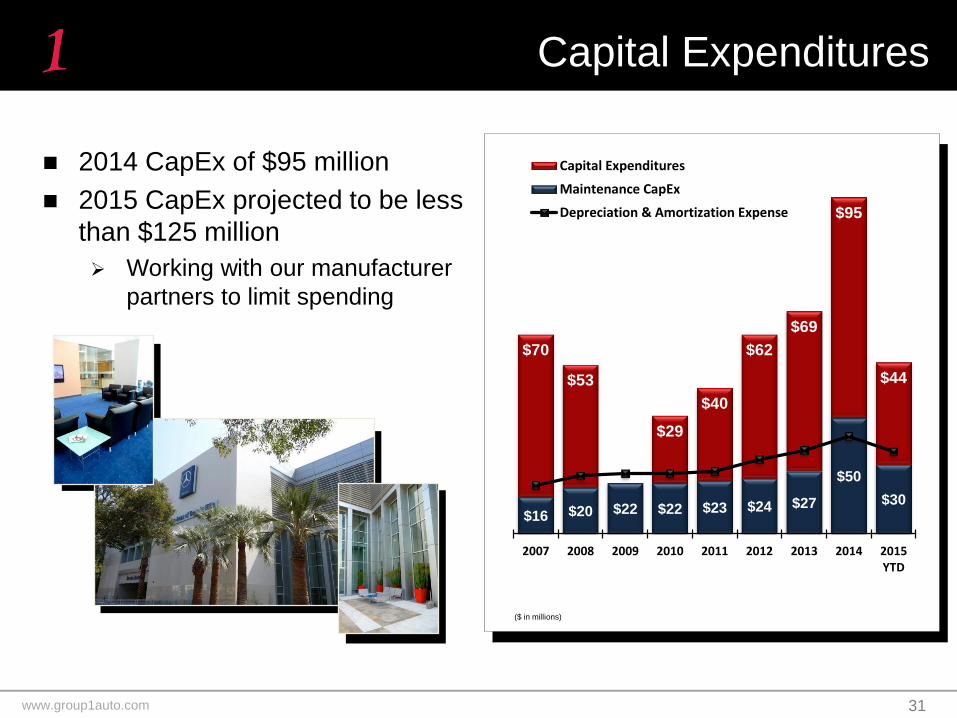
2014 CapEx of $95 million
2015 CapEx projected to be less
than $125 million
Working with our manufacturer
partners to limit spending
Capital Expenditures
31
($ in millions)
$16 $20 $22 $22 $23 $24 $27
$50
$30
$70
$53
$29
$40
$62
$69
$95
$44
2007 2008 2009 2010 2011 2012 2013 2014 2015YTD
Capital Expenditures
Maintenance CapEx
Depreciation & Amortization Expense
www.group1auto.com
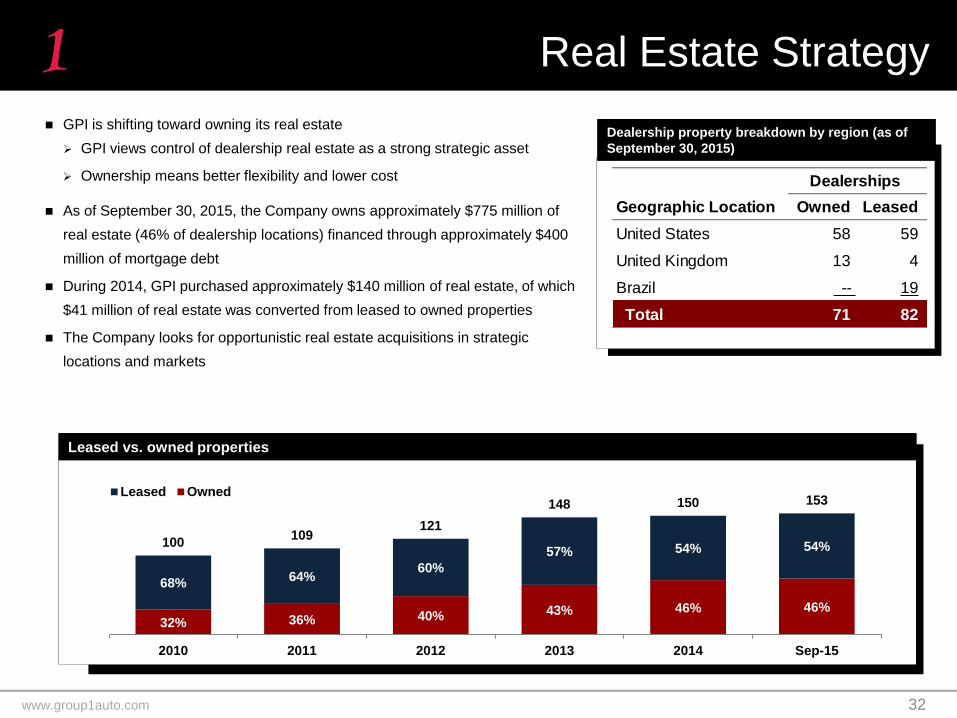
GPI is shifting toward owning its real estate
GPI views control of dealership real estate as a strong strategic asset
Ownership means better flexibility and lower cost
As of September 30, 2015, the Company owns approximately $775 million of
real estate (46% of dealership locations) financed through approximately $400
million of mortgage debt
During 2014, GPI purchased approximately $140 million of real estate, of which
$41 million of real estate was converted from leased to owned properties
The Company looks for opportunistic real estate acquisitions in strategic
locations and markets
Real Estate Strategy
32
Leased vs. owned properties
Dealership property breakdown by region (as of
September 30, 2015)
Dealerships
Geographic Location Owned Leased
United States 58 59
United Kingdom 13 4
Brazil -- 19
Total 71 82
32% 36% 40% 43% 46% 46%
68% 64%
60%
57% 54% 54% 100 109
121
148 150 153
2010 2011 2012 2013 2014 Sep-15
Leased Owned
www.group1auto.com
Conclusion
www.group1auto.com
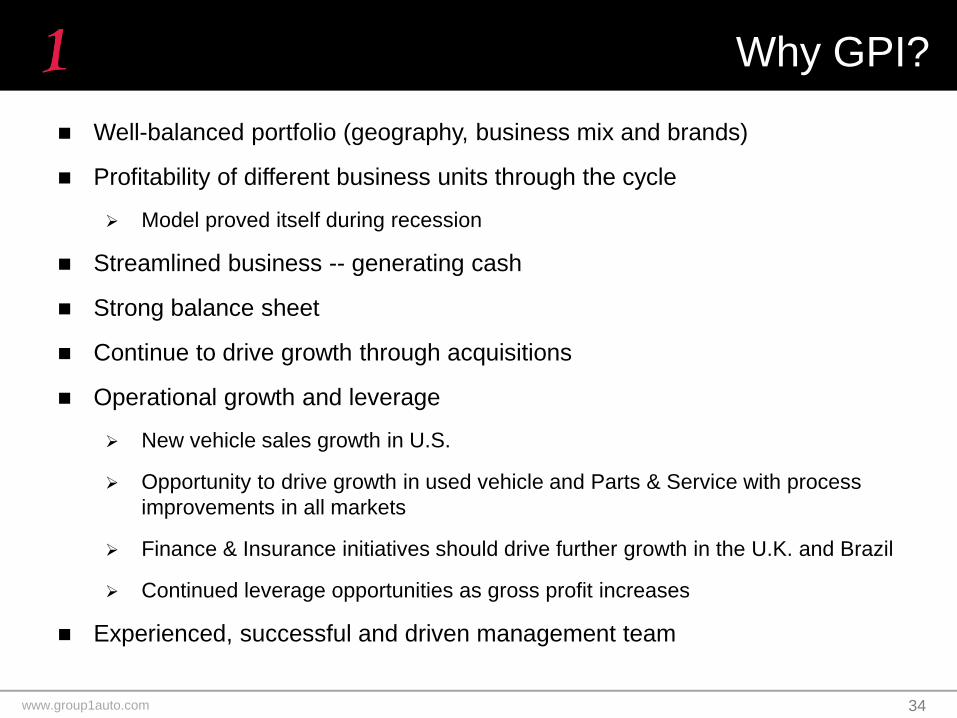
Well-balanced portfolio (geography, business mix and brands)
Profitability of different business units through the cycle
Model proved itself during recession
Streamlined business -- generating cash
Strong balance sheet
Continue to drive growth through acquisitions
Operational growth and leverage
New vehicle sales growth in U.S.
Opportunity to drive growth in used vehicle and Parts & Service with process
improvements in all markets
Finance & Insurance initiatives should drive further growth in the U.K. and Brazil
Continued leverage opportunities as gross profit increases
Experienced, successful and driven management team
Why GPI?
34

www.group1auto.com
CORE VALUES
Integrity We conduct ourselves with the highest level of ethics both personally and professionally when we
sell to and perform service for our customers without compromising our honesty
Transparency We promote open and honest communication between each other and our customers
Professionalism We set our standards high so that we can exceed expectations and strive for perfection in everything
we do
Teamwork We put the interest of the group first, before our individual interests, as we know that success only
comes when we work together
www.group1auto.com
Appendix
www.group1auto.com
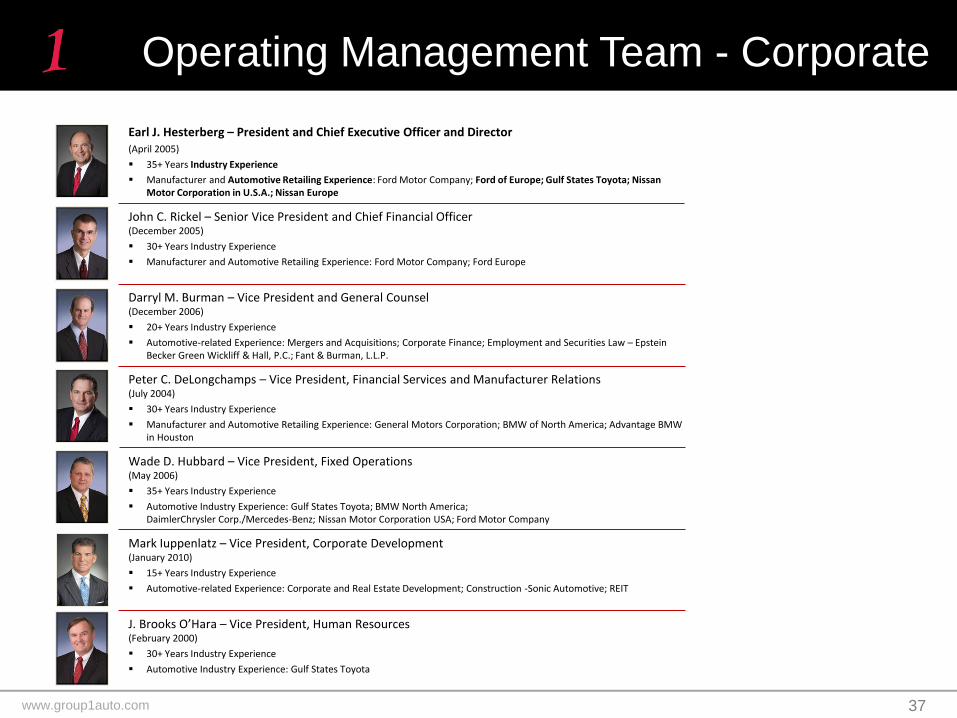
Earl J. Hesterberg – President and Chief Executive Officer and Director (April 2005)
35+ Years Industry Experience
Manufacturer and Automotive Retailing Experience: Ford Motor Company; Ford of Europe; Gulf States Toyota; Nissan Motor Corporation in U.S.A.; Nissan Europe
John C. Rickel – Senior Vice President and Chief Financial Officer (December 2005)
30+ Years Industry Experience
Manufacturer and Automotive Retailing Experience: Ford Motor Company; Ford Europe
Darryl M. Burman – Vice President and General Counsel (December 2006)
20+ Years Industry Experience
Automotive-related Experience: Mergers and Acquisitions; Corporate Finance; Employment and Securities Law – Epstein Becker Green Wickliff & Hall, P.C.; Fant & Burman, L.L.P.
Peter C. DeLongchamps – Vice President, Financial Services and Manufacturer Relations (July 2004)
30+ Years Industry Experience
Manufacturer and Automotive Retailing Experience: General Motors Corporation; BMW of North America; Advantage BMW in Houston
Wade D. Hubbard – Vice President, Fixed Operations (May 2006)
35+ Years Industry Experience
Automotive Industry Experience: Gulf States Toyota; BMW North America; DaimlerChrysler Corp./Mercedes-Benz; Nissan Motor Corporation USA; Ford Motor Company
Mark Iuppenlatz – Vice President, Corporate Development (January 2010)
15+ Years Industry Experience
Automotive-related Experience: Corporate and Real Estate Development; Construction -Sonic Automotive; REIT
J. Brooks O’Hara – Vice President, Human Resources (February 2000)
30+ Years Industry Experience
Automotive Industry Experience: Gulf States Toyota
Operating Management Team - Corporate
37
www.group1auto.com
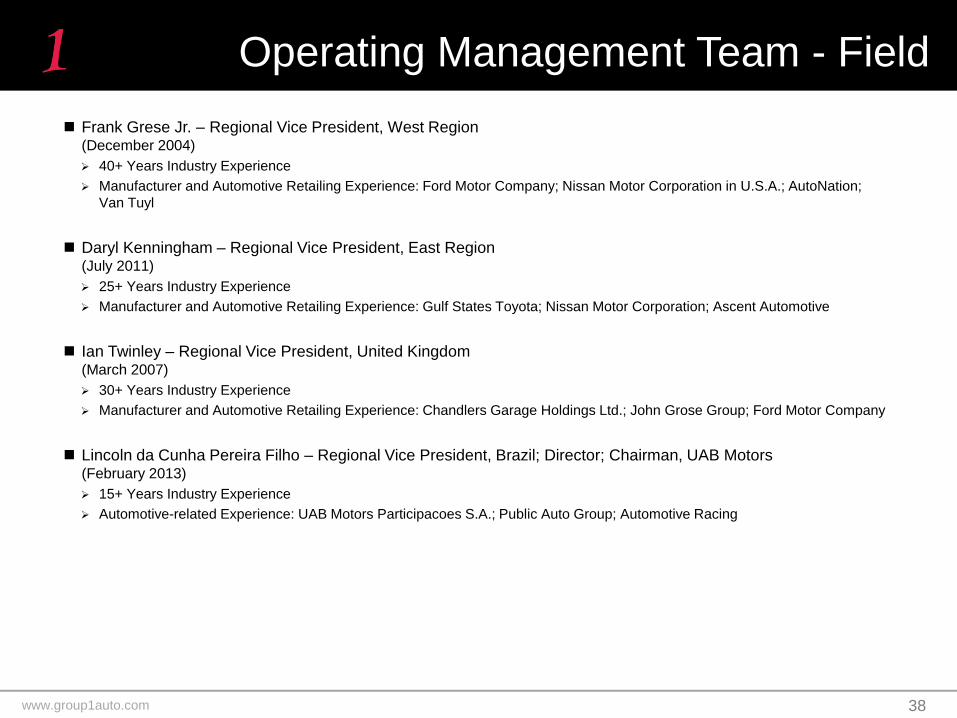
Frank Grese Jr. – Regional Vice President, West Region (December 2004)
40+ Years Industry Experience
Manufacturer and Automotive Retailing Experience: Ford Motor Company; Nissan Motor Corporation in U.S.A.; AutoNation;
Van Tuyl
Daryl Kenningham – Regional Vice President, East Region (July 2011)
25+ Years Industry Experience
Manufacturer and Automotive Retailing Experience: Gulf States Toyota; Nissan Motor Corporation; Ascent Automotive
Ian Twinley – Regional Vice President, United Kingdom (March 2007)
30+ Years Industry Experience
Manufacturer and Automotive Retailing Experience: Chandlers Garage Holdings Ltd.; John Grose Group; Ford Motor Company
Lincoln da Cunha Pereira Filho – Regional Vice President, Brazil; Director; Chairman, UAB Motors (February 2013)
15+ Years Industry Experience
Automotive-related Experience: UAB Motors Participacoes S.A.; Public Auto Group; Automotive Racing
Operating Management Team - Field
38
www.group1auto.com
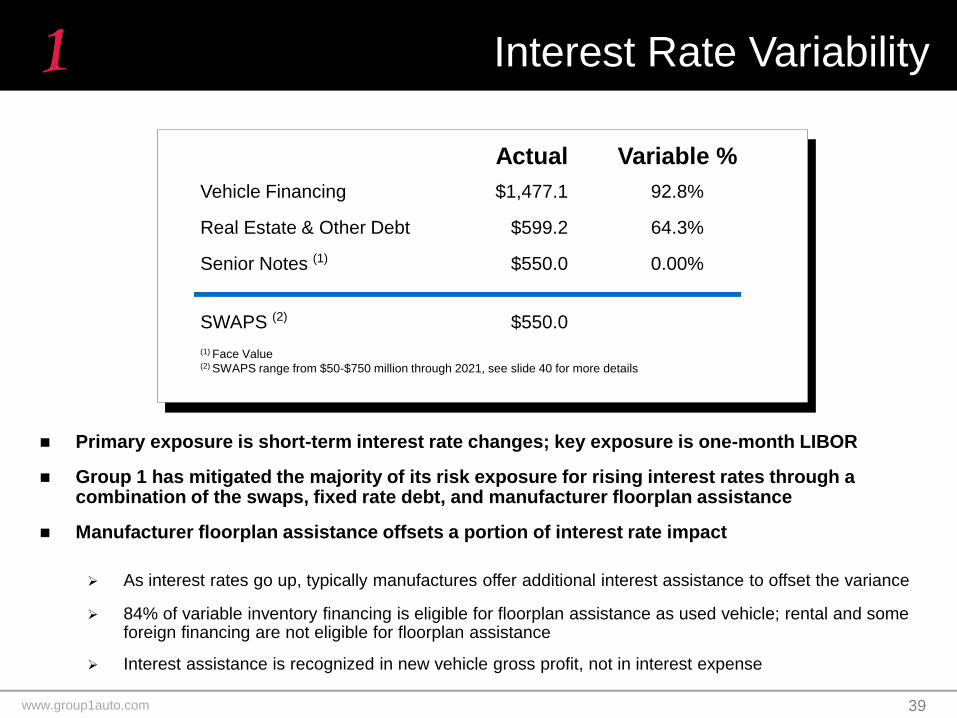
Primary exposure is short-term interest rate changes; key exposure is one-month LIBOR
Group 1 has mitigated the majority of its risk exposure for rising interest rates through a combination of the swaps, fixed rate debt, and manufacturer floorplan assistance
Manufacturer floorplan assistance offsets a portion of interest rate impact
As interest rates go up, typically manufactures offer additional interest assistance to offset the variance
84% of variable inventory financing is eligible for floorplan assistance as used vehicle; rental and some foreign financing are not eligible for floorplan assistance
Interest assistance is recognized in new vehicle gross profit, not in interest expense
Actual Variable %
Vehicle Financing $1,477.1 92.8%
Real Estate & Other Debt $599.2 64.3%
Senior Notes (1) $550.0 0.00%
SWAPS (2) $550.0
(1) Face Value (2) SWAPS range from $50-$750 million through 2021, see slide 40 for more details
Interest Rate Variability
39
www.group1auto.com
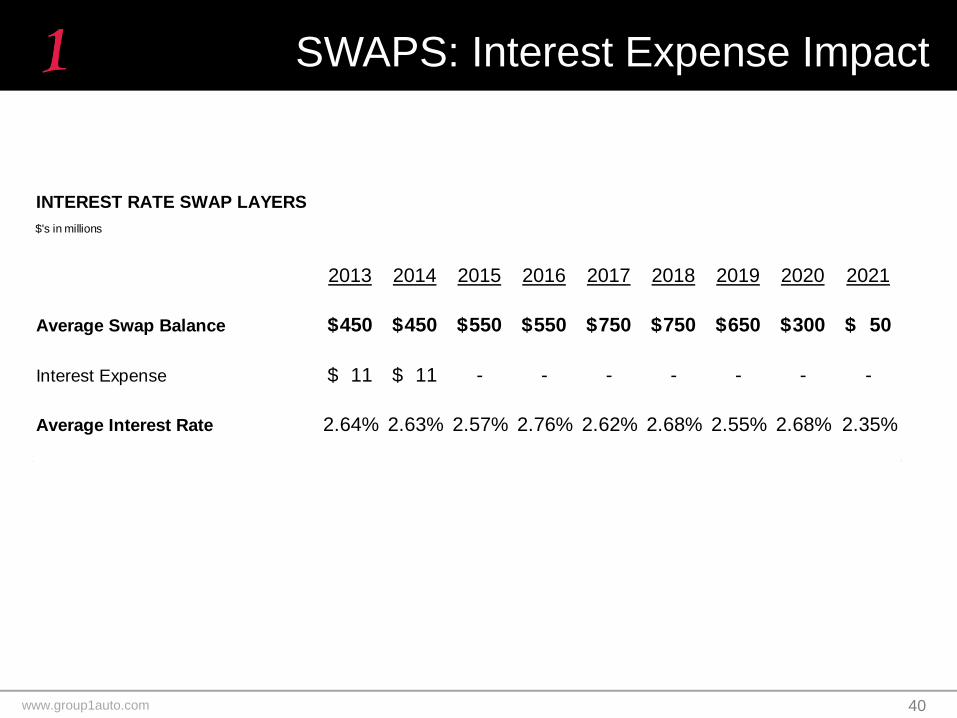
SWAPS: Interest Expense Impact
40
2013 2014 2015 2016 2017 2018 2019 2020 2021
Average Swap Balance 450$ 450$ 550$ 550$ 750$ 750$ 650$ 300$ 50$
Interest Expense 11$ 11$ - - - - - - -
Average Interest Rate 2.64% 2.63% 2.57% 2.76% 2.62% 2.68% 2.55% 2.68% 2.35%
$'s in millions
INTEREST RATE SWAP LAYERS

www.group1auto.com
Brazil
www.group1auto.com
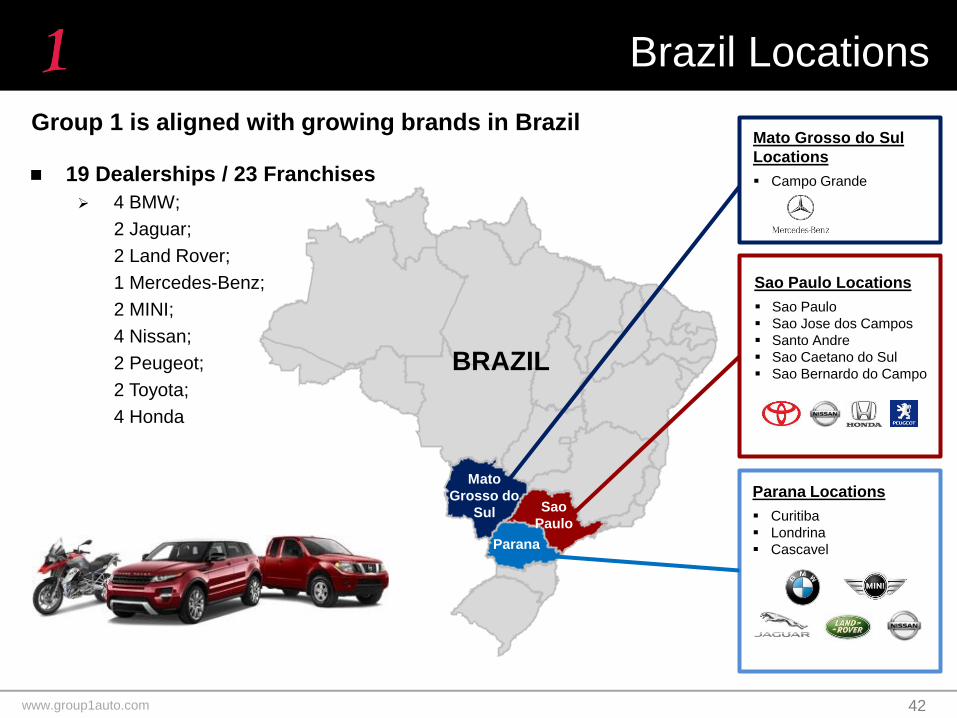
BRAZIL
Sao
Paulo
Parana
Mato
Grosso do
Sul
19 Dealerships / 23 Franchises
4 BMW;
2 Jaguar;
2 Land Rover;
1 Mercedes-Benz;
2 MINI;
4 Nissan;
2 Peugeot;
2 Toyota;
4 Honda
Group 1 is aligned with growing brands in Brazil
Brazil Locations
42
Mato Grosso do Sul
Locations
Campo Grande
Parana Locations
Curitiba
Londrina
Cascavel
Sao Paulo Locations
Sao Paulo
Sao Jose dos Campos
Santo Andre
Sao Caetano do Sul
Sao Bernardo do Campo

www.group1auto.com
U.K.
www.group1auto.com
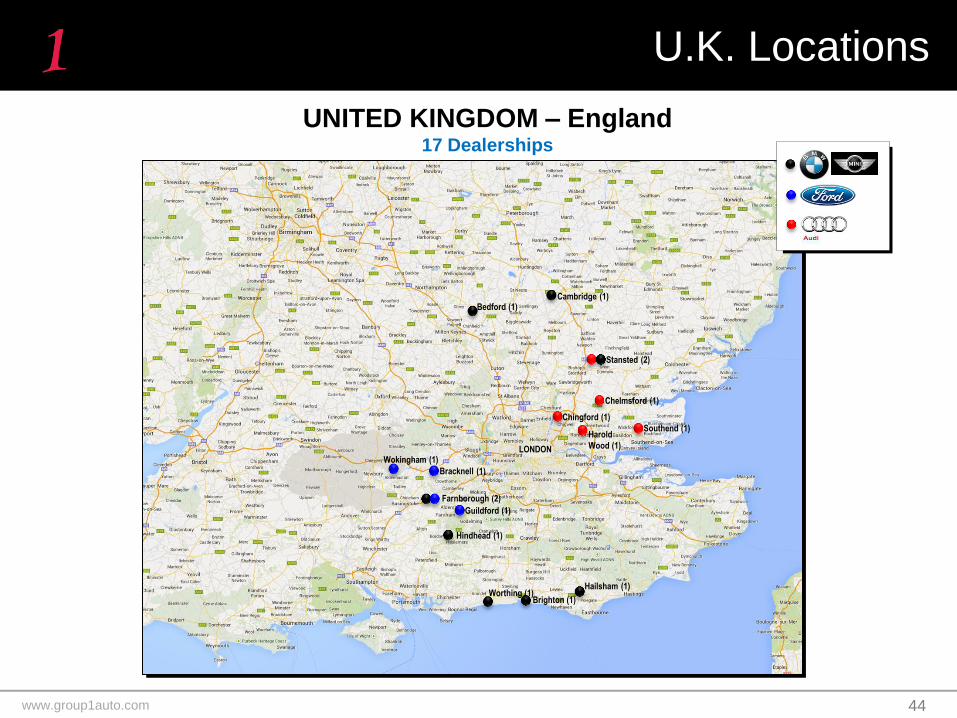
Chelmsford (1)
Southend (1)
Chingford (1)
Harold
Wood (1)
Hindhead (1)
Brighton (1)
Hailsham (1)
Bracknell (1)
Farnborough (2)
Guildford (1)
Worthing (1)
Wokingham (1)
Stansted (2)
Cambridge (1) Bedford (1)
LONDON
UNITED KINGDOM – England 17 Dealerships
U.K. Locations
44

www.group1auto.com
Reconciliations
See following section for reconciliations of data denoted within this presentation
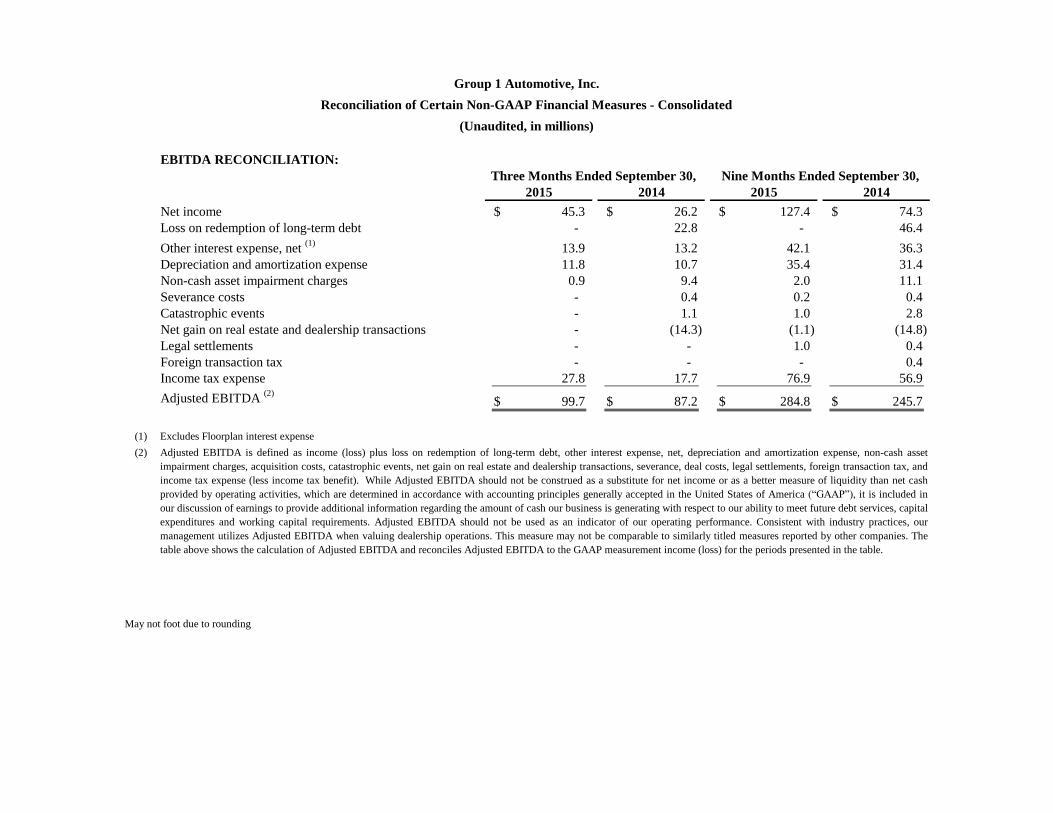
EBITDA RECONCILIATION:
2015 2014 2015 2014
Net income 45.3$ 26.2$ 127.4$ 74.3$
Loss on redemption of long-term debt - 22.8 - 46.4
Other interest expense, net (1)
13.9 13.2 42.1 36.3
Depreciation and amortization expense 11.8 10.7 35.4 31.4
Non-cash asset impairment charges 0.9 9.4 2.0 11.1
Severance costs - 0.4 0.2 0.4
Catastrophic events - 1.1 1.0 2.8
Net gain on real estate and dealership transactions - (14.3) (1.1) (14.8)
Legal settlements - - 1.0 0.4
Foreign transaction tax - - - 0.4
Income tax expense 27.8 17.7 76.9 56.9
Adjusted EBITDA (2)
99.7$ 87.2$ 284.8$ 245.7$
(1)
(2)
May not foot due to rounding
Adjusted EBITDA is defined as income (loss) plus loss on redemption of long-term debt, other interest expense, net, depreciation and amortization expense, non-cash asset
impairment charges, acquisition costs, catastrophic events, net gain on real estate and dealership transactions, severance, deal costs, legal settlements, foreign transaction tax, and
income tax expense (less income tax benefit). While Adjusted EBITDA should not be construed as a substitute for net income or as a better measure of liquidity than net cash
provided by operating activities, which are determined in accordance with accounting principles generally accepted in the United States of America (“GAAP”), it is included in
our discussion of earnings to provide additional information regarding the amount of cash our business is generating with respect to our ability to meet future debt services, capital
expenditures and working capital requirements. Adjusted EBITDA should not be used as an indicator of our operating performance. Consistent with industry practices, our
management utilizes Adjusted EBITDA when valuing dealership operations. This measure may not be comparable to similarly titled measures reported by other companies. The
table above shows the calculation of Adjusted EBITDA and reconciles Adjusted EBITDA to the GAAP measurement income (loss) for the periods presented in the table.
Three Months Ended September 30, Nine Months Ended September 30,
Group 1 Automotive, Inc.
Reconciliation of Certain Non-GAAP Financial Measures - Consolidated
(Unaudited, in millions)
Excludes Floorplan interest expense
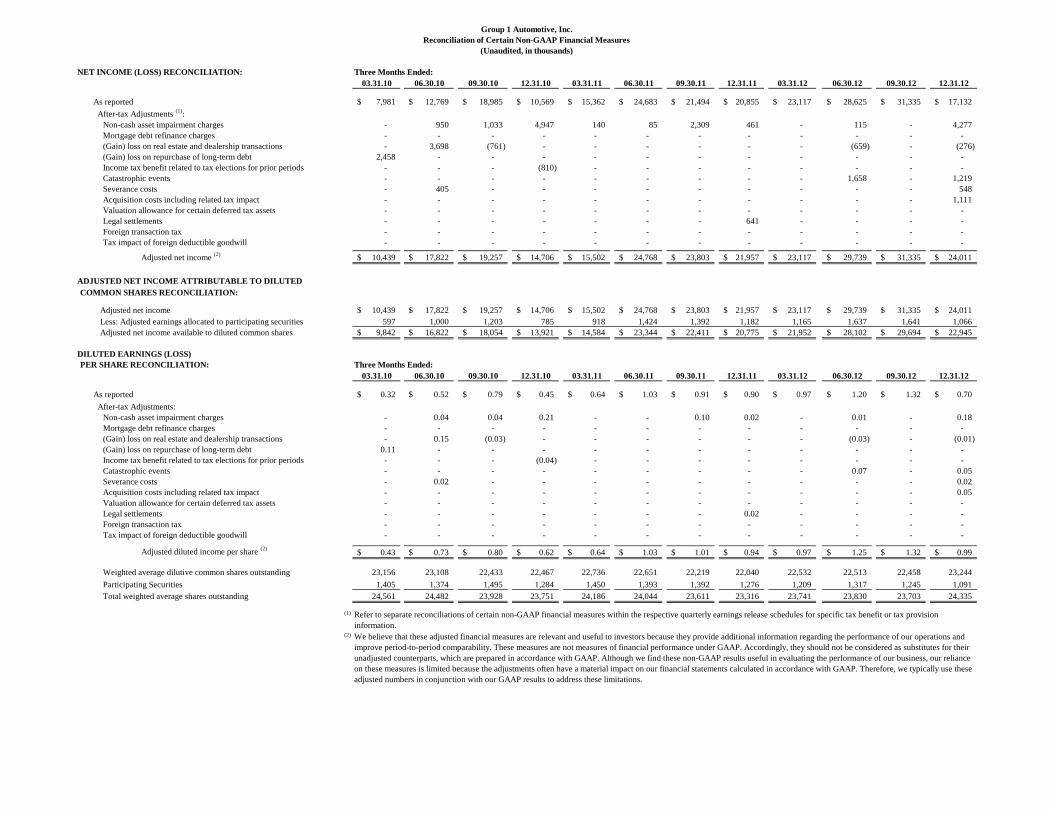
NET INCOME (LOSS) RECONCILIATION: Three Months Ended:
03.31.10 06.30.10 09.30.10 12.31.10 03.31.11 06.30.11 09.30.11 12.31.11 03.31.12 06.30.12 09.30.12 12.31.12
As reported 7,981$ 12,769$ 18,985$ 10,569$ 15,362$ 24,683$ 21,494$ 20,855$ 23,117$ 28,625$ 31,335$ 17,132$
After-tax Adjustments (1)
:
Non-cash asset impairment charges - 950 1,033 4,947 140 85 2,309 461 - 115 - 4,277
Mortgage debt refinance charges - - - - - - - - - - - -
(Gain) loss on real estate and dealership transactions - 3,698 (761) - - - - - - (659) - (276)
(Gain) loss on repurchase of long-term debt 2,458 - - - - - - - - - - -
Income tax benefit related to tax elections for prior periods - - - (810) - - - - - - - -
Catastrophic events - - - - - - - - - 1,658 - 1,219
Severance costs - 405 - - - - - - - - - 548
Acquisition costs including related tax impact - - - - - - - - - - - 1,111
Valuation allowance for certain deferred tax assets - - - - - - - - - - - -
Legal settlements - - - - - - - 641 - - - -
- - - - - - - - - - - -
- - - - - - - - - - - -
10,439$ 17,822$ 19,257$ 14,706$ 15,502$ 24,768$ 23,803$ 21,957$ 23,117$ 29,739$ 31,335$ 24,011$
ADJUSTED NET INCOME ATTRIBUTABLE TO DILUTED
COMMON SHARES RECONCILIATION:
Adjusted net income 10,439$ 17,822$ 19,257$ 14,706$ 15,502$ 24,768$ 23,803$ 21,957$ 23,117$ 29,739$ 31,335$ 24,011$
Less: Adjusted earnings allocated to participating securities 597 1,000 1,203 785 918 1,424 1,392 1,182 1,165 1,637 1,641 1,066
Adjusted net income available to diluted common shares 9,842$ 16,822$ 18,054$ 13,921$ 14,584$ 23,344$ 22,411$ 20,775$ 21,952$ 28,102$ 29,694$ 22,945$
DILUTED EARNINGS (LOSS)
PER SHARE RECONCILIATION: Three Months Ended:
03.31.10 06.30.10 09.30.10 12.31.10 03.31.11 06.30.11 09.30.11 12.31.11 03.31.12 06.30.12 09.30.12 12.31.12
As reported 0.32$ 0.52$ 0.79$ 0.45$ 0.64$ 1.03$ 0.91$ 0.90$ 0.97$ 1.20$ 1.32$ 0.70$
After-tax Adjustments:
Non-cash asset impairment charges - 0.04 0.04 0.21 - - 0.10 0.02 - 0.01 - 0.18
Mortgage debt refinance charges - - - - - - - - - - - -
(Gain) loss on real estate and dealership transactions - 0.15 (0.03) - - - - - - (0.03) - (0.01)
(Gain) loss on repurchase of long-term debt 0.11 - - - - - - - - - - -
Income tax benefit related to tax elections for prior periods - - - (0.04) - - - - - - - -
Catastrophic events - - - - - - - - - 0.07 - 0.05
Severance costs - 0.02 - - - - - - - - - 0.02
Acquisition costs including related tax impact - - - - - - - - - - - 0.05
Valuation allowance for certain deferred tax assets - - - - - - - - - - - -
Legal settlements - - - - - - - 0.02 - - - -
- - - - - - - - - - - -
- - - - - - - - - - - -
Adjusted diluted income per share (2)
0.43$ 0.73$ 0.80$ 0.62$ 0.64$ 1.03$ 1.01$ 0.94$ 0.97$ 1.25$ 1.32$ 0.99$
Weighted average dilutive common shares outstanding 23,156 23,108 22,433 22,467 22,736 22,651 22,219 22,040 22,532 22,513 22,458 23,244
Participating Securities 1,405 1,374 1,495 1,284 1,450 1,393 1,392 1,276 1,209 1,317 1,245 1,091
Total weighted average shares outstanding 24,561 24,482 23,928 23,751 24,186 24,044 23,611 23,316 23,741 23,830 23,703 24,335
(1)
(2)
Refer to separate reconciliations of certain non-GAAP financial measures within the respective quarterly earnings release schedules for specific tax benefit or tax provision
information.
We believe that these adjusted financial measures are relevant and useful to investors because they provide additional information regarding the performance of our operations and
improve period-to-period comparability. These measures are not measures of financial performance under GAAP. Accordingly, they should not be considered as substitutes for their
unadjusted counterparts, which are prepared in accordance with GAAP. Although we find these non-GAAP results useful in evaluating the performance of our business, our reliance
on these measures is limited because the adjustments often have a material impact on our financial statements calculated in accordance with GAAP. Therefore, we typically use these
adjusted numbers in conjunction with our GAAP results to address these limitations.
Adjusted net income (2)
Tax impact of foreign deductible goodwill
Tax impact of foreign deductible goodwill
Foreign transaction tax
Foreign transaction tax
Group 1 Automotive, Inc.
Reconciliation of Certain Non-GAAP Financial Measures
(Unaudited, in thousands)
NET INCOME (LOSS) RECONCILIATION:
As reported
After-tax Adjustments (1)
:
Non-cash asset impairment charges
Mortgage debt refinance charges
(Gain) loss on real estate and dealership transactions
(Gain) loss on repurchase of long-term debt
Income tax benefit related to tax elections for prior periods
Catastrophic events
Severance costs
Acquisition costs including related tax impact
Valuation allowance for certain deferred tax assets
Legal settlements
ADJUSTED NET INCOME ATTRIBUTABLE TO DILUTED
COMMON SHARES RECONCILIATION:
Adjusted net income
Less: Adjusted earnings allocated to participating securities
Adjusted net income available to diluted common shares
DILUTED EARNINGS (LOSS)
PER SHARE RECONCILIATION:
As reported
After-tax Adjustments:
Non-cash asset impairment charges
Mortgage debt refinance charges
(Gain) loss on real estate and dealership transactions
(Gain) loss on repurchase of long-term debt
Income tax benefit related to tax elections for prior periods
Catastrophic events
Severance costs
Acquisition costs including related tax impact
Valuation allowance for certain deferred tax assets
Legal settlements
Adjusted diluted income per share (2)
Weighted average dilutive common shares outstanding
Participating Securities
Total weighted average shares outstanding
Adjusted net income (2)
Tax impact of foreign deductible goodwill
Tax impact of foreign deductible goodwill
Foreign transaction tax
Foreign transaction tax
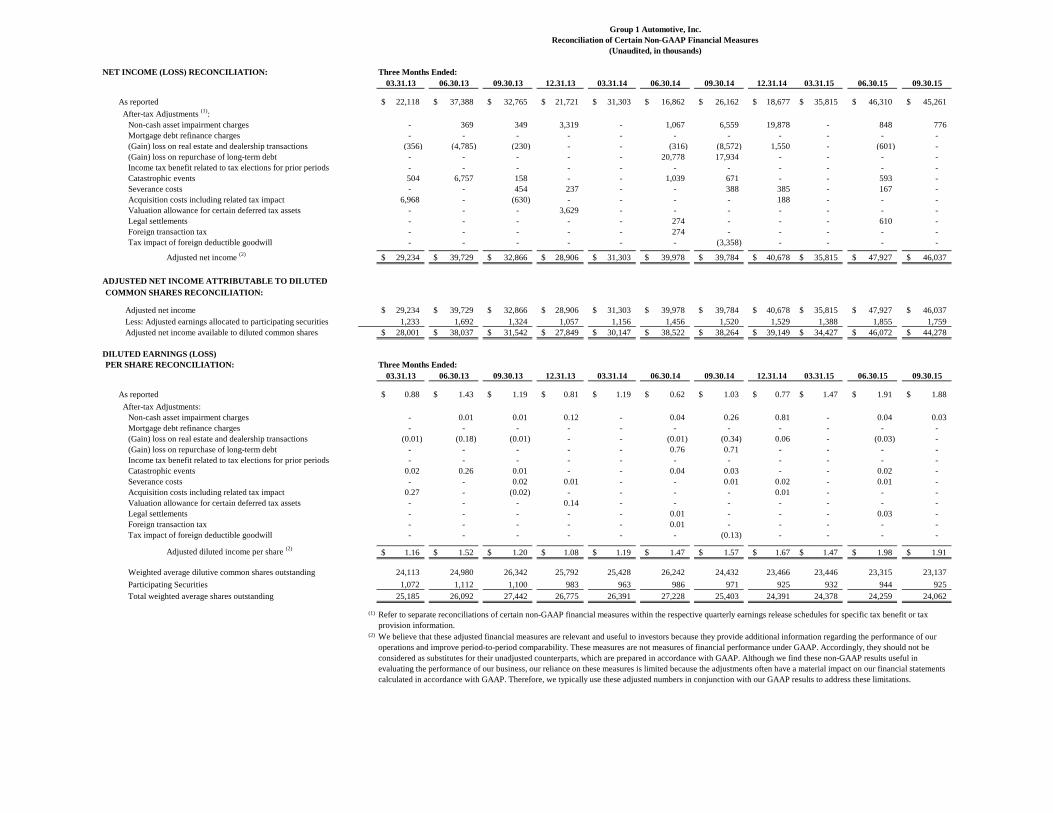
Group 1 Automotive, Inc.
Reconciliation of Certain Non-GAAP Financial Measures
(Unaudited, in thousands)
Three Months Ended:
03.31.13 06.30.13 09.30.13 12.31.13 03.31.14 06.30.14 09.30.14 12.31.14 03.31.15 06.30.15 09.30.15
22,118$ 37,388$ 32,765$ 21,721$ 31,303$ 16,862$ 26,162$ 18,677$ 35,815$ 46,310$ 45,261$
- 369 349 3,319 - 1,067 6,559 19,878 - 848 776
- - - - - - - - - - -
(356) (4,785) (230) - - (316) (8,572) 1,550 - (601) -
- - - - - 20,778 17,934 - - - -
- - - - - - - - - - -
504 6,757 158 - - 1,039 671 - - 593 -
- - 454 237 - - 388 385 - 167 -
6,968 - (630) - - - - 188 - - -
- - - 3,629 - - - - - - -
- - - - - 274 - - - 610 -
- - - - - 274 - - - - -
- - - - - - (3,358) - - - -
29,234$ 39,729$ 32,866$ 28,906$ 31,303$ 39,978$ 39,784$ 40,678$ 35,815$ 47,927$ 46,037$
29,234$ 39,729$ 32,866$ 28,906$ 31,303$ 39,978$ 39,784$ 40,678$ 35,815$ 47,927$ 46,037$
1,233 1,692 1,324 1,057 1,156 1,456 1,520 1,529 1,388 1,855 1,759
28,001$ 38,037$ 31,542$ 27,849$ 30,147$ 38,522$ 38,264$ 39,149$ 34,427$ 46,072$ 44,278$
Three Months Ended:
03.31.13 06.30.13 09.30.13 12.31.13 03.31.14 06.30.14 09.30.14 12.31.14 03.31.15 06.30.15 09.30.15
0.88$ 1.43$ 1.19$ 0.81$ 1.19$ 0.62$ 1.03$ 0.77$ 1.47$ 1.91$ 1.88$
- 0.01 0.01 0.12 - 0.04 0.26 0.81 - 0.04 0.03
- - - - - - - - - - -
(0.01) (0.18) (0.01) - - (0.01) (0.34) 0.06 - (0.03) -
- - - - - 0.76 0.71 - - - -
- - - - - - - - - - -
0.02 0.26 0.01 - - 0.04 0.03 - - 0.02 -
- - 0.02 0.01 - - 0.01 0.02 - 0.01 -
0.27 - (0.02) - - - - 0.01 - - -
- - - 0.14 - - - - - - -
- - - - - 0.01 - - - 0.03 -
- - - - - 0.01 - - - - -
- - - - - - (0.13) - - - -
1.16$ 1.52$ 1.20$ 1.08$ 1.19$ 1.47$ 1.57$ 1.67$ 1.47$ 1.98$ 1.91$
24,113 24,980 26,342 25,792 25,428 26,242 24,432 23,466 23,446 23,315 23,137
1,072 1,112 1,100 983 963 986 971 925 932 944 925
25,185 26,092 27,442 26,775 26,391 27,228 25,403 24,391 24,378 24,259 24,062
(1)
(2)
Refer to separate reconciliations of certain non-GAAP financial measures within the respective quarterly earnings release schedules for specific tax benefit or tax
provision information.
We believe that these adjusted financial measures are relevant and useful to investors because they provide additional information regarding the performance of our
operations and improve period-to-period comparability. These measures are not measures of financial performance under GAAP. Accordingly, they should not be
considered as substitutes for their unadjusted counterparts, which are prepared in accordance with GAAP. Although we find these non-GAAP results useful in
evaluating the performance of our business, our reliance on these measures is limited because the adjustments often have a material impact on our financial statements
calculated in accordance with GAAP. Therefore, we typically use these adjusted numbers in conjunction with our GAAP results to address these limitations.
Group 1 Automotive, Inc.
Reconciliation of Certain Non-GAAP Financial Measures
(Unaudited, in thousands)
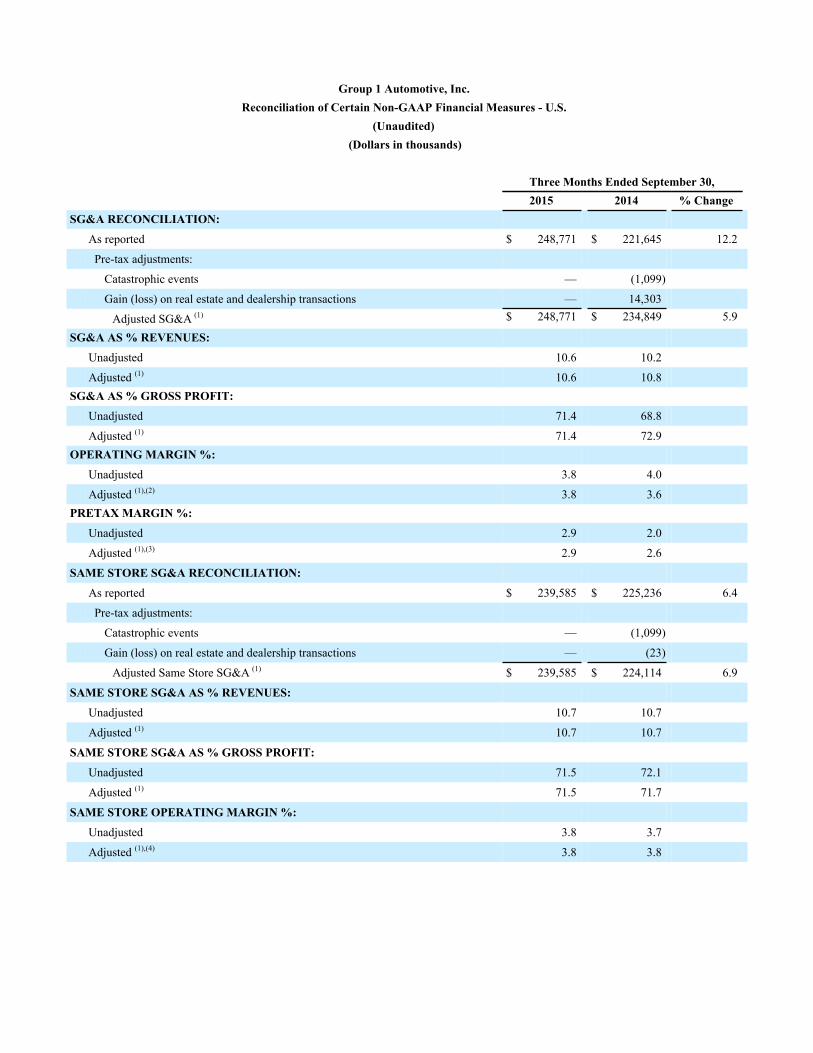
Group 1 Automotive, Inc.Reconciliation of Certain Non-GAAP Financial Measures - U.S.
(Unaudited) (Dollars in thousands)
Three Months Ended September 30,2015 2014 % Change
SG&A RECONCILIATION:
As reported $ 248,771 $ 221,645 12.2
Pre-tax adjustments:
Catastrophic events — (1,099)
Gain (loss) on real estate and dealership transactions — 14,303
Adjusted SG&A (1) $ 248,771 $ 234,849 5.9
SG&A AS % REVENUES:
Unadjusted 10.6 10.2
Adjusted (1) 10.6 10.8SG&A AS % GROSS PROFIT:
Unadjusted 71.4 68.8
Adjusted (1) 71.4 72.9OPERATING MARGIN %:
Unadjusted 3.8 4.0
Adjusted (1),(2) 3.8 3.6PRETAX MARGIN %:
Unadjusted 2.9 2.0
Adjusted (1),(3) 2.9 2.6
SAME STORE SG&A RECONCILIATION:
As reported $ 239,585 $ 225,236 6.4
Pre-tax adjustments:
Catastrophic events — (1,099)
Gain (loss) on real estate and dealership transactions — (23)
Adjusted Same Store SG&A (1) $ 239,585 $ 224,114 6.9
SAME STORE SG&A AS % REVENUES:
Unadjusted 10.7 10.7
Adjusted (1) 10.7 10.7
SAME STORE SG&A AS % GROSS PROFIT:
Unadjusted 71.5 72.1
Adjusted (1) 71.5 71.7
SAME STORE OPERATING MARGIN %:
Unadjusted 3.8 3.7
Adjusted (1),(4) 3.8 3.8
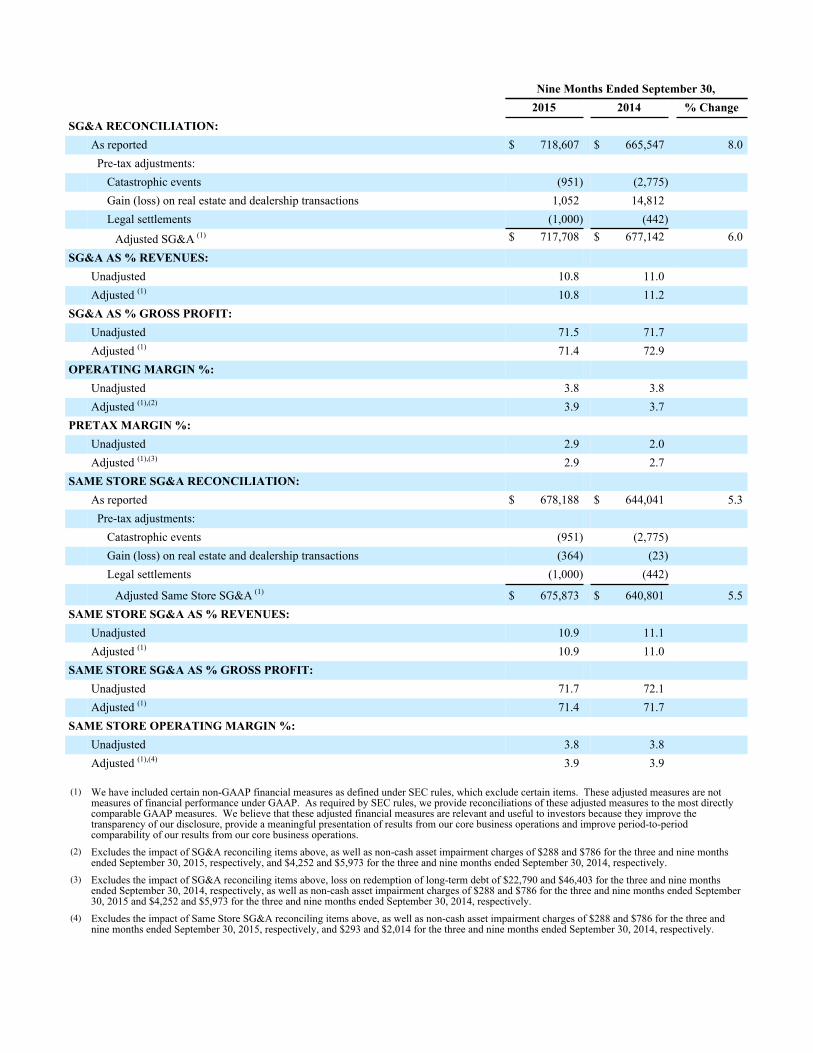
Nine Months Ended September 30,2015 2014 % Change
SG&A RECONCILIATION:As reported $ 718,607 $ 665,547 8.0 Pre-tax adjustments:
Catastrophic events (951) (2,775)Gain (loss) on real estate and dealership transactions 1,052 14,812Legal settlements (1,000) (442)
Adjusted SG&A (1) $ 717,708 $ 677,142 6.0
SG&A AS % REVENUES:Unadjusted 10.8 11.0Adjusted (1) 10.8 11.2
SG&A AS % GROSS PROFIT:Unadjusted 71.5 71.7Adjusted (1) 71.4 72.9
OPERATING MARGIN %:Unadjusted 3.8 3.8Adjusted (1),(2) 3.9 3.7
PRETAX MARGIN %:Unadjusted 2.9 2.0Adjusted (1),(3) 2.9 2.7
SAME STORE SG&A RECONCILIATION:As reported $ 678,188 $ 644,041 5.3 Pre-tax adjustments:
Catastrophic events (951) (2,775)Gain (loss) on real estate and dealership transactions (364) (23)Legal settlements (1,000) (442)
Adjusted Same Store SG&A (1) $ 675,873 $ 640,801 5.5SAME STORE SG&A AS % REVENUES:
Unadjusted 10.9 11.1Adjusted (1) 10.9 11.0
SAME STORE SG&A AS % GROSS PROFIT:Unadjusted 71.7 72.1Adjusted (1) 71.4 71.7
SAME STORE OPERATING MARGIN %:Unadjusted 3.8 3.8Adjusted (1),(4) 3.9 3.9
(1) We have included certain non-GAAP financial measures as defined under SEC rules, which exclude certain items. These adjusted measures are notmeasures of financial performance under GAAP. As required by SEC rules, we provide reconciliations of these adjusted measures to the most directlycomparable GAAP measures. We believe that these adjusted financial measures are relevant and useful to investors because they improve thetransparency of our disclosure, provide a meaningful presentation of results from our core business operations and improve period-to-periodcomparability of our results from our core business operations.
(2) Excludes the impact of SG&A reconciling items above, as well as non-cash asset impairment charges of $288 and $786 for the three and nine monthsended September 30, 2015, respectively, and $4,252 and $5,973 for the three and nine months ended September 30, 2014, respectively.
(3) Excludes the impact of SG&A reconciling items above, loss on redemption of long-term debt of $22,790 and $46,403 for the three and nine monthsended September 30, 2014, respectively, as well as non-cash asset impairment charges of $288 and $786 for the three and nine months ended September30, 2015 and $4,252 and $5,973 for the three and nine months ended September 30, 2014, respectively.
(4) Excludes the impact of Same Store SG&A reconciling items above, as well as non-cash asset impairment charges of $288 and $786 for the three andnine months ended September 30, 2015, respectively, and $293 and $2,014 for the three and nine months ended September 30, 2014, respectively.
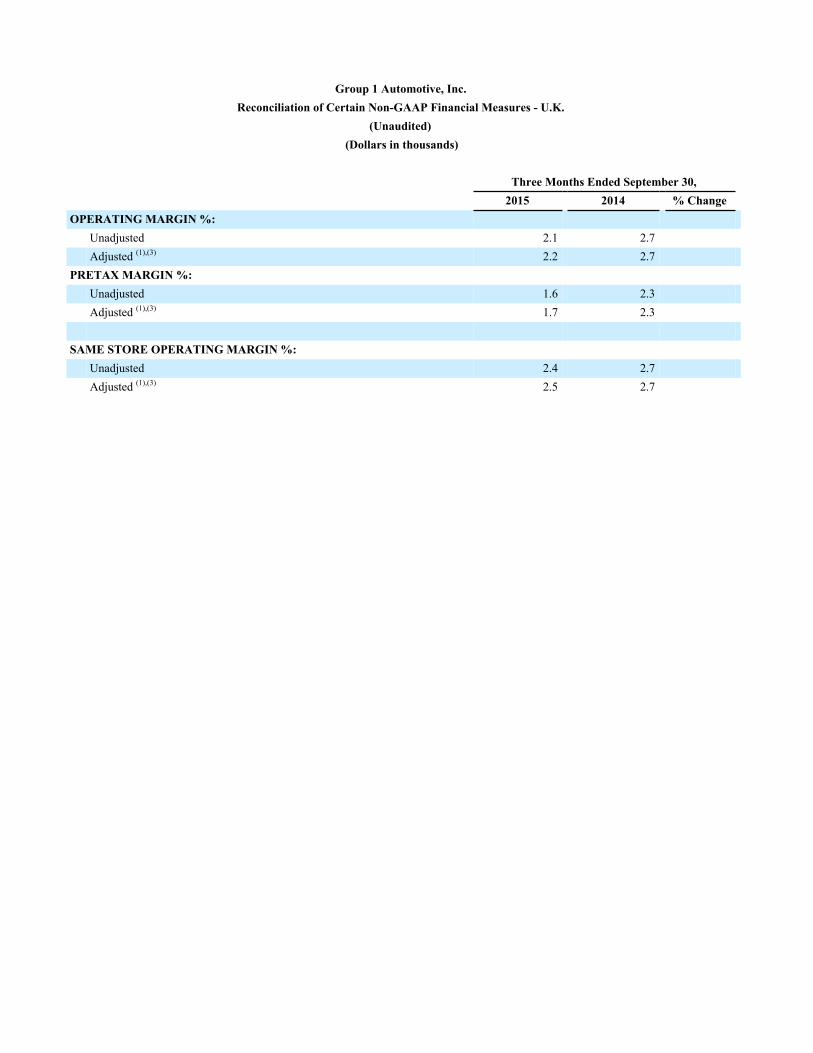
Group 1 Automotive, Inc.Reconciliation of Certain Non-GAAP Financial Measures - U.K.
(Unaudited) (Dollars in thousands)
Three Months Ended September 30,2015 2014 % Change
OPERATING MARGIN %:Unadjusted 2.1 2.7Adjusted (1),(3) 2.2 2.7
PRETAX MARGIN %:Unadjusted 1.6 2.3Adjusted (1),(3) 1.7 2.3
SAME STORE OPERATING MARGIN %:Unadjusted 2.4 2.7Adjusted (1),(3) 2.5 2.7
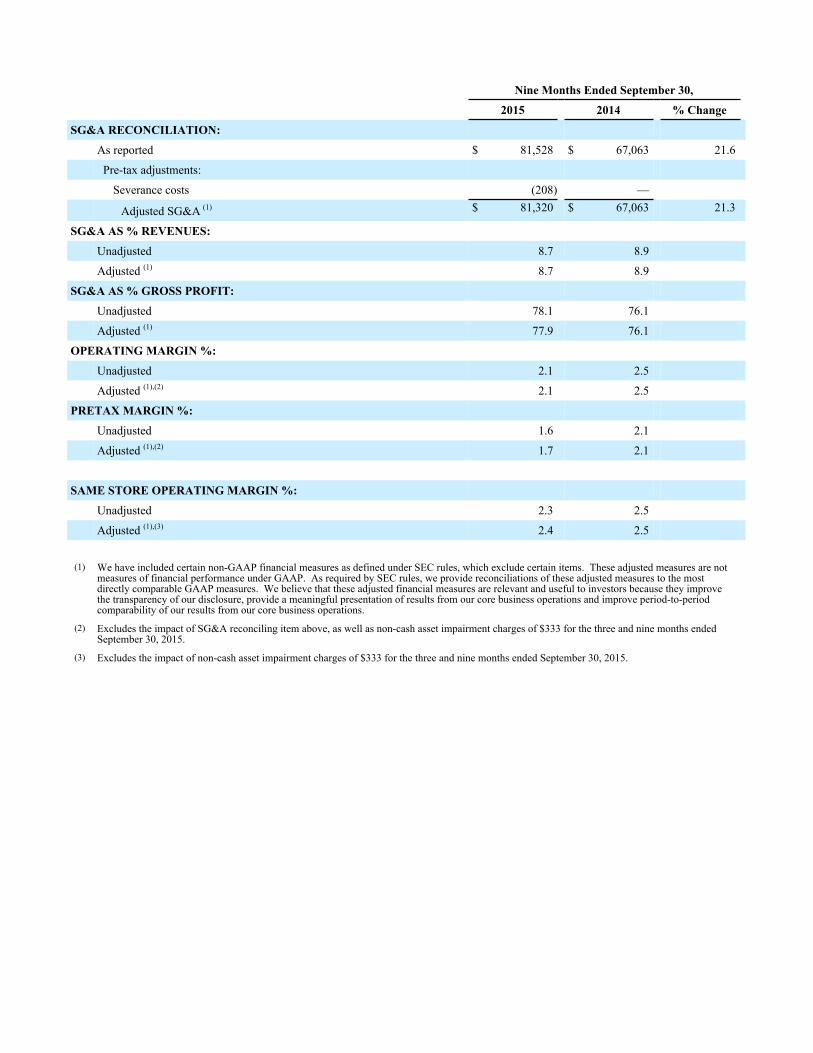
Nine Months Ended September 30,
2015 2014 % Change
SG&A RECONCILIATION:
As reported $ 81,528 $ 67,063 21.6
Pre-tax adjustments:
Severance costs (208) —
Adjusted SG&A (1) $ 81,320 $ 67,063 21.3
SG&A AS % REVENUES:
Unadjusted 8.7 8.9
Adjusted (1) 8.7 8.9
SG&A AS % GROSS PROFIT:
Unadjusted 78.1 76.1
Adjusted (1) 77.9 76.1
OPERATING MARGIN %:
Unadjusted 2.1 2.5
Adjusted (1),(2) 2.1 2.5
PRETAX MARGIN %:
Unadjusted 1.6 2.1
Adjusted (1),(2) 1.7 2.1
SAME STORE OPERATING MARGIN %:
Unadjusted 2.3 2.5
Adjusted (1),(3) 2.4 2.5
(1) We have included certain non-GAAP financial measures as defined under SEC rules, which exclude certain items. These adjusted measures are notmeasures of financial performance under GAAP. As required by SEC rules, we provide reconciliations of these adjusted measures to the mostdirectly comparable GAAP measures. We believe that these adjusted financial measures are relevant and useful to investors because they improvethe transparency of our disclosure, provide a meaningful presentation of results from our core business operations and improve period-to-periodcomparability of our results from our core business operations.
(2) Excludes the impact of SG&A reconciling item above, as well as non-cash asset impairment charges of $333 for the three and nine months endedSeptember 30, 2015.
(3) Excludes the impact of non-cash asset impairment charges of $333 for the three and nine months ended September 30, 2015.
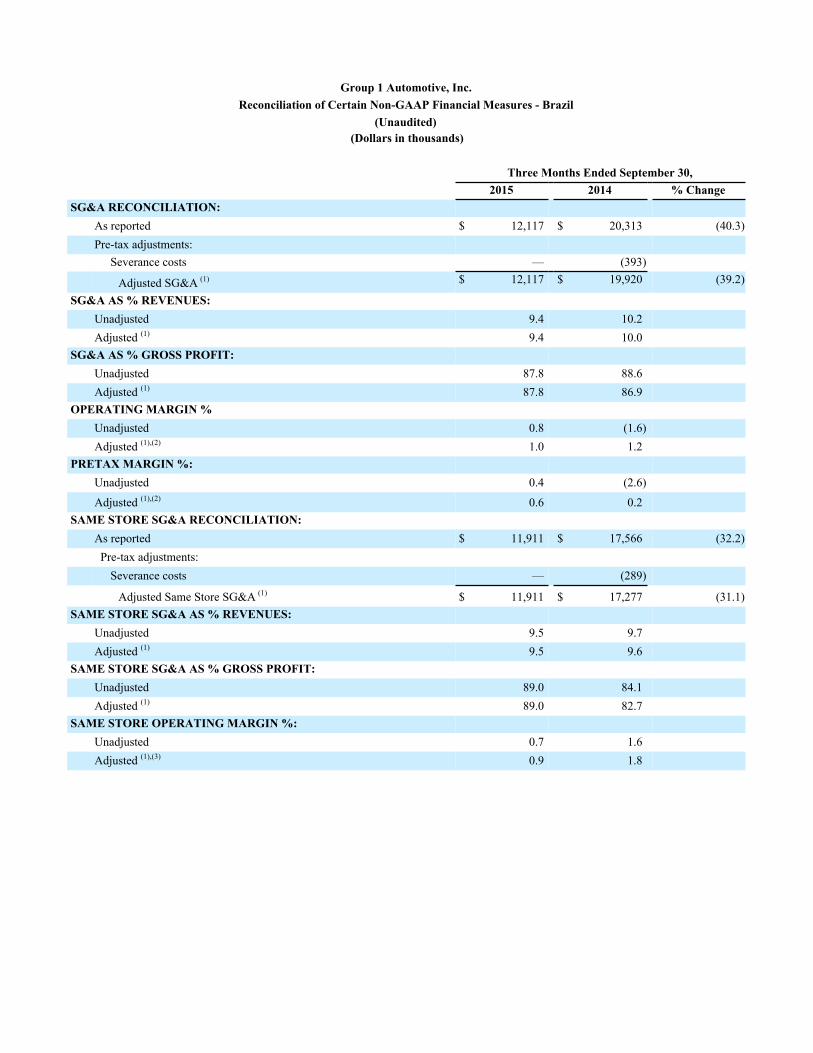
Group 1 Automotive, Inc.Reconciliation of Certain Non-GAAP Financial Measures - Brazil
(Unaudited) (Dollars in thousands)
Three Months Ended September 30,2015 2014 % Change
SG&A RECONCILIATION:As reported $ 12,117 $ 20,313 (40.3)Pre-tax adjustments:
Severance costs — (393)
Adjusted SG&A (1) $ 12,117 $ 19,920 (39.2)
SG&A AS % REVENUES:Unadjusted 9.4 10.2Adjusted (1) 9.4 10.0
SG&A AS % GROSS PROFIT:Unadjusted 87.8 88.6Adjusted (1) 87.8 86.9
OPERATING MARGIN %Unadjusted 0.8 (1.6)Adjusted (1),(2) 1.0 1.2
PRETAX MARGIN %:Unadjusted 0.4 (2.6)
Adjusted (1),(2) 0.6 0.2SAME STORE SG&A RECONCILIATION:
As reported $ 11,911 $ 17,566 (32.2) Pre-tax adjustments:
Severance costs — (289)
Adjusted Same Store SG&A (1) $ 11,911 $ 17,277 (31.1)SAME STORE SG&A AS % REVENUES:
Unadjusted 9.5 9.7Adjusted (1) 9.5 9.6
SAME STORE SG&A AS % GROSS PROFIT:Unadjusted 89.0 84.1Adjusted (1) 89.0 82.7
SAME STORE OPERATING MARGIN %:Unadjusted 0.7 1.6Adjusted (1),(3) 0.9 1.8
Nine Months Ended September 30,
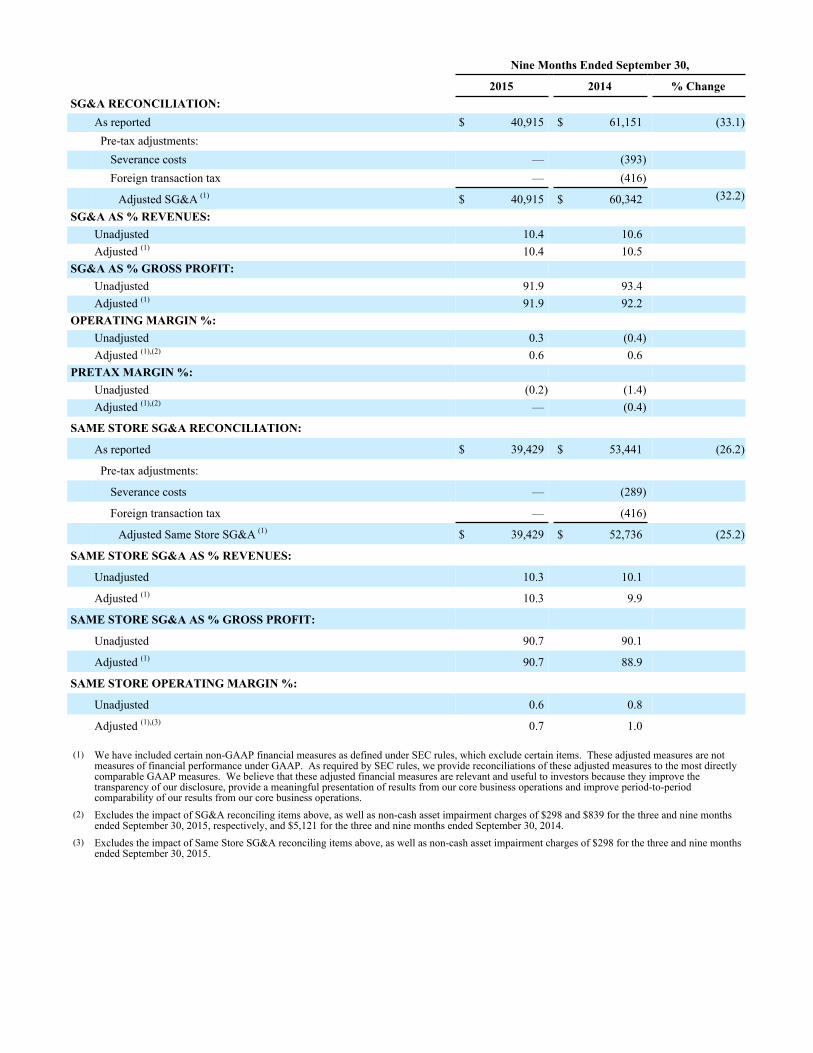
2015 2014 % ChangeSG&A RECONCILIATION:
As reported $ 40,915 $ 61,151 (33.1) Pre-tax adjustments:
Severance costs — (393)Foreign transaction tax — (416)
Adjusted SG&A (1) $ 40,915 $ 60,342 (32.2)
SG&A AS % REVENUES:Unadjusted 10.4 10.6Adjusted (1) 10.4 10.5
SG&A AS % GROSS PROFIT:Unadjusted 91.9 93.4Adjusted (1) 91.9 92.2
OPERATING MARGIN %:Unadjusted 0.3 (0.4)Adjusted (1),(2) 0.6 0.6
PRETAX MARGIN %:Unadjusted (0.2) (1.4)Adjusted (1),(2) — (0.4)
SAME STORE SG&A RECONCILIATION:
As reported $ 39,429 $ 53,441 (26.2)
Pre-tax adjustments:
Severance costs — (289)
Foreign transaction tax — (416)
Adjusted Same Store SG&A (1) $ 39,429 $ 52,736 (25.2)
SAME STORE SG&A AS % REVENUES:
Unadjusted 10.3 10.1
Adjusted (1) 10.3 9.9
SAME STORE SG&A AS % GROSS PROFIT:
Unadjusted 90.7 90.1
Adjusted (1) 90.7 88.9
SAME STORE OPERATING MARGIN %:
Unadjusted 0.6 0.8
Adjusted (1),(3) 0.7 1.0
(1) We have included certain non-GAAP financial measures as defined under SEC rules, which exclude certain items. These adjusted measures are notmeasures of financial performance under GAAP. As required by SEC rules, we provide reconciliations of these adjusted measures to the most directlycomparable GAAP measures. We believe that these adjusted financial measures are relevant and useful to investors because they improve thetransparency of our disclosure, provide a meaningful presentation of results from our core business operations and improve period-to-periodcomparability of our results from our core business operations.
(2) Excludes the impact of SG&A reconciling items above, as well as non-cash asset impairment charges of $298 and $839 for the three and nine monthsended September 30, 2015, respectively, and $5,121 for the three and nine months ended September 30, 2014.
(3) Excludes the impact of Same Store SG&A reconciling items above, as well as non-cash asset impairment charges of $298 for the three and nine monthsended September 30, 2015.
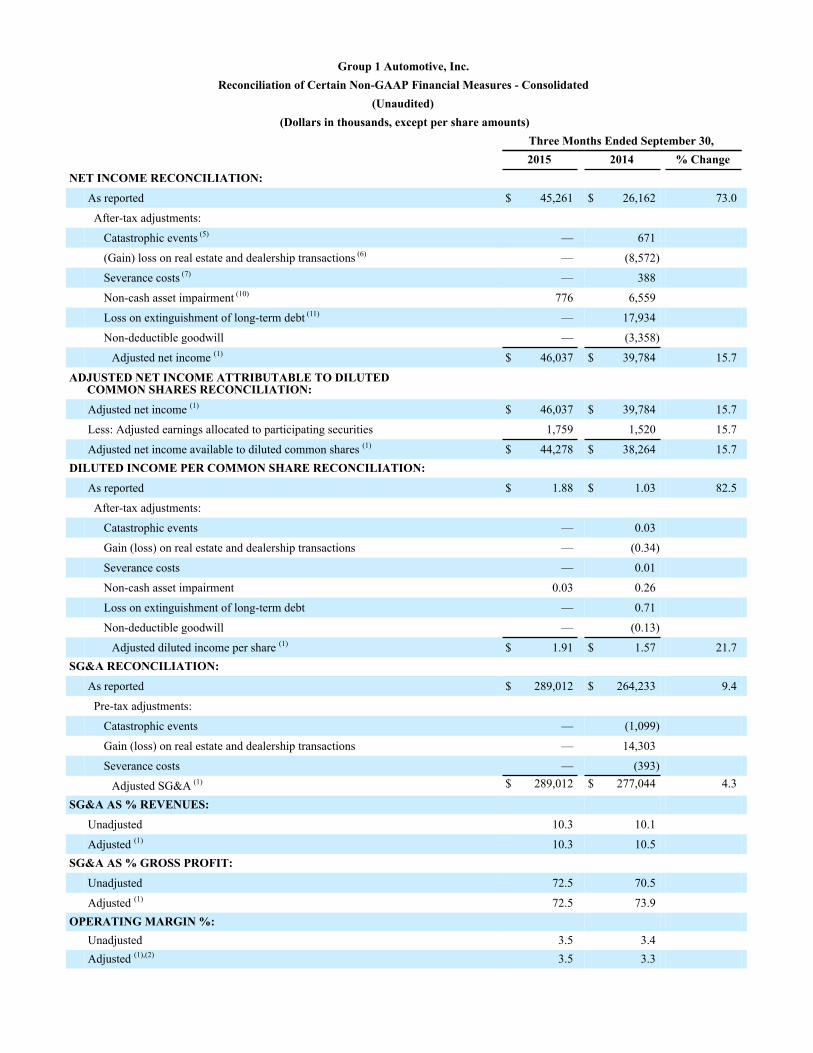
Group 1 Automotive, Inc.Reconciliation of Certain Non-GAAP Financial Measures - Consolidated
(Unaudited) (Dollars in thousands, except per share amounts)
Three Months Ended September 30,2015 2014 % Change
NET INCOME RECONCILIATION:
As reported $ 45,261 $ 26,162 73.0
After-tax adjustments:
Catastrophic events (5) — 671
(Gain) loss on real estate and dealership transactions (6) — (8,572)
Severance costs (7) — 388
Non-cash asset impairment (10) 776 6,559
Loss on extinguishment of long-term debt (11) — 17,934
Non-deductible goodwill — (3,358)
Adjusted net income (1) $ 46,037 $ 39,784 15.7
ADJUSTED NET INCOME ATTRIBUTABLE TO DILUTEDCOMMON SHARES RECONCILIATION:
Adjusted net income (1) $ 46,037 $ 39,784 15.7
Less: Adjusted earnings allocated to participating securities 1,759 1,520 15.7
Adjusted net income available to diluted common shares (1) $ 44,278 $ 38,264 15.7DILUTED INCOME PER COMMON SHARE RECONCILIATION:
As reported $ 1.88 $ 1.03 82.5
After-tax adjustments:
Catastrophic events — 0.03
Gain (loss) on real estate and dealership transactions — (0.34)
Severance costs — 0.01
Non-cash asset impairment 0.03 0.26
Loss on extinguishment of long-term debt — 0.71
Non-deductible goodwill — (0.13)
Adjusted diluted income per share (1) $ 1.91 $ 1.57 21.7SG&A RECONCILIATION:
As reported $ 289,012 $ 264,233 9.4
Pre-tax adjustments:
Catastrophic events — (1,099)
Gain (loss) on real estate and dealership transactions — 14,303
Severance costs — (393)
Adjusted SG&A (1) $ 289,012 $ 277,044 4.3
SG&A AS % REVENUES:
Unadjusted 10.3 10.1
Adjusted (1) 10.3 10.5SG&A AS % GROSS PROFIT:
Unadjusted 72.5 70.5
Adjusted (1) 72.5 73.9OPERATING MARGIN %:
Unadjusted 3.5 3.4Adjusted (1),(2) 3.5 3.3
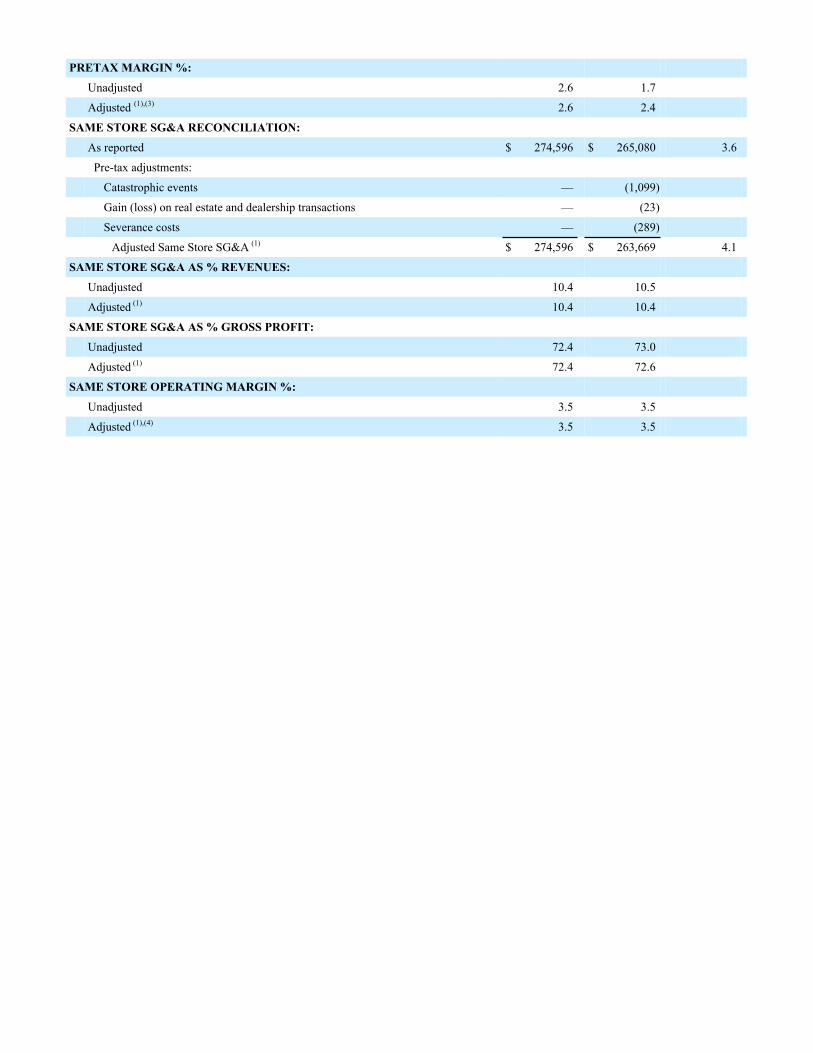
PRETAX MARGIN %:
Unadjusted 2.6 1.7
Adjusted (1),(3) 2.6 2.4
SAME STORE SG&A RECONCILIATION:
As reported $ 274,596 $ 265,080 3.6
Pre-tax adjustments:
Catastrophic events — (1,099)
Gain (loss) on real estate and dealership transactions — (23)
Severance costs — (289)
Adjusted Same Store SG&A (1) $ 274,596 $ 263,669 4.1
SAME STORE SG&A AS % REVENUES:
Unadjusted 10.4 10.5
Adjusted (1) 10.4 10.4
SAME STORE SG&A AS % GROSS PROFIT:
Unadjusted 72.4 73.0
Adjusted (1) 72.4 72.6
SAME STORE OPERATING MARGIN %:
Unadjusted 3.5 3.5
Adjusted (1),(4) 3.5 3.5
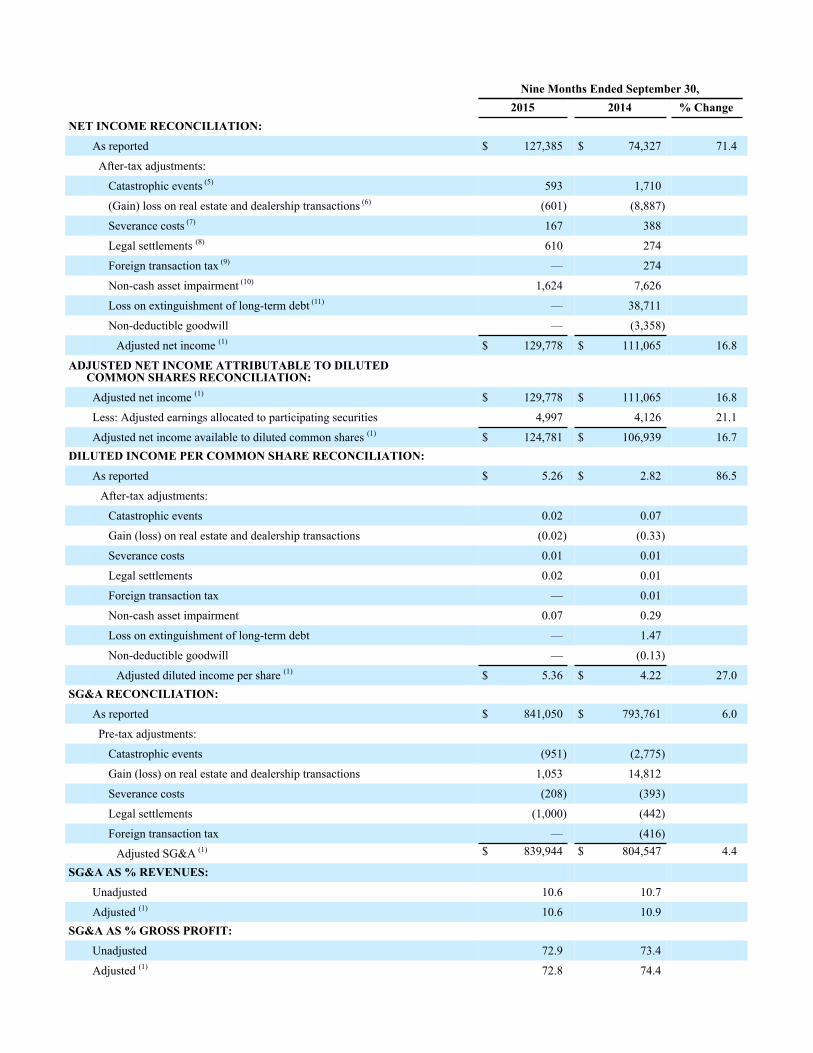
Nine Months Ended September 30,2015 2014 % Change
NET INCOME RECONCILIATION:
As reported $ 127,385 $ 74,327 71.4
After-tax adjustments:
Catastrophic events (5) 593 1,710
(Gain) loss on real estate and dealership transactions (6) (601) (8,887)
Severance costs (7) 167 388
Legal settlements (8) 610 274
Foreign transaction tax (9) — 274
Non-cash asset impairment (10) 1,624 7,626
Loss on extinguishment of long-term debt (11) — 38,711
Non-deductible goodwill — (3,358)
Adjusted net income (1) $ 129,778 $ 111,065 16.8
ADJUSTED NET INCOME ATTRIBUTABLE TO DILUTEDCOMMON SHARES RECONCILIATION:
Adjusted net income (1) $ 129,778 $ 111,065 16.8
Less: Adjusted earnings allocated to participating securities 4,997 4,126 21.1
Adjusted net income available to diluted common shares (1) $ 124,781 $ 106,939 16.7DILUTED INCOME PER COMMON SHARE RECONCILIATION:
As reported $ 5.26 $ 2.82 86.5
After-tax adjustments:
Catastrophic events 0.02 0.07
Gain (loss) on real estate and dealership transactions (0.02) (0.33)
Severance costs 0.01 0.01
Legal settlements 0.02 0.01
Foreign transaction tax — 0.01
Non-cash asset impairment 0.07 0.29
Loss on extinguishment of long-term debt — 1.47
Non-deductible goodwill — (0.13)
Adjusted diluted income per share (1) $ 5.36 $ 4.22 27.0SG&A RECONCILIATION:
As reported $ 841,050 $ 793,761 6.0
Pre-tax adjustments:
Catastrophic events (951) (2,775)
Gain (loss) on real estate and dealership transactions 1,053 14,812
Severance costs (208) (393)
Legal settlements (1,000) (442)
Foreign transaction tax — (416)
Adjusted SG&A (1) $ 839,944 $ 804,547 4.4
SG&A AS % REVENUES:
Unadjusted 10.6 10.7
Adjusted (1) 10.6 10.9SG&A AS % GROSS PROFIT:
Unadjusted 72.9 73.4
Adjusted (1) 72.8 74.4
OPERATING MARGIN %:Unadjusted 3.5 3.3Adjusted (1),(2) 3.5 3.3
PRETAX MARGIN %:
Unadjusted 2.6 1.8
Adjusted (1),(3) 2.6 2.4
SAME STORE SG&A RECONCILIATION:
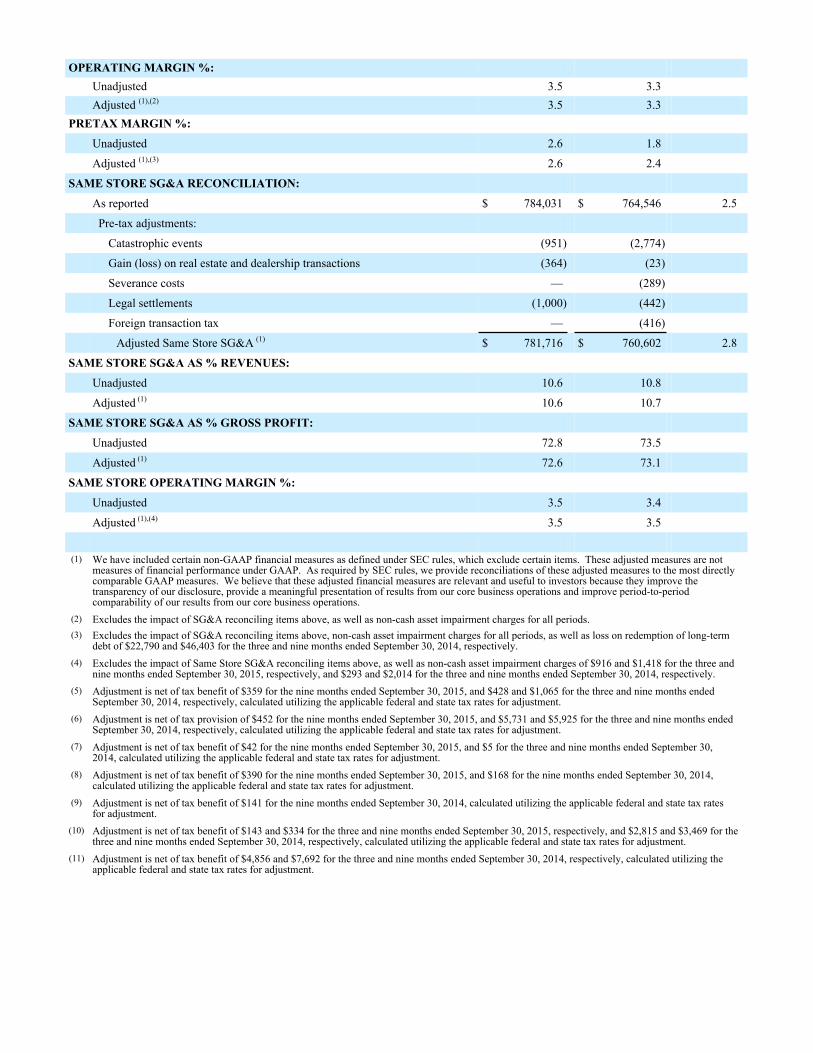
As reported $ 784,031 $ 764,546 2.5
Pre-tax adjustments:
Catastrophic events (951) (2,774)
Gain (loss) on real estate and dealership transactions (364) (23)
Severance costs — (289)
Legal settlements (1,000) (442)
Foreign transaction tax — (416)
Adjusted Same Store SG&A (1) $ 781,716 $ 760,602 2.8
SAME STORE SG&A AS % REVENUES:
Unadjusted 10.6 10.8
Adjusted (1) 10.6 10.7
SAME STORE SG&A AS % GROSS PROFIT:
Unadjusted 72.8 73.5
Adjusted (1) 72.6 73.1
SAME STORE OPERATING MARGIN %:
Unadjusted 3.5 3.4
Adjusted (1),(4) 3.5 3.5
(1) We have included certain non-GAAP financial measures as defined under SEC rules, which exclude certain items. These adjusted measures are notmeasures of financial performance under GAAP. As required by SEC rules, we provide reconciliations of these adjusted measures to the most directlycomparable GAAP measures. We believe that these adjusted financial measures are relevant and useful to investors because they improve thetransparency of our disclosure, provide a meaningful presentation of results from our core business operations and improve period-to-periodcomparability of our results from our core business operations.
(2) Excludes the impact of SG&A reconciling items above, as well as non-cash asset impairment charges for all periods.(3) Excludes the impact of SG&A reconciling items above, non-cash asset impairment charges for all periods, as well as loss on redemption of long-term
debt of $22,790 and $46,403 for the three and nine months ended September 30, 2014, respectively.(4) Excludes the impact of Same Store SG&A reconciling items above, as well as non-cash asset impairment charges of $916 and $1,418 for the three and
nine months ended September 30, 2015, respectively, and $293 and $2,014 for the three and nine months ended September 30, 2014, respectively.(5) Adjustment is net of tax benefit of $359 for the nine months ended September 30, 2015, and $428 and $1,065 for the three and nine months ended
September 30, 2014, respectively, calculated utilizing the applicable federal and state tax rates for adjustment.(6) Adjustment is net of tax provision of $452 for the nine months ended September 30, 2015, and $5,731 and $5,925 for the three and nine months ended
September 30, 2014, respectively, calculated utilizing the applicable federal and state tax rates for adjustment.(7) Adjustment is net of tax benefit of $42 for the nine months ended September 30, 2015, and $5 for the three and nine months ended September 30,
2014, calculated utilizing the applicable federal and state tax rates for adjustment.(8) Adjustment is net of tax benefit of $390 for the nine months ended September 30, 2015, and $168 for the nine months ended September 30, 2014,
calculated utilizing the applicable federal and state tax rates for adjustment.(9) Adjustment is net of tax benefit of $141 for the nine months ended September 30, 2014, calculated utilizing the applicable federal and state tax rates
for adjustment.(10) Adjustment is net of tax benefit of $143 and $334 for the three and nine months ended September 30, 2015, respectively, and $2,815 and $3,469 for the
three and nine months ended September 30, 2014, respectively, calculated utilizing the applicable federal and state tax rates for adjustment.(11) Adjustment is net of tax benefit of $4,856 and $7,692 for the three and nine months ended September 30, 2014, respectively, calculated utilizing the
applicable federal and state tax rates for adjustment.

www.group1auto.com
www.group1auto.com