2015/2016 - kwazulu-natal treasury economic/sero_final_4_march_201… · 2015/2016 kwazulu-natal...
TRANSCRIPT

PROVINCE OF KWAZULU-NATAL
Socio-Economic Review and Outlook
2015/2016
KwaZulu-Natal Provincial Government

ISBN: ISBN No. 1-920041-10-9
To obtain further copies of this document, please contact: Provincial Treasury 5th Floor Treasury House 145 Chief Albert Luthuli Road 3201 P.O. Box 3613 Pietermaritzburg 3200 Tel: +27 (0) 33 – 897 4444 Fax: +27 (0) 33 – 897 4580

i
Table of Contents
Executive Summary
Chapter 1: Introduction .......................................................................................... 1
Chapter 2: Demographic Profile ............................................................................ 3
2.1 Introduction ....................................................................................... 3 2.2 Global population growth .................................................................. 3 2.3 South African population ……… ........................................................ 4 2.4 Population growth rate… ................................................................... 5 2.5 KwaZulu-Natal provincial population size…………………………… ... 6 2.6 Population distribution by age, race and gender…………………… ... 6 2.6.1 Population by age, gender and dependency ratio………………... .. 6 2.7 Population by race………………………………………………. ............ 7 2.8 Fertility, mortality, life expectancy and migration…………………. ...... 8 2.8.1 Fertility………………………………………………………………. ...... 8 2.8.2 Mortality……………………………………………………………. ....... 10 2.8.3 Life expectancy……………………………………………………. ....... 11 2.8.4 Migration……………………………………………………………. ...... 11 2.8.5 Conclusion…………………………………………………………… .... 12
Chapter 3: Development Indicators ........................................................................ 13
3.1 Introduction……………………………………………………………… .. 13 3.2 Poverty ………………………………………………………………… .... 14 3.3 Household income and income inequality…………………………… .. 15 3.4 Human development ………………… .................................... ………16 3.5 Grant beneficiaries……………………………………………………… .. 17 3.6 Education………………………………………………………………… .. 18 3.6.1 School and educator: learner ratio………………… ......................... 19 3.6.2 Literacy rate and matric results…………………………………… ..... 20 3.6.3 National senior certificate achievements…………………………… . 22 3.7 Access to health………………………………………………………… .. 24 3.7.1 HIV and AIDS………………………………………………. ................ 24 3.8 Crime……………………………………………………………………… . 26 3.9 Access to basic services………………………………………………… 27 3.9.1 Access to electricity…………………………………………………… . 27 3.9.2 Access to water and sanitation……………………………………… .. 28 3.10 Conclusion……………………………………………………………… . 31
Chapter 4: Economic Review and Outlook ............................................................ 32 4.1 Introduction………………………………………………………….......... 32 4.2 Global economic outlook…………………………………………… ....... 33 4.3 National economic outlook…………………………………………… .... 35 4.4 KZN economic review and outlook………………… ........................... 40 4.4.1 Sector analysis…………………………………………… ................... 41 4.5 Travel and tourism………………………………………………… ......... 44 4.5.1 Introduction…………………………………………………………….. . 44 4.5.2 World travel and tourism………………………………………………. 44

ii
4.5.3 Travel and tourism in SA………………………………………………. 46 4.5.3.1 Visitor exports and investment……………………………………… 49 4.5.4 Travel and tourism in KZN…………………………………………….. 50 4.5.4.1 Contribution to GDP by the tourism industry…………………… ... 51 4.5.4.2 Tourists visiting KZN by country of origin………………………….. 51 4.5.4.3 Most visited destinations in KZN……………………………………. 52 4.6 International trade…………………………………………………. ......... 55 4.6.1 KwaZulu-Natal exports………………………………………………… 56 4.6.2 KwaZulu-Natal imports………………………………………………… 57 4.7 Inflation rate…………………………………………………………… ..... 58 4.8 Conclusion……………………………………………………………….. . 59
Chapter 5: Labour Markets… .................................................................................. 61
5.1 Introduction... .................................................................................... 61 5.2 Employment………………………………… .......................................... 61
5.2.1 Employment by sector… ................................................................ 62 5.3 Unemployment… .............................................................................. 63 5.3.1 Unemployment by gender and age….. ........................................... 64 5.4 Labour force participation rate ........................................................... 65 5.5 Labour absorption rate ...................................................................... 65 5.6 Labour remuneration and productivity…. ........................................... 66
5.7 Conclusion…….. ............................................................................... 67 Chapter 6: Infrastructure Spending in KZN ........................................................... 69 6.1 Introduction……………………………………. ..................................... 69 6.2 Infrastructure spending in KZN…………………………. ..................... 69 6.2.1 Provincial infrastructure overview…………………………………… . 69 6.2.2 Infrastructure delivery management system…………………… ....... 73 6.3 Monitoring and evaluation…………………………………………. ........ 74 6.3.1 Monitoring………………………………. ........................................... 74 6.3.2 Evaluation…. .................................................................................. 75 6.4 Conclusion ........................................................................................ 75 Chapter 7: Provincial Economic Risk Index ......................................................... 76 7.1 Economic risk or conditions variables………………………………… .. 76 7.2 Behaviour of the economic risk or conditions variables……………… 77 7.3 Economic risk or conditions monitor for KZN……………………… ..... 79 7.4 KZN risk index and KZN GDP ........................................................... 80 7.5 Interpretation of the risk monitor……………………………………… ... 81 Chapter 8: The Environment of Small Business in KZN ....................................... 82 8.1 Introduction………………………………………………………………. . 82 8.2 Background and methodology………………………………………… .. 82 8.3 Global overview of the small business…………………………………. 84 8.4 National overview of small business…………………………………… 85 8.5 Small business performance in KZN………………………………….. . 86 8.5.1 Small business turnover……………………………………………….. 86

iii
8.5.2 Employment created by small business…………………………….. . 87 8.5.3 Small business’ access to finance……………………………………. 88 8.5.4 Limitations for small businesses……………………………………… 89 8.6 Conclusion ........................................................................................ 90 Chapter 9: Economic Freedom and Economic Growth ........................................ 92 9.1 Introduction …………………… .......................................................... 92 9.2 Economic freedom conceptualised………………………… ................ 93 9.3 Does economic freedom matter? ...................................................... 94 9.4 Why economic freedom matter ......................................................... 97 9.5 South Africa’s ranking in economic freedom ..................................... 99 9.6 Economic freedom and the economy of SA ...................................... 101 9.7 Conclusion ........................................................................................ 105
Appendix A: List of additional Figures and Tables ................................................ 106
Appendix B: Calculating the Index .......................................................................... 121 References… ............................................................................................................. 122
List of Tables
Table 2.1: World population and selected countries in 2015 and 2050………………... 4 Table 2.2: South African population by province in 1996, 2011 and 2015…………….. 5 Table 2.3: National annual population growth rates (%), 2009 to 2015………………... 6 Table 2.4: Fertility rate, mortality rates, and projected life expectancy in KZN, 2006 – 2016……………………………………………………………………… 9 Table 2.5: Migration trends in KZN, 2006 - 2016…………………………………………. 12 Table 3.1: Income distribution by proportion of households in KZN, 2014.................... 15 Table 3.2: Total numbers of social grant beneficiaries by grant type and
province as at 31 December 2013…………………………………………….. 18 Table 3.3: Percentage growth in numbers of social grant beneficiaries by
grant type and province as at 31 December 2013....................................... 20 Table 3.4: Learner-educator ratio (LER), 2006 and 2011…....………………………..... 21 Table 3.5: KZN levels of education, 2002 and 2012……………………………………... 23 Table 3.6: Projected AIDS orphans, HIV prevalence, infant mortality, and
under 5 mortality, 2013…………………………………………………………. 25 Table 3.7: Crime ratios per 100,000 people in SA, 2009 to 2013……………………… 25 Table 3.8: Crime Figures by crime category in KZN, 2009 to 2013……………………. 26 Table 4.1: World economic estimates and projections, 2013 to 2017………………… 33 Table 4.2: Macro-economic performance and projections, 2012 to 2018……………... 38 Table 4.3: Sector analysis growth rates and projections, 2008 to 2018……………….. 41 Table 4.4: Number of visitors by continent, 2014 and 2015……………………………. 47 Table 4.5: Balance on current account (R billion, seasonally adjusted and
annualised) in 2014 and 2015……………………………………………........ 56 Table 4.6: South African exports by provinces in 2004 and 2014 (R’000)……………. 57 Table 4.7: Percentage share of South African imports by provinces in 2004 and
2014 (R’000)……………………………………………………………….……. 57

iv
Table 5.1: Formal and informal employment by district, 2003 and 2014……………… 62 Table 5.2: Employment by sector in KZN, 2014………………………………………….. 63 Table 5.3: Labour absorption rate (percentages), 2004 to 2014……………………….. 66 Table 6.1: Infrastructure baseline allocation 2014/15 to 2015/16………………………. 70 Table 6.2: Summary of infrastructure payments and estimates by
Category………………………………………………………………………….. 73
Table 7.1: Economic risk or condition variables and their associated sector weights... 76 Table 7.2: Implications of a change in the economic risk or condition variables……... 77 Table 7.3: Behaviour of the economic risk or conditions variables, January
2015 to December 2015………………………………………………………... 77 Table 7.4: Economic risk or conditions monitor, January 2014 to December 2015….. 80 Table 7.5: Average economic risk or conditions monitor for the period 2010 to
2015… …………………………………………………………………………… 80 Table 9.1 Long-term score change, 1995 to 2015………………………………………. 100 Table 9.2: Economic freedom and economic growth, 1995 to 2014…………………… 102 Table 9.3: Regression results estimations using the three measures of economic freedom : GDP Growth…………………………………………………………. 103 Table 9.4: VAR results estimations using the three measures of economic
freedom: GDP Growth…………………………………………………………. 104 List of Figures Figure 2.1: Population distribution by age and gender in 2015…………………………. 7 Figure 2.2: KZN’s population by race in 2014……………………………………………. 8 Figure 3.1: Upper line, lower line and food poverty rates in KZN, 2014………………… 14 Figure 3.2: Human development index and Gini coefficient in KZN, 2004 – 2014……. 17 Figure 3.3: Provincial functional literacy rates (%), 2004 and 2014…………………….. 20 Figure 3.4: Comparison of national and provincial NSC achievements in 2013,
2014 and 2015………………………………………………………………….. 22 Figure 3.5: Share of households with electrical connections by province, 2004 and
2014…………………………………………………………………………….. 28 Figure 3.6: Share of households with piped water at or above RDP level by Province…………………………………………………………………………. 29 Figure 3.7: Share of households with hygienic toilets by province, 2004 and 2014…… 30 Figure 4.1: South African GDP growth rate, 2012:Q2 to 2015:Q3…………………….. 36 Figure 4.2: Percentage share of the national real GDP by province, 2014……………. 40 Figure 4.3: Economic growth rate in KZN, 2012:Q1 to 2017……………………………. 41 Figure 4.4: Number of tourists from ten leading overseas countries in February 2014
and February 2015……………………………………………………………… 46 Figure 4.5: Number of tourists from the ten leading SADC countries in February 2014
and February 2015……………………………………………………………… 48 Figure 4.6 South Africa’s overseas visitors from 1996 to 2013…………………………. 49 Figure 4.7: Purpose of visit in SA by percentages, 2014……………………………….. 50 Figure 4.8: Total tourism spend as a percentage of GDP in KZN from 2007 to 2013.... 51 Figure 4.9: Tourists visiting KZN by country of origin in numbers and percentage,
2013………………………………………………………………………………. 52 Figure 4.10: Percentage most visited destinations in KZN, 2013………………………… 53 Figure 4.11: Reasons for visiting the province of KZN, 2014 (percentages)…………….. 54 Figure 4.12: Purpose of visit to KZN as percentages in 2014……………………………. 55

v
Figure 4.13: Inflation rate (percentages) in SA by province, January 2016…………….. 59 Figure 5.1: Labour force participation rate in SA and KZN, 2014……………………….. 65 Figure 5.2: Labour remuneration and productivity, 2004 to 2014……………………….. 67 Figure 6.1(a): Major infrastructure departments, 2014/2015.............................................. 71 Figure 6.1(b): Major infrastructure departments, 2015/2016………………………………. 72 Figure 6.2: KZN-IDMS enabling environment…………………………………………….. 74 Figure 7.1: Behaviour of the economic risk or conditions variables in index format, January 2010 to January 2016………………………………………………… 78 Figure 7.2: Economic risk or conditions monitor, January 2010 to January 2016…….. 79 Figure 7.3: KZN risk index and KZN GDP, 1998 to 2015………………………………… 81 Figure 8.1: Sample locations……………………………………………………………...... 83 Figure 8.2: Response received from sectors by percentages…………………………… 84 Figure 8.3: Turnover percentage by sectors………………………………………………. 86 Figure 8.4: The percentage of employees employed by sectors……………………….. 87 Figure 8.5: Percentage of employment changes by sectors…………………………….. 88 Figure 8.6: Percentage for financial support for small businesses……………………… 89 Figure 8.7: Percentage indicating limitations for small businesses……………………… 90 Figure 9.1: Number of countries showing improvement or decline in economic
freedom, 2005 to 2014…………………………………………………………. 99 Figure 9.2: South Africa’s economic freedom ranking, 1995 to 2016…………………… 100 Figure 9.3: SA’s economic freedom rating, 1995 to 2014……………………………….. 101
List of Acronyms
AIC Aike Information Criterion AIDS Acquired Immune Deficiency Syndrome ANA Annual National Assessment ARV Antiretroviral BCI Business Confidence Index BER Bureau of Economic Research Bn Billion BRICS Brazil, Russia, India, China and South Africa CCI Consumer Confidence Index CEO Chief Executive Officer DBE Department of Basic Education DBSA Development Bank of Southern Africa DoE Department of Education DoT Department of Transport DoH Department of Health EEA Employment Equity Act EAP Economically Active Population EC Eastern Cape ECB European Central Bank EFW Economic Freedom of the World FDI Foreign Direct Investment FE Fixed Effect FET Further Education and Training

vi
FPE Final Prediction Error FPL Food Poverty Line FS Free State GDP Gross domestic product GDP-R Real Gross Domestic Product GEM Global Entrepreneurship Monitor GP Gauteng Province HDI Human Development Index HIV Human Immunodeficiency Virus HQ Hannan-Quinn IAs Implementing Agents IDC Industrial Development Corporation IDMS Infrastructure Delivery Management System IDZ Industrial Development Zones IEF Index of Economic Freedom IMF International Monetary Fund IPAP Industrial Policy Action Plan IRM Infrastructure Reporting Model KZN KwaZulu-Natal LAR Labour Absorption Rate LBPL Lower Bound Poverty Line LER Learner-Educator Ratio LFPR Labour Force Participation Rate LP Limpopo LSR Learner-School Ratio MDGs Millennium Development Goals MENA Middle East and North Africa MP Mpumalanga MPC Monetary Policy Committee MTEF Medium Term Expenditure Framework MTSF Medium Term Strategic Framework NC Northern Cape NCS National Curriculum Statement NDP National Development Plan NGP New Growth Path NSC National Senior Certificate NW North West OECD Organisation for Economic Co-operation and Development OLS Ordinary Least Square PGDP Provincial Growth and Development Plan PMI Purchasing Managers’ Index PSC Public Service Commission PT Provincial Treasury QE Quantitative Easing QESS Quarterly Employment Statistics Survey QLFS Quarterly Labor Force Survey R&I Rating and Investment Information RDP Reconstruction and Development Programme RE Random Effect RMB/BER Rand Merchant Bank/ Bureau for Economic Research SA South Africa SADC Southern African Development Community SARB South African Reserve Bank SASSA South African Social Security Agency SAT South African Tourism

vii
SC Schwarz Criterion SEZ Special Economic Zones SMMEs Small, Medium and Micro Enterprises SONA State of the Nation Address SPB Strategic Partnerships for Business Stats SA Statistics South Africa TB Tuberculosis UK United Kingdom UN United Nations UBPL Upper Bound Poverty Line UNDP United Nations Development Plan UNICEF United Nations International Children’s Emergency Fund US United States of America VAR Vector Autoregression VFR Visiting Friends and Relatives WC Western Cape WEF World Economic Forum WEO World Economic Outlook WHO World Health Organisation WSJ Wall Street Journal WTTC World Travel and Tourism Council

viii
Executive Summary
_________________________________________________________________________
It is with great pleasure that the Provincial Treasury (PT) of KwaZulu-Natal (KZN) presents
the Socio-Economic Review and Outlook (SERO) for the financial year 2015/16 to all its
relevant stakeholders. The publication provides a detailed analysis of the social and
economic factors that influence the operation of the provincial economy. The analysis
provided herein is envisioned to assist the provincial administration in the formulation of
effective policies, and efficient fiscal resource allocation to government departments and
public entities. The private sector and members of the general public who might be
interested in knowing the state of the economy of KZN also stand to gain useful information
out of the publication which could influence their business and personal decision-making.
Although municipalities are not direct benefactors of the PTs’ budget, they could, utilise the
information presented herein for effective planning towards the elimination of service delivery
backlogs.
Chapter one of the publication is an introduction which gives an overview of the global social
and economic landscape, cascading it down to the national and provincial economies.
Chapter two touches on population dynamics and their broad effect on populaces. The
demographic analysis also begins with a global overview, followed by a discussion around
theoretical frameworks. Africa, as the second most populous continent after Asia, is a focal
point in the analysis.
Population theories should serve as “eye openers” to policy makers because population
growth has the potential to threaten food security. The age profile of the populace also
becomes relevant considering that the strength of the economy lies in the size and the
physical and mental sturdiness of the economically active population to produce goods and
services.
South Africa (SA) is known for being a rainbow nation. Therefore, this publication touches on
population by race. It cannot be disregarded that South Africa remains plagued by the
crippling effects of the Human Immunodeficiency Virus (HIV) and Acquired Immune
Deficiency Syndrome (AIDS) pandemic. In previous years, tuberculosis and pneumonia,
amongst other AIDS-related illnesses, were identified as leading causes of death in KZN.
Therefore, this publication highlights the aspects of fertility, mortality and life expectancy,
specifically in KZN, which has the highest prevalence rates of HIV and AIDS in comparison

ix
to the rest of the country. The chapter concludes by looking at the migration rates. This
becomes more relevant because population size affects the distribution of the provincial
funds according to the provincial Equitable Share; and KZN has been negatively affected by
this. According to the 2011 census, KZN lost its population as a result, which means the
equitable share distribution has been cut.
Chapter three focuses on the social development indicators in KZN. It looks at the gains
made in achieving the former targets set by the United Nations – the Millennium
Development Goals (MGDs) which were targeted to be achieved by the end of 2015. The
organisation has now formally adopted the Sustainable Development Goals (SDGs), which
have a focus on environmental management as a means to attaining sustainable
development. It also acknowledges that some of the MDGs were not fulfilled while some
were met by certain countries. The current priorities that this publication focuses on are:
education, health, poverty, income inequality, human development, government grants and
crime levels.
Aspects of education that were looked at included literacy rates, learner-educator ratio and
the matric results. KZN had a pass rate of 60.7 per cent and was rated second to last out of
the nine provinces in 2015. Matric results are the yardstick that measures learners’
performance at their respective schools. However, these results highlight that KZN’s schools
are steadily deteriorating. Such disturbing performance instigated a decision by the national
minister of education to visit most of these schools.
Poverty levels remain a challenge even though the statistics show a gradual decline. Unlike
the income gap which is still wide at above 0.6 (Gini coefficient), the Human Development
Index (HDI) is also below 0.6. This means that people have a lower standard of living.
However, the South African government has implemented grant policies so the poor can
benefit.
The province’s health is well managed, although HIV and AIDS are still a stigma, but fewer
deaths have been recorded compared to five years ago. Provincial crime levels are
decreasing, with the exception of sexual offences which escalated by 27.9 per cent from the
year 2014 to 2015. In contrast, cash-in-transit robberies decreased by 51 per cent during
the same period. Overall, there is improvement in the delivery of basic services such as
electricity, water and sanitation.
x
Chapter four discusses the global, national and provincial economies. This chapter highlights
the world economic estimates and projections in different countries with a focus on countries
that do business with SA. Emphasis is placed on Brazil, Russia, India, China and South
Africa (BRICS) and Sub Saharan countries as these countries have a unique relationship
with SA. Macro-economic performance and projections of the country are analysed in real
terms. Current sensitive economic issues such as currency depreciation, drought and the
resultant increase in food prices are discussed at length. Importantly, the province’s gross
domestic product (GDP) and sector analysis growth rates are discussed and illustrated
through graphs and tables.
Tourism, as a growing world industry, is also deliberated in this publication. The discussion
includes the number of jobs created by the industry as well as its contribution towards the
world, national and provincial GDP. It also highlights how the number of tourists that visited
SA as well as KZN, during the years of 2014 and 2015 has influenced the GDP. Analyses of
these indicators are of importance because they assist in the allocation of tourism funds.
KZN plays an extremely important role in international trade. This is because of its
strategically located ports of Durban and Richards Bay which are the busiest and largest in
the country. The country’s international trade with the rest of the world is discussed in this
publication along with the inflation rate. It is disturbing that the rate of inflation has breached
the inflation target band of 3 to 6 per cent.
Chapter five shows the direct relationship between the labour market and economic growth.
The purpose of this chapter is to provide information concerning the labour market dynamics
in KZN. The chapter starts by providing an outline of the national labour market, focusing
mainly on employment and unemployment rates. It proceeds by providing an analysis of
both labour force participation and labour absorption rates. The chapter concludes by
discussing the relationship between labour remuneration and productivity.
Chapter six looks at infrastructure expenditure in KZN. The delivery of economic and social
services can only be successfully attained when the country has the appropriate
infrastructure in place. This is why this publication has included an analysis of KZN
infrastructure. Baseline allocations for 2014/15 and 2015/16 financial years are provided and
analysed according to departments where the Department of Transport is the highest
beneficiary. This department has valid reasons to be the highest beneficiary because
transport is the key to promote economic growth. Moreover, research has demonstrated that
countries that invest more in infrastructure are more developed. The second largest
xi
beneficiary is The Department of Education which gets almost 20 per cent of the
infrastructure allocation.
Chapter seven provides insight into the risk factors confronting the province. The provincial
economic risk indices are also weighed using strategic sectors. The variables used to
determine risk are: the interest and inflation rates, oil price, sugar price, rand/dollar
exchange rate, gold price, credit extension and electricity supply. The results suggest that
the economic risk to the province during 2015 was consistent but fairly low. However, in
comparison to previous years, the figure improved during the latter part of 2015.
Chapter eight examines the results of a survey on the environment of Small Businesses in
KZN province. Similarly to previous surveys, this survey attempted to understand the
underlying dynamics in the small business environment, and thereby facilitate the
development and growth of small businesses.
Chapter nine is a scientifically researched chapter, which is based on factors that have an
impact on South Africa’s economic freedom and economic growth. A regression technique
has been conducted on time series data from 1995 to 2014 for economic freedom rating,
and time-series data dating from 1995 to 2014 for both economic freedom and economic
growth. Further analysis is made using Vector Autoregression (VAR) and the results of the
study were found to be significant, suggesting that there is a positive relationship between
economic freedom and economic growth.
Each chapter ends with its own conclusion taking into account the lessons learnt from the
chapter itself. All policy recommendations and outcomes are considered where applicable.

1
Chapter 1: Introduction
The purpose of the Socio-Economic Review and Outlook (SERO) for the 2015/16 financial
year is to unpack KwaZulu-Natal’s (KZN’s) socio-economic status. This publication is
produced in an effort to share relevant information with stakeholders who are both within and
outside the province. This facilitates decision-making in their respective organisations. The
information contained herein can also benefit members of the general public who have an
interest in understanding the dynamics at play within the provincial economy. The SERO
offers a detailed analysis of the socio-economic indicators affecting the quality of life of the
KZN populace; it highlights potential for and constraints to economic growth and
development and further offers policy recommendations.
This publication will look at the domestic economic growth which remains bleak, mainly due
to external as well as internal factors. The decline in the commodity price is cited as one of
the external factors affecting the domestic economy. The decline in the commodity prices
like gold, iron ore, coal and platinum is unfavourable as it reduces revenue for the country.
Counted amongst the factors that contribute to weaker economic growth is the weaker
exchange rate. The constant depreciation of the rand poses a significant risk to the inflation
outlook. It has put upward pressure on the prices of imported goods as they become
expensive and consequently leading to inflation which has recently breached the inflation
target band. This has a negative effect on the population because the response to inflation is
the interest rate hike which reduces disposable income. The inflation outlook is exacerbated
by the recent drought that has engulfed the country and KZN is no exception. In addition, the
difficulties facing both commercial and small scale farmers are a threat to food security.
The recent move by the United States to lift-off its Federal (Fed) rate has put pressure on
emerging markets (EMs) which has had a negative effect on South Africa (SA). The South
African Reserve Bank (SARB) increased its repo rate as well, like any other EMs. The high
interest rate weakens the currency and a weaker currency chases away investors which
decreases foreign direct investment (FDI).
Regarding the social issues, the country faces pressure with regards to education. This has
a negative impact on the government fiscus, given the current state of the economy as it is
expected that the economy will generate less revenue. The implementation of the austerity
measures such as cost cutting measures is not by choice. These include the cut in the

2
compensation of employee’s budget by restricting staff employment in the public sector. This
also exacerbates the level of unemployment causing more people to live below the bread-
line. People with lack of education and skills and mostly youth are highly affected. This in
turn exerts pressure on government to provide improved social services. Lack of social
support continues to be a problem allowing the cycle of dependency on the government to
continue.

3
Chapter 2: Demographic Profile
2.1 Introduction
The population dynamics of a country is of paramount importance in addressing
developmental needs in society. The population growth, ageing population, migration and
urbanisation present both important developmental challenges and opportunities that have
direct and indirect implications for social, economic and environmental development. These
dynamics in the population structure affect macro-economic factors such as consumption,
production, employment, income distribution and poverty. The changes in the population
structure influence universal access to social services such as health, education, sanitation,
water, food and energy. Proper planning for population dynamics will therefore ensure that
the wellbeing of both the current and the future generation is promoted with the motive of
advancing sustainable development.
In analysing the population dynamics it is essential to look at factors such as urbanisation,
migration, fertility, mortality, life expectancy as well as the age structure of the population.
These factors will give an indication with regard to the estimated number of people who are
dependent on government for transfers as well as the number of people who are
economically active. These factors also play an essential role in the efficient allocation of
resources at all spheres of government.
2.2 Global population growth
The world population increased to 7.3 billion people in 2015 from 7.2 billion recorded in
2013, with the majority of the population residing in the less developed countries.
Approximately 60 per cent of the world population reside in Asia with both China and India
comprising of 36.6 per cent. Africa comprises about 16 per cent of the total world population,
trailed by America and Europe at 13.5 per cent and 10.1 per cent, respectively. It is evident
from the information stated in Table 2.1 that developed countries will experience only a small
growth in population (1.25 billion in 2015 to 1.3 billion by 2050). The Population Reference
Bureau (2015) asserts that much of that growth will be immigrants from less developed
countries. This is even indicated by the number of births and deaths per 1 000 which almost
tally at 10 in developed countries, which is far below that of the world population at 20 and 8,
respectively. It is not surprising that the population in Africa is expected to increase by
approximately 1.3 billion people in 2050 which is more than doubled the current population

4
of 1.2 billion, given that the number of births per 1 000 people and the number of deaths per
1 000 people are at 36 and 10, respectively. All the other continents have lower birth and
death rates per 1 000 population.
Table 2.1: World population and selected countries in 2015 and 2050
Source: Population Reference Bureau, 2015
In addition to the growing population, there is also a challenge of the ageing population.
According to the United Nations (2013), the ageing population currently seen in Europe and
Japan raises questions about how the working population will support large numbers of
elderly people. The Population Reference Bureau (2010) indicates that over the past two
decades, China’s population had also been ageing rapidly. This was a result from China’s
“one child” policy and low mortality; hence the proportion of elderly citizens has been
continuing to grow rapidly, increasing stress on an already troubled health care system and
causing China’s economic growth rate to decline. In responding to this phenomenon, China’s
policy was then relaxed in 2014 and the country’s government policy allowed couples to
have two children if they so wished.
2.3 South African population
South Africa (SA) is a diverse nation, comprising of a wide variety of cultures, languages and
religious beliefs. According to Statistics South Africa (Stats SA) (2015), the national
population increased from 47.4 million in 2006 to 55 million in 2015. The Population
Reference Bureau (2015) expects the population of SA to increase by almost 18.2 per cent
from 2015 to 2050 which is far below the percentage increase in the continent of Africa. This
Population (million) % Share of world population Births per 1000 population Deaths per 1000 population
World 7 336 100 20 8 9 804
More Developed 1 254 17.1 11 10 1 310
Less Developed 6 082 82.9 22 7 8 495
Less Developed (Excl. China) 4 702 64.1 24 7 7 120
Africa 1 171 16.0 36 10 2 473
Sub-Saharan Africa 949 12.9 38 11 2 081
Nigeria 182 2.5 39 14 397
South Africa 55 0.7 22 10 65
Northern Africa 222 3.0 29 6 392
America 987 13.5 16 7 1 221
Nothern America 357 4.9 12 8 445
Latin America and the Caribbean 630 8.6 18 6 776
Asia 4 397 59.9 18 7 5 324
China 1 372 18.7 12 7 1 366
India 1 314 17.9 21 7 1 660
Europe 742 10.1 11 11 728
European union 510 7.0 10 10 518
Russia 144 2.0 13 13 134
Oceania 40 0.5 18 7 59
Australia 24 0.3 13 7 34
2015 Population in 2050
(million)
5
is not surprising as the number of births per 1 000 people and deaths per 1 000 people is
almost equal to the world average and far below that of Africa as a continent and that of
Nigeria, as another African country (table 2.1).
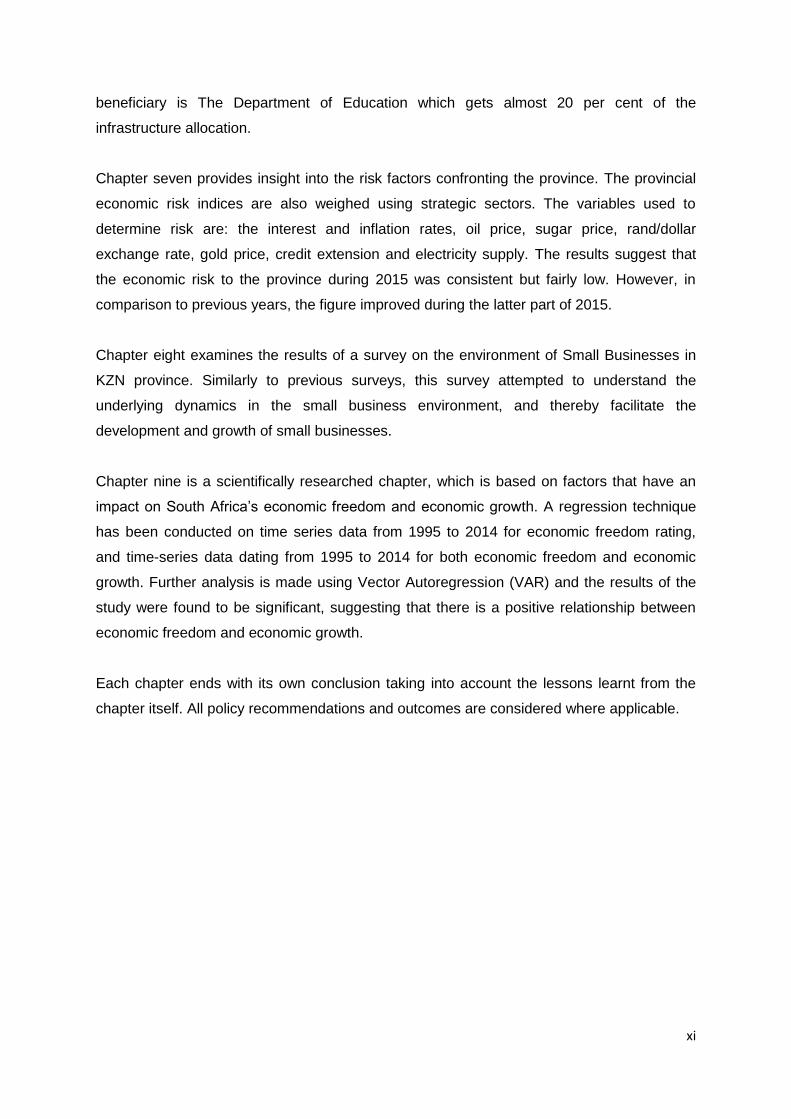
Table 2.2: South African population by province in 2006, 2011 and 2015
Source: Stats SA, 2006, 2011 and 2015
There are nine provinces spread across the country, namely the Eastern Cape (EC), Free
State (FS), Gauteng (GP), KwaZulu-Natal (KZN), Limpopo (LP), Mpumalanga (MP),
Northern Cape (NC), North West (NW) and the Western Cape (WC). As indicated in this
section, the national population has been increasing at a steady pace from 47.4 million in
2006 to 50.6 million in 2011, to 55 million in 2015. This shows an increase of 3.2 million
people over the 5 year period between 2006 and 2011 compared to 4.4 million people for
the period 2011 to 2015. Gauteng and the Western Cape realised a moderate increase in
the proportion of the national population for the years under review. This is a result of the
economic activities taking place in these provinces. However, in absolute values, other
provinces realised an increase in the population. Factors that have caused KZN’s reduced
population emanate from migration, mortality rate (coupled with low fertility rate) and the
impact of HIV and AIDS related diseases.
2.4 Population growth rate
Table 2.3 shows that the South African population growth rate increased between the years
2009 and 2015. The estimated overall growth rate was 1.5 per cent between 2009 and 2011
and increased steadily to 1.6 per cent between 2011 and 2014, which marginally increased
to 1.7 per cent in 2015. It is worth noting that the growth rate for females is lower than that of
their male counterparts.
Population% Share of national
populationPopulation
% Share of national
populationPopulation
% Share of national
population
South Africa 47 390 900 100 50 586 757 100 54 956 920 100
Eastern Cape 6 894 300 14.5 6 829 958 13.5 6 916 185 12.6
Free State 2 958 800 6.2 2 759 644 5.5 2 817 941 5.1
Gauteng 9 526 200 20.1 11 328 203 22.4 13 200 349 24.0
KwaZulu Natal 9 924 000 20.9 10 819 130 21.4 10 919 077 19.9
Limpopo 5 365 400 11.3 5 554 657 11.0 5 726 792 10.4
Mpumalanga 3 508 000 7.4 3 657 181 7.2 4 283 888 7.8
North West 3 374 200 7.1 3 253 390 6.4 3 706 962 6.7
Northern Cape 1 094 500 2.3 1 096 731 2.2 1 185 628 2.2
Western Cape 4 745 500 10.0 5 287 863 10.5 6 200 098 11.3
2006 2011 2015

6
Table 2.3: National annual population growth rate (%), 2009 to 2015
Source: Stats SA, 2015
2.5 KwaZulu-Natal provincial population size
The province of KZN is home to an estimated 10.9 million people which accounts for an
estimated 19.9 per cent of the South African population. The province is the second most
populated after Gauteng which has an estimated 13.2 million people, constituting 24 per cent
of the total national population. This is in contrast to the figures in 2006, which showed that
KZN was home to 9.9 million people followed by Gauteng at 9.5 million people. Migration is
cited as one of the main factors contributing to the decline in the share of the national
population and consequently affecting its equitable share grant allocation.
2.6 Population distribution by age, race and gender
2.6.1 Population by age, gender and dependency ratio
Figure 2.1 shows the population distribution of KZN by age and gender in the year 2015. The
pyramid is narrowly distributed and indicates that the largest population range is between
00-04 and 25-29 which is approximately 64.1 per cent of the total population. The
percentage between the female and the male population is almost the same in this range.
However, it is worth noting that from the age of 30 and above, the percentage of the female
population is greater than that of their male counterparts. This could be the result of factors
such as migration patterns and lifestyle choices by both genders. An estimated 35 per cent
of the population are children between 00 and 14 years and about 37 per cent are
economically active (aged 15-34). Collectively, children and young people account for an
estimated 72 per cent of the total provincial population.
The total provincial dependent population is estimated at 4 318 415, while the economically
active population is estimated at 6 600 660. The implication of these estimates is a high
Period Male Female Total
2009-2010 1.6 1.4 1.5
2010-2011 1.7 1.4 1.5
2011-2012 1.7 1.4 1.6
2012-2013 1.7 1.5 1.6
2013-2014 1.8 1.5 1.6
2014-2015 1.8 1.5 1.7

7
dependency ratio of 65.4 per cent1. It has to be noted that the dependency ratio is not totally
reflective of the situation in the economy, since some of the people in the economically
active population are not actively involved in the labour market.
Figure 2.1: Population distribution by age and gender in 2015
Source: Stats SA, 2015
2.7 Population by race
Figure 2.2 shows KZN’s population by race in 2014. The diagram illustrates that the province
is divided into four racial groups which are African, Indian or Asian, White and Coloured. The
province is largely dominated by Africans, constituting 87.6 per cent of the total KZN
population in 2014, followed by Indians at 6.9 per cent, Whites at 4.1 per cent. Coloureds
constitute the smallest percentage of the total provincial population (1.4 per cent).
1Dependency Ratio = [(Number of people under 15 years) + (Number of people aged 65 and over)/
(Number of people between 15 and 64)] * 100 = (4 318 416/6 600 665)*100= 65.4 percent. The dependency ratio is an age population ratio of those not in the labour force.
6.3
5.9
5.3
4.9
5.0
4.6
3.5
2.9
2.3
1.8
1.5
1.2
1.0
0.7
0.5
0.3
0.2
-6.2
-5.9
-5.3
-5.0
-5.1
-4.7
-3.9
-3.1
-2.6
-2.2
-2.0
-1.7
-1.4
-1.2
-0.8
-0.6
-0.5
8 6 4 2 0 2 4 6 8
00-04
05-09
10-14
15-19
20-24
25-29
30-34
35-39
40-44
45-49
50-54
55-59
60-64
65-69
70-74
75-79
80+ % Female
% Male

8
Figure 2.2: KZN’s population by race in 2014
Source: Global Insight, 2015
2.8 Fertility, mortality, life expectancy and migration
2.8.1 Fertility2
Fertility analysis is of central importance in demographic analysis as births are a vital
component of population growth. The subject of population growth, in turn, is one that is
integral to the realisation of sustainable development.
2The Total Fertility Rate represents the number of children that would be born to a woman if she were
to live to the end of her childbearing years and bear children in accordance with current age-specific
fertility rates (www.worldbank.org).
African, 87.6
White, 4.1Coloured, 1.4
Asian, 6.9

9
In the two decades following the Second World War, high levels of fertility emerged as a
potential constraint on economic development, at least in low-income or developing
countries. Population growth increased in these poor countries from 0.5 per cent per year in
1900, to 1.2 per cent by 1940, and doubled again to 2.5 per cent by 1960. This increase in
the rate of population growth, although due to improvements in health, which reduced
mortality rather than increased fertility, seemed more likely to overwhelm these countries
capacity to accumulate capital than to employ their rapidly growing populations (Schultz,
2007).
Sustainable development represents a commitment to advance people’s well-being, with the
added constraint that this development needs to take place within the ecological limits of the
biosphere (Moran et al., 2008). Sustainable development therefore hinges on two factors:
consumption and population growth. High fertility rates (which lead to high population
growth) burden the economy in terms of consumption. Further to this, the number of children
women bear in their lifetime has a significant impact on the level of economic and social
development that they can achieve. Generally, a woman who has a child or several children
is bound to remain in the home to take care of them, which reduces her chances of seeking
work or education outside of the home. This results in fewer opportunities for personal
development on her part, and therefore perpetuates a cycle of poverty. The fertility rate can
therefore be considered to be an indicator of the general health status of a population, and a
specific indicator of maternal health, as it encompasses health initiatives such as family
planning.
Table 2.4: Fertility, mortality and life expectancy in KZN, 2006 - 2016
Source: Health Systems Trust and Stats SA, 2015
SA EC FS GP KZN LP MP NC NW WC
Total fertility rate
2006-2011 2.7 3.2 2.4 2.0 3.2 2.9 2.7 2.5 2.8 2.3
2011-2016 2.5 3.0 2.3 2.1 2.9 2.9 2.5 2.4 2.6 2.2
Infant mortality rate (deaths
under 1 year per 1 000 live births
2013 ASSA2008 32.5 44.4 39.1 23.8 41.7 26.7 35.6 24.1 29.1 17.7
2014 ASSA2008 31.9 43.6 38.5 23.4 40.9 26.2 35.0 23.5 28.5 17.1
2015 ASSA2008 31.3 42.8 37.8 22.9 40.3 25.8 34.3 22.9 28.0 16.5
Under 5 mortality rate (deaths
under 5 years per 1 000 live
births)
2013 ASSA2008 46.7 62.0 55.4 35.3 60.0 38.2 51.4 34.1 42.6 24.7
2014 ASSA2008 45.7 60.8 54.4 34.4 58.9 37.3 50.4 33.1 41.6 23.9
2015 ASSA2008 44.8 59.6 53.5 33.7 57.8 36.6 49.6 32.2 40.9 23.1
Maternal mortality ratio in
facility (deaths per 1 000 live
births)
2014 DHIS 132.5 148.3 217.8 112.6 124.9 165.2 115.4 254.1 167.1 54.4
Life expectancy at birth
2011-2016 Female 59.2 57.8 54.7 64.3 58.4 60.5 57.2 57.8 56.1 66.0
2011-2016 Male 57.2 55.3 53.0 61.7 57.0 57.3 55.8 57.9 53.5 63.7

10
According to Stats SA (2015), the fertility rate in KZN between 2011 and 2016 is projected to
stand at 2.9 children; a marginal increase from the 2014 projections. This estimate sits
above the national average of 2.5, and is among the highest rates in the country. However, it
is on par with LP, and just below that of the EC province (3.0). These aforementioned
provinces are mainly characterised by their rural landscape, and low levels of human
development. Despite them having fertility rates higher than the national average, these
provinces have seen a decline in fertility rate from their 2006 to 2011 estimates (table 2.4).
2.8.2 Mortality3
Within the realm of public health, mortality statistics are often used as a cornerstone in
formulating health plans and policies to prevent or reduce premature mortality and improve
quality of life.
According to UNICEF (2008), the health risks associated with pregnancy and childbirth are
far greater in developing countries than in developed countries. They are especially
prevalent in the least developed and lowest-income countries, and among less affluent and
marginalized families and communities everywhere. Globally, efforts to reduce deaths
among women from complications related to pregnancy and childbirth have been less
successful than in other areas of human development – with the result that having a child
remains among the most serious health risks for women.
There are several indicators of mortality which are widely used to measure premature
mortality at various stages of life. This section will look specifically into infant, children under
five and maternal mortality.
According to the Organisation for World Overpopulation Awareness4, it has been shown that
providing reproductive health care, lowering the infant mortality rate5 and the maternal
mortality rate6 have had a positive correlation to reducing birth rates. In the case of infant
mortality, when a woman thinks that many of her children will not survive childhood, she
3The mortality rate represents the average number of deaths in a particular area over a specified
period of time. 4 http://www.overpopulation.org/
5 Probability of dying between birth and exactly one year of age (expressed per 1 000 live births).
www.UNICEF.org 6 Refers to the death of a woman while pregnant or within 42 days of termination of pregnancy
(irrespective of the duration and site of the pregnancy), from any cause related to or aggravated by the pregnancy or its management. This excludes accidental or incidental causes (www.who.int).

11
wants to have extra children as insurance that she will have enough children. When death
rates are high, as with cases of HIV and AIDS, where there is no access to adequate health
care, families try to have more children to replace family members who will die, even if the
result is a growing population.
An examination of table 2.4 reveals that mortality rates have been on a general decline in
KZN. Despite that being an achievement that should be applauded, it must also be noted
that these mortality rates are still relatively higher than those of other provinces. KZN has
been projected to have the second to highest infant (40.3 deaths per 1 000 live births and
under five 57.8 deaths per 1 000 live births) mortality rates after the EC. The province is
ranked as having the 4th lowest maternal mortality rates (124.9 deaths per 1 000 live births)
after WC, GP and MP.
2.8.3 Life expectancy
The United Nations Development Plan (UNDP) defines life expectancy at birth as the
number of years a newborn infant could expect to live if prevailing patterns of age-specific
mortality rates at the time of birth stay the same throughout the infant’s life7. The indicator is
an important yardstick for any economy as it gives an indication of its health status. The
implications of low life expectancy include loss of a productive workforce, loss of tax revenue
and a high dependency ratio. Being able to predict how a population will age has
implications for the planning and provision of services. Increases in life expectancy could
translate into large increases in the population. KZN is projected to have a slightly lower life
expectancy (57.0 for males and 58.4 for females) than the national average (57.2 for males
and 59.2 for females).
2.8.4 Migration
An analysis of migration trends indicates the emergence of a new global migration age.
Since the end of the colonial period, international migration has become a truly global
phenomenon. Migration has seen a considerable increase in magnitude. The globalisation of
migration means that all parts of the world are now affected to a greater or lesser degree, by
international migration. There is hardly a village, town or city, much less a country, that is
untouched by international migration, either as a sender or recipient of migrants or, in many
cases, both (Crush and Frayne 1, 2007).
7 http://hdr.undp.org/en/69206

12
Table 2.5 shows that during 2011 and 2016, Gauteng absorbed and is continuing to absorb
the highest number of migrants (543110) out of all other South African provinces. In contrast,
KZN is projected to have a net outflow of people which would reduce the population figures.
A similar estimation is projected in the EC, FS, LP and the NC. Migration is cited as one of
the main factors contributing to the decline in KZN’s share of the national population, and
consequently its share of the equitable share grant.
Table 2.5: Migration trends in KZN, 2006 - 2016
Source: Stats SA, 2015
2.8.5 Conclusion
According to the World Bank (2015), the impact of the population boom in Africa will depend
on how each country in Africa responds today with policies. The policies should be such that
they are able to transform the populace of a country into a healthy, educated and
empowered labour force that contributes to real and sustained economic growth that will
help fight the scourge of poverty.
KZN has one of the highest fertility rates in the country amid high poverty and unemployment
rates. The province therefore has to take a solid stance in the promotion of primary health
care initiatives, particularly directed at women and child health. Construction of health
facilities such as Community Health Centres (CHCs) with mother and child centres should
be prioritised. These should also promote family planning services. This measure will go a
long way in reducing maternal mortality rates.
Out-migrants In-migrants Net migration Out-migrants In-migrants Net migration
Eastern Cape 241 339 173 464 -67 875 243 118 189 975 -53 143
Free State 130 236 118 297 -11 939 135 643 129 461 -6 182
Gauteng 575 626 1 072 834 497 208 626 727 1 169 837 543 110
KwaZulu-Natal 230 039 214 593 -15 446 241 601 234 570 -7 031
Limpopo 296 199 229 192 -67 007 303 151 255 794 -47 357
Mpumalanga 182 725 225 339 42 614 192 972 246 664 53 692
North West 180 800 259 206 78 406 194 181 283 498 89 317
Northern Cape 70 760 68 111 -2 649 77 578 73 573 -4 005
Western Cape 178 605 321 641 143 036 193 605 350 569 156 964
2006 - 2011 2011 - 2016

13
Chapter 3: Development Indicators
3.1 Introduction
Neoclassical economics has traditionally posited that the process of development entails
increases in incomes over time. Higher income levels achieved through positive economic
growth, appropriately discounted for population growth, would constitute higher levels of
development. As many have noted, however, particularly in Africa, the income measure fails
to adequately reflect development. Per capita income, in terms of its levels or changes to it,
does not sufficiently correlate with measures of human development, such as life
expectancy, poverty, and literacy (Fosu, 2007).
The year 2015 marked the end of the Millennium Development Goals (MDGs) era.
According to the World Health Organisation (WHO) (2015), progress towards the MDGs has
been remarkable, for instance: poverty reduction, improvement in educational standards,
and increased access to safe drinking-water all contributed positively to regional
development. Progress on the three health goals and targets has also been considerable.
Globally, the HIV, tuberculosis (TB) and malaria epidemics were “turned around”, child
mortality and maternal mortality decreased greatly (53 per cent and 44 per cent respectively,
since 1990), despite falling short of the MDGs targets. The MDGs have gone a long way to
changing the way the world thinks and talks about itself; shaping the international discourse
and debate on development.
On 25 September 2015, the United Nations (UN) General Assembly adopted the new
development agenda “Transforming our world: the 2030 agenda for sustainable
development”. The new agenda is of unprecedented scope and ambition. The MDGs had a
shortcoming in that even if they were met, they would not automatically shift the world onto a
sustainable development trajectory, partially because the MDGs were weaker on
environmental concerns. While poverty eradication, health as a basic human right,
education, and food security and nutrition remain priorities as was the case with the MDGs,
the Sustainable Development Goals (SDGs) comprise of a broad range of economic, social
and environmental objectives, as well as offering the promise of more peaceful and inclusive
societies.
Sustainable development is underpinned by five main principles, namely: natural, human,
social, manufactured and financial capital. These are the five types of sustainable capital

14
from which human beings derive the goods and services that they need to improve their
quality of life.
3.2 Poverty
Countries where the level of poverty is relatively high tend to also exhibit low levels of human
development (Fosu, 2007). Some people are born into poverty and have difficulty escaping
because they do not enjoy the education, health or nutrition required to accumulate crucial
physical stature and cognitive capacity early in life (Barrett, 2005).
Figure 3.1: Upper line, lower line and food poverty rates in KwaZulu-Natal (KZN), 2014
Source: Global Insight, 2015
Similar to development, poverty is multi-dimensional; dependent on access to adequate
health care, education facilities, and decent living standards (Alkire and Foster, 2007). It is
this multi-faceted nature of poverty that prompted the decision by Stats SA, after extensive
stakeholder engagements, to pilot the poverty lines approach (which is a cost-of-basic-needs
approach) to poverty and deprivation measurement. A poverty line basically establishes a
minimum socially acceptable standard for a predetermined welfare indicator to separate the
poor from the non-poor (Stats SA, 2015). Currently, three poverty lines are being used: the
2004 2005 2006 2007 2008 2009 2010 2011 2012 2013 2014
44.9%41.1% 39.2% 39.1% 41.9% 42.9%
35.1%29.5% 29.6% 29.4% 28.9%
57.5%
54.4%52.6% 52.0%
54.3% 54.8%
48.0%
42.0% 42.0% 41.7% 41.3%
68.3%
65.7%64.4% 63.7%
65.4% 65.5%
59.7%
54.4% 54.2% 53.8% 53.3%
Share below the food poverty line Share below the lower poverty line Share below the upper poverty line

15
food poverty line (FPL)8, upper bound poverty line (UBPL)9 and lower bound poverty line
(LBPL)10.
Poverty levels in KZN have been on a gradual decline over the years. Since 2011, however,
the declining trend appears to have hit a plateau, declining only marginally in the advent of
subdued economic growth following the economic crisis of 2009. The share of people living
below the FPL stood at 28.9 per cent in 2014, while the number of people living below the
LBPL was 41.3 per cent and about 53.3 per cent were living below the UBPL (Figure 3.1).
3.3 Household income and income inequality
“Great and persistent inequality in the midst of plenty is a paradox of our times. Over the last
few decades, innovation has exploded from our increasingly digital age, poverty rates have
declined in every region of the world, and emerging market countries have experienced
unprecedented growth. Global income inequality stands at very high levels, whereby the
richest eight per cent of the world’s population earn half of the world’s total income, while the
remaining 92 per cent of people are left with the other half. Such gaps have left many on the
precipice of steep decline. With insecure livelihoods, volatile markets, and unreliable
services, many people feel increasingly threatened by the prospect of falling under poverty
lines and into poverty traps; as many in fact have” (UNDP, 2013).
Table 3.1: Income distribution by proportion of households in KZN, 2014
Source: Global Insight, 2015
8The FPL is the Rand value below which individuals are unable to purchase or consume enough food
to supply them with minimum per-capita-per-day energy requirement for good health (which is about 2 100 kilocalories). 9 Individuals at the LBPL do not have command over enough resources to consume or purchase both
adequate food and non-food items and are therefore forced to sacrifice food to obtain essential non-food items. 10
Individuals at the UBPL purchase both adequate food and non-food items.
Income category Income level (R'000) African Asian Coloured White
Affluent 1 200+ 0.3% 3.8% 1.3% 9.4%
Upper middle class 600 - 1 200 1.2% 11.4% 4.6% 22.5%
Realised middle class 360 - 600 2.9% 17.1% 10.5% 24.1%
Emerging middle class 96 - 360 21.0% 53.6% 43.7% 39.1%
Low emerging middle income 54 - 96 22.3% 9.3% 15.8% 3.7%
Lower income 0 - 54 52.2% 4.7% 24.1% 1.2%

16
In the year 2014, 44.8 per cent of all KZN households were categorized as being lower
income households, where the annual income was between R0 and R54 000. About 20 per
cent were categorized as being low emerging middle income households earning between
R54 000 and R96 000 per annum, and roughly 25.1 per cent were emerging middle class
(R96 000 – R360 000 per annum). Only a privileged proportion of the province’s households
earned between R360 000 and R600 000 (5.5 per cent) as the realised middle class, and
about 3.4 per cent were upper middle class households earning between R600 000 and
R1.2 million per annum. About 1.2 per cent of the total KZN population was considered to be
affluent, earning in excess of R1.2 million per annum.
The majority of African households (52.2 per cent) were categorized in the lower income
category in 2014, followed by Coloured (24.1 per cent), Asian (4.7 per cent), and lastly White
households (1.2 per cent). In contrast, the majority of Asian (53.6 per cent), Coloured (43.7
per cent) and White households were found to be in the emerging middle class income
category. The White segment of the population enjoyed the highest income in the realised
middle class (24.1 per cent), upper middle class (22.5 per cent) and affluent (9.4 per cent)
income categories (Table 3.1).
Much still needs to be done in addressing the stark reality that an estimated 44.8 per cent of
the households residing in KZN were still categorized as low income earners in 2014. This
observation is further supported by KZN’s Gini coefficient of 0.63 which is the second
highest across all provinces after Gauteng (0.65) (Figure 3.2).
3.4 Human development
African countries have increased their levels of investment in education, health and nutrition;
increased their participation in decision-making; and reduced military spending. However,
the outcomes have been mixed, and there have been large variations in their poverty
performance (Arimah, 2004). Despite the fact that poverty is being addressed in South Africa
(SA), and the province of KZN, the high poverty figures indicate a high level of deprivation,
and this in turn impacts negatively on the level of human development within the province as
more people are unable to access quality services in the health and education sectors for a
better quality of life.

17
Figure 3.2: Human Development Index and Gini coefficient in KZN, 2004-2014
Source: Global Insight, 2015
3.5 Grant beneficiaries
According to the Health Systems Trust (2015), SA is regarded as being food secure;
however, hidden hunger still affects many South Africans. The Trust highlighted that poor
communities do not have easy access to healthy food. Instead, they are more reliant on low-
grade food resulting in both childhood stunting and adult obesity. Although the grant
payment system was employed to try and alleviate nutritional problems, it is not enough. As
it has become the norm in social grant trend analysis, KZN, when compared nationally, had
the highest number of social grant beneficiaries as at 31 December 2015, with a total
number of 3 919 193 beneficiaries. This amount equated to 23.2 per cent of the total number
of grant beneficiaries on a national scale.
The province had the highest share of Old Age Grant beneficiaries (644 069 or 20.4 per
cent), Disability Grant beneficiaries (270 310 or 24.6 per cent), Grant-in-Aid beneficiaries
(45 342 or 34.2 per cent), Care Dependency Grant beneficiaries (37 301 or 28.4 per cent),
Foster Child Grant beneficiaries (102 494 or 24 per cent), and Child Support Grant
beneficiaries (2 819 646 or 23.6 per cent).
2004 2005 2006 2007 2008 2009 2010 2011 2012 2013 2014
0.4
9
0.4
9
0.5
0
0.5
0
0.5
1
0.5
1
0.5
2
0.5
4
0.5
5
0.5
6
0.5
6
0.6
5
0.6
4
0.6
4
0.6
4
0.6
3
0.6
3
0.6
2
0.6
2
0.6
3
0.6
3
0.6
3
Human Development Index (HDI) Gini coefficient

18
Table 3.2: Number and proportion of grant beneficiaries in KZN, as at 31 December
2015
Source: South African Social Security Agency (SASSA), 2015
In terms of growth in beneficiary numbers since 31 December 2014, only the War Veteran’s
Grant, Disability Grant and the Foster Child Grant experienced declines of 29.5 per cent, 7.3
per cent and 9.3 per cent, respectively, while other grant types experienced an increase in
numbers. The most notable increase was in the number of Grant-in-Aid beneficiaries (23.9
per cent) followed by Old Age Grant beneficiaries (2.8 per cent).
3.6 Education
Education is essential for the enhancement of human capital, thus rendering a greater
prospect for people to generate income. One of the Department of Education (DoE) strategic
objectives is to extend a better quality of life to children of school-going age. According to
Calman and Tarr-Whelan (2005)11, investing in early education generates economic
development for communities in the short-term in the form of jobs, the purchase of goods
and services and a more efficient workforce. In the long-term, quality early education builds
an employable and educated workforce. The study provides evidence that early childhood
development gives a good basic education foundation. It is from this backdrop that quality
basic education is one of the fourteen national outcomes as indicated in the medium-term
strategic framework (MTSF) of SA.
According to the National Treasury (2016), the proposed national allocation of basic
education accounted for approximately 17.6 per cent of all the spending over the 2016
medium-term expenditure framework (MTEF). In addition, the province of KZN allocates the
11
Calman L.J. &Tarr-Whelan L. Early childhood education for all. A wise investment. Available online:
http://web.mit.edu/workplacecenter/docs/Full%20Report.pdf.
Number % Number % Number % Number % Number % Number % Number %
South Africa 3 161 784 100.0 261 100.0 1 099 867 100.0 132 620 100.0 131 296 100.0 427 928 100.0 11 956 549 100.0 16 910 305
Eastern Cape 533 752 16.9 40 15.3 182 169 16.6 18 372 13.9 19 903 15.2 96 124 22.5 1 881 109 15.7 2 731 469
Free State 186 220 5.9 4 1.5 73 996 6.7 2 642 2.0 6 744 5.1 31 436 7.3 669 012 5.6 970 054
Gauteng 505 684 16.0 70 26.8 111 999 10.2 4 024 3.0 16 775 12.8 48 839 11.4 1 716 355 14.4 2 403 746
KwaZulu-Natal 644 069 20.4 31 11.9 270 310 24.6 45 342 34.2 37 301 28.4 102 494 24.0 2 819 646 23.6 3 919 193
Limpopo 436 986 13.8 17 6.5 94 997 8.6 26 494 20.0 13 820 10.5 45 715 10.7 1 742 594 14.6 2 360 623
Mpumalanga 231 675 7.3 13 5.0 77 747 7.1 6 741 5.1 9 925 7.6 30 328 7.1 1 050 756 8.8 1 407 185
Northern Cape 80 727 2.6 8 3.1 51 754 4.7 7 317 5.5 5 066 3.9 12 459 2.9 296 601 2.5 453 932
North West 238 295 7.5 8 3.1 82 693 7.5 7 962 6.0 9 172 7.0 32 050 7.5 815 977 6.8 1 186 157
Western Cape 304 376 9.6 70 26.8 154 202 14.0 13 726 10.3 12 590 9.6 28 483 6.7 964 499 8.1 1 477 946
Child Support Grant
Total
Old Age Grant War Veteran's Grant Disability Grant Grant-in-aid Care Dependency Grant Foster Child Grant

19
highest of its budget to education at R45.5 billion for the 2016/17 MTEF. However, the
quality of output does not match the extent of investment. This is due to the fact that a high
percentage of budget allocation both nationally (73.1 per cent) and provincially (74.8 per
cent) is dedicated to the compensation of educators with the remainder being used for
improvements in the school facilities amongst other needs. This is also as a result of
reprioritization of funds from infrastructure to the compensation of educators in the province.
Studies have shown that an environment which is conducive to learning enhances teaching
and learning.
The South African government spends more on education than any other expenditure
category. The similar trend is also applicable to KZN budget allocation to education.
However, more still needs to be done to ensure that performance of learners in the National
Curriculum Statement (NCS) ranks improve which is one of the key indicators of quality with
regard to the performance of the schooling system as a whole.
3.6.1 School and educator: learner ratio
The learner-educator ratio (LER) is a general way to measure workloads and resource
allocations in schools as well as the amount of individual attention a child is likely to receive
from educators. Small classes are often seen as beneficial because they allow educators to
focus more on the needs of the individual learners and thus reduce the amount of class time
and effort devoted to managing disruptions. Evidence by the OECD (2014) suggests a
positive relationship between smaller class and more innovative practices. As classes
become overcrowded, learners may find it difficult to follow the lesson being taught or
engage in innovative discussions and consequently end up not understanding the content of
the lesson. Although 30 learners per class may be regarded as ideal LER, it, however,
depends on age of learners, academic needs of learners, experience, skills as well as
effectiveness of educators in imparting knowledge.
Table 3.3 shows the number of learners, educators and schools across different provinces
for the years 2010 and 2015. A comparison of the years under review indicates that there
had been a marginal increase of 2.7 per cent in the KZN’s number of learners from 2 806
988 in 2010 to 2 881 518 in 2015. However, this is in contrast to the drop in the number of
educators and schools by 5.9 per cent and 0.2 per cent, respectively. This resulted in an
increase in both the LER and the learner-to-school ratio (LSR) from 30.5 to 33.3 and 457 to
470 respectively. It is, therefore, not surprising that the KZN’s LER was the highest out of all

20
provinces at 33.3, while LER in SA was 30.8. It appears that most of the provinces recorded
increasing LSRs with the exception of the Eastern Cape (EC) (from 357 in 2010 to 341 in
2015) although it was the lowest of all the provinces.
Table 3.3: Leaner-educator ratio (LER) and leaner-school ratio (LSR) by districts in 2010 and 2015
Source: Department of Basic Education, 2015
3.6.2 Literacy rate and matric results
According to the World Bank, literacy rate12 means people who are aged 15 and above who
can, with understanding, read and write a short simple statement on their everyday life.
Figure 3.3: Provincial functional literacy rates (%), 2004 and 2014
Global Insight, 2015
12
Literacy rate is calculated by dividing the number of literate individuals aged 15 years and over by
the corresponding age group population and multiplying the result by 100. Available on:
http://data.worldbank.org/indicator/SE.ADT.LITR.ZS
Number of
Learners
Number of
Educators
Number of
SchoolsLER LSR
Number of
Learners
Number of
Educators
Number of
SchoolsLER LSR
South Africa 12 260 099 418 109 25 850 29.3 474 12 814 471 416 093 25 691 30.8 499
Eastern Cape 2 052 386 69 018 5 742 29.7 357 1 953 397 64 256 5 727 30.4 341
Free State 654 704 23 850 1 488 27.5 440 682 704 23 661 1 332 28.9 513
Gauteng 1 974 066 70 340 2 485 28.1 794 2 262 319 79 354 2 780 28.5 814
KwaZulu Natal 2 806 988 91 926 6 147 30.5 457 2 881 518 86 493 6 137 33.3 470
Limpopo 1 706 401 58 194 4 106 29.3 416 1 753 734 55 930 4 045 31.4 434
Mpumalanga 1 036 432 34 575 1 939 30.0 535 1 079 280 35 153 1 862 30.7 580
Northern Cape 269 392 8 846 617 30.5 437 290 139 9 162 581 31.7 499
North West 759 114 26 006 1 701 29.2 446 813 873 25 126 1 544 32.4 527
Western Cape 1 000 616 35 354 1 625 28.3 616 1 097 509 36 958 1 683 29.7 652
2010 2015
SA EC FS GP KZN LP MP NW NC WC
83.2%76.9% 82.1%
91.1%80.4% 77.8% 80.3% 76.9% 76.7%
89.5%
72.8%
64.9%
70.2%
83.9%
69.8%65.0%
66.3%66.4% 63.1%
82.8%
2004 2014

21
Literacy confers human development benefits, such as improved self-confidence, self-
esteem and a feeling of greater self-empowerment. Literacy also has an influence on human
capital and the ability of individuals, social institutions and nations to adapt and change
along with technological and other developments in the global market. People that are
literate tend to have a high social status (since they can obtain employment and earn
income) and economic status (since they can be more productive as they are less costly to
train and gain economic skills).
Figure 3.3 shows the functional literacy rate in SA by provinces in 2004 and 2014. In KZN,
the literacy rate increased from 69.8 per cent in 2004 to 80.4 per cent in 2014. However, it
was still 2.8 percentage points below the national level of 83.2 per cent in 2014. In 2014,
functional literacy was the highest in the Gauteng Province (GP) (91.1 per cent) followed by
the Western Cape (WC) (89.5 per cent). However, the provinces that fell below the literacy
level of 80 per cent included the Eastern Cape (EC), Limpopo Province (LP), Northern Cape
(NC) and the North West (NW).
Table 3.4: KZN levels of education, 2004 and 2014
Source: Global Insight, 2015
Table 3.4 represents the level of education in KZN in 2004 and 2014. It is evident that the
situation regarding the level of education in KZN improved over the 10-year period. In 2014,
8.6 per cent of the people who were 20 years and older had not received any schooling. This
is an improvement from the 2004 analyses of 15.9 per cent.
The percentage of the population 20 years and older that completed secondary education
(matric only) in KZN increased from 22.1 per cent in 2004 to 29.8 per cent in 2014. This is
admirable since it is reflective of more people in the economically active population (EAP)
having received a basic education and as such can be more productive members of society.
It is encouraging to see that there had been an increase in the proportion of people who
African White Coloured Asian Total African White Coloured Asian Total
No schooling 18.9 0.9 3.2 4.6 15.9 9.9 0.3 1.6 2.4 8.6
Grade 0-6 20.2 1.0 7.0 8.1 17.3 14.7 1.2 4.2 7.5 13.1
Grade 7-11 37.6 21.5 49.1 38.4 36.7 40.9 18.1 39.2 32.9 38.9
Certificate/ diploma without matric 0.6 3.4 1.8 1.1 0.9 0.4 1.7 0.7 0.6 0.5
Matric only 18.4 41.0 29.8 36.4 22.1 27.3 43.7 38.2 43.1 29.8
Higher 4.3 32.2 9.1 11.5 7.2 6.8 34.9 16.0 13.5 9.2
Total 100 100 100 100 100 100 100 100 100 100
2004 2014

22
attained higher qualifications in 2014 (9.2 per cent) than in 2004 (7.2 per cent), although it
was not a significant increase.
3.6.3 National senior certificate achievements
Figure 3.4 compares the national senior certificate (NSC) achievements in SA and among
provinces from 2013 to 2015. Learner achievement rates in KZN had decreased from 77.4
per cent in 2013 to 60.7 per cent in 2015. This is, however, disappointing as KZN had the
largest number of matriculants out of all the provinces (162 658 representing 25.2 per cent)
of the matriculants who wrote the NSC exam in 2015.
Figure 3.4: Comparison of national and provincial NSC achievements in 2013, 2014
and 2015
Source: Department of Basic Education, NSC Examination, 2015
All the other provinces recorded a decrease in their matric performance except the WC
which realised marginal increase from 82.2 per cent in 2014 to 84.7 per cent in 2015.
Nationally, the average performance dropped by 5.1 per cent from 75.8 per cent in 2014 to
70.7 per cent.
SA EC FS GP KZN LP MP NW NC WC
70.7%56.8%
81.6% 84.2%
60.7% 65.9%78.6% 81.5%
69.4%84.7%
75.8%
65.4%
82.8% 84.7%
69.7% 72.9%79.0% 84.6% 76.4%
82.2%
78.2%
64.9%
87.4% 87.0%
77.4% 71.8%77.6%
87.2%
74.5%
85.1%
2013 2014 2015
23
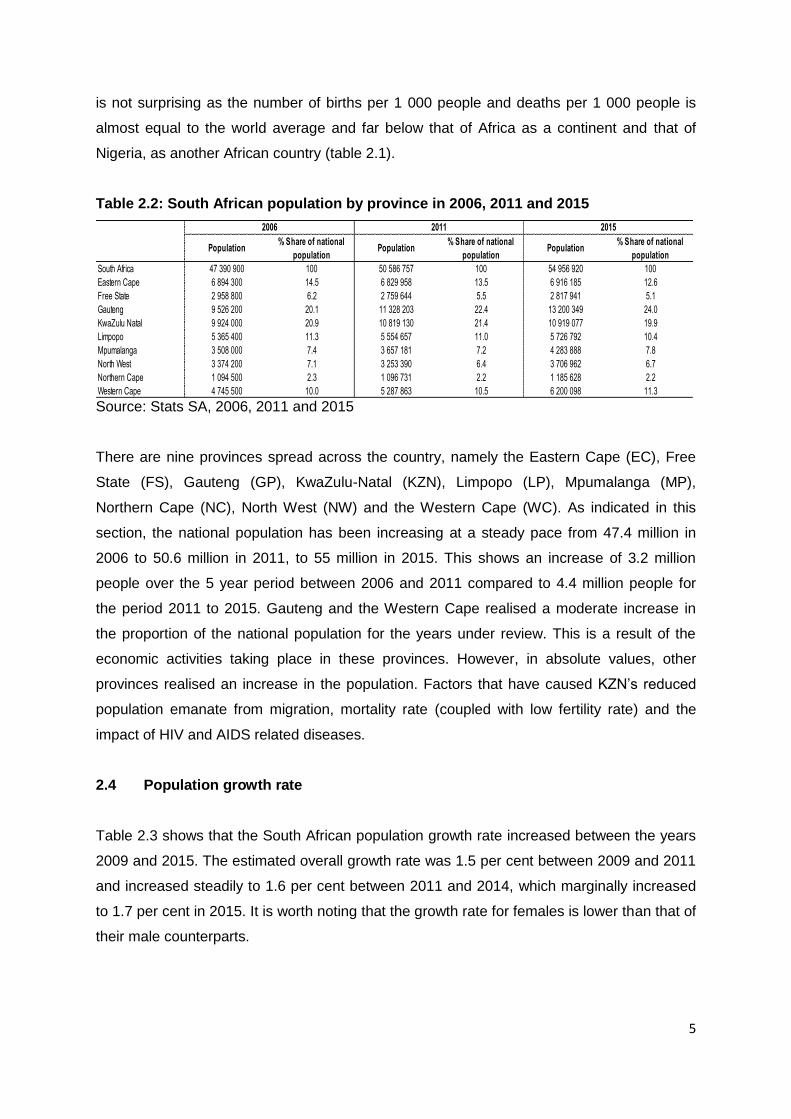
According to the Department of Basic Education (DBE) (2015), the decrease in the overall
performance may be attributed to the higher enrolment rate causing severe pressure on the
education resources, a higher standard of question papers, and the introduction of a policy
that tracks the progressed learners13. However, the DBE acknowledged that further
investigation will be undertaken to establish the exact output status for the education system.
Table 3.5: Percentage of learners who achieved 40 per cent and above in selected subjects in 2014 and 2015
Source: Department of Basic Education, NSC examination, 2015
Table 3.5 compares the percentage of learners who achieved 40 per cent and above in
selected subjects from 2014 to 2015. It is worrying that the learners’ performances in the
gateway subjects of Mathematics, Physical Science, Accounting and Economics showed a
negative trend. These subjects showed a decrease in the province of KZN from 24.3 per
cent to 20.0 per cent (Mathematics), from 31.2 per cent to 30.2 per cent (Physical Science),
from 39.2 per cent to 29.3 per cent (Accounting) and from 40.8 per cent to 33.0 per cent for
Economics between 2014 and 2015. Nationally, there was also a decrease in the
performance of learners, except for Economics which showed marginal increase in the pass
rate from 38.8 per cent in 2014 to 39.1 per cent in 2015. Several international studies and
the Annual National Assessment (ANA) results indicate that the problem with mathematics
has its roots in primary school, where many learners fail to gain basic mathematical skills14.
The implication of this is that there is a low number of students who are able to get entrance
to degree qualifications which require mathematics. These degrees, which include among
13
Progressed learners are the learners who failed Grade 11 twice and were promoted to Grade 12 without meeting the passing criteria. 14
http://www.amesa.org.za/AMESA2014/Proceedings/papers/Plenary%20Papers/3.%20Anne%20Maclean.pdf
Accounting Economics MathematicsPhysical
ScienceAccounting Economics Mathematics
Physical
Science
South Africa 44.3 38.8 35.1 36.9 36.2 39.1 31.9 36.1
Eastern Cape 37.3 28.5 25.1 26.5 29.2 26.6 21.8 24.8
Free State 56.3 30.8 44.5 42.8 47.4 32.5 46.0 43.3
Gauteng 51.4 47.1 50.7 45.9 49.6 52.5 49.8 46.1
KwaZulu Natal 39.2 40.8 24.3 31.2 29.3 33.0 20.0 30.2
Limpopo 41.9 34.6 35.8 38.9 29.4 39.5 32.4 35.4
Mpumalanga 41.9 24.6 35.6 34.4 38.4 38.3 36.0 38.5
North West 50.9 55.3 40.3 36.8 33.2 48.2 37.3 35.9
Northern Cape 40.7 42.6 42.4 36.7 34.1 42.1 36.1 33.1
Western Cape 54.3 51.4 56.6 51.5 51.0 52.9 57.3 54.7
2014 2015

24
others, are engineering, accounting, economics and the teaching profession in these
subjects. In addition, most of the students who achieved a Bachelor pass15 cannot gain
entrance to a university and therefore cannot necessarily address the skills challenge facing
the economy. However, these learners can still be absorbed by the further education and
training (FET) colleges whereby they will gain technical skills which will enable them to
qualify as artisans in various fields. This in turn will enable them to work in a skilled position,
thereby aiding the economy.
3.7 Access to health
Arguably, health, reflected by mortality of infants and adults, affects economic performance
through human capital investments, physical capital accumulation, population growth,
productivity and female labour force participation (Strittmatter and Sunde, 2013). However, it
must also be considered that the direction of causality may be two-directional. People in
poor countries tend to have less access to health services than those in better-off countries,
and within countries, the poor have less access to health services. Although a lack of
financial resources or information can create barriers to accessing services, the causal
relationship between access to health services and poverty also runs in the other direction.
When health care is needed but is delayed or not obtained, people’s health worsens, which
in turn leads to loss of income and higher health care costs, both of which contribute to
poverty (Peters et al., 2008). Either way, there is consensus in theory that access to health
care is an important facet of both human and economic development through reduced
mortality.
3.7.1 HIV and AIDS
Despite the strides that have been made in reducing mortality rates in KZN, the province
seems to be grappling with obstinate Human Immunodeficiency Virus (HIV) and Acquired
Immuno Deficiency Syndrome (AIDS) prevalence rates and high numbers of AIDS orphans.
The good news is that the province is seeing less HIV and AIDS related deaths, which
means that those living with the disease(s) are living longer. This implies that government is
succeeding in its endeavor to improve the quality of life of the infected. However, efforts
need to be intensified in preventing new HIV and AIDS infections within the province.
15
A matric learner may achieve a Bachelor’s pass; however, this does not automatically guarantee
university entrance because University entrance requirements stipulate new students to have achieved certain points at matric level.

25
Table 3.6: HIV and AIDS prevalence, 2013 - 2015
Source: Health Systems Trust, 2015
On a positive note, about 52.6 per cent of HIV positive people have been placed on anti-
retroviral (ARV) treatment in the province. This rate is second only to the WC at 59.1 per
cent. This means that more people may survive longer or be able to work longer and as such
continue to contribute to the economy.
Table 3.7: HIV and AIDS prevalence, 2015
Source: Health Systems Trust, 2015
SA EC FS GP KZN LP MP NW NC WC
AIDS orphans (maternal
orphans <18 years)
2013 ASSA2008 1 351 144 181 485 90 299 276 490 413 145 102 965 138 031 112 088 13 673 52 397
2014 ASSA2008 1 379 917 184 941 90 480 281 811 416 079 107 574 139 608 112 733 14 563 55 869
2015 ASSA2008 1 400 267 187 391 90 079 284 602 416 265 111 858 140 340 112 672 15 365 58 905
AIDS deaths (%)
2013 ASSA2008 31.9 27.0 31.8 35.5 38.1 25.6 36.6 36.2 20.9 16.7
2014 ASSA2008 32.4 27.7 31.8 35.5 38.6 26.4 37.0 36.3 21.5 17.2
2015 ASSA2008 32.8 28.5 32.0 35.4 39.0 27.2 37.4 36.4 21.9 17.6
HIV prevalence (%) (total
population)
2013 ASSA2008 11.2 11.0 12.1 11.2 15.2 7.3 12.8 12.5 6.9 5.2
2013 ASSA2008 female 13.0 13.1 13.8 12.6 17.3 9.6 15.7 13.9 8.4 6.5
2013 ASSA2008 male 9.3 8.6 10.4 9.8 12.9 4.6 9.6 11.1 5.3 3.9
2014 ASSA2008 11.3 11.2 12.2 11.1 15.3 7.4 12.9 12.5 6.9 5.2
2014 ASSA2008 female 13.1 13.4 13.9 12.6 17.5 9.8 15.9 14.0 8.5 6.5
2014 ASSA2008 male 9.3 8.7 10.4 9.7 12.9 4.7 9.7 11.1 5.3 3.9
2015 ASSA2008 11.3 11.4 12.3 11.1 15.4 7.5 13.0 12.6 7.0 5.2
2015 ASSA2008 female 13.2 13.6 14.0 12.5 17.6 9.9 16.1 14.1 8.5 6.5
2015 ASSA2008 male 9.3 8.9 10.4 9.6 13.0 4.8 9.7 11.0 5.3 3.9
SA EC FS GP KZN LP MP NW NC WC
Total population 54 956 900 6 916 200 2 817 900 13 200 300 10 919 100 5 726 800 4 283 900 3 707 000 1 185 600 6 200 100
Estimated number of HIV+ people 6 595 232 800 854 390 152 1 601 435 1 807 354 518 006 596 331 488 949 86 336 305 815
HIV+ people (%) 12.0 11.6 13.8 12.1 16.6 9.0 13.9 13.2 7.3 4.9
Number of people on ARVs (April 2015) 3 103 902 320 062 168 877 730 576 951 462 232 506 284 984 191 612 43 054 180 769
Percentage of HIV+ people on ARVs 47.1 40.0 43.3 45.6 52.6 44.9 47.8 39.2 49.9 59.1

26
3.8 Crime
Table 3.8: Crime levels (per 100 000) and growth rates in KZN, 2012 to 2015
Source: SAPS, 2015
Table 3.8 reflects crime categories prevalent in KZN between the years 2012 and 2015.
Theft, drug-related crime and burglary at residential premises were the leading crime
Comparison 2013-2014 with
2014-2015
Case
Difference% Change
Murder 3 623 3 616 3 810 194 5.4%
Total Sexual Offences 10 964 9 889 9 079 -810 -8.2%
Attempted murder 3 827 3 835 3 918 83 2.2%
Assault with the intent to inflict grievous bodily harm 28 832 28 982 29 201 219 0.8%
Common assault 30 087 26 307 24 011 -2 296 -8.7%
Common robbery 8 188 8 397 7 857 -540 -6.4%
Robbery with aggravating circumstances 19 923 20 957 20 881 -76 -0.4%
Total Contact Crimes ( Crimes Against The Person) 105 444 101 983 98 757 -3 226 -3.2%
Arson 946 896 854 -42 -4.7%
Malicious damage to property 15 670 14 954 14 605 -349 -2.3%
Total Contact-Related Crimes 16 616 15 850 15 459 -391 -2.5%
Burglary at non-residential premises 11 954 11 194 11 032 -162 -1.4%
Burglary at residential premises 45 404 43 969 43 274 -695 -1.6%
Theft of motor vehicle and motorcycle 9 738 8 674 8 404 -270 -3.1%
Theft out of or from motor vehicle 18 014 18 614 18 148 -466 -2.5%
Stock-theft 6 018 5 754 5 956 202 3.5%
Total Property-Related Crimes 91 128 88 205 86 814 -1 391 -1.6%
Illegal possession of firearms and ammunition 4 444 4 586 4 081 -505 -11.0%
Drug-related crime 42 167 45 950 47 377 1 427 3.1%
Driving under the influence of alcohol or drugs 15 109 12 595 11 702 -893 -7.1%
Sexual offences detected as result of police action 1 188 1 765 2 258 493 27.9%
Total Crime Detected As A Result Of Police Action 62 908 64 896 65 418 522 0.8%
All theft not mentioned elsewhere 50 361 49 846 47 622 -2 224 -4.5%
Commercial crime 14 226 12 431 11 227 -1 204 -9.7%
Shoplifting 13 014 13 378 14 118 740 5.5%
Total Other Serious Crimes 77 601 75 655 72 967 -2 688 -3.6%
Carjacking 2 413 2 262 2 190 -72 -3.2%
Truck hijacking 82 46 63 17 37.0%
Robbery of cash in transit 20 37 18 -19 -51.4%
Bank robbery 2 0 0 0 0 Cases
Robbery at residential premises 4 119 4 099 3 958 -141 -3.4%
Robbery at non-residential premises 2 347 2 696 2 750 54 2.0%
Total Subcategories Of Aggravated Robbery 8 983 9 140 8 979 -161 -1.8%
CONTACT-RELATED CRIMES
PROPERTY-RELATED CRIMES
CRIME DETECTED AS A RESULT OF POLICE ACTION
OTHER SERIOUS CRIMES
SUBCATEGORIES OF AGGRAVATED ROBBERY
April 2012
to
March 2013
April 2013
to
March 2014
April 2014
to
March 2015
CRIME CATEGORY
CONTACT CRIMES ( CRIMES AGAINST THE PERSON)

27
categories in the province during the year under review. It is a well-known behavioral fact
that drug addicts often steal in order to fund their drug habits. It could, therefore, be
expected that with an increase in drug-related crime, burglary and theft would also be a
prominent feature on the crime list.
According to the United Nations Office on Drugs and Crime (2014), drug use continues to
exert a significant toll on the economy, with valuable human lives and productive years of
many persons being lost. It is therefore highly disconcerting that drug-related crime has
escalated to the levels that it has in over such a short period of time within the province. The
abuse of drugs poses a threat to the social health of communities as it has the potential to
cause an increase in the incidences of violent crime, and predisposes communities to the
health risks of HIV and hepatitis C where the use of injectable drugs, specifically the sharing
of needles, is concerned.
Data related to crime statistics for the main towns and cities in KZN is presented in the
Appendix (Table A3.2 to A3.10).
3.9 Access to basic services
3.9.1 Access to electricity
While the availability of electricity by itself is not a panacea for the economic and social
problems facing Africa, the supply of electricity is nevertheless believed to be a necessary
requirement for Africa’s economic and social development (Wolde-Rufael, 2006). It is a
major input to industry for production, and output can be severely stunted without it, which
would adversely affect economic growth. A more noble reason for ensuring the supply of
safe and reliable electricity, however, is that of promoting social development in the
communities through infrastructure delivery; and household infrastructure in particular. With
access to electricity, households can benefit through lighting; this will enable children of
school-going age to complete homework, care-givers can complete household chores such
as cooking so the family can be fed properly. Electricity also serves as a safety mechanism
through government installing street lights to promote visibility.

28
Figure 3.5: Share of households with electrical connections by province, 2004 and
2014
Source: Global Insight, 2015
Following a tumultuous couple of years for SA businesses that were without access to
reliable electricity provision, Eskom made a drastic turnaround in 2015 after the appointment
of a new CEO, which dramatically reduced the number of incidents of load shedding in the
country. This about turn reinstated the confidence of business owners and ordinary citizens
in the sustainability of the power utility.
KZN was trailing behind most other provinces in the country in respect of connecting
households with electricity in 2014. Even so, 79.8 per cent of KZN households now have
electricity.
3.9.2 Access to water and sanitation
According to the United Nations (UN)16, water is at the core of sustainable development and
is critical for socio-economic development, healthy ecosystems and for human survival. The
resource is vital for reducing the global burden of disease and improving the health, welfare
and productivity of the population.
Water is a critical input to the agricultural sector as the industry is crippled without it. It is an
essential input for the survival of both livestock and crop, and by implication for food security
16
http://www.un.org/waterforlifedecade/water_and_sustainable_development.shtml
EC FS GP KZN LP MP NC NW WC
53.8%
82.8% 83.5%
66.3%72.4% 75.9% 79.6% 80.4%
90.0%
78.0%
91.9%84.3%
79.8%
89.5%88.1%
88.9% 85.0%
95.6%
2014
2004

29
for human beings and animals. The UN estimates that by 2050, world agriculture will need to
produce 60 per cent more food globally, and 100 per cent more in developing countries to
sustain the growing population. It is further estimated that industry, energy, and households
together account for 30 per cent of water demand. More developed countries have a much
larger proportion of freshwater withdrawals for industry than less developed countries, where
agriculture dominates.
Figure 3.6: Share of households with piped water at or above RDP level by province,
2004 and 2014
Source: Global Insight, 2015
The high rate of urbanisation further exacerbates the problem for municipalities, who require
water for sanitation and to prevent or eradicate slums. Environmental sustainability for
communities therefore hinges mainly on the provision of housing, water and sanitation
services. Sanitation17 is the safe removal of human waste as well as the maintenance of
hygienic conditions.
The relationship between adequate sanitation and health is well documented. Slum dwellers
have higher rates of child malnourishment; prevalence of diarrhoea, malnutrition and hunger;
prevalence of HIV and AIDS; and, as a result, lower life expectancy (Isunju et al., 2011). The
Global Burden of Disease study undertaken by the World Bank indicates that 15 per cent of
all deaths in children below 5 years of age in low- and middle-income countries are directly
17
http://www.who.int/topics/sanitation/en/ [Accessed 30 January 2015]
EC FS GP KZN LP MP NC NW WC
51.4%
91.5% 94.7%
67.5%59.9%
79.0%
92.1%
74.9%
95.9%
63.7%
93.8%94.1%
71.6%
62.1%
77.8%
88.7%
75.9%
96.0%
2014
2004

30
attributable to diarrhoeal disease. Close to 90 per cent of the diarrhoeal disease burden is
caused by unsafe sanitation, water and hygiene. KZN had one of the lowest proportions of
households with access to piped water and hygienic toilets in the country, at 71.6 per cent
and 70.9 per cent respectively.
Figure 3.7: Share of households with hygienic toilets by province, 2004 and 2014
Source: Global Insight, 2015
The relationship between adequate sanitation and health is well documented. Slum dwellers
have higher rates of child malnourishment; prevalence of diarrhoea, malnutrition and hunger;
prevalence of HIV and AIDS; and, as a result, lower life expectancy (Isunju et al., 2011). The
Global Burden of Disease study undertaken by the World Bank indicates that 15 per cent of
all deaths in children below 5 years of age in low- and middle-income countries are directly
attributable to diarrhoeal disease. Close to 90 per cent of the diarrhoeal disease burden is
caused by unsafe sanitation, water and hygiene. KZN had one of the lowest proportions of
households with access to piped water and hygienic toilets in the country, at 71.6 per cent
and 70.9 per cent respectively.
EC FS GP KZN LP MP NC NW WC
37.8%
64.8%
87.1%
56.7%
27.6%
52.7%
78.0%
49.9%
89.3%
68.2%
81.6%
89.3%
70.9%
47.0%
60.4%
80.8%
64.7%
91.1%
2014
2004

31
3.10 Conclusion
Poverty in KZN is on a steady decline due to a concerted effort by the government to secure
the futures of the people who are struggling to meet their basic needs. The most dented type
of poverty is that which is associated with food shortage, although the quality of food
afforded by the poor is not sufficient to meet the nutritional needs of children. Income
distribution remains a pertinent problem within the province as much of the wealth remains in
the hands of the White and Asian segments of the population. Most African households earn
a low income, which is barely enough to sustain their existence. This is turn leads to high
deprivation levels.

32
Chapter 4: Economic Review and Outlook
4.1 Introduction
Despite the cheaper oil price, the global economy is projected to continue to perform below
expectations in 2016. However, economies in developed countries are improving,
particularly in the United States (US). Emerging markets (Ems) growth prospects, especially
for commodity-producing countries, remain constrained amid persistent capital outflows.
The South African economic growth outlook remains weak and expected to grow below one
per cent in 2016. The sectors that are showing negative growth in South Africa (SA) include
agriculture, mining, electricity and water, and to a lesser extent manufacturing. The future of
mining is of great concern, because if this sector is negatively affected by a recession it
would lead to a loss of thousands of jobs.
Financial markets have become volatile and currencies of EMs have become weak and they
fluctuate widely. However, the rand’s depreciation has been in excess of most of its EM
peers. The prices of commodities that SA exports to the rest of the world have dropped
significantly and continue to be low. Rising food prices, resulting from severe drought that is
being experienced in the country, higher than expected inflation and rising interest rates are
some of the major challenges facing SA. Furthermore, as indicated by the President in his
2016 State of the Nation Address (SONA), the country's economy is also affected by
domestic factors such as the electricity constraints and industrial relations which are
sometimes unstable.
Taking into account both the global and national economic performance, this chapter
provides the economic review and outlook of the province of KwaZulu-Natal (KZN). This
chapter begins with an economic review and outlook from global, national and provincial
levels. This is then followed by the brief review of the sectorial analysis and tourism in KZN.
The chapter concludes by providing an analysis of international trade and inflation rate at
both provincial and national levels.

33
4.2 Global economic outlook
According to the World Bank (2016), global economic growth continued to perform lower
than projections in 2015, thereby slowing down to an estimated 3.1 per cent compared to the
3.4 per cent posted in 2014. Though the International Monetary Fund (IMF) (2016) expects
this rate to improve slightly to 3.4 per cent in 2016, it is still below the 3.6 per cent projected
in October 2015 (Table 4.1). The Goldman Sachs18 report, however, projects a slightly
higher growth rate of 3.5 per cent in 2016. The slight upward trend in the global economy is
mainly due to the moderate recovery in advanced economies, activity stabilisation among
major commodity exporters, weaker capital flows and subdued global trade (World Bank,
2016).
Growth rate projections for developed nations are expected to improve slightly to 2.1 per
cent in 2016, up from the 1.9 per cent estimated in 2015. The higher than anticipated
recovery in the advanced economies in 2015 was to a large extent driven by stronger
domestic demand as well as the improvement in credit conditions. This rate is projected to
remain the same in 2017, partly in light of the effect on the US dollar appreciation and the
impact on Japan of slowing trade in Asia (World Bank, 2016).
Table 4.1: World economic estimates and projections, 2013 to 2017
Source: IMF and World Bank, 2016
Stimulated by the robust household demand, economic performances between 2014 and
2016 in the US remain on a solid growth trajectory (OECD, 2015a). The report cites firm
employment gains as continuing to curtail unemployment rate. Domestic demand is further
expected to continue to be sustained by supportive financial conditions and the boost to
18
See 2016 Global Outlook by Goldman Sachs, available from http://www.goldmansachs.com, accessed on 12/01/2016.
2013 2014 2015 2016 2017 2016 2017
World 3.2 3.4 3.1 3.4 3.6 2.9 3.1
Advanced Economies 1.1 1.8 1.9 2.1 2.1 2.1 2.1
United States of America 1.5 2.4 2.5 2.6 2.6 2.7 2.4
Euro Area -0.3 0.9 1.5 1.7 1.7 1.7 1.7
Japan 1.6 0 0.6 1.0 0.3 1.3 0.9
Emerging Market and Developing
Economies 5.0 4.6 4.0 4.3 4.7 4.8 5.3
Russia 1.3 0.6 -3.7 -1 1.0 -0.7 1.3
China 7.7 7.3 6.9 6.3 6.0 6.7 6.5
India 6.9 7.3 7.3 7.5 7.5 7.8 7.9
Brazil 2.9 0.1 -3.8 -3.5 0.0 -2.5 1.4
Sub-Saharan Africa 5.4 5.0 3.5 4.0 4.7 4.2 4.7
South Africa 2.2 1.5 1.3 0.7 1.8 1.4 1.6
ProjectionsEstimates
IMF World Bank

34
household purchasing power from low energy prices and the stronger dollar (also see IMF,
2016).
Subsequent to this solid consumption spending by households, the US economy is
estimated to have grown moderately at 2.5 per cent in 2015. This is the highest annual
growth rate the US economy has recorded since the 2009 global economic meltdown. Real
disposable income for households in the US has been improved by employment gains,
declining oil prices and moderate wage growth (World Bank, 2016).
Economic growth in the eurozone continues on a positive trajectory, reflecting an estimated
growth rate of 1.5 per cent in 2015. This may be, largely due to the improved performance in
Germany and Spain. Gross domestic product (GDP) is expected to record a stable
improvement of 1.7 per cent in 2016 and 2017 respectively. The strengthening growth rate in
the euro area is partly induced by the on-going regional recovery. The continued quantitative
easing (QE)19 by the European Central Bank (ECB) and the Bank of Japan are expected to
boost global liquidity (World Bank, 2016).
Japan’s economy is expected to recover marginally to 1 per cent in 2016, which is slightly up
from 0.6 per cent in 2015. The OECD (2015b) cites rising real wages supporting consumer
spending as the key driver of this slight improvement. The IMF (2016) further cites fiscal
support, lower oil prices and accommodative financial conditions as also key drivers in the
Japanese economic drivers. However, according the World Bank (2015), skill shortages are
increasing, leading to a rise in prospects of a steady acceleration in wage growth.
Economic performance in EMs is expected to pick up modestly to 4 per cent and 4.3 per
cent in 2015 and 2016, respectively, the lowest since the 2009 financial crisis. India
continues to make a robust contribution, which is expected to remain the same at 7.5 per
cent in 2016 and 2017. This is a slight increase from 7.3 per cent in 2015.
According to the OECD (2015d), public investment in India has picked up with faster
clearance of key projects; better infrastructure and greater ease of doing business. This is
further enhanced by the expanded fiscal policy, which is assumed to remain supportive of
the economic performance. The report further cites public investment in the energy,
19
Quantitative easing is a process of creating money by buying securities, such as government bonds, from banks, with electronic cash that did not exist before. This also includes the monetary policy tool of lowering interest rates by a central bank. QE is expected to stimulate the economy by encouraging banks to make more loans. See the Economist, "What is QE?", accessed on 15/01/2016, available from http://www.economist.com/blogs/economist-explains/2015/03/economist-explains-5.

35
transport, sanitation, housing and social protection sectors as critical in raising living
standards for all.
The Russian economy contracted by an estimated -3.7 per cent in 2015 and is anticipated to
continue on a negative trajectory at an estimated -1 per cent in 2016. The economy of
Russia is, however, projected to stabilise and record 1 per cent economic growth rate in
2017. Falling oil prices, international sanctions and capital flight have reduced investment,
domestic consumption and imports (OECD, 2016c & World Bank, 2016).
Economic growth in China continues to slow down. The World Bank (2016) maintains that
economic expansion in this country was derailed by an acute slow-down in demand from
other Asian countries, including China as well as through sluggish private consumption.
Growth rate in China was estimated to be 6.9 per cent in 2015. This is projected to plunge to
6.3 per cent in 2016 before sliding further to 6 per cent in 2017.
In Brazil, the estimated contraction in the economy of -3.8 per cent which the country
suffered in 2015 is expected to persist at an estimated -3.5 per cent in 2016 before realising
zero economic growth rate in 2017. This is due to a needed fiscal adjustment, tighter
monetary policy to contain inflation and a lack of investor confidence related to political
uncertainty. Subsequent to confidence emanating from an improvement in macroeconomic
policies, a positive growth trajectory is thus expected to unfold in 201720
The Sub Saharan Africa region is projected to accelerate to 4 per cent in 2016. This will be
an improvement from the 3.5 per cent estimated in 2015. The World Bank (2016) cites a
combination of external and domestic factors as responsible for the slowdown. External
factors, according to the World Bank include: lower commodity prices, a slowdown in major
trading partners, and tightening borrowing conditions. Domestic factors, on the other hand,
include political instability and conflict, and electricity shortages.
4.3 National economic outlook
The South African economy grew by 1.3 per cent in the first quarter of 2015, easing from an
upwardly revised 4.1 per cent expansion in the final quarter of 2014. Then, the country's
20
See Brazil - Economic forecast summary (November 2015), accessed on the 10 January 2016, available at http://www.oecd.org/eco/outlook/brazil-economic-forecast-summary.
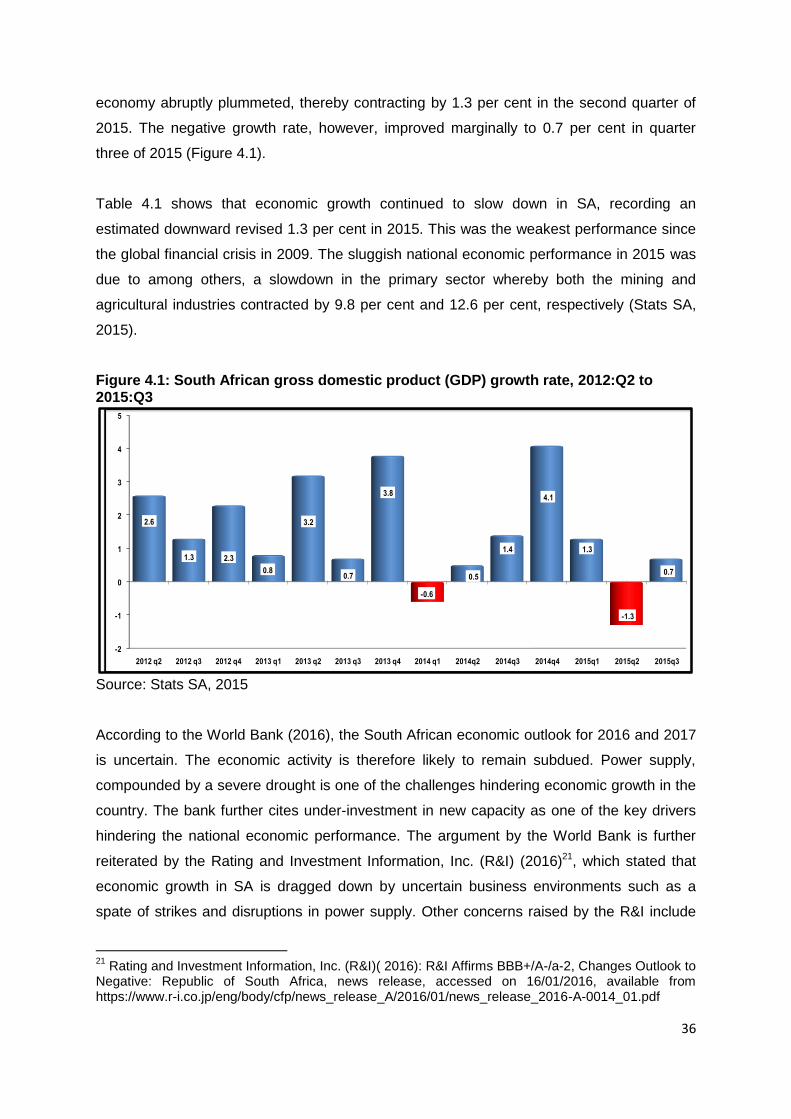
36
economy abruptly plummeted, thereby contracting by 1.3 per cent in the second quarter of
2015. The negative growth rate, however, improved marginally to 0.7 per cent in quarter
three of 2015 (Figure 4.1).
Table 4.1 shows that economic growth continued to slow down in SA, recording an
estimated downward revised 1.3 per cent in 2015. This was the weakest performance since
the global financial crisis in 2009. The sluggish national economic performance in 2015 was
due to among others, a slowdown in the primary sector whereby both the mining and
agricultural industries contracted by 9.8 per cent and 12.6 per cent, respectively (Stats SA,
2015).
Figure 4.1: South African gross domestic product (GDP) growth rate, 2012:Q2 to 2015:Q3
-2
-1
0
1
2
3
4
5
2012 q2 2012 q3 2012 q4 2013 q1 2013 q2 2013 q3 2013 q4 2014 q1 2014q2 2014q3 2014q4 2015q1 2015q2 2015q3
2.6
1.3 2.3
0.8
3.2
0.7
3.8
-0.6
0.5
1.4
4.1
1.3
-1.3
0.7
Source: Stats SA, 2015
According to the World Bank (2016), the South African economic outlook for 2016 and 2017
is uncertain. The economic activity is therefore likely to remain subdued. Power supply,
compounded by a severe drought is one of the challenges hindering economic growth in the
country. The bank further cites under-investment in new capacity as one of the key drivers
hindering the national economic performance. The argument by the World Bank is further
reiterated by the Rating and Investment Information, Inc. (R&I) (2016)21, which stated that
economic growth in SA is dragged down by uncertain business environments such as a
spate of strikes and disruptions in power supply. Other concerns raised by the R&I include
21
Rating and Investment Information, Inc. (R&I)( 2016): R&I Affirms BBB+/A-/a-2, Changes Outlook to Negative: Republic of South Africa, news release, accessed on 16/01/2016, available from https://www.r-i.co.jp/eng/body/cfp/news_release_A/2016/01/news_release_2016-A-0014_01.pdf

37
inflationary pressure from weaker demand, resulting from the lacklustre economy, electricity
rate hikes, an increase in food prices caused by severe drought and effects from the weaker
rand.
R&I has since affirmed the national sovereign credit rating at BBB+22, however, the rating
agency revised the outlook from stable to negative. The latest rating by R&I follows similar
trends by other agencies, namely Moody's, Fitch and Standard & Poor (S&P), who in the last
quarter of 2015, rated SA at Baa2 and BBB-, respectively. With the exception of Fitch, the
remaining three agencies have reflected a negative outlook for the country, implying that
GDP growth might be lower than expected. The weak economic growth rate and the
possibility that the country might not deliver on its commitment to fiscal prudence were cited
as the main concerns resulting to the downgrade.
Following both the global and domestic economic trends, the South African Reserve Bank
(SARB, 2015) has also revised its national economic growth forecast for 2015 and 2016 to
1.4 per cent and 1.5 per cent, respectively. This was one of the several cuts since the
beginning of 2015. It must be noted that inherently, lower economic growth implies among
others, lower revenue collection, higher personal income taxes, rising inflation and interest
rates, lower real personal disposable income, pressure on consumer spending, alarming
currency depreciation, limited export demand (particularly for manufactured goods) and
fewer employment prospects. The projected subdued growth rate in the national economic
performance is further confirmed by seasonally adjusted Barclays Purchasing Managers’
Index (PMI)23, which stood at 45.5 index points in December 2015. The average of 45.6
index points for the fourth quarter was 4.5 index points below the level recorded in the third
quarter. This suggests that production growth is likely to come under renewed pressure in
the future.
The SARB composite business cycle indicator24as well as both low business and consumer
confidence also followed a downward trend in 2015, confirming the subdued economic
22
According to http://multiple-markets.com, BBB+ is the lower medium investment grade, weighting 6.5 of the possible 10 points rating related to AAA or prime and maximum safety ranking. The risk of owning a security increases for a country if it is ranked more towards the tail end of the rating scale. along on the downward trend of the rating scale (accessed on 20/01/2016).
23 Barclays PMIis an indicator of activity in the manufacturing sector. The index provides leading
indications of business conditions in the sector,where a level below 50 suggests a contraction in activity while one above 50 points suggests expansion (www.ber.ac.za)(accessed on the 20/1/2016). 24
The composite business cycle leading indicator shows the direction of economic activity in the next
6 to 9 months (http://www.resbank.co.za) (accessed on 20/01/2016).

38
outlook. This sluggish economic performance is clearly not boding well with the
unemployment rate which is estimated at 25.4 per cent as at the end of the third quarter of
2015 (Stats SA, 2015b).
Table 4.2 reflects on some key national macro-economic indicators. The expenditure on
consumption by households is one of the key components of GDP. The households’
expenditure on consumption constitutes approximately 61 per cent of the total South African
GDP. However, Consumer Confidence Index (CCI), as compiled by the Bureau for
Economic Research (BER)25 dropped significantly in the last quarter of 2015. A CCI this low,
signals a major slowdown in retail sales.
According to the SARB (2015), consumption expenditure by households continues to be
hindered inter-alia by declining growth in disposable income and employment growth
opportunities. The expenditure on consumption by households increased to 2.9 per cent in
2013. It, however, plummeted to 1.4 per cent in 2014 and 2015 and expected to drop further
to 0.7 per cent in 2016, before moderating to 1.7 per cent in 2017, respectively. Also
constrained by limited resources, growth rate in government spending is estimated to have
dropped from 1.9 per cent in 2014 to 0.4 per cent in 2015. However, it is projected to rise
moderately to 1.2 per cent in 2016 before contracting by -0.2 per cent in 2017.
Table 4.2: Macro-economic performance and projections, 2012 to 2018
Source: National Treasury, 2015
25
See FNB/BER Consumer Confidence Index, Issued by First National Bank, accessed on 20 January 2015 and available from www.ber.ac.za.
Estimate
2012 2013 2014 2015 2016 2017 2018
Final consumption expenditure by households: Total (PCE) 3.4 2.9 1.4 1.4 0.7 1.6 2.2
Final consumption expenditure by government 3.4 3.3 1.9 0.4 1.2 -0.2 0.2
Gross fixed capital formation (Investment) 3.6 7.6 -0.4 1.1 0.3 1.4 2.7
Gross domestic expenditure (GDE) 3.9 1.4 0.6 0.1 1.1 1.7 2.2
Exports of goods and services 0.1 4.6 2.6 9.5 3 4.6 5.2
Imports of goods and services 6.0 1.8 -0.5 5.3 3.7 4.5 4.9
Real GDP growth 2.2 2.2 1.5 1.3 0.9 1.7 2.4
GDP Inflation 5.5 6.0 5.8 4.0 6.7 6.3 6.0
Gross domestic product at current prices (R billion) 3 263.5 3 534.3 3 796.5 3 998.9 4 305.9 4 657.5 5 052.8
Headline CPI inflation (Dec 2012 = 100) 5.7 5.8 6.1 4.6 6.8 6.3 5.9
Current account balance (% of GDP) -5.0 -5.8 -5.4 -4.1 -4.0 -3.9 -3.9
Actual Forcasts

39
Growth in real gross fixed capital formation (investment) by both government and the private
sector contracted to -0.4 per cent in 2014. It is, however, estimated to have accelerated
moderately to 1.1 per cent in 2015, and projected to gain momentum over the 2016/17
Medium Term Expenditure Framework (MTEF) and reach 3.2 per cent in 2017.
Currency depreciation
According to Bloomberg26, the rand has depreciated by 25 per cent against the US dollar in
2015. The loss was further extended to a record low in January 2016 when global markets
tumbled out of fear from China’s growth outlook and the devaluation of its currency (yaun)27.
Data from the SARB28 shows that the rand has depreciated by close to 45 per cent against
the US dollar between January 2015 and January 2016.
Since the beginning of the year, the rand was among the most severely affected currencies
among EMs. As clearly pointed out by Bloomberg, currency analysts across the world have
already developed pessimistic views about the rand. This is due to structural weaknesses of
the national economy and the decline in commodity prices. The pessimistic view is also
exacerbated by the risk that the country might lose its investment-grade rating and thus
weakening the rand further down to the lowest level. Speculation is rife that the rand could
fall to around R20 per dollar should SA’s credit rating be cut to junk status29.
The ailing rand is one of the contributing factors that prompted the SARB to raise the interest
rate twice in 2015 by 25 basis points at a time, a trend that is expected to persist in 2016.
Though this may look good in supporting the sharply weaker rand, it could further damage
the economy, particularly the prices of imported goods. This situation is further compounded
by the worst drought ever experienced in the country over the past two decades, which is
driving food prices higher and is likely to push the agricultural sector into recession.
Collectively, the rand depreciation, the effect of the drought on food prices and electricity
tariff increases are excessively outweighing the benefits of the current lower oil prices.
26
See http://www.bloomberg.com/news/articles/2016-01-20 (accessed on 20/01/2016). 27
It must be noted that China is one of SA's largest trading partners.
28See the SARB, available from: https://www.resbank.co.za/Research/Rates/Pages/Selected
Historical Exchange And Interest Rates (accessed on 21/01/2016). 29
Junk status refers to bonds with Standard & Poor's ratings below BBB or Moody's ratings below Baa. These bonds are called "junk" because of their higher default risk (http://mockingbird.creighton.edu/english/fajardo/teaching/SRP435/junkbond) (accessed on 21/01/2016).

40
Ideally, weaker currency is expected to benefit a country in terms of export earning,
unfortunately, this is not the case in SA, particularly given the persisting economic structural
constraints.
4.4 KZN economic review and outlook
KZN is one of the key provinces in the national economy in terms of GDP contribution. The
estimated real GDP generated by the province amounted to approximately R478.27 billion in
2014, making KZN the second largest contributor to the economy of the country at 16 per
cent, after GP with 35.2 per cent. This was, however, slightly above 13.8 per cent recorded
in the WC province (Figure 4.2).
Figure 4.2: Percentage share of the national real GDP by province, 2014
Western Cape, 13.8
Eastern Cape, 7.6
Northern Cape, 2.2
Free State, 5.3
KwaZulu-Natal, 16.0
North-West, 5.6
Gauteng, 35.2
Mpumalanga, 7.2
Limpopo, 7.2
Source: Global insight, 2015
Given the economic activities that take place within eThekwini30, it is therefore not surprising
that the total provincial output is predominantly concentrated in the metro at 57.2 per cent.
This is followed by uMgungundlovu with 10.2 per cent and uThungulu with 8 per cent. The
least contributing districts are Umzinyathi, Harry Gwala and Umkhanyakude at the estimated
rate of 1.6 per cent, 2 per cent and 2.5 per cent, respectively (Figure A4.1 in the appendix).
30
KZN province has one metro (eThekwini) ten district municipalities which are: Ugu, uMgungundlovu, Uthukela, Umzinyathi, Amajuba, Zululand, Umkhanyakude, uThungulu and iLembe
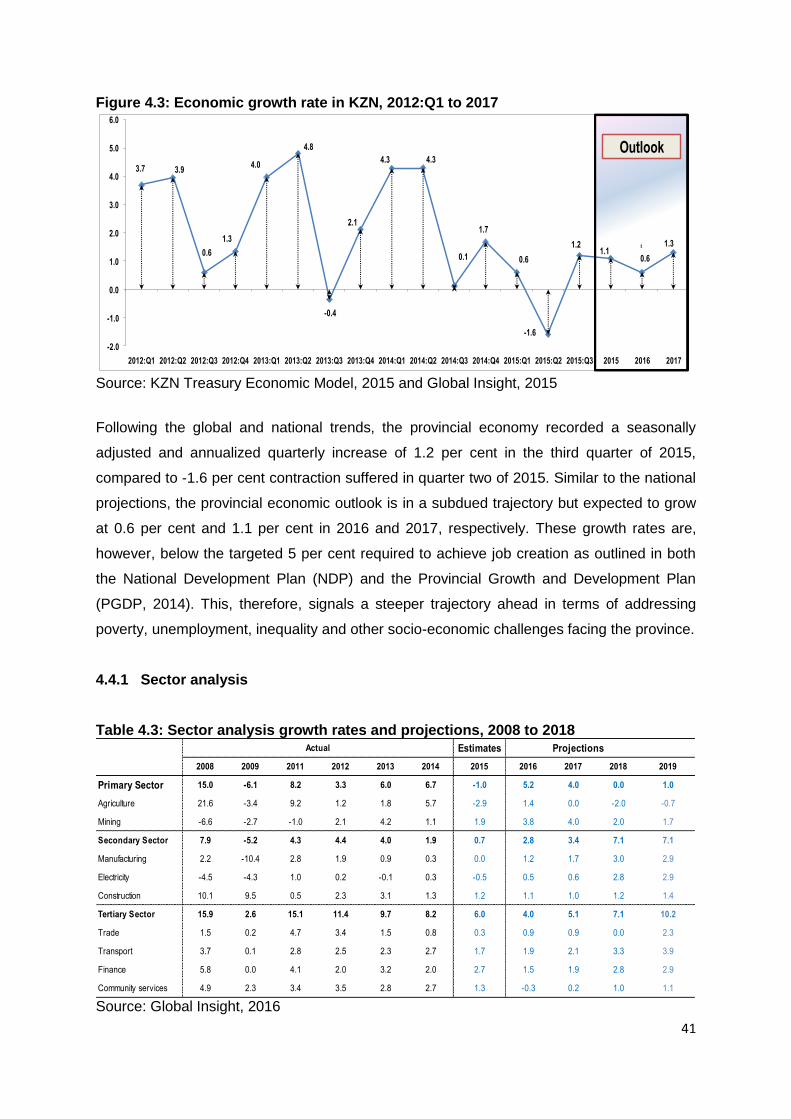
41
Figure 4.3: Economic growth rate in KZN, 2012:Q1 to 2017
3.7 3.9
0.6
1.3
4.0
4.8
-0.4
2.1
4.3 4.3
0.1
1.7
0.6
-1.6
1.21.1
0.6
1.3
-2.0
-1.0
0.0
1.0
2.0
3.0
4.0
5.0
6.0
2012:Q1 2012:Q2 2012:Q3 2012:Q4 2013:Q1 2013:Q2 2013:Q3 2013:Q4 2014:Q1 2014:Q2 2014:Q3 2014:Q4 2015:Q1 2015:Q2 2015:Q3 2015 2016 2017
Outlook
Source: KZN Treasury Economic Model, 2015 and Global Insight, 2015
Following the global and national trends, the provincial economy recorded a seasonally
adjusted and annualized quarterly increase of 1.2 per cent in the third quarter of 2015,
compared to -1.6 per cent contraction suffered in quarter two of 2015. Similar to the national
projections, the provincial economic outlook is in a subdued trajectory but expected to grow
at 0.6 per cent and 1.1 per cent in 2016 and 2017, respectively. These growth rates are,
however, below the targeted 5 per cent required to achieve job creation as outlined in both
the National Development Plan (NDP) and the Provincial Growth and Development Plan
(PGDP, 2014). This, therefore, signals a steeper trajectory ahead in terms of addressing
poverty, unemployment, inequality and other socio-economic challenges facing the province.
4.4.1 Sector analysis
Table 4.3: Sector analysis growth rates and projections, 2008 to 2018
Source: Global Insight, 2016
Estimates Projections
2008 2009 2011 2012 2013 2014 2015 2016 2017 2018 2019
Primary Sector 15.0 -6.1 8.2 3.3 6.0 6.7 -1.0 5.2 4.0 0.0 1.0
Agriculture 21.6 -3.4 9.2 1.2 1.8 5.7 -2.9 1.4 0.0 -2.0 -0.7
Mining -6.6 -2.7 -1.0 2.1 4.2 1.1 1.9 3.8 4.0 2.0 1.7
Secondary Sector 7.9 -5.2 4.3 4.4 4.0 1.9 0.7 2.8 3.4 7.1 7.1
Manufacturing 2.2 -10.4 2.8 1.9 0.9 0.3 0.0 1.2 1.7 3.0 2.9
Electricity -4.5 -4.3 1.0 0.2 -0.1 0.3 -0.5 0.5 0.6 2.8 2.9
Construction 10.1 9.5 0.5 2.3 3.1 1.3 1.2 1.1 1.0 1.2 1.4
Tertiary Sector 15.9 2.6 15.1 11.4 9.7 8.2 6.0 4.0 5.1 7.1 10.2
Trade 1.5 0.2 4.7 3.4 1.5 0.8 0.3 0.9 0.9 0.0 2.3
Transport 3.7 0.1 2.8 2.5 2.3 2.7 1.7 1.9 2.1 3.3 3.9
Finance 5.8 0.0 4.1 2.0 3.2 2.0 2.7 1.5 1.9 2.8 2.9
Community services 4.9 2.3 3.4 3.5 2.8 2.7 1.3 -0.3 0.2 1.0 1.1
Actual

42
As observed in table A4.1 in the appendices, the average annual growth rate improved
moderately to an estimated 3.6 per cent between 2004 and 2014. However, the sector’s
contribution to the provincial real GDP declined slightly from 6.9 per cent in 2004 to 6.8 per
cent in 2014 (Table A4.2, in appendices). Although agriculture reported moderate annual
average growth rate of 3.6 per cent over the ten year period under review, it lost momentum
and contracted by 2.9 per cent in 2015. This is after the industry posted a robust growth rate
of 5.7 per cent in 2014 (Table A4.1 in appendices & Table 4.3). The moderate performance
by agriculture in 2014 was due to the vigorous growth rate in Fishing & operations of farms
(9.5 per cent), Forestry & lodging at 5.9 per cent and Agriculture & hunting at 5.5 per cent
(Table A4.4 in appendices).
Though rain started to fall towards the end of 2015 and January 2016, the effects of the
disturbing drought that has crippled the national economy will be felt for years, particularly by
the agricultural sector. It is within this backdrop that comprehensive and sustainable
programme by government and other stakeholders is urgently required to assist in re-
establishing food production.
Mining (-0.4 per cent) contributed towards poor performance by the primary sector between
2004 and 2014 (Table A4.1 in appendices). The decline in the mining sector was to a large
extent due to a sharp contraction in the mining of metal ores (-2.9 per cent), coupled by
another negative growth rate of 0.9 per cent in the mining of gold & uranium ore (Table A4.4
in appendices); this trend persisted in 2013.
With the exception of agriculture and mining industries, a substantial proportion of
manufacturing production (56.8 per cent) comes from eThekwini (Table A4.6 in appendices).
Manufacturing grew moderately at 2.1 per cent in the province between 2004 and 2014
(Table A4.1, in appendices). Manufacturing exhibited the fastest growth in iLembe and
uMgungundlovu District Municipalities, each growing at an estimated annual average rate of
3 per cent over the same period. The phenomenal growth of the sub-sector in iLembe was
mainly due to high growth in textile, clothing & leather goods (5.5 per cent) as well as fuel,
petroleum, chemical & rubber products (3.9 per cent) (Table A4.3, in appendices).
The electricity sector grew by a meagre annual average of 0.7 per cent in the province
between 2004 and 2014 (Table A4.1). This growth rate is estimated to have contracted by
0.5 per cent in 2015 but projected to gain momentum and increase slightly to 0.5 per cent
and 0.6 per cent in 2016 and 2017, respectively (Table 4.3).

43
Construction was the fastest growing sector (6.4 per cent) over the period 2004 to 2014
(Table A4.3, in appendices), but recorded a mere 1.3 per cent growth rate in 2014 and 1.2
per cent in 2015. This is further projected to drop slightly to 1.1 per cent in 2016, before
dropping marginally to 1 per cent in 2017 (Table 4.3). A moderate growth rate in construction
in 2014 was recorded across the districts in the province; however, eThekwini (1.1 per cent)
and Ugu (0.7 per cent) posted performances below the average provincial growth rate (Table
A4.4, in appendices).
Trade showed a positive average growth of 3.5 per cent over the ten year period under
review. This solid trend was, however, abruptly interrupted and plummeted to 0.8 per cent
and 0.3 per cent in 2014 and 2015, respectively. The robust performance in trade over the
ten year period was enhanced by the sales & repairs of motor vehicles at 5 per cent (table
A4.3, in appendices).
Finance (5.1 per cent) was the second fastest growing sector in the province between 2004
and 2014, but slowed down to 2 per cent in 2014 and 2.7 per cent in 2015 (Table 4.3).
Umkhanyakude and iLembe posted the highest growth rates of 7.7 per cent and 6.9 per cent
respectively in this industry when compared with other districts. The robust performance in
finance was by far supported by growth in the finance and insurance subsector at 6 per cent
(Table A4.4, in appendices).
Transport (3.5 per cent) is one of the fastest growing industries in the province over the 2004
to 2014 period (Table A4.3, in appendices). However, it slowed down moderately to 1.7 per
cent in 2015 but is projected to rise to 1.9 per cent in 2016 and 2.1 per cent in 2017 (Table
A4.3, in appendices). Air transport & transporting activities (7.2 per cent) led the growth
trajectory, followed by post & telecommunication at 6.3 per cent (Table A4.3, in appendices).
Government exhibited moderate growth of 3.5 per cent over the period under review, but this
slowed to 2.7 per cent in 2014 and 1.3 per cent in 2015 (Table A4.1, in appendices & Table
4.3). In terms of sector contribution towards provincial real GDP, government makes up an
estimated 22.1 per cent. It is also important to note that at the national level a larger
proportion of GDP-R and employment in KZN emanates from the tertiary sector. This sector
had grown between 2004 and 2014, while the primary and secondary sectors’ contributions
to GDP and employment had been declining31. This indicates that the economy is
31
See Section 8.2.1 (Chapter 8) of this publication for details in employment by sector.

44
converging towards being a tertiary sector-based economy, which is skilled-labour intensive,
but a large majority of South African population lack skills.
4.5 Travel and tourism
4.5.1 Introduction
Travel and tourism has become the most important sector in most countries in the world.
This is confirmed by the statistics displayed by the World Travel and Tourism Council
(WTTC) (2015) indicating that in 2014, travel and tourism contributed quite a sizable
percentage towards the world’s GDP. This contribution constitutes direct and indirect
activities towards tourism. The indirect contribution includes investment spending such as
construction of new hotels and purchases of aircrafts and other assets that are promoting
tourism; government spending that assist in promoting travel and tourism is also considered
as an indirect contributor towards tourism32. Direct contribution includes marketing and
promotions, security services, administration and other services that supplement tourism.
This sub-section deals with an overview of world, national and KZN tourism.
4.5.2 World travel and tourism
According to the WTTC (2015), the direct contribution by the industry towards the global
GDP was estimated at 3.1 per cent in 2014 and this is projected to rise to 3.7 per cent in
2015. The publication also projects that in ten years from now the industry is expected to
grow its contribution towards the global GDP to 3.9 per cent per annum.
The sectors that are seen as main contributors to the growth of travel and tourism in the
world are hotel occupancy and international air passenger demand which grew by around
5.4 per cent in 2013. Business and leisure spending also grew by 3.4 per cent in 2014. The
leading global countries that benefited the most from travel and tourism in the world are
South Asia, led by India and the Middle East when it comes to total contribution to GDP.
Europe follows South Asia where it out-performed North America in 2014. Africa tourism
picked up in 2014 compared to 2013 even though the continent was stigmatised by the
outbreak of the Ebola virus, with the exception of Kenya where terrorism discouraged travel
to the country.
32
Indirect contribution in tourism is when the tourism industry promotes domestic purchases where sectors that deal with tourism purchase food, fuel and catering services by airlines and other domestic services, such as administration and other services that supplement tourism.

45
The predictions or outlook of 2015 is also considered to be higher than that of 2014 as far as
global growth is concerned. It is projected that global GDP growth of 2015 will be higher than
that of 2014 at 3.7 per cent. Domestic travel and tourism spending growth is expected to rise
from 3.1 per cent in 2014 to 3.7 per cent in 2015. Similarly, global travel and tourism
investment is expected to rise from 3.9 per cent in 2014 to 4.8 in 2015. The world visitor
export growth is expected to slow down in 2015. This is in line with the slowdown of world
trade growth which is influenced by weaker travel fares that emanate from cheaper oil
prices. This will affect most of the oil exporting countries that are faced with the problem of
weaker currencies compared to a stronger dollar. On the other hand, lower oil prices benefit
the oil importing countries that have already reaped these benefits through lower inflation
which is boosting the real disposable income which in turn increases purchasing power. The
ten year outlook for travel and tourism investment is projected to be lower than that of 4.1
per cent in 2014 and predicted to be even lower (3.8 per cent) in 2015.
The travel industry has also a significant role to play when it comes to global employment. In
2014 it generated an estimated 105 408 000 direct jobs (3.6 per cent) of total employment
and it is projected to grow by 2 per cent in 2015 to an estimated 107 519 000. The forecast
goes further and looks at 2025 (ten year period) and estimates that the number of direct jobs
that would be generated will be 130 694 000. This is an increase of 2 per cent per annum.
When looking at the total employment where direct and indirect jobs were created in the
industry, the picture changes tremendously. A total number of 276 845 000 jobs were
generated in 2014 (9.4 per cent of total employment). The ten year forecast (2025) of jobs
that will be supported by this industry is estimated at 356 911 000 jobs which is a growth of
2.3 per cent per annum (WTTC 2014).
The money spent by foreign visitors is the key component of the direct contribution of
$1 383.8 billion (bn) in 2014. In 2025, the industry is projected to have generated
expenditure of $1 796.2 bn. Capital investment attracted by this industry in 2014 is $14.4 bn.
The information in this section gives a clear indication that tourism industry is one of the
dominating sectors in the economy of the world.
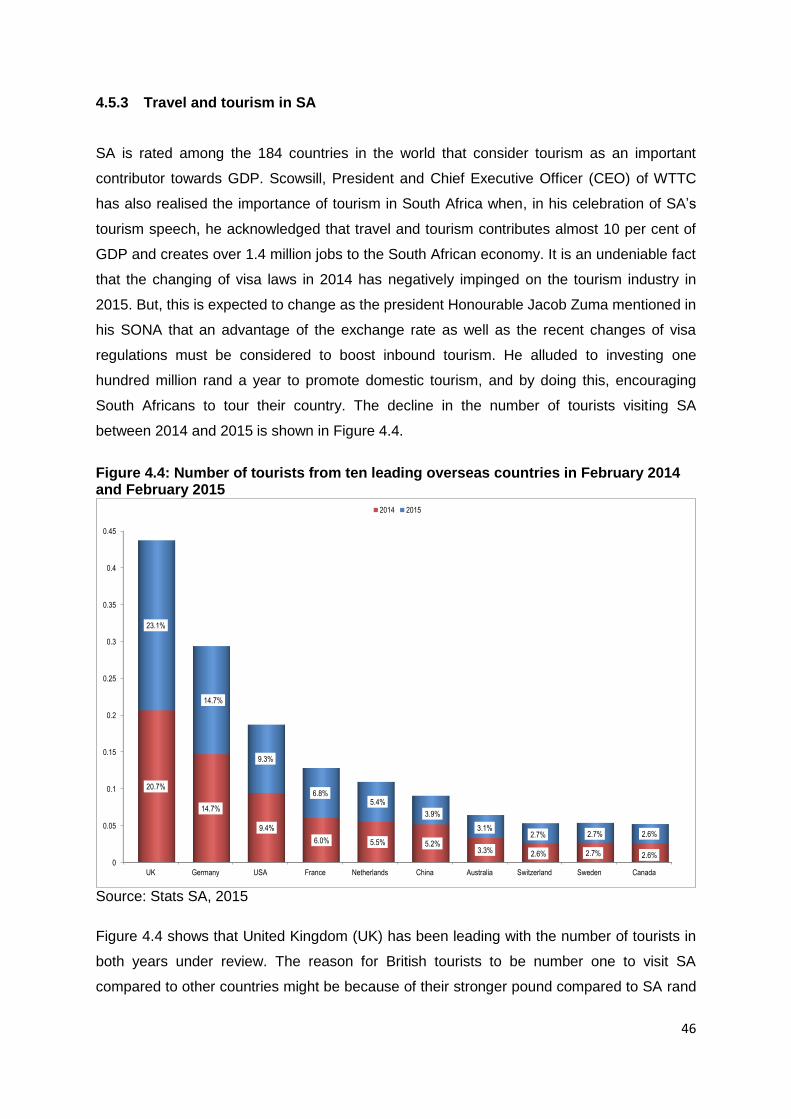
46
4.5.3 Travel and tourism in SA
SA is rated among the 184 countries in the world that consider tourism as an important
contributor towards GDP. Scowsill, President and Chief Executive Officer (CEO) of WTTC
has also realised the importance of tourism in South Africa when, in his celebration of SA’s
tourism speech, he acknowledged that travel and tourism contributes almost 10 per cent of
GDP and creates over 1.4 million jobs to the South African economy. It is an undeniable fact
that the changing of visa laws in 2014 has negatively impinged on the tourism industry in
2015. But, this is expected to change as the president Honourable Jacob Zuma mentioned in
his SONA that an advantage of the exchange rate as well as the recent changes of visa
regulations must be considered to boost inbound tourism. He alluded to investing one
hundred million rand a year to promote domestic tourism, and by doing this, encouraging
South Africans to tour their country. The decline in the number of tourists visiting SA
between 2014 and 2015 is shown in Figure 4.4.
Figure 4.4: Number of tourists from ten leading overseas countries in February 2014 and February 2015
Source: Stats SA, 2015
Figure 4.4 shows that United Kingdom (UK) has been leading with the number of tourists in
both years under review. The reason for British tourists to be number one to visit SA
compared to other countries might be because of their stronger pound compared to SA rand
0
0.05
0.1
0.15
0.2
0.25
0.3
0.35
0.4
0.45
UK Germany USA France Netherlands China Australia Switzerland Sweden Canada
20.7%
14.7%
9.4%
6.0% 5.5% 5.2%3.3% 2.6% 2.7% 2.6%
23.1%
14.7%
9.3%
6.8%5.4%
3.9%
3.1%2.7% 2.7% 2.6%
2014 2015

47
and not all tourists required a visa to visit SA. The South African weather also might be a
good contributor towards this situation. People from Germany and USA are second and third
most interested to visit SA.
Table 4.4: Number of visitors by continent, 2014 and 2015
Source: Stats SA, 2015
Although SA receives more visitors from UK, its leading partner in tourism is its own
continent of Africa. Table 4.4 shows the difference between tourists from overseas and
Africa. Tourists from Africa are more than double compared to tourist from the rest of the
world for both 2014 and 2015. The least number of tourists coming to SA are from the
Middle East, Australia, South America and Asia. Most of these continents’ visitors are
dominated by the Southern African Development Community (SADC) which is followed by
East Africa. In all seven continents, the number of tourists have declined during the said
period between February 2014 and February 2015. It is assumed that this situation has been
the result of change in visa laws that were implemented in 2014.
According to Stats SA (2015), among the African countries, the most visitors to SA were
from the Southern African Development Community (SADC) countries33 as indicated above
- 97.1 per cent. Among the SADC countries, Tanzania, Botswana and Namibia received
more tourists during 2015 than in 2014; otherwise all other SADC countries showed a
decrease in tourists coming to SA during the same period. Figure 3.5 shows the number of
tourists from ten leading Southern African Developing Community (SADC) between
February 2014 and February 2015.
33
The countries that form part of the SADC community are: Angola, Botswana, Lesotho, Malawi, Mozambique, Namibia, Swaziland, Tanzania, Zambia and Zimbabwe.
Europe North America South America Australia Middle East Asia Africa
2014 151 113 26 727 6 420 8 553 3 032 26 100 511 460
2015 142 805 23 817 3 828 7 247 2 737 18 595 481 302

48
Figure 4.5: Number of tourists from the ten leading SADC countries in February 2014 and February 2015
Source: Stats SA, 2015 This diagram shows the same trend as overseas tourists where the number of tourists has
declined in 2015. It is speculated that this decrease is due to new restrictions on visa laws
imposed by SA. Tourism has contributed towards GDP, employment, exports and
investment. According to WTTC SA, the total contribution towards GDP by the industry in
2014 is estimated at R357 bn (9.4 per cent of the GDP). This contribution is projected to
grow in 2015 by 3.4 per cent. The publication also forecasted a 10 year period of
contribution at a rise of 4.3 per cent per annum which counts to R561.1bn (10.4 per cent of
the GDP in 2015).
The industry also contributes quite significantly towards job creation in the country. In 2014,
the industry contributed 9.9 per cent of total employment (1 497 500 jobs). This is expected
to rise by 3.6 per cent to 1 551 500 jobs (10.0 per cent) in 2015. By 2025, the estimation is a
2.7 per cent rise per annum which constitutes a total of 2 028 000 jobs (11.5 per cent) of
total employment.
Zimbabwe Mozambique Lesotho Swaziland Botswana Namibia Zambia Malawi Angola Tanzania
136 381
92 327 92 044
59 495
36 642
13 622 13 187 10 953
4 798 2 912
145 394
96 306104 430
62 701
35 274
13 283 13 78411 749 5 271
2 774
2015 2014

49
4.5.3.1 Visitor exports and investment
Visitor export is money spent by foreign visitors to a country. This is the key contributor in
the direct contribution by tourism. In 2014, the contribution by the industry in this sector is
estimated at R102.9bn and it is expected to grow by 4.5 per cent in 2015. Tourism has also
attracted capital investment directly and indirectly to SA. In 2014, capital investment
attracted by tourism reached R60.5bn. This is expected to rise by 0.3 per cent in 2015 and
by 2.3 per cent per annum in 2025 to R76bn.
Figure 4.6: SA’s overseas (long haul) visitors from 1996 to 2013
Source: Zulu Kingdom.org, 2014
Since 1995 to 2013, visitors to SA have more than doubled. This shows how SA has
attracted visitors from outside since the death of apartheid. Prior to 1994, there were fewer
than a million visitors. According to the South African Tourism (SAT) (2014), there were
404 391 visitors to SA in 1980. Fourteen years later, in 1994, this number nearly doubled to
704 630 visitors. This number continued to increase to 1 071 839 in 1995 which further
increased to 2 683 141 in 2013. Visitors to the country have different reasons for visiting.
Figure 4.7 shows the major purposes of visiting the country in 2014.
1996 1997 1998 1999 2000 2001 2002 2003 2004 2005 2006 2007 2008 2009 2010 2011 2012 2013
1 1
72
39
4
1 2
73
93
6
1 4
28
40
1
1 4
91
05
9
1 5
17
76
8
1 5
02
09
0 1 8
03
88
7
1 8
79
11
0
1 8
84
33
6
1 9
39
21
4
2 0
78
70
4
2 1
83
31
9
2 1
82
13
0
2 0
95
32
5
2 2
16
99
4
2 1
76
17
9
2 5
05
76
2 2 6
83
14
1

50
Figure 4.7: Purpose of visit in SA by percentages, 2014
Source: Zulu Kingdom.org, 2014
This diagram illustrates that shopping dominated the reasons people chose to visit to the
country. This gives an opportunity for SA to produce more goods and services to cater for
people who come to the country to shop.
4.5.4 Travel and tourism in KZN
KZN is SA’s top holiday destination. This may be because KZN is situated on the east coast
and as such is gifted with the warm Indian Ocean, golden beaches and warm weather –
even during the winter months, the weather remains moderate; range of mountains (which
provide visitors with excellent sightseeing, mountain hiking and in winter ice climbing),
cycling, abseiling and white water rafting as well as wonderful game reserves (where visitors
can view wild animals including the Big 5 and many species of birds). According to KZN
Travel and Tourism Guide, the Isimangaliso wetlands in St Lucia is the second World
Heritage Site. It is also home to world class sport, for example: golf, two famous marathons
(Duzi and Comrades) and the Mandela marathon.
Recently, in September 2015, it was announced that the KZN province will be host to the
Common Wealth Olympic Games. This is a popular and wonderful event as people will come
0
0.1
0.2
0.3
0.4
0.5
0.6
0.7
0.8
Shopping Night life Social Visting NaturalAttractions
Business Cultural,Historical,
Heritage
Beach Theme Parks Casino Wildlife
78.0%
70.0%
47.0%
19.0% 19.0% 15.0%
12.0% 12.0%
4.0%1.0%

51
from all over the world to either spectate or be part of the games. This will be the first time
this event is taking place on an African soil. This will create numerous job opportunities and
put KZN on the world map. This event will invite many more world events in the country.
There is a strong possibility that the province could be the preferred country to host the world
Olympic Games as the country successfully hosted the World Cup in 2010.
4.5.4.1 Contribution to GDP by the tourism industry
Figure 4.8 shows the total tourism expenditure as a percentage of GDP in KZN. The
spending of tourism in the province has been marginally deteriorating since 2007 to 2013.
Even though tourism as a percentage of GDP is declining, in absolute values it increased for
the period under review. The reason for this trend is that GDP is increasing at a much faster
pace than the corresponding increase in tourism.
Figure 4.8: Total tourism spend as a percentage of GDP in KZN from 2007 to 2013
Source: Global Insight, 2014
4.5.4.2 Tourists visiting KZN by country of origin
Figure 4.9 shows the tourists who visited KZN in 2013. Seven of these are from outside
Africa, while three of them are from within the continent, more specifically the SADC. The
0.0%
1.0%
2.0%
3.0%
4.0%
5.0%
6.0%
7.0%
2007 2008 2009 2010 2011 2012 2013
6.7%
6.3%
6.1% 6.1%
5.7%
5.3%4.9%

52
highest proportion of visiting tourists from overseas come from the US (6.5 per cent),
followed by the UK (6.2 per cent), while Germany, India, Australia and France contributed a
rate of 5 per cent and below. Within the SADC, Swaziland had the highest number of people
visiting KZN (31.8 per cent), followed by Zimbabwe and Lesotho at 6.8 per cent and 6 per
cent, respectively.
Figure 4.9: Tourists visiting KZN by country of origin in numbers and percentages, 2013
Source: SAT, 2013
4.5.4.3 Most visited destinations in KZN
Figure 4.10 shows the destinations tourists visited the most in the KZN province during
2013. During 2013, Durban was one of the most visited destinations in the province of KZN.
Nearly three-quarters of all tourists (70.4) visited Durban as opposed to other tourist areas
such as the Drakesnberg (2 per cent) and the Battlefields (1.9 per cent). People are
attracted to visit Durban due to the following factors: Infrastructure and the warm Indian
ocean are among a series of factors attracting tourists to Durban. The Durban July Handicap
attracts many tourists during the month of July. This event brings together all the top horses
and their riders to win the most prestigious race of the year. It also gives an opportunity for
designers to showcase their designs. The city is also the custodian owner of Moses
Swaziland Zimbbwe USA UK Lesotho Germany India Australia France Botswana
269 362
57 30855 086 52 219
51 477 42 269
27 267 24 408 21 709 21 490
31.8%
6.8% 6.5% 6.2% 6.0%5.0%
3.2%2.9%
2.6% 2.5%

53
Mabhida, a beautiful stadium in South Africa which is host to a number of local and
international football games during the year.
There are also other sporting interests which boost the city’s tourism. The city is known for
its rugby team, “the Sharks”, and its soccer team the “Golden Arrows” and “AmaZulu”
Football Clubs. The swimming event, the Midmar mile, Amashova, the Cycle race and the
running race, the Comrades as well as the canoe race, the Duzi marathons are prominent
sporting events which attract global as well as national communities of all ages, races and
gender. The second most visited destination in KZN is the Elephant coast, which hosted
approximately 22.3 per cent of the total tourists who visited the province in 2011. The
tourists visiting the Elephant Coast are those that are passionate about nature, and thus
interested in seeing wild animals in their natural environment, while the Drakensberg (15.8
per cent) attracts tourists who are interested in outdoor activities, for example: hiking up
mountains, and / or swimming in fresh water rivers.
Figure 4.10: Percentage most visited destinations in KZN 2013
Source: SAT, 2012 This city enjoys the advantage of having beaches that are developed to the world standards.
Among tourist attractions that take place in the city of Durban are uShaka Marine World, and
the world class ‘Moses Mabida’ stadium where a number of both local and international
sporting activities take place.
0.0%
10.0%
20.0%
30.0%
40.0%
50.0%
60.0%
70.0%
80.0%
70.4%
5.3% 5.2% 5.2%2.0% 1.9% 0.7%

54
Figure: 4.11: Reasons for visiting the province of KZN, 2014
Source: SAT, 2014
Figure 4.11 shows that 83.1 per cent of all visitors to the KZN province visited KZN beaches.
This is the sign that KZN beaches are the source of income to many KZN residents and
creates most of the indirect jobs in the tourism industry. The second activity that tourists
most enjoyed doing in Durban was watching live sport events (33.3 per cent), such as rugby
or football.
Tourists have different purposes of visiting the province. As depicted in Figure 4.12, most
tourists come to the province for holidays where in 2014 about 50 per cent of the tourists
were holiday makers. Others come for business ventures (24 per cent) or visiting friends and
relatives (VFR) (21 per cent).
0.0
10.0
20.0
30.0
40.0
50.0
60.0
70.0
80.0
90.0
83.1
33.329.8 28.9
26.324.2
20.9
19.0 18.916.5 16.4 15.8
11.4 10.7 9.6 8.27.9 7.8 7.7 6.8 5.6

55
Figure 4.12: Purpose of visit to KZN as percentages in 2014
Source: Zulu Kingdom.org, 2014
4.6 International trade
International trade allows a country to expand its market penetration while influencing growth
and development in an economy. This is influenced by comparative advantage over its
foreign competitors in the production of tradable goods. SA’s Trade and Industrial Policy has
evolved over the years, as it has moved away from the highly protected, inward looking
economy, towards a more open economy. A key challenge for SA and KZN is reducing the
current account deficit by increasing the country’s production for both domestic and
international markets. Encouragingly, KZN is the second largest contributor to the South
African economy, as it is home to the busiest and largest ports of Durban and Richards Bay.
This section therefore provides an analysis of international trade with reference to exports,
imports, percentage share of South African exports by provinces as well as exports as a
percentage of GDP-R.
Table 4.5 shows the balance of payments on the current account from the second to the last
quarter of 2014 and the first three quarters of 2015. It is clear from this table that the South
African current account recently improved from a deficit realised in 2014 which averaged at
R69 billion to a surplus of R14 billion in the second quarter of 2015 and deteriorated again to
a deficit of R14 billion in the third quarter of 2015.
Holiday, 50%
Business, 24%
VFR, 21%
Other, 5%

56
As correctly pointed out by the SARB (2015), the improvement in the current account in the
second quarter of 2015 emanates from the depreciation of the South African rand, the
increase in global demand for domestically produced goods and the decline in imports. This
also resulted in an improvement of the current account as a percentage of GDP of -3.1 per
cent in the second quarter of 2015 from -4.7 per cent realised in the first quarter of the same
year.
Table 4.5: Balance on current account (R billion, seasonally adjusted and annualised) in 2014 and 2015
Source: SARB Quarterly Bulletin, December 2015
Surprisingly, in the third quarter of 2015 the current account realised a deficit of R14 billion
which was mainly attributed to increased domestic demand for foreign produced
intermediate and consumption goods. In addition, growth in export volumes moderated,
following steady growth in the physical quantity of exports from the middle of 2014. The
shortfall on the services, income and current transfer account with the rest of the world also
widened from the second to the third quarter of 2015 from R138 billion to R151 billion. This
shortfall was as a result of higher net income payments to international investors.
4.6.1 KwaZulu-Natal exports
Table 4.6 depicts the values of exports in SA by provinces for the years 2004 and 2014.
Although exports in the province of KZN had been falling behind that of the GP, it has
increased massively from R48.2 billion in 2004 to an estimated R118 billion recorded in
2014. This is a contribution of 19.4 per cent as a proportion of GDP as compared to 49.8 per
cent recorded by the GP in 2014. This constitutes 11.8 per cent of the South African exports
which is second after Gauteng (64.7 per cent). It has to be noted that given the comparative
2nd Quarter 3rd Quarter 4th Quarter 1st Quarter 2nd Quarter 3rd Quarter
Merchandise exports 909 931 959 941 937 1001 1009
Net Gold exports 64 63 62 63 62 71 64
Merchandise imports -1064 -1071 -1056 -1072 -1067 -1059 -1087
Trade Balance -90 -77 -35 -69 -68 14 -14
Net service, income and current
transfer payments-142 -145 -163 -138 -117 -138 -151
Balance on current account -232 -223 -198 -207 -185 -124 -165
As percentage of GDP -6.2 -5.8 -5.1 -5.4 -4.7 -3.1 -4.1
2014 2015Qtr 1 - Qtr 4
(2014)

57
advantage of the province of KZN with regard to having the largest and busiest ports, the
province has a potential of increasing its export capacity even further.
Table 4.6: South African exports by provinces in 2004 and 2014 (R’000)
Source: Global Insight, 2015
4.6.2 KwaZulu-Natal imports
Table 4.7 shows the value of imports and percentage share of South African imports by
provinces in 2004 and 2014. KZN imported an estimated value of R118 billion worth of
goods in 2014 which grew by 176.3 per cent from imports realised in 2004 (R42.7 billion). As
expected, the GP was the largest importer with an estimated value of R646.1 billion in 2014
which was 60.2 per cent of South African imports.
Table 4.7: Percentage share of South African imports by provinces in 2004 and 2014
Source: Global Insight, 2015
In contrast, the province of KZN (11 per cent of South African imports) had the third largest
imports after Gauteng and the WC (22.2 per cent of South African imports). The least
Exports% Share of SA
exports Exports as % of GDP Exports
% Share of SA
exports Exports as % of GDP
South Africa 310 524 999 100 21 1 003 825 998 100 26.4
Eastern Cape 25 456 936 8.2 22.4 42 470 623 4.2 14.2
Free State 3 013 464 1.0 3.8 9 662 395 1.0 5.1
Gauteng 173 312 220 55.8 33.6 649 360 192 64.7 49.8
KwaZulu-Natal 48 241 100 15.5 19.8 118 006 121 11.8 19.4
Limpopo 2 153 419 0.7 2.2 20 909 440 2.1 7.6
Mpumalanga 5 039 671 1.6 5.1 18 423 245 1.8 6.3
Northern Cape 5 617 562 1.8 17.8 13 649 207 1.4 18.1
North-West 14 664 164 4.7 17.8 18 300 516 1.8 8.1
Western Cape 33 026 465 10.6 15.2 113 044 260 11.3 21.5
2004 2014
Imports % Share of SA imports Imports % Share of SA imports
South Africa 311 758 996 100 1 072 463 997 100
Eastern Cape 23 830 381 7.6 50 134 236 4.7
Free State 1 586 391 0.5 4 236 986 0.4
Gauteng 179 553 576 57.6 646 107 196 60.2
KwaZulu-Natal 42 657 343 13.7 118 006 695 11.0
Limpopo 871 343 0.3 970 299 0.1
Mpumalanga 1 824 607 0.6 5 527 626 0.5
Northern Cape 3 258 472 1.0 3 403 822 0.3
North-West 1 541 412 0.5 5 553 622 0.5
Western Cape 56 635 473 18.2 238 523 515 22.2
2004 2014

58
contributor of all the provinces was the LP with a mere 0.1 per cent of the South African
imports.
4.7 Inflation rate
Inflation is one of the key macro-economic indicators that affect the economic performance
of a country. Higher levels of inflation reduce households' disposable income and thus
impinging negatively on consumption. As a result, this leads to a lower aggregate demand in
an economy, particularly in SA whereby the economy is under severe strain. In SA, the
Monetary Policy Committee (MPC)34 of the SARB carefully monitors inflation trends both
globally and nationally and then applies appropriate monetary policy instruments as and
when required.
As correctly pointed out by the SARB (2016), inflation outlook has deteriorated significantly,
mainly due to the exchange rate, drought and higher food prices. According Stats SA (2016),
the year-on-year inflation rate, as measured by the consumer price index (CPI) for all urban
areas, accelerated sharply to 6.2 per cent35 in January 2016 from 5.2 per cent in December
2015. This was the highest increase in 17 months which was within the SARB expectations.
Inflation that rises above the 3 per cent to the 6 per cent target band suggests interest rate
hikes in the near future.
The key drivers of higher inflation rate are food and non-alcoholic beverages which
accelerated to 6.9 per cent. The CPI for goods increased by 6.5 per cent, while services
increased by 6 per cent, mainly due to higher petrol and food prices (Stats SA, 2016).
Inflation is projected to peak at 7.8 per cent in the fourth quarter of 2016 and the first quarter
of 2017. It is, however, expected to moderate to 6.2 per cent in the final quarter of 2017.
Drought-induced food prices increased, higher electricity tariffs and a weak rand are
anticipated to be the main drivers of inflation in 2016.
34
According to the SARB, MPC in SA is responsible for the decision-making on appropriate monetary policy stance. The primary objective of monetary policy in SA is to achieve and maintain price stability in the interest of sustainable and balanced economic development and growth (https://www.resbank.co.za/MonetaryPolicy/Pages/MonetaryPolicy-Home.aspx) 35
The most important categories in the consumer price index in the country are: housing and utilities at 24.5 per cent of total weight, transport (16.4 per cent) and food and non-alcoholic beverages at 15.4 per cent (Stats SA, 2016).
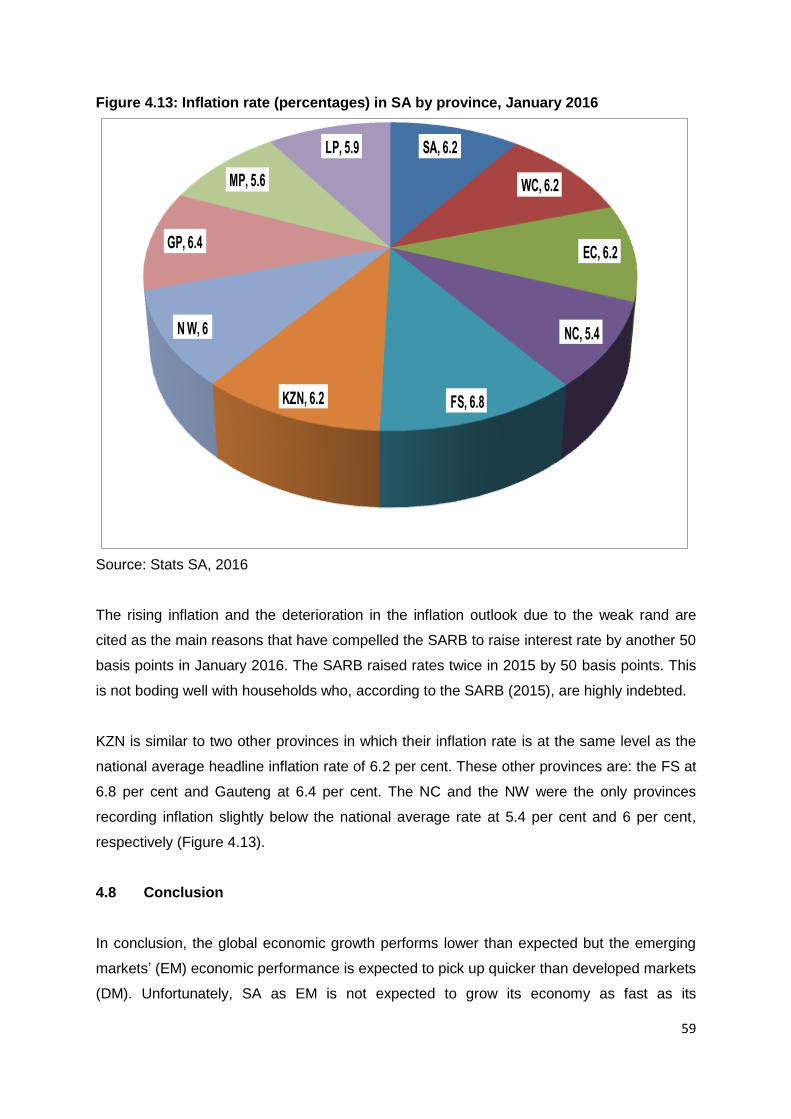
59
Figure 4.13: Inflation rate (percentages) in SA by province, January 2016
Source: Stats SA, 2016
The rising inflation and the deterioration in the inflation outlook due to the weak rand are
cited as the main reasons that have compelled the SARB to raise interest rate by another 50
basis points in January 2016. The SARB raised rates twice in 2015 by 50 basis points. This
is not boding well with households who, according to the SARB (2015), are highly indebted.
KZN is similar to two other provinces in which their inflation rate is at the same level as the
national average headline inflation rate of 6.2 per cent. These other provinces are: the FS at
6.8 per cent and Gauteng at 6.4 per cent. The NC and the NW were the only provinces
recording inflation slightly below the national average rate at 5.4 per cent and 6 per cent,
respectively (Figure 4.13).
4.8 Conclusion
In conclusion, the global economic growth performs lower than expected but the emerging
markets’ (EM) economic performance is expected to pick up quicker than developed markets
(DM). Unfortunately, SA as EM is not expected to grow its economy as fast as its
SA, 6.2
WC, 6.2
EC, 6.2
NC, 5.4
FS, 6.8KZN, 6.2
N W, 6
GP, 6.4
MP, 5.6
LP, 5.9

60
counterparts (EM). Factors like drought, weak currency, strikes, mine disasters, rising
interest rate and student protests are among others which are the root cause of slow
economic growth. This calls for SA to tighten up its budget by avoiding fruitless spending.
Booming industries like tourism should be nurtured by boosting them through higher
budgets.
Sectors such as agriculture have lost momentum due to issues such as drought as
mentioned above; it is thus recommended that government gives some form of assistance in
this regard through government subsidies. The mining sector has performed poorly due to a
sharp contraction in the mining of metal ores caused by ongoing strikes in the mining
industry. However, trade and finance sectors showed a positive growth.
International trade is largely influenced by the comparative advantage the country has over
its foreign rivals. With South Africa moving away from being a protected economy to an open
economy, the current account has improved in 2015 nevertheless; it has again deteriorated
in the same year. This enhancement emanates from the weaker rand. The government can
exercise its powers by revaluing the rand.

61
Chapter 5: Labour Markets
5.1 Introduction
The South African labour market has transformed since 1994. Since then, more emphasis
has been put on strategies that are aimed at eliminating labour inequalities of the past, and
improving working conditions for the people in the country. Although there has been a
transformation in the labour market, the country is, however, still faced with major
challenges, such as: job creation, excess of unskilled workers and as such unemployable
labour, high poverty rate, and high levels of inequality.
The purpose of this chapter is therefore to provide the labour market dynamics in KwaZulu-
Natal (KZN). The chapter starts by providing an outline of the national labour market,
focusing mainly on employment and unemployment rates. It proceeds by providing an
analysis of both labour force participation and labour absorption rates. The chapter
concludes by discussing the relationship between labour remuneration and productivity.
5.2 Employment
The Quarterly Labor Force Survey (QLFS) by Stats SA (2015) indicates that the working-age
population in SA is 36.1 million, however, only 15.8 million people are employed. The total
number of people employed increased by 171 000 in the third quarter of 2015 compared to
198 000 estimated in the second quarter of the same year. Compared to the same period in
2014, employment increased by a staggering 712 000.
An analysis of employment by level of education reveals the largest proportion of the
employed population (Indians and Whites) have tertiary qualifications. It is estimated that
48.6 per cent of employed White persons and 33.8 per cent of employed Indian persons had
a tertiary qualification in the third quarter of 2015. Disturbingly, more than half of the Black
African and Coloured population had an educational level of less than a matric (Stats SA,
2015).
The report further states that, similar to quarter three of 2014, employment levels increased
in seven of the nine provinces between quarters two and three of 2015. The largest quarterly
employment gains were observed in the Western Cape (WC), with 60 000 people having

62
found work. This was followed by the cities of Limpopo and Gauteng in which 59 000 and
41 000 people found work. Job losses of 19 000 and 4 000 were recorded in the North West
and Free State (FS) provinces, respectively.
As at the end of September 2015, the total number of the working age population in KZN
was estimated at 6.715 million, however, only 2.573 million were employed (Stats SA, 2015).
Most of the people (1.23 million or 44 per cent) employed in KZN are in the eThekwini
Metro36. This is nonetheless a non-startling revelation as eThekwini is the economic hub of
the province. The remaining 1.450 million jobs are shared unevenly among the ten district
municipalities in the province.
Table 5.1: Formal and informal employment by district, 2003 and 2014
Source: Global Insight, 2015
5.2.1 Employment by sector
An observation from the Quarterly Employment Statistics Survey (QESS) by Stats SA
(2015), clearly indicates that the prospects for formal sector employment growth remains
bleak for the people in the country. This observation is consistent with the sluggish growth
performance of the economy. With the exception of the transport industry, which shed
34 000 jobs, annual employment gains were recorded in all the industries between the third
quarters of 2014 and 2015. Over the same period, the largest employment gains were
observed in agriculture (211 000), construction (180 000), and finance (135 000) industries
(Stats SA, 2015).
36
See Section 4.4 in Chapter 4 of this report.
Formal Employment Informal Employment Total Employmemnt Formal Employment Informal Employment Total Employmemnt
National 10 174 633 1 843 824 12 018 457 12 109 847 2 343 516 14 453 363
KwaZulu-Natal 1 778 334 340 585 2 118 919 1 989 315 452 045 2 441 360
Ethekwini 939 202 116 858 1 056 060 1 033 782 211 772 1 245 553
Ugu 91 658 23 755 115 412 109 502 25 533 135 034
uMgungundlovu 205 000 45 567 250 567 227 753 54 992 282 745
Uthukela 81 257 25 327 106 584 83 510 23 471 106 981
Umzinyathi 30 886 10 031 40 917 37 783 11 356 49 139
Amajuba 72 056 22 459 94 515 74 543 21 358 95 902
Zululand 64 066 18 656 82 721 73 400 18 831 92 231
Umkhanyakude 42 120 11 531 53 651 53 697 14 146 67 843
Uthungulu 132 474 28 419 160 893 144 937 31 323 176 260
iLembe 76 346 22 563 98 909 95 450 24 432 119 883
Sisonke 43 270 15 419 58 689 54 958 14 830 69 789
2003 2014

63
Similar to the national trend and across provinces, the largest proportion of all jobs in the
province emanate from the government (22.9 per cent). This is followed closely by trade at
21.5 per cent, manufacturing with 13.6 per cent and finance (13.3 per cent). Mining
contributes the least to the employment statistics (0.4 per cent). The tertiary sector (73.4 per
cent) is the main driver of job creation in the province. The remaining job opportunities is
spread between the secondary (22.4 per cent) and the primary (4.2 per cent) sectors.
Table 5.2: Employment by sector in KZN, 2014
Source: Global Insight, 2015
5.3 Unemployment
Data from Stats SA (2015) shows that, between the second and third quarter of 2015, the
official national unemployment rate increased minimally by a 0.5 percentage point, from 25
per cent in second quarter to 25.5 per cent in the third quarter. In contrast to other provinces,
KZN recorded the second lowest unemployment rate during the second quarter (20.4 per
cent) and third quarter of 2015 (20.5 per cent). Limpopo recorded the lowest at 18.9 per cent
and 18.8 per cent, respectively for the same period. The highest official unemployment rate
out of the nine provinces was in the Northern Cape (NC) in which 32.7 per cent and 34.8 per
cent of people remained unemployed during the second and third quarter of 2015, The Free
State (FS) unemployment statistics were not similar, as 31.4 per cent and 31.5 per cent of
people remained unemployed during the second and third quarter of 2015.
Inherently, social ills, unemployment, poverty and inequality remain major challenges which
hamper economic performances in an economy. In an effort to address these challenges,
the national government has committed to continue implement the National Development
Plan (NDP), the New Growth Path (NGP), Industrial Policy Action Plan (IPAP) and the
creation of Special Economic or Industrial Development Zones (SEZs / IDZs).
South Africa Eastern Cape Free State Gauteng KwaZulu-Natal Limpopo Mpumalanga North West Northen Cape Western Cape
Primary Sector 7.5 5.0 11.8 2.8 4.2 16.0 15.4 22.6 24.2 6.3
1 Agriculture 4.1 4.8 7.4 0.9 3.8 6.9 6.7 4.2 12.2 6.2
2 Mining 3.4 0.1 4.4 1.9 0.4 9.0 8.6 18.5 12.0 0.1
Secondary Sector 19.2 20.4 15.0 19.6 22.4 16.1 17.3 13.5 10.2 21.2
3 Manufacturing 11.4 10.9 8.2 12.9 13.6 6.2 8.1 7.7 3.5 13.7
4 Electricity 0.6 0.3 0.5 0.6 0.4 0.7 1.6 0.4 0.6 0.5
5 Construction 7.2 9.1 6.3 6.1 8.4 9.2 7.6 5.5 6.0 7.0
Tertiary Sector 73.3 74.7 73.2 77.6 73.4 68.0 67.3 63.8 65.7 72.5
6 Trade 21.7 22.4 21.2 21.5 21.5 23.6 22.8 19.6 15.9 22.1
7 Transport 5.6 5.3 4.4 6.5 6.8 3.9 4.5 3.2 3.3 5.3
8 Finance 15.8 10.6 10.3 22.2 13.3 7.0 11.6 9.8 9.1 18.4
9 Community services 22.0 27.6 26.0 19.7 22.9 24.8 19.3 22.3 28.3 20.3
House hold 8.2 8.8 11.2 7.8 8.9 8.7 9.1 8.8 9.1 6.3

64
As indicated in chapter three37 of this publication, the global, national and economic outlook
is subdued. The statistics show that KZN is not excluded from this analysis. Subsequently,
unemployment rate continues to increase at both national and provincial levels. It is within
this challenging experience that sectors of particular concern include agriculture and mining,
as both major employers are currently involved with retrenchment programmes.
The external economic factors such as the ailing Chinese economy which has shown a
declining trend in its economic growth has directly affected South Africa (SA), especially in
respect of exports of non-beneficiated materials. Similarly, world demand for goods and
services has contracted, thereby further exacerbating the already sluggish national
economy. Internal factors, which include the relatively high labour costs, when measured
against inflation and productivity are also cause for concern. This situation is further
exacerbated by the fact that over the past eighteen months, SA has been experiencing
unseasonably dry conditions, culminating in the summer of 2015/16 as being alluded to by
experts as the worst drought in 30 years. At a farm level, and in terms of agro-processing
industries, further retrenchments will be inevitable.
5.3.1 Unemployment by gender and age
According to Stats SA (2015), as at the end of the third quarter of 2015, the national
unemployment rate among females was higher at 45.9 per cent (quarter-to-quarter change)
compared to that of males at 54 per cent. Evidence indicates that the national
unemployment gap between women and men narrowed between 2003 and 2013; this could
be attributed to, among others, the effective implementation of the labour laws such as the
Employment Equity Act (EEA).
Stats SA further indicated that the unemployment rate among youth aged between 15 to 24
in the third quarter of 2015 was at 49.9 per cent and 30.3 per cent among people in the 25 to
34 age cohort. Subsequently, strategic objectives number 1.3 and 1.4 of the Provincial
Growth and Development Plan (PGDP): Expansion of Government-led job creation
Programmes and Promoting Small, Medium and Micro Enterprise (SMME),
Entrepreneurship and Youth Development, respectively are essential in not only closing the
gender gap, but reducing unemployment. These harsh realities are therefore an indication
that a great deal has to be done to reduce the unemployment rate, particularly among the
youth population.
37
See Sections 4.2 to 4.4 of this report.

65
5.4 Labour force participation rate
The labour force participation rate (LFPR)38 shows the extent to which the working
population is economically active. Figure 5.1 indicates that LFPR in KZN is estimated at
29.6 per cent which is far below the national average rate of 36 percent. This rate is further
below that which was estimated in most provinces, with the exception of the Easter Cape
(EC) (27 per cent) and Limpopo (23.1 per cent).
Figure 5.1: Labour force participation rate in SA and KZN, 2014
Source: Global Insight, 2015
A lower LFPR indicates a decrease in the number of persons who are economically active,
hence a rise in the number of discouraged work seekers. Technically, this leads to a
decrease in the number of labour force, which implies that KZN, EC and Limpopo
experience more discouraged work seekers compared to the average national rate and
across other provinces.
5.5 Labour absorption rate
The labour absorption rate (LAR) is generally defined as the percentage of the working age
of population employed. In SA, the average absorption rate as at the end of September 2015
38
The labour force participation rate is defined as the percentage of working-age persons in an
economy who are employed or unemployed but looking for a job. Generally, “working-age” persons,
refer to people between the age cohort of 16 and 64. Accessed on the 4th of February 2014 and
available online http://economics.about.com/od/unemploymentrate/f/labor_force.htm,
0.0%
5.0%
10.0%
15.0%
20.0%
25.0%
30.0%
35.0%
40.0%
45.0%
50.0%
36.0%
27.0%
37.5%47.9%
29.6%
40.1%
23.1%
35.7%
31.3%
35.2%45.5%
2014
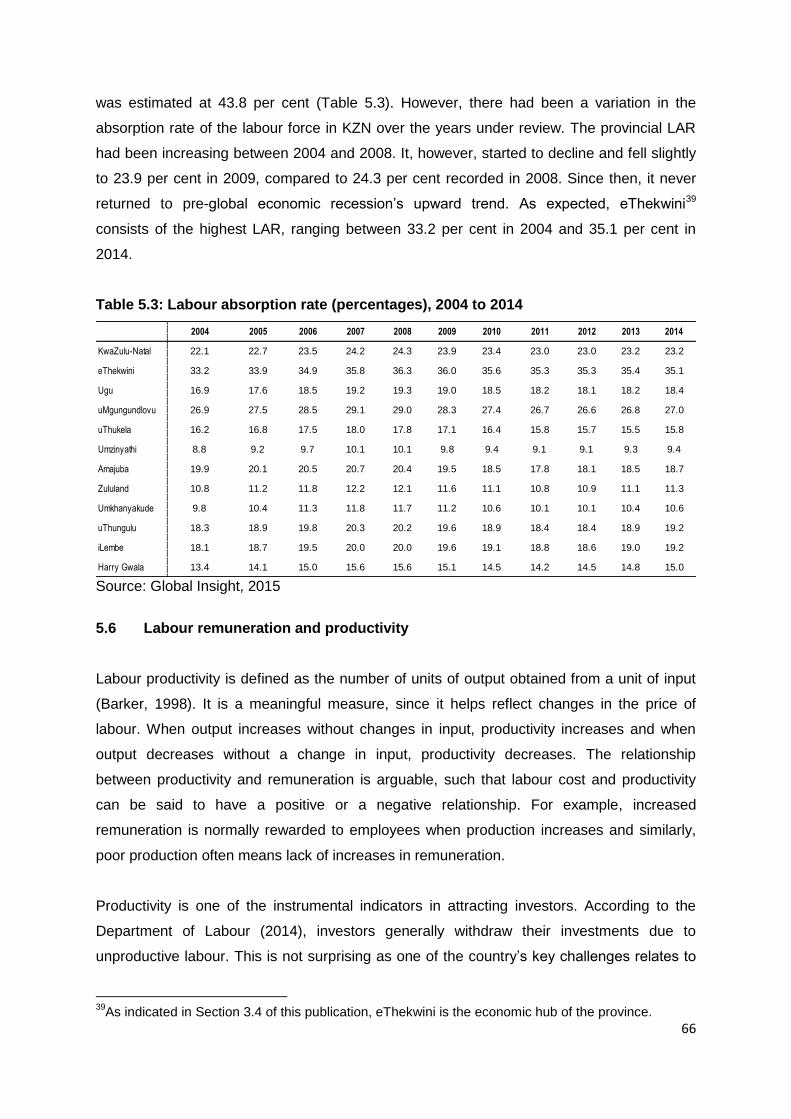
66
was estimated at 43.8 per cent (Table 5.3). However, there had been a variation in the
absorption rate of the labour force in KZN over the years under review. The provincial LAR
had been increasing between 2004 and 2008. It, however, started to decline and fell slightly
to 23.9 per cent in 2009, compared to 24.3 per cent recorded in 2008. Since then, it never
returned to pre-global economic recession’s upward trend. As expected, eThekwini39
consists of the highest LAR, ranging between 33.2 per cent in 2004 and 35.1 per cent in
2014.
Table 5.3: Labour absorption rate (percentages), 2004 to 2014
Source: Global Insight, 2015
5.6 Labour remuneration and productivity
Labour productivity is defined as the number of units of output obtained from a unit of input
(Barker, 1998). It is a meaningful measure, since it helps reflect changes in the price of
labour. When output increases without changes in input, productivity increases and when
output decreases without a change in input, productivity decreases. The relationship
between productivity and remuneration is arguable, such that labour cost and productivity
can be said to have a positive or a negative relationship. For example, increased
remuneration is normally rewarded to employees when production increases and similarly,
poor production often means lack of increases in remuneration.
Productivity is one of the instrumental indicators in attracting investors. According to the
Department of Labour (2014), investors generally withdraw their investments due to
unproductive labour. This is not surprising as one of the country’s key challenges relates to
39
As indicated in Section 3.4 of this publication, eThekwini is the economic hub of the province.
2004 2005 2006 2007 2008 2009 2010 2011 2012 2013 2014
KwaZulu-Natal 22.1 22.7 23.5 24.2 24.3 23.9 23.4 23.0 23.0 23.2 23.2
eThekwini 33.2 33.9 34.9 35.8 36.3 36.0 35.6 35.3 35.3 35.4 35.1
Ugu 16.9 17.6 18.5 19.2 19.3 19.0 18.5 18.2 18.1 18.2 18.4
uMgungundlovu 26.9 27.5 28.5 29.1 29.0 28.3 27.4 26.7 26.6 26.8 27.0
uThukela 16.2 16.8 17.5 18.0 17.8 17.1 16.4 15.8 15.7 15.5 15.8
Umzinyathi 8.8 9.2 9.7 10.1 10.1 9.8 9.4 9.1 9.1 9.3 9.4
Amajuba 19.9 20.1 20.5 20.7 20.4 19.5 18.5 17.8 18.1 18.5 18.7
Zululand 10.8 11.2 11.8 12.2 12.1 11.6 11.1 10.8 10.9 11.1 11.3
Umkhanyakude 9.8 10.4 11.3 11.8 11.7 11.2 10.6 10.1 10.1 10.4 10.6
uThungulu 18.3 18.9 19.8 20.3 20.2 19.6 18.9 18.4 18.4 18.9 19.2
iLembe 18.1 18.7 19.5 20.0 20.0 19.6 19.1 18.8 18.6 19.0 19.2
Harry Gwala 13.4 14.1 15.0 15.6 15.6 15.1 14.5 14.2 14.5 14.8 15.0

67
the shortage of skilled labour. An increase in wages with no link to efficiency, labour costs
tend to increase and the economy becomes less competitive internationally and locally. It is,
therefore, evident that the labour productivity in SA is also a challenge. This may be due to
many factors, such as: lack of skills, poor literacy rate and lack of experience.
Figure 5.2 shows the trend between productivity and remuneration of labour in KZN for the
period 2004 to 2014. Similar to the national trend, the growth rate in labour remuneration has
out-performed productivity growth in KZN over the period under review. An ideal situation is
for both the productivity and remuneration curves to be closer to each other, meaning that
the gap between the two variables should be minimal. Interestingly, the gap between these
variables started widening between 2007 and 200940.
Figure 5.2: Labour remuneration and productivity, 2004 to 2014
Source: Global Insight, 2015 5.7 Conclusion
There is, without doubt a tremendous lack of skilled labour in SA and KZN is no exception.
This calls for a major intervention by the current dispensation. There are policies and
programmes that are pro job creation but the challenges of unemployment and poverty still
exist. It is disturbing that the sector that provides most employment is community services
for both KZN and SA, considering that government’s responsibility should ideally be that of
creating a conducive environment for businesses to thrive. It is therefore important to
40
It must be remembered that this was during the time of the global economic recession.
2.6 2.2
0.92.6 2.8
-0.3
5.14.4
1.7
0.50.6
8.17.2 6.7
10.5
15.0
8.6
11.011.7
8.0
7.1 7.1
-2.0
0.0
2.0
4.0
6.0
8.0
10.0
12.0
14.0
16.0
2004 2005 2006 2007 2008 2009 2010 2011 2012 2013 2014
Productivity Remunaration

68
promote and incubate small medium and micro enterprises if the economy is to address the
problem of unemployment. This calls for changing the mindset of people to be job creators
rather than job seekers.
It is also essential to ensure that compensation of workers is according to how productive
they are. The remuneration and productivity trend analysis reveals an unpleasant picture
about these two variables which should move together in an ideal situation. The
improvement in labour productivity has a positive contribution towards the country’s
economic growth.

69
Chapter 6: Infrastructure Spending in KZN
6.1 Introduction
This section provides an overview of provincial infrastructure in terms of budget allocations
for the 2014/2015 and 2015/2016 financial years. Also captured in this section is a focus on
the departments that have been allocated the largest proportion of the infrastructure budget.
An analysis of investment categories (New Infrastructure, Existing Infrastructure, Transfers
and Leases) has been conducted. This analysis aims to provide an overview of how the
infrastructure budget allocations are spent. According to Economic Commission for Africa
(2013) Infrastructure is one of the pillars of economic transformation. Sustainable economic
growth often occurs in an environment where there is a meaningful infrastructure, and there
is evidence that it reduces inequality. Therefore it is essential to focus on closely monitoring
infrastructure budget allocations, streamlining the infrastructure value chain through the
IDMS and improving quality of existing infrastructure.
A discussion of the Infrastructure Delivery Management System (IDMS) has been included
in this section, and changes and improvements to the system have also been highlighted.
The monitoring and evaluation role of the Provincial Treasury (PT) has also been conducted
in order to highlight the importance of monitoring and evaluation.
6.2 Infrastructure spending in KZN
6.2.1 Provincial infrastructure overview
Governments around the world rank infrastructure among their greatest concerns. The
modernisation of infrastructure is seen as being critical to future economic competitiveness
and crucial to accommodating expanding populations in urbanising environments
(Development Bank of Southern Africa (DBSA), 2012).
Infrastructure contributes to economic growth and poverty reduction by increasing the
competitiveness as well as the international and domestic connectivity of economies. In a
highly globalized economy with vertically and horizontally integrated production networks,
regional integration and agglomeration offer significant growth and employment opportunities
for developing countries. Infrastructure also improves rural access to earnings opportunities,

70
raises rural productivity, and provides access to basic services, thereby achieving inclusive
development (Fujita, 2012). It is therefore inevitable that investment in infrastructure
contributes to economic growth and development in the country and hence has to be made
one of the priorities. In line with these sentiments, infrastructure is a priority in the province
and infrastructure budget baseline allocations are geared towards social infrastructure.
Table 6.1: Infrastructure baseline allocation 2014/15 to 2015/16
Source: Estimates of provincial revenue and expenditure, 2015
The province continues to invest the largest proportion of the infrastructure budget for social
infrastructure to the departments of Transport, Education and Health respectively, (Table
6.1). The department of Transport is the largest infrastructure department in terms of budget
allocation with an estimated 57.5 per cent and 54.3 per cent of the total provincial
infrastructure budget in the 2014/15 and 2015/16 financial years, respectively. According to
the OECD (2016), infrastructure investment (indicator) in the transport sector is a key
contributor to the country’s competitiveness in global markets. This department’s five
modalities include road, rail, sea, pipeline and air transport which are the biggest and most
efficient transport networks in Africa, servicing industries that span the continent, and the
sector which is seen by the government as a crucial engine for economic growth and
development.
Transport infrastructure is a derived need created by the spatial separation of activities. In
order to develop from subsistence economy to a commercially viable economy, it is
imperative that there exists an integrated transport network. This will help to facilitate the
R'000 % R'000 %
1. Office of the Premier R 24 560 0.2 R 19 629 0.2
2. Provincial Legislature R 5 552 0.0 R 4 900 0.0
3. Agriculture and Rural Development R 147 586 1.3 R 140 756 1.2
4. Economic Development, Tourism and Environmental Affairs R 540 775 4.8 R 660 015 5.5
5. Education R 1 862 926 16.4 R 2 504 035 20.8
6. Provincial Treasury R 31 883 0.3 R 10 062 0.1
7. Health R 1 656 641 14.6 R 1 504 206 12.5
8. Human Settlements R 108 720 1.0 R 160 900 1.3
9. Cogta R 80 152 0.7 R 78 231 0.6
10. Transport R 6 533 844 57.5 R 6 550 069 54.3
11. Social Development R 135 218 1.2 R 152 938 1.3
12. Public Works R 105 508 0.9 R 77 373 0.6
13. Arts and Culture R 70 257 0.6 R 118 479 1.0
14. Sports and Recreation R 58 378 0.5 R 77 964 0.6
R 11 362 000 100 R 12 059 557 100
2014/15 2015/16

71
transportation of goods and people between areas of production and consumption and
ensures that economic activity is improved.
The department of Education is the second largest infrastructure department in terms of
budget allocation with 20.8 per cent of the total infrastructure budget in the 2015/16 financial
year. The department of Education has 1631 active infrastructure projects recorded on the
Infrastructure Reporting Model (IRM). These infrastructure projects include, sanitation
projects which consist of the provision of chemical toilets to schools, fencing of schools and
construction of new schools as well as maintenance of existing school infrastructure.
The third largest department is the department of Health with a budget allocation of 12.5 per
cent in 2015/16 financial year and 345 active infrastructure projects recorded on the IRM.
The main purpose of the this department is to develop and implement a sustainable, co-
ordinated, integrated and comprehensive health system based on the primary health care
approach, which encompasses promotive, curative, rehabilitative, supportive and palliative
care. This is guided by the principles of accessibility, equity, quality and efficiency,
sustainability, community participation, appropriate technology, and inter-governmental and
inter-sectoral collaboration.
Figure 6.1(a): Major infrastructure departments
Source: Estimates of provincial revenue and expenditure, 2015
0
1000000
2000000
3000000
4000000
5000000
6000000
7000000
2014/2015 REVISED ESTIMATES
R 1 656 641
R 1 862 926
R 6 533 844
VOTE 7: HEALTH
VOTE 5: EDUCATION
VOTE 10. TRANSPORT

72
Figure 6.1(b): Major infrastructure departments
Source: Estimates of provincial revenue and expenditure, 2015
The province allocated a total revised budget estimate amount of R11.4 billion in 2014/15
financial year and a total amount of R12.1 billion in the 2015/16 financial year to sector
departments for the implementation of infrastructure projects in the province. Therefore, the
budget allocated for infrastructure in the 2014/2015 financial year increased by 6 per cent.
However, the budget allocated to social infrastructure as well as economic infrastructure is
insufficient given the rural nature of KZN, size of the province, approximately 45 per cent of
the KZN population are children from age 00 to 19 and the catalyst for economic growth is
investment in economic infrastructure.
Table 6.2 shows the split of infrastructure budget by categories which include existing
infrastructure, new infrastructure and transfers. Approximately 76.4 per cent of infrastructure
budget was invested on the existing infrastructure which includes maintenance, upgrades
and additions as well as refurbishment and rehabilitation in 2015/16.
0
1000000
2000000
3000000
4000000
5000000
6000000
7000000
2015/2016 MAIN APPROPRIATION
R 2 504 035
R 1 504 206
R 6 550 069
VOTE 5: EDUCATION
VOTE 7: HEALTH
VOTE 10. TRANSPORT

73
Table 6.2: Summary of infrastructure payments and estimates by category
Source: EPRE, 2016/17
The level of capital investment delivered in the last decade made up substantial ground in
bridging the infrastructure deficit, particularly in the rural areas which in the past were left
underdeveloped. The rural areas and the majority of the population's access to essential
services and other government services has increased substantively. It is therefore
important for infrastructure maintenance to be a priority in the province. Given the prevailing
challenging fiscal environment, it is more beneficial to invest on existing infrastructure and
the upkeep of the existing assets than the building of new structures.
6.2.2 Infrastructure Delivery Management System (IDMS)
The ability to achieve the objectives has been strengthened by the appointment of Provincial
Infrastructure Technical Assistants. Therefore, in the 2013/14 financial year, a review of the
KwaZulu-Natal (KZN) IDMS framework was undertaken to determine how far the
implementation process had gone and what challenges were experienced as well as to map
the way forward. The targets and timeframes which were contained in the framework
document were reviewed and the functionality of the IDMS focal areas.
2015/16 2016/17 2017/18 2018/19
Existing infrastructure assets 9 352 289 9 603 629 9 692 172 10 245 453
Maintenance and repair: Current 3 014 147 4 361 572 4 368 136 4 778 594
Upgrades and additions: Capital 4 659 020 3 071 705 3 312 909 3 443 307
Refurbishment and rehabilitation: Capital 1 679 122 2 170 352 2 011 127 2 023 551
New infrastructure assets: Capital 2 018 719 1 776 975 1 863 510 1 913 843
Infrastructure transfers 842 857 576 483 610 596 637 597
Infrastructure transfers: Current 1 650 2 000 1 650 1 650
Infrastructure transfers: Capital 841 207 574 483 608 946 635 947
Infrastructure: Payments for financial assets - - - -
Infrastructure: Leases 21 390 21 285 22 301 23 542
Total 12 235 254 11 978 372 12 188 579 12 820 434
Capital infrastructure 9 198 067 7 593 515 7 796 492 8 016 648
Current infrastructure 3 037 187 4 384 857 4 392 087 4 803 786
Medium-term Estimates Revised
Estimate R
thousand

74
Figure 6.2: KZN-IDMS enabling environment
Source: KZN Provincial IDMS Framework, 2012
A further review of the KZN-IDMS framework has been undertaken in 2015/2016. This
review will look at the framework in its entirety from the roles and responsibilities of the role-
players, timeframes and governing structures. The KZN-IDMS contains the governance and
infrastructure principles that are applicable to the core infrastructure roles of sector
departments. It also incorporates the capacitation plan of Public Works as government
infrastructure implementing agent.
6.3 Monitoring and evaluation
6.3.1 Monitoring
According to the Public Service Commission (PSC) (2008), Monitoring means “A continuing
function that uses systematic collection of data on specified indicators to provide
management and the main stakeholders of an ongoing development intervention with
indications of the extent of progress and achievement of objectives and progress in the use
of allocated funds”.
The KZN PT performs the function of monitoring infrastructure budget expenditure trends
and actual progress of the project. This is achieved through infrastructure project site visits.
An infrastructure construction site is randomly selected and a site meeting is scheduled with
the relevant departmental official and the site technical team. After concluding the site
KZN CABINET
COHOD
IDMS STEERING COMMITTEE
ESID CLUSTER
1. Systems and
Processes
2. Construction
Procurement
3. Operations &
Maintenance
5. Organisation
Development & Human Resource Development
4. Institutional
Arrangements & Service Agreements
IDMS Five Focus
Groups
Public Works
Health
Education
Treasury
Depts
Implementing IDMS
IDIP
Technical Management Committee
(TMC)
Chair: Provincial Treasury

75
meeting and viewing the site, a report is compiled and circulated to the relevant
stakeholders.
6.3.2 Evaluation
“Evaluation is the systematic and objective assessment of an on-going or completed project,
programme or policy, its design, implementation and results. The aim is to determine the
relevance and fulfilment of objectives, development efficiency, effectiveness, impact and
sustainability. An evaluation should provide information that is credible and useful, enabling
the incorporation of lessons learned into the decision-making process of both recipients and
donors. Evaluation also refers to the process of determining the worth or significance of an
activity, policy or programme” (Public Service Commission, 2008).
The KZN PT performs the function of evaluating infrastructure budget expenditure trends
and actual project progress. This is achieved through monthly infrastructure project reports.
The IRM is a tool that was developed by National Treasury to assist provinces to better
monitor and evaluate the infrastructure performance of the sectors. Therefore, through
combining site visits, the IDMS framework and the IRM, enables the National Treasury to
create a clear picture of infrastructure performance and effectiveness in the province.
6.4 Conclusion
An overview of provincial infrastructure in terms of budget allocations for the 2014/2015 and
2015/2016 financial years revealed that the province allocates approximately R12 billion
annually to 14 provincial departments. Also captured in this section are the departments of
Transport, Education and Health respectively, who receive the highest proportion of the total
provincial infrastructure budget. It also emerged that the department with the largest budget
allocation is not necessarily the one with the largest number of projects. However, this is due
to the way in which departments report on specific projects. The department of Transport
clusters or groups the majority of the projects while the other departments capture the
majority of their projects as individual projects. A discussion on the IDMS has also been
included as well as the review of the KZN-IDMS framework document. The review of this
document highlighted the roles and responsibility of all the sector departments as well as
how it will be implemented in future.

76
Chapter 7: Provincial Economic Risk
Index41
7.1 Economic risk or condition variables
The economic risk or condition variables that are included in the monitor are indicated in
Table 7.1. The relative sector weights for the economic risk or condition variables are also
displayed and add up to 100 per cent. The weights at this stage are purely assumed weights
and not based on any econometric modelling or calculations because of a lack of sufficient
time series data. However, it must be mentioned that various weightings have been
modelled with very little impact on the overall results.
Table 7.1: Economic risk or condition variables and their associated sector weights
Source: Own calculations using KZN Economic Model, 2015
41
The views expressed in this chapter are those of the author and do not necessarily represent those of the KZN Provincial Treasury.
Relative Economic Sector ImpactRand/Dollar (Rand
per USD)
Interest rate (R157
= %)Inflation (pa %) Oil Price (USD)
Sugar price (US
cents per pound)Gold Price (USD)
Credit extended to
the domestic
private sector
(Rm)
Physical volume
of electricity
production (2005
= 100)
Agriculture, forestry and fishing 20.0% 10.0% 5.0% 17.0% 30.0% 0.0% 10.0% 8.0%
Mining and quarrying 30.0% 0.0% 0.0% 10.0% 0.0% 40.0% 0.0% 20.0%
Manufacturing 35.0% 20.0% 5.0% 10.0% 0.0% 0.0% 10.0% 20.0%
Electricity, gas and water 10.0% 5.0% 5.0% 20.0% 0.0% 0.0% 10.0% 50.0%
Construction 10.0% 30.0% 10.0% 15.0% 0.0% 0.0% 30.0% 5.0%
Wholesale & retail trade; hotels &
restaurants10.0% 35.0% 20.0% 10.0% 0.0% 0.0% 25.0% 0.0%
Transport , storage and
communication10.0% 20.0% 10.0% 30.0% 0.0% 0.0% 20.0% 10.0%
Finance, real estate and business
services10.0% 35.0% 10.0% 10.0% 0.0% 0.0% 30.0% 5.0%
Personal and General Government
Services10.0% 35.0% 20.0% 0.0% 0.0% 0.0% 30.0% 5.0%

77
Table 7.2: Implications of a change in the economic risk or condition variables
Source: Own calculations using KZN Economic Model, 2015
The theoretical impact of a change in each of the economic risk or condition variables are
illustrated in Table 7.2; for example, when the rand/dollar exchange rate depreciates the risk
associated to the provincial economy is assumed to be decreasing because of the potential
improvement in the economic conditions associated with a depreciating currency (increased
exports for example).
7.2 Behaviour of the economic risk or conditions variables
The behaviour or movement of the economic risk or conditions variables during 2015 is
shown Table 7.3.
Table 7.3: Behaviour of the economic risk or conditions variables, January 2015 to December 2015
Source: Own calculations using KZN Economic Model, 2015
Economic Indicator Unit Movement Decreasing risk Increasing risk
Rand/Dollar exchange rate Rand per USD Appreciate or depreciate Depreciate Appreciate
Interest rate Percentage R157 bond Increase or decrease Decrease Increase
Inflation rate Percentage per annum Increase or decrease Decrease Increase
Oil price USD per barrel Increase or decrease Decrease Increase
Sugar price US cents per pound Increase or decrease Increase Decrease
Gold price USD per ounce Increase or decrease Increase Decrease
Credit extended to the domestic private sector Rand million Increase or decrease Increase Decrease
Physical volume of electricity production Index, 2005 = 100 Increase or decrease Increase Decrease
Rand/Dollar
(Rand per
USD)
Interest rate
(R157 = %)Inflation (pa %)
Oil price
(USD)
Sugar price
(US cents per
pound)
Gold price
(USD)
Credit extended
to the domestic
private sector
(Rm)
Electricity
generated and
available for
distribution
(Gigawatt-hours)
Jan-15 11.6 6.4 5.3 49 15.1 1 467 2 862 253 3 494
Feb-15 11.5 6.9 4.4 60 14.5 1 417 2 886 214 3 238
Mar-15 12.1 7.1 4.0 56 12.8 1 440 2 920 340 3 529
Apr-15 11.8 7.2 4.5 66 12.9 1 407 2 934 096 3 393
May-15 12.2 7.4 4.4 63 12.7 1 448 2 961 439 3 464
Jun-15 12.2 7.6 4.6 62 12.1 1 424 2 947 591 3 374
Jul-15 12.7 7.6 4.7 53 11.9 1 392 2 970 091 3 624
Aug-15 13.3 7.6 4.7 50 10.7 1 509 2 988 514 3 543
Sep-15 13.8 7.6 4.6 48 12.1 1 543 3 007 216 3 436
Oct-15 13.9 7.4 4.6 49 14.1 1 590 3 028 592 3 472
Nov-15 14.4 7.8 4.7 45 14.9 1 538 3 081 672 3 488
Dec-15 15.5 9.0 4.8 36 15.0 1 636 3 097 580 3 466

78
Figure 7.1: Behaviour of the economic risk or conditions variables in index format, January 2010 to January 2016
Source: Own calculations using KZN Economic Model, 2016
Figure 7.1 indicates the behaviour of the economic risk variables in index format (2005 =
100) from January 2010 to January 2016. Evidence from both Table 7.3 and Figure 7.1
shows that during 2015, the risk index was adversely or positively influenced by the following
variables42:
The rand/dollar exchange rate has depreciated (√)
Interest rates have increased (x)
Inflation has decreased(√)
Oil prices have decreased (√)
Sugar prices have increased(√)
Gold price has increased(√)
Credit extended has increased (√)
Electricity supply has increased(√)
Both Table 7.3 and Figure 7.1 suggest that the behaviour or change of one of these
variables has increased the economic risk and the remaining seven have decreased the
42
A cross on a variable indicates a negative effect while a tick implies a positive influence on a risk index.
50.00
100.00
150.00
200.00
250.00
300.00
350.00
400.00
450.00Jan-1
0
Feb
-10
Mar-
10
Ap
r-10
May-1
0
Jun
-10
Ju
l-10
Au
g-1
0
Sep-1
0
Oct-
10
No
v-1
0
Dec-1
0
Jan-1
1
Feb
-11
Mar-
11
Ap
r-11
May-1
1
Jun
-11
Ju
l-11
Au
g-1
1
Sep-1
1
Oct-
11
No
v-1
1
Dec-1
1
Jan-1
2
Feb
-12
Mar-
12
Ap
r-12
May-1
2
Jun
-12
Jul-
12
Au
g-1
2
Sep-1
2
Oct-
12
No
v-1
2
Dec-1
2
Jan-1
3
Feb
-13
Mar-
13
Ap
r-13
May-1
3
Jun
-13
Ju
l-13
Au
g-1
3
Sep-1
3
Oct-
13
No
v-1
3
Dec-1
3
Jan-1
4
Feb
-14
Mar-
14
Ap
r-14
May-1
4
Jun
-14
Ju
l-14
Au
g-1
4
Sep-1
4
Oct-
14
No
v-1
4
Dec-1
4
Jan-1
5
Feb
-15
Mar-
15
Ap
r-15
May-1
5
Jun
-15
Ju
l-15
Au
g-1
5
Sep-1
5
Oct-
15
No
v-1
5
Dec-1
5
Jan-1
6
Rand Dollar (Rand per USD)
Interest Rate (R204= %)
Inflation (pa %)
Oil Price (USD)
Sugar Price (US cents per pound)
Gold Price (USD)
Credit extended to the domestic private sector (Rm)
Electricity generated and available for distribution (Gigawatt-hours)

79
economic risk in the provincial economy. The calculation of economic risk or conditions
monitor for KZN and each of the provincial six regions is presented in appendix B.
7.3 Economic risk or conditions monitor for KZN
The results for the province and each of the six regions are displayed in Figure 7.2 and
Table 7.4. The results have been smoothed using a twelve month moving average method
because of the inclusion of monthly data in the calculations. The monitor should be
interpreted as follows:
Positive numbers: Low or decreasing risk
Zero: Neutral risk
Negative numbers: High or increasing risk
Figure 7.2: Economic risk or conditions monitor, January 2010 to January 2016
Source: Own calculations using KZN Economic Model, 2016
-1.20
-1.00
-0.80
-0.60
-0.40
-0.20
0.00
0.20
0.40
0.60
0.80
1.00
1.20
1.40
Ja
n-1
0
Mar-10
May
-10
Ju
l-1
0
Sep
-10
No
v-1
0
Ja
n-1
1
Mar-11
May
-11
Ju
l-1
1
Sep
-11
No
v-1
1
Ja
n-1
2
Mar-12
May
-12
Ju
l-1
2
Sep
-12
No
v-1
2
Ja
n-1
3
Mar-13
May
-13
Ju
l-1
3
Sep
-13
No
v-1
3
Ja
n-1
4
Mar-14
May
-14
Ju
l-1
4
Sep
-14
No
v-1
4
Ja
n-1
5
Mar-15
May
-15
Ju
l-1
5
Sep
-15
No
v-1
5
Ja
n-1
6
KZN Durban
PMB Rbay
Newcastle Port Shepstone
Ilembe

80
Table 7.4: Economic risk or conditions monitor, January 2014 to December 2015
Source: Own calculations using KZN Economic Model, 2015
The average risk index for the province and each of the regions for the period 2010 to 2015
is displayed in Table 7.5.
Table 7.5: Average economic risk or conditions monitor for the period 2010 to 2015
Source: Own calculations using KZN Economic Model, 2015
7.4: KZN risk index and KZN GDP
Figure 7.3 shows the behaviour of the KZN risk index and KZN GDP growth from 1998 to
2015. Prior to 2013, there had only been two years where the provincial risk index was
higher than the provincial GDP that was in 1998 and 2008. Both years were characterised by
very low economic output followed by strong economic recovery. Time will tell whether
history will dictate if the current period of low economic output will also be followed by strong
economic recovery.
KZN Durban PMB Richards Bay Newcastle Port Shepstone Ilembe
Jan-14 2.0 1.9 1.9 1.7 2.3 2.7 2.3
Feb-14 -0.9 -0.9 -0.9 -0.7 -1.1 -1.3 -1.1
Mar-14 0.8 0.7 0.8 0.8 0.8 0.8 1.0
Apr-14 -0.3 -0.2 -0.3 -0.2 -0.3 -0.4 -0.3
May-14 0.2 0.2 0.2 0.2 0.2 0.1 0.2
Jun-14 -0.3 -0.3 -0.3 -0.3 -0.2 -0.2 -0.4
Jul-14 1.0 1.0 0.9 1.0 0.9 0.9 1.1
Aug-14 0.3 0.4 0.3 0.3 0.2 0.2 0.1
Sep-14 1.3 1.4 1.2 1.2 1.2 1.4 1.4
Oct-14 1.4 1.4 1.3 1.4 1.3 1.3 1.3
Nov-14 1.0 1.1 1.0 1.0 0.9 1.0 0.9
Dec-14 4.7 4.8 4.3 4.5 4.4 4.7 4.6
Jan-15 3.3 3.1 2.9 3.1 3.7 4.1 3.3
Feb-15 -3.1 -3.0 -2.7 -2.9 -3.0 -3.5 -3.4
Mar-15 2.5 2.5 2.4 2.2 2.7 3.0 2.5
Apr-15 -2.7 -2.7 -2.4 -2.5 -2.7 -3.1 -2.9
May-15 1.4 1.4 1.3 1.3 1.5 1.7 1.5
Jun-15 -0.3 -0.3 -0.3 -0.4 -0.4 -0.4 -0.5
Jul-15 3.0 3.0 2.7 2.8 3.0 3.3 3.2
Aug-15 1.3 1.3 1.2 1.1 1.5 1.7 1.1
Sep-15 1.1 0.9 0.8 1.2 1.0 1.2 1.6
Oct-15 -8.9 -8.2 -8.8 -7.8 -10.7 -11.8 -10.2
Nov-15 1.9 1.8 1.6 1.9 1.8 1.9 2.2
Dec-15 3.1 3.0 2.6 2.9 3.1 3.7 3.4
KZN Durban PMB Rbay Newcastle Port Shepstone Ilembe
2010 -0.4 -0.4 -0.3 -0.3 -0.3 -0.4 -0.4
2011 -0.2 -0.2 -0.2 -0.1 -0.1 -0.1 -0.1
2012 0.3 0.3 0.3 0.3 0.3 0.4 0.3
2013 0.4 0.4 0.4 0.3 0.4 0.4 0.4
2014 0.4 0.4 0.4 0.4 0.4 0.4 0.4
2015 1.0 1.0 0.9 0.9 1.0 1.1 1.0

81
Figure 7.3: KZN risk index and KZN GDP43, 1998 to 2015
Source: Own calculations using KZN Economic Model, 2015
7.5 Interpretation of the monitor
The results suggest that the economic risk in the province during 2015 was consistently fairly
low and improved further during the latter part of 2015, especially when compared to the
previous years. Furthermore, the risk index suggests that economic conditions in the KZN
province was positive based on seven variables. Fortunately, the outlook also seems to be
even further improving during the early months of 2016, especially given the behaviour of the
international oil price. The major risk factors for 2015 are the availability of electricity and
water, increasing inflation and interest rates and the continuous fiscal pressure.
The immediate past, current and risk or economic outlook conditions “should” support the
economic outlook of the province during 2016, but unfortunately, given the “bad” business
and consumer confidence numbers and the monetary and fiscal constraints, only a marginal
result has occurred.
The results also suggest that economic risk during 2015 was the highest in the
Pietermaritzburg and Richards Bay economies, whilst it was the lowest in the Port
Shepstone and Durban economies.
43
KZN GDP is on the left axis (% growth) and KZN risk index is on the right axis (value)
-1.00
-0.50
0.00
0.50
1.00
1.50
-3.00
-2.00
-1.00
0.00
1.00
2.00
3.00
4.00
5.00
6.00
7.00
1998 1999 2000 2001 2002 2003 2004 2005 2006 2007 2008 2009 2010 2011 2012 2013 2014 2015
KZN GDP KZN Risk

82
Chapter 8: The Environment of Small
Business in KZN
8.1 Introduction
This chapter examines the survey on the environment of small businesses in the province of
KwaZulu-Natal (KZN). This survey is similar to others that have been conducted before
where attempts have been made to understand and facilitate the development and growth of
small businesses. Small Businesses are defined as a distinct business entities, including
cooperative enterprises and non-governmental organizations, managed by one owner or
more which, including its subsidiaries, if any, is mostly carried on in any sector or sub-sector
of the economy (Agupusi, 2007).
8.2 Background and methodology
This study was conducted to address the significant matter of “red tape”, which has a
massive effect on the small business. “Red tape” is an ambiguous term because it is widely
documented that for many businesses, it embraces the entire experience of engagement
with the government. It has been recognized that “red tape” is a focal issue in a number of
previous surveys and studies conducted internationally, nationally and regionally and very
similar results and conclusions have been drawn.
In addition, the compliance processes involved in understanding the purpose and processes
of the legislation, obtaining relevant and correct information, waiting periods, courtesy of
staff, and the general sense of fair and equitable treatment missing end of sentence. This
survey was conducted using a structured questionnaire that was formulated so as to profile
the performance of small businesses across a range of sectors. There were 2 500
questionnaires that was distributed among five selected districts, however, only 1 934
responses were received. This contributes to 77.4 per cent of the total responses. The
number of non-response reduced the sample size, but it did not compromise the validity of
the major findings of the survey.
The survey was intended to solicit the views of a representative sample of small businesses
in five KZN districts. Collectively, these districts were known to represent 80 per cent of the
provincial economy and were therefore considered to be an adequate representation of the

83
prevailing circumstances of small businesses in the province. The selected districts or
metropolitan authority areas which were targeted were UMsunduzi, eThekwini, Newcastle,
Umhlathuze and Hibiscus Coast.
Figure 8.1: Sample locations
Source: Own calculations
The named areas in (Figure 8.1) indicate the targeted districts in KZN. The percentage
contributed by each district is as follows: UMsunduzi (26.2 per cent); eThekwini (35.1 per
cent); Newcastle (12.4 per cent); UMhlathuze (14.1 per cent) and Hibiscus Coast (12.2 per
cent). The survey mainly focuses on four sectors: Extractive, Transformative, Consumer
Services and Business Services. These four sectors also have other sub-sectors within them
- (Extractive: Agriculture, Forestry and Fishing, Mining); (Transformative: Construction,
Manufacturing, Transport, Communications, Utilities and Wholesale); (Consumer Services:
Motor and Vehicle, Hospitality, Personal, Education, Recreation); (Business Services:
Finance, Insurance, Real Estate).

84
Figure 8.2: Response received from sectors by percentages in 2015
Source: Own calculations, 2015
Figure 8.2 shows the dominance of the consumer services compared to other sectors, since
it contributed 50.8 per cent, followed by the transformative sector with a contribution of 29.3
per cent. However, the extractive sector contributed the lowest responses of 1.9 per cent.
8.3 Global overview of the small business
The global small and medium sized enterprises hold greater potential for employment
creation than do large enterprises. A 13-year study conducted in the US during 1990-2003,
demonstrated that small businesses create a significant more employment opportunities
than large businesses (Edmiston, 2007:78). The Global Entrepreneurship Monitor (GEM)
records that 73 per cent of employment occurs in firms that have fewer than 50 employees,
yet 45 per cent of employment occurs in firms with fewer than 10 employees (GEM, 2010).
The challenge to create a business climate that is conducive to facilitating new business
formation and support is a formidable one. South African research completed in 2006 (GTZ,
2006) makes the case for improvements built upon a foundation of a better public or private
1.9%
29.3%
50.8%
18.0%
Extractive Transformative Consumer Services Business Services

85
dialogue that addresses key dimensions of the business climate that includes processes of
governance, policy and regulation, government capacity development and access to
business services and infrastructure. The recent studies in the United Kingdom (UK) (BIS
Small Business Survey 2011) and South Africa (SA) (SPB, 2011) indicate the value of
longitudinal studies in assessing small business development and in creating a favourable
business climate for small business. Studies, such as this one that provide a “snapshot” at a
point in time are useful but do not portray trends that reveal the manner and direction in
which changes are occurring, other than in the very short-term.
8.4 National overview of small businesses
Since the structural change in 1994, small, medium and micro enterprises (SMMEs) grew at
a moderate growth rate. Currently, there are 107 724 enterprises in the manufacturing
sector, and 42 per cent of these enterprises are attributed to be in the growing phase of
SMMEs (Department-of-Trade-and-Industry, 2005 - 2007). SMMEs in SA have a positive
impact on GDP because they generate income.
The most referenced national survey on how cost impacts on compliance was completed by
Strategic Partnerships for Business Growth in Africa (SPB) in 2004. The estimated total
costs of compliance in SA was 6,5 per cent of the GDP; this was in contrast to compliance
costs in other countries. The cost burden of regulation, as a proportion of operating
expenses, falls more heavily on small businesses rather than large businesses, mostly
because of the legislation that is applicable to most business types and sizes.
The SPB in SA (2011) reinforces the challenges that confront SA in attempting to stimulate
the development and growth of small businesses. As result, the government’s target to
create five million jobs over the next ten years has been translated into 13 600 new
manufacturing businesses and a total of 100 000 new businesses overall (SPB, 2011). It
could be noted that less than 4 per cent of start-up businesses take on new employees.
The requirement to create employment through the medium and small businesses will
require a paradigm shift in thinking and practices relative to small business development. A
focus on the “red tape” and bureaucracy alone will not achieve this change; thoughts also
need to focus on how to help small businesses survive.

86
8.5 Small business performance in KZN
The aim of this study was to examine the profile of small businesses in various sectors in
KZN with a view to determining the distribution of small businesses among sectors and also
to profile them in terms of their turnover, employment, financial access, and their business
constraints. This study was conducted to address the significant matter of “red tape”, which
has a massive effect on the small business in KZN.
8.5.1 Small business turnover
There was a noticeable decrease in turnover throughout sectors. The consumer service
sector decreased by 40 per cent, probably because the study was conducted at the time of
general economic downturn. This also underscores the reality of a very uncertain trading
environment for small businesses. The predominant influencing factor relative to a changing
turnover performance is an economic recession. This was confirmed in this study as 60 per
cent of respondents recorded this as being the most significant factor that also impinged on
their requirements to grow their labour force. The second most significant factor (29 per
cent) was related to local competition.
Figure 8.3: Turnover percentage by sectors
Source: Own calculations, 2015
The information stated in Figure 8.3 suggests that the turnover performance over the
previous 12 months had either decreased by 40 per cent (Consumer Services) or remained
Extractive Transformative Consumer Services Business Services
32.0% 35.0%29.0%
36.0%
24.0%
35.0%40.0% 31.0%
44.0%
30.0% 31.0% 34.0%
Increase Decrease No Change

87
the same (Extractive – 44.0 per cent). Business Services improved their turnover
performance by 36 per cent. However, this was marginally followed closely by the
Transformative Sector, who improved their performance by 35 per cent.
8.5.2 Employment created by small businesses
Small businesses are viewed as a crucial source for creating job opportunities and also
generating income in more developing countries. However, an analysis of this survey depicts
that employment had a very small impact. The gender and race profile shows that 52 per
cent of small business employees are drawn from the African community (28 per cent male;
24 per cent female), with White and Asian ethnic groups approximating 20 per cent each and
Coloured employees making up the balance of 8 per cent. The survey also showed that
there was also very little reported tendency to employ seasonal workers, even within the
hospitality sector where general economic stringency is curtailing retail activity, lengths of
stay and holiday expenditure, even in traditional holiday destination areas for example: Port
Shepstone.
Figure 8.4: The percentage of employees employed by sectors
Source: Own calculations, 2015
Extractive Transformative Consumer
Services
Business Services
69.0%62.0%
80.0%72.0%
28.0%34.0%
19.0%24.0%
3.0% 4.0% 2.0% 4.0%
0-9 Employees 10-49 Employee 50-100 Employee
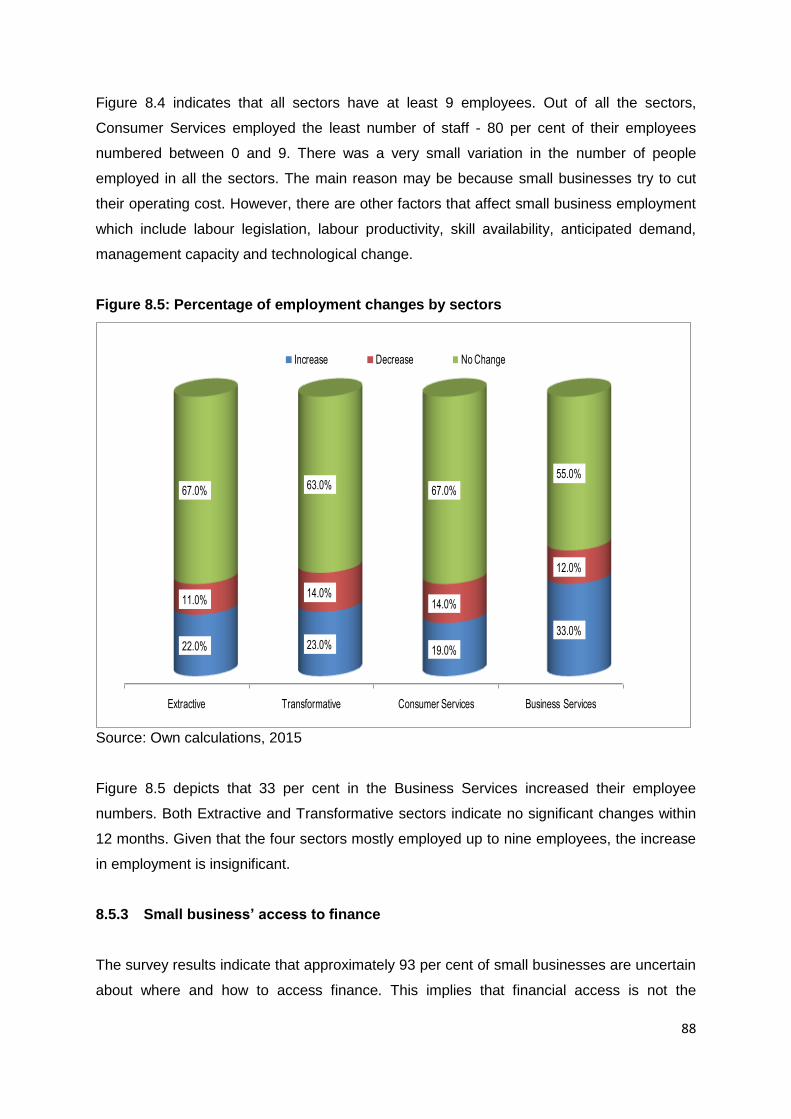
88
Figure 8.4 indicates that all sectors have at least 9 employees. Out of all the sectors,
Consumer Services employed the least number of staff - 80 per cent of their employees
numbered between 0 and 9. There was a very small variation in the number of people
employed in all the sectors. The main reason may be because small businesses try to cut
their operating cost. However, there are other factors that affect small business employment
which include labour legislation, labour productivity, skill availability, anticipated demand,
management capacity and technological change.
Figure 8.5: Percentage of employment changes by sectors
Source: Own calculations, 2015 Figure 8.5 depicts that 33 per cent in the Business Services increased their employee
numbers. Both Extractive and Transformative sectors indicate no significant changes within
12 months. Given that the four sectors mostly employed up to nine employees, the increase
in employment is insignificant.
8.5.3 Small business’ access to finance
The survey results indicate that approximately 93 per cent of small businesses are uncertain
about where and how to access finance. This implies that financial access is not the
Extractive Transformative Consumer Services Business Services
22.0% 23.0% 19.0%
33.0%
11.0%14.0%
14.0%
12.0%
67.0% 63.0% 67.0%
55.0%
Increase Decrease No Change

89
fundamental problem for businesses; however, the main problem is the knowledge and
understanding of the support that may or may not be available. The survey results indicate
that 67 per cent of respondents were happy with the range of banking services provided, 15
per cent had successfully applied for venture finance, but 64 per cent had not realised that
such support is available.
This scenario correlates well with the recent findings of the SPB which recorded that 60 per
cent of small businesses use their own resources (SPB, 2011). They also noted that only
two per cent accessed funding from the Industrial Development Corporation (IDC), eight per
cent used banks and six per cent obtained funds from private investors or shareholders.
Figure 8.6: Percentage for financial support for small businesses
Source: Own calculations, 2015
Figure 8.6 shows that 33 per cent of the small businesses appealed for further government
support; this may be because the owners found bank charges to be excessively expensive
(26 per cent). The results of the survey indicate that small businesses require a review of
their policies and practices.
8.5.4 Limitations for small businesses
This survey identified various challenges that negatively impinge on small businesses ability
to survive and grow. The policy implementation for illegal trading is understood to be
0%
5%
10%
15%
20%
25%
30%
35%
Government
Support
Strict Lending
Criteria
Insufficient
Support
High Bank
Charges
Awareness
Needed
33%
19%16%
26%
7%

90
inadequately engaged, including foreign trader activities and informal business activities. It is
important to note that although compliance costs form one of the biggest obstacles to small
business growth and development in the KwaZulu-Natal province, the government has not
selected a specific benchmark in terms of which compliance costs can be reduced.
Regulators did not want to select a benchmark as they argued that compliance costs need to
be continuously reduced, even if they are relatively low.
Figure 8.7: The percentage indicating limitations for small businesses
Source: Own calculations, 2015
Figure 8.7 illustrates the challenges that small businesses faced when they entered into the
market. These challenges facing the small businesses include service delivery (27 per cent),
cost of doing business (21 per cent) and illegal traders (19 per cent) because of the
existence of cheap foreign goods that are unregulated.
8.6 Conclusion
The findings of this study require further validation. The study and the supporting interviews
(although limited) that were conducted indicate a more complex set of circumstances than
simply an evaluation of “red tape” as an impediment to small business development. SA
shares the burdens that are common in many African countries, such as education and a
0%
5%
10%
15%
20%
25%
30%
19%
6% 7%
27%
21%
5% 4%
10%

91
training system that lacks a developmental orientation, non-coherent government policies in
terms of achieving important objectives, and misallocated or inaccessible finance. In
addition, SA carries the burden of its political history followed by redress programmes that
are perceived by many to be diluting the energy that might otherwise be mobilized.
The process of small businesses to create job opportunities and growth require further
investigations, not only to validate this finding but also to establish the reasons for the
apparent absence of incentives to start new businesses and to grow existing businesses. In
addition, the whole mechanism of public funding provisions for the support and growth of
small businesses need to be examined in order to develop frameworks so that the available
resources within KZN can be used more effectively.

92
Chapter 9: Economic Freedom and
Economic Growth44
9.1 Introduction
The relationship between economic freedom and growth has been studied and debated by
economists since Adam Smith45. It has been generally argued that free economies will be
more productive. Economic freedom is considered to be the ultimate incentive for the optimal
use of scarce resources, by creating a favourable environment for healthy competitiveness
and stimulating human creativity. In a free private market, individuals have the freedom to
choose what to consume, to produce, and to give. The invisible hand leads free economic
agents to pursue their own interests and voluntarily cooperate with others (Smith; cited in
Gwartney and Lawson, 2002).
It is common knowledge that large differences exist in the economic growth and
development of countries around the world. An extensive literature review finds numerous
factors that taken together; explain why certain countries experience greater rates of income
and employment growth than others. The most cited factors contributing to economic growth
include the stock of human capital, investment in technology, trade specialization and foreign
direct investment (FDI), and low levels of political corruption (Gwartney, 2009).
The author further presents a more recent literature, which has explored the role of
economic and political institutions in the economic growth of countries. He also presents
studies which have shown that countries with greater economic freedom, meaning the
protection of private property and private markets operating with minimal government
interference, have greater rates of economic growth than countries with lower levels of
economic freedom.
According to Gwartney and Lawson (2002), the higher the level of economic freedom in a
country, the higher the country's prosperity. Baumol (2002) stated that the system of market
44
The views expressed in this chapter are those of the author and do not necessarily represent those of the KZN Provincial Treasury. 45
Adam Smith is one of the famous economists and moral philosopher who was the first economist to inquire about the nature and causes of the wealth of nations (1776).

93
economy is the engine of innovation that fuel growth. While Dutz and Hayri (2000) found a
correlation between long-term growth with competitive policies.
9.2 Economic freedom conceptualised
The Heritage Foundation publishes on an annual basis an Index of Economic Freedom (IEF)
report. The report is published in partnership with the Wall Street Journal (WSJ). Economic
freedom, according to the Heritage Foundation is the fundamental right of every human to
control his or her own labour and property. In an economically free society, individuals are
free to work, produce, consume, and invest in any way they please. The government allows
labour, capital, and goods to move freely.
The Fraser Institute also publishes an Economic Freedom of the World (EFW) annual report.
Economic freedom is an individual’s ability to make their own economic decisions without
interference or limitations by the government or the government’s protection of anti-market
behaviour who may be in favour of such powerful groups who may abuse this power to limit
market choices. The cornerstones of economic freedom, according to the Fraser Institute
are: personal choice rather than collective choice, voluntary exchange coordinated by
markets rather than allocation via the political process, freedom to enter and compete in
markets and the protection of persons and their property from aggression by others.46
According to Gwartney and Lawson (2002), economic freedom is complex and multi-
dimensional and this makes it difficult to quantify. Its measurement should, therefore, be
based on objective quantifiable data and transparent procedures. The researchers’
subjective views should not influence the rating of any country. The goal should be to
develop an index that others, regardless of their political orientation, could replicate. Beach
and Kanestate (2008) argue that overall economic freedom, defined by multiple rights and
liberties, can be quantified as an index of less abstract components.47
The index conceived by Beach and Kane (2008) uses 10 specific freedoms, some as
composites of even further detailed and quantifiable components, including: business
freedom, trade freedom, fiscal freedom, government size, monetary freedom, investment
freedom, financial freedom, property rights, freedom from corruption and labor freedom. In
the IEF, all 10 factors are equally weighted so not to bias the overall score toward any one
46
See Economic Freedom of the World, available online: https://en.wikipedia.org/wiki/Economic _Freedom_of_the_World, accessed on 6 February 2016. 47
Beach, WW and Kane, T (2008): Methodology: Measuring the 10 Economic Freedoms, available
online: http://www.appstate.edu/~ehrhardtgc/Economic_freedom_codebook.pdf.

94
factor or policy direction. The IEF then offers a simple composite based on an average of
the 10 freedoms (Beach & Kane, 2008).
The EFW index contains 21 individual components. A diverse set of objective variables are
employed and they provide a good measure of cross-country differences in size of
government, access to sound money, openness of international trade, and regulation of
capital markets. However, important dimensions are omitted because of data limitations and
measurement problems. In some cases, potential components are omitted because the
required data is only available for a small number of countries. In other instances, omissions
reflect the difficulties involved in the development of an objective measure (Gwartney &
Lawson, 2002).
The authors further maintained that the EFW index measures the degree of economic
freedom present in five major areas, namely: size of government expenditures, taxes and
enterprises, legal structure and security of property rights, sound money, freedom to trade
with foreigners and regulation of credit, labour, and business.
The Heritage Foundation measures economic freedom based on 10 quantitative and
qualitative factors, grouped into four broad categories, or pillars, of economic freedom,
namely: rule of law (property rights, freedom from corruption), limited government (fiscal
freedom, government spending), regulatory efficiency (business freedom, labour freedom,
monetary freedom), and open markets (trade freedom, investment freedom, financial
freedom). Each of the ten economic freedoms within these categories is graded on a scale
of 0 to 100. A country’s overall score is derived by averaging these ten economic freedoms,
with equal weight being given to each.
9.3 Does economic freedom matter?
The study conducted by Panahi, Assadzadeh and Refaei (2014) focused on the impact of
economic freedom on economic growth. They investigated the relationship between
economic freedom and economic growth using data from 13 selected Middle East and North
Africa (MENA) countries over the period of 2000 to 2009.
The study makes use of two models. First, a variety of control variables that may affect a
country’s growth rate were employed, and an estimation of the model with the overall index

95
of economic freedom was made. In the next step, the economic freedom index was broken
down into the categories in constructing the index.
The model is defined as:
𝐿𝑅𝐺𝐷𝑃𝑝𝑐 = 𝛽0 + 𝛽1𝐿𝐸𝐶𝐹𝑅 + 𝛽𝑖∑𝐿𝑍𝐼 + ε𝐼 (9.1)
Where 𝐿𝑅𝐺𝐷𝑃𝑝𝑐 is real gross domestic product per capita in 2000 constant dollars, and
𝐿𝐸𝐶𝐹𝑅 is economic freedom indicators, ∑z is a control variable ε is a stochastic error term.
The standard control vector includes government share of the gross domestic product
(GDP0, investment share of the GDP, total area of a country and primary school enrolment.
The data on economic freedom was reported in the various EFW Annual Reports.
Thereafter, the panel characteristics of the dataset were taken into account and an
estimation of random and fixed effects models were made.
Using data from 2004 to 2014, Wulandari (2015) applied a positivist approach to find the
relationship between economic freedom and economic growth in Indonesia. The data used
in the study was obtained from the official website of the Central Bureau of Statistics of
Indonesia and the Heritage Foundation. The vector autoregression (VAR) model that was
applied follows the study conducted by Lee (1992). The results suggest that economic
freedom has a positive impact on economic growth which in turn has a positive influence on
economic freedom. This supports previous studies which stated that economic freedom
leads to growth. Market liberalization is a necessary institutional reform for a country
concerned with economic growth and social welfare.
Justesen (2006) stated that one prominent line of research which had gained momentum in
the last decade emphasised the role of economic freedom as an important determinant of
economic growth. Theoretically, the literature of economic freedom emphasises that the
extent to which countries possess free market institutions to protect property rights and
implement policies, and which provide for trade and voluntary exchange, is instrumental to
economic growth.
Similar to most studies, the main conclusion of the paper is that economic freedom does
matter for economic growth. However, the relationship between the individual components of
economic freedom and growth is rather complex, which for the purpose of empirical
research, highlights the importance of decomposing the indices of economic freedom.
Inherently, both the level of and changes in overall economic freedom appear to be a cause

96
of economic growth. The level of property rights appears to have a causal impact on growth,
whereas changes in property rights apparently do not Granger cause economic growth.
As for the relationship between economic growth and the component on (changes in) trade,
causality appears to run both ways. The only single component of economic freedom that
exerts a unidirectional Granger causal impact on economic growth regardless of model
specification is the component measuring regulation of business, labour and credit markets
(Justesen, 2006).
Garrett and Rhine (2010) extend earlier models of economic growth and development by
exploring the effect of economic freedom on United State (US) employment growth. Their
results reveal that economic freedom is a significant factor in state employment growth in
addition to the more traditional determinants of growth such as industrial diversity and
human capital. They find that the effect of economic freedom on state employment growth
varies depending on the time period studied and which economic freedom index is used.
Gorlach and Le Roux (2013) investigated the relationship between economic freedom, in
aggregate and on an individual component basis, focusing on economic growth in the
Southern African Development Community (SADC) countries. Their study seems to confirm
the a-priori expectations of freer and more open economies experience higher growth rates.
Similarly, public debt and GDP are inversely related, and are significant at the 1 per cent
level of confidence. Therefore, the a-priori expectation is that public debt negatively affects
growth. According to the authors, an interesting result to take note of is the strong positive
and highly significant relationship of the freedom components amongst each other.
Therefore, a country, by improving one aspect of economic freedom can automatically
increase its freedom in another category and experience a multiplier effect on growth rates.
The empirical results from the study by Gorlach and Le Roux (2013) confirm that economic
freedom is positively related to economic growth in the SADC countries. More importantly,
economic freedom is found to Granger-cause48 economic growth. Therefore, increasing the
levels of economic freedom leads to higher GDP per capita growth rates.
48
Granger causality is a term used for a specific notion of causality in time-series analysis. It states
that a variable, for instance X causes another variable such as Y, if Y can be better predicted using
the histories of both X and Y then it can be used to predict the history of Y.

97
9.4 Why economic freedom matters
The three most comprehensive studies that attempt to measure economic freedom and
publish the results thereof are the Heritage Foundation’s Index of Economic Freedom, the
Fraser Institute’s Economic Freedom of the World Index, and the Freedom House’s
Freedom in the World Index. The Heritage Foundation’s Index of Economic Freedom results
have shown that sustaining such economic dynamism is achievable only when governments
adopt economic policies that empower individuals and firms with more choices, encouraging
greater entrepreneurship.
Notably, are the fundamental benefits that stem from the strong positive relationship
between economic freedom and levels of per capita income. For countries achieving scores
in the index that reflect even moderate levels of economic freedom (60 or above), the
relationship between economic freedom and per capita GDP is highly significant.49
Greater economic freedom has had a positive impact not just on the number of people in
poverty, but also on the intensity of the poverty still experienced by some. Poverty intensity
as measured by the United Nations Development Programme’s Multidimensional Poverty
Index, which assesses the nature and intensity of deprivation at the individual level in
education, health outcomes, and standard of living, is much lower on average in countries
with higher levels of economic freedom.50
The positive link between economic freedom and higher levels of innovation ensures greater
economic dynamism in coping with various developmental challenges, and the most
remarkable improvements in clean energy use and energy efficiency over the past decades
have occurred, not as a result of government regulation, but rather because of advances in
technology and trade.51
According to the Fraser Institute’s annual report, EFW, based on 2013 statistics (the most
recent year of available data)52, the top 10 most economically free jurisdictions are Hong
Kong, Singapore, New Zealand, Switzerland, United Arab Emirates, Mauritius, Jordan,
Ireland, Canada, with the United Kingdom and Chile tying for 10th place. The US, once
49
See Heritage (2016): Economic Freedom: The Proven Path to Prosperity, accessed on 08/02/2016 and available online: http://www.heritage.org/index/book/chapter-1 50
See footnote number 5. 51
See footnote number 5 . 52
See the report which is available online: www.freedomhouse.org/report/freedom-world/freedom-world-2015, accessed on 2/12/2016.

98
considered a bastion of economic freedom, now ranks 16th in the world after being as high
as second in 2000. The 10th lowest-ranked countries are Angola, Central African Republic,
Zimbabwe, Algeria, Argentina, Syria, Chad, Libya, Republic of Congo, and Venezuela. Some
despotic countries such as North Korea and Cuba can’t be ranked due to lack of data.
In EFW annual report, Rode, Knoll, and Pitlik (2013) focus on the life satisfaction outcomes
of economic freedom and democracy, showing that there is a welfare benefit derived from
living in an economically free society that goes beyond pure income-enhancing effects.
Crisp, Rode, Knoll, and Pitlik (2013) further states that in a parallel manner, it has been
shown that economic freedom exerts an independent impact on life satisfaction over and
above its impact on per-capita income levels and other indicators of material well-being.
Following Buchanan’s (2005) ground-breaking research, Rode, Knoll, and Pitlik (2013)
examined the impact of economic institutions which were built on the principle of free choice
upon individual perceptions of life control. They also considered the potential benefit that
accrues to individuals in terms of their life satisfaction.
Their findings indicate that living in a country with high overall economic freedom is a
relevant determinant of feeling in control of one’s own life. As one might expect, a substantial
share of the impact of economic freedom on life satisfaction is actually channelled through
life control. Therefore, economic freedom also influences individual happiness by giving
people the feeling of being more in control of their own lives and having the freedom to
choose between different options in the market.
According to the Freedom House Freedom in the World 2015 Report, countries with declines
in freedom have out-numbered those with gains for the past nine years (Figure 9.1).The
report further states that the number of countries designated by Freedom in the World as
Free in 2014 stood at 89, representing 46 per cent of the world’s 195 countries and nearly
2.9 billion people or 40 per cent of the global population. The number of countries qualifying
as partly free stood at 55, or 28 per cent of all countries assessed, and they were home to
just over 1.7 billion people, or 24 per cent of the world’s total population.
The number of partly free countries decreased by four from the previous year. A total of 51
countries were deemed not free, representing 26 per cent of the world’s population. The
number of people living under not free conditions stood at 2.6 billion people, or 36 per cent
of the global population, though it is important to note that more than half of these people

99
live in just one country, namely China. The number of not free countries increased by three
from 2013.
The report also concludes that in a new and disquieting development, a number of countries
lost ground due to state surveillance, restrictions on internet communications, and curbs on
personal autonomy. Its ratings for the Middle East and North Africa region were the worst in
the world, followed by Eurasia. The Worst of the Worst countries are the Central African
Republic, Equatorial Guinea, Eritrea, North Korea, Saudi Arabia, Somalia, Sudan, Syria,
Turkmenistan and Uzbekistan.
Figure 9.1: Number of countries showing improvement or decline in economic
freedom, 2005 to 2014
Freedom House, 2015
9.5 South Africa’s (SA's) ranking in economic freedom
Figure 9.2 displays SA’s freedom according to the Heritage Foundation’s IEF. The economic
freedom score of 100 represents the most free and 0 the least free. The country is currently
ranked 80 out of 186 most free countries in the 2016 index. SA remains in the ranks of the
“moderately free”. The country is ranked 6th in the 46 Sub-Saharan Africa countries. The
trend line suggests a steady regression with regard to economic freedom, especially post
2005.

100
Figure 9.2: South Africa’s economic freedom ranking, 1995 to 2016
Source: Heritage Foundation’s IEF, 2015
Table 9.1 reflects on the long-term score change between 1995 and 2015. The biggest gains
in economic freedom were recorded in trade and finance, whereas the biggest losses were
recorded in investment and business. The country also scored well on "Trade Freedom" and
"Monetary Freedom". There was, however, a concern on the "Rule of Law" and
"Management of Public Finance". The overall change in score since 2012 is -0.8.
Table 9.1 Long-term score change, 1995 to 2015
Source: Heritage Foundation’s Index of Economic Freedom, 2015
56
58
60
62
64
66
68
1995 1996 1997 1998 1999 2000 2001 2002 2003 2004 2005 2006 2007 2008 2009 2010 2011 2012 2013 2014 2015 2016
IEF Poly. (IEF)
Long-Term Score Change (since 1995)
Property Rights 0 Fiscal Freedom 8.4 Business Freedom -12.0 Trade Freedom 33.6
Freedom from Corruption -8.0 Government Spending 4.9 Labour Freedom 2.9 Investment freedom -20.0
Monetary Freedom 1.1 financial Freedom 10.0
RULE OF LAW GOVERNMENT SIZE REGULATORY EFFICIENCY OPEN MARKETS

101
According to the Fraser Institute’s annual report, EFW, based on the 2013 statistics, SA
received a rating of 96 out of 175 countries. Figure 9.3 displays SA's rating since 1995
suggesting a progressive regression post 2005. A score of 10 represents the most free and
zero the least free.
Figure 9.3: SA’s economic freedom rating, 1995 to 2014
Source: Fraser Institute’s, Economic Freedom of the World, 2014
9.6 Economic freedom and the economy of SA
The descriptive statistics for the four variables under consideration are presented in table
A9.1 (see appendix A). These variables are: GDP or annual percentage change (economic
growth rate), Heritage Foundation’s IEF, Fraser Institute’s EFW and Freedom House
Freedom in the World (FW). Table A9.1 shows that GDP, IEF and FW are normally
distributed whilst EFW is not.
Figure 9.3 suggests that economic freedom started decreasing post 2005. The 2005 year
was also evident when applying the polynomial (2nd order) function and the three-period
moving average function. The unit root test (test for stationarity of the variables using the
Augmented Dickey-Fuller test) indicates that the GDP variable and the three economic
freedom variables are indeed non-stationary in the level format and stationary in the 1st
difference format. This suggests the presence of a structural break in each of the three
6
6.2
6.4
6.6
6.8
7
7.2
7.4
7.6
7.8
8
1995 1996 1997 1998 1999 2000 2001 2002 2003 2004 2005 2006 2007 2008 2009 2010 2011 2012 2013 2014
EFW Linear (EFW) Poly. (EFW)

102
economic freedom variables, that is, an unexpected shift estimated to have happened circa
year 2005.
Table 9.2 displays the average annual economic growth rate for the two periods, between
1995 and 2004 as well as 2005 to 2014. The results suggest that the economy performed
better during the period of relative economic freedom, that is, 1995 to 2004 vis-à-vis the
period of decreasing economic freedom, 2005 to 2014.
Table 9.2: Economic freedom and economic growth, 1995 to 2014
Source: own calculations using Stats SA GDP publications
The first statistical analysis uses the cross-correlation function. Cross-correlation is a
measure of similarity of two series as a function of the lag of one relative to the other. The
results (see Table A9.2) suggest a lagged correlation or delayed response between
economic freedom and economic growth, that is, between 2 and 4 years. Interestingly, it
does not seem to be a lagged correlation between economic growth and economic freedom.
The second statistical analysis includes the Granger causality function. In essence, it tests
whether a variable X causes another variable Y in order to see how much of the current
values of Y can be explained by past values of Y and then to check whether adding lagged
values of X can improve the explanation. Y is said to be Granger-caused by X if X helps in
the prediction of Y, or equivalently, if the coefficients on the lagged X’s are statistically
significant. The results of the Granger causality tests (Table A9.3) suggest that economic
freedom does Granger cause economic growth and not the other way around.
Thirdly, the study analyses the effect of economic freedom on GDP growth using the three
measures of overall economic freedom:
𝑔𝑖
= 𝛼 + 𝛽1𝛾𝑖
+ 𝛽2𝐼𝑁𝑉𝑖 + 𝛿𝐸𝐹𝑖 + ε𝐼 (9.2)
Where 𝑔𝑖 is annual economic growth rate (percentage), 𝛾𝑖 is the annual percentage change
in gross national income per capita, and 𝐼𝑁𝑉𝑖 is the annual percentage change in gross fix
capital formation. According to Carlson and Lundström (2001), these variables are often
significant in growth and are almost standard for this type of model. 𝐸𝐹𝑖 is the value of the
GDP IEF EFW FW
Average 1995 to 2004 3.1 63.9 7.0 1.6
Average 2005 to 2014 2.7 62.9 6.8 1.9

103
economic freedom index during 1995 to 2014, while ε is a stochastic error term. Since the
variables are non-stationary in level format, the 1st difference values will be used, that is,
𝑑(𝑔𝑖). The results of the regression estimation suggest that income per capita and
investment are highly significant (Table 9.3). Economic freedom is only significant when
using the Fraser Institute’s EFW index.
Table 9.3: Regression results estimations using the three measures of economic
freedom: GDP growth
Source: Own calculations using data from Heritage Foundation’s Index of Economic Freedom Report
(2015), Fraser Institute’s, Economic Freedom of the World (2014), Freedom House, Freedom in the
World (2015) and Stats SA (2015).
Sometimes the process of estimation and inference becomes more complicated because of
the presence of endogenous variables on both sides of the equation (endogeneity in the
dependent and independent variables). Given the results of the above regression analysis, it
is plausible that economic freedom may be endogenous to economic growth making
Ordinary Least Square (OLS) an inappropriate estimator. The results of the Granger
causality tests (Table 8.3) suggests that economic freedom consistently predetermines
economic growth (economic freedom is endogenous) making the statistical findings on
economic growth and economic freedom spurious.
The VAR was first proposed by Sims (1980) since there is no need to worry about the
determination of endogenous and exogenous variables, all variables are considered as
endogenous variables.
The estimated results that are applied to the VAR model is based on a simple bivariate
function as shown in equations 9.3 and 9.4. We can let the time path of the {𝑔𝑡} be affected
by current and past realizations of the {𝑒𝑓𝑡} sequence and let the time path of the {𝑒𝑓𝑡}
sequence be affected by current and past realizations of the {𝑔𝑡} sequence. The VAR in d(1)
format system is as follows:
Coefficient P-Value Coefficient P-Value Coefficient P-Value
Y 0.70* 0.00 0.76* 0.00 0.84* 0.00
INV 0.07* 0.04 0.08* 0.02 0.05 0.14
EF -0.33 0.07 1.27* 0.03 1.49 0.14
Constant 0.01 0.99 -0.02 0.91 0.00 1.00
R-squared 0.78 0.8 0.78
F-statistic 22.63* 0.00 25.46* 0.00 20.64 0.00
Note: *: significant
Sum Squared
Residuals12.95 11.78 13.96
IEF EFW FWd(variable)

104
𝑔𝑡 = 𝑎10 + 𝑎11 𝑔𝑡−𝑖 + 𝑎12 𝑒𝑓𝑡−𝑖 + e1𝑡 (9.3)
𝑒𝑓𝑡 = 𝑎20 + 𝑎21 𝑔𝑡−𝑖 + 𝑎22 𝑒𝑓𝑡−𝑖 + e2𝑡 (9.4)
Where:
𝑔𝑡 is the annual economic growth rate, 1995 to 2014 (%)
𝑒𝑓𝑡 refers to the value of the economic freedom index, 1995 to 2014
i= 1….n
and where it is assumed (i) that 𝑔𝑡 and 𝑒𝑓𝑡are stationary; (ii)e1𝑡 and e2𝑡 are white-noise
disturbances with standard deviations of 𝜎𝑔 and 𝜎𝑒𝑓 respectively; and (iii) - the error terms
are uncorrelated. The amount of lag in the VAR model is determined on the information
criteria recommended by the Final Prediction Error (FPE) or Aike Information Criterion (AIC)
or Schwarz Criterion (SC) or Hannan-Quinn (HQ). The structure of the system incorporates
feedback since 𝑔𝑡 and 𝑒𝑓𝑡 are allowed to affect each other. The results of the VAR
estimation are presented in Table 9.4.
Table 9.4: VAR results estimations using the three measures of economic freedom:
GDP growth
Source: Own calculations using data from Heritage Foundation’s Index of Economic Freedom Report
(2015), Fraser Institute’s, Economic Freedom of the World (2014), Freedom House, Freedom in the
World (2015) and Stats SA (2015).
Table 9.4 indicates that economic growth is affected by the economic growth (one lag
period) and the lagged period 2 and period 4 of economic freedom using the Heritage
Foundation’s Index of Economic Freedom. The table also indicates that economic growth is
Coefficient T-stat Coefficient T-stat Coefficient T-stat
Economic growth(-1) (-)0.53* -2.92 -0.39 -0.99 -0.72 -1.64
Economic growth (-2) -0.35 -1.93 -0.44 -1.19 -0.55 -1.85
Economic growth (-3) -0.21 -1.15 -0.25 -0.65 -0.29 -1.26
Economic growth (-4) 0.02 0.12 -0.27 -0.77 -0.17 -0.99
Economic growth (-1) 0.05 0.16 1.94 1.03 -4.59 -0.1
Economic growth (-2) 0.65* 2.37 0.56 0.02 (-)13.58* -4.21
Economic growth (-3) 0.34 1.2 1.54 0.75 -1.38 -0.22
Economic growth (-4) 1.27* 5.02 1.04 0.53 -1.06 -1.1
R-squared 0.66 -0.40 -0.75
F-statistic 4.46 0.49 6.5
sum Squared Residuals 8.53 35.63 6.12
Note: *: significant
IEF EFW FWd(GDP)

105
affected by the lagged period 1 and period 2 of economic freedom using the Freedom House
Freedom in the World.
9.7 Conclusion
South Africa’s ranking in the three global economic freedom publications has steadily been
worsening post 2005. South Africa can be categorised as “partly free”. Over the same
period, SA’s economy has deteriorated with an economic growth estimate of below 1 per
cent for 2016. Growth theory and fairly extensive research seems to supports the economic
growth economic freedom nexus. The focus of economic freedom rests on two pillars, that
is, competition and individual responsibility. It is argued that under a competitive and
personal responsibility environment, the incentives for the optimal allocation and use of
scarce resources will be maximized.
The results of this study seem to support the finding of the previous studies, that is,
economic freedom is to have a positive and significant effect on economic growth. Economic
freedom, therefore, needs to be recognized as being potentially important for economic
growth.
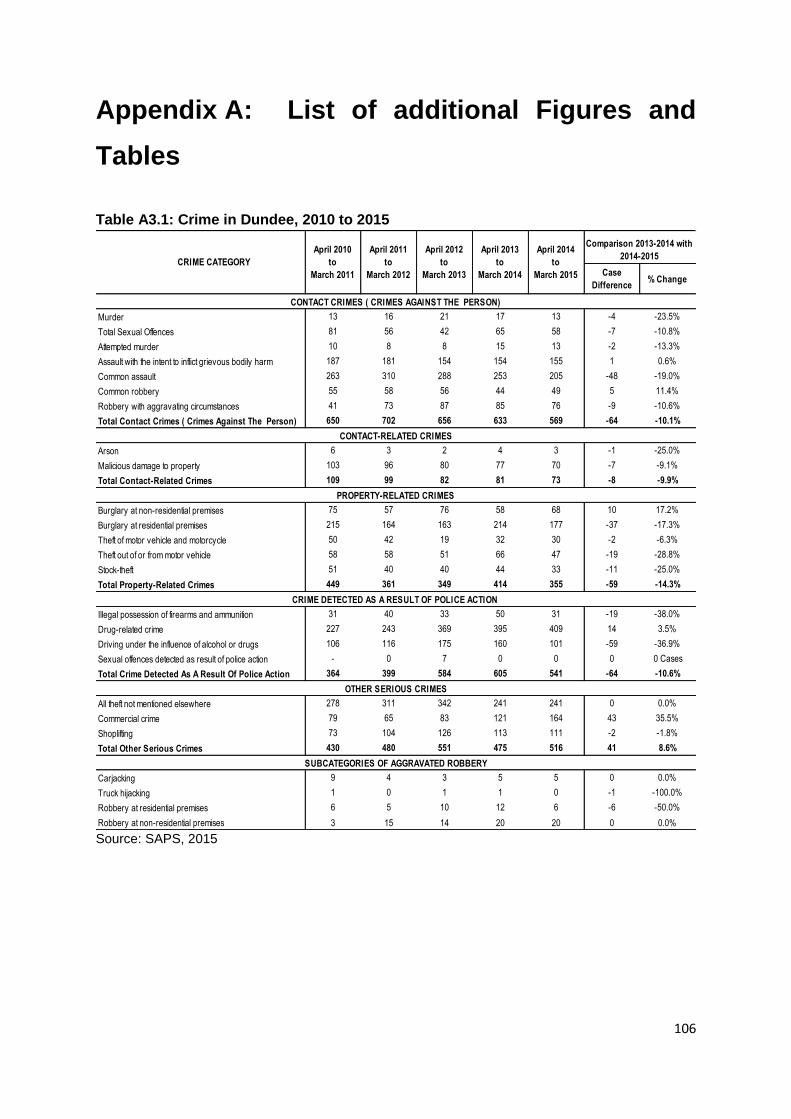
106
Appendix A: List of additional Figures and
Tables
Table A3.1: Crime in Dundee, 2010 to 2015
Source: SAPS, 2015
Comparison 2013-2014 with
2014-2015
Case
Difference% Change
Murder 13 16 21 17 13 -4 -23.5%
Total Sexual Offences 81 56 42 65 58 -7 -10.8%
Attempted murder 10 8 8 15 13 -2 -13.3%
Assault with the intent to inflict grievous bodily harm 187 181 154 154 155 1 0.6%
Common assault 263 310 288 253 205 -48 -19.0%
Common robbery 55 58 56 44 49 5 11.4%
Robbery with aggravating circumstances 41 73 87 85 76 -9 -10.6%
Total Contact Crimes ( Crimes Against The Person) 650 702 656 633 569 -64 -10.1%
Arson 6 3 2 4 3 -1 -25.0%
Malicious damage to property 103 96 80 77 70 -7 -9.1%
Total Contact-Related Crimes 109 99 82 81 73 -8 -9.9%
Burglary at non-residential premises 75 57 76 58 68 10 17.2%
Burglary at residential premises 215 164 163 214 177 -37 -17.3%
Theft of motor vehicle and motorcycle 50 42 19 32 30 -2 -6.3%
Theft out of or from motor vehicle 58 58 51 66 47 -19 -28.8%
Stock-theft 51 40 40 44 33 -11 -25.0%
Total Property-Related Crimes 449 361 349 414 355 -59 -14.3%
Illegal possession of firearms and ammunition 31 40 33 50 31 -19 -38.0%
Drug-related crime 227 243 369 395 409 14 3.5%
Driving under the influence of alcohol or drugs 106 116 175 160 101 -59 -36.9%
Sexual offences detected as result of police action - 0 7 0 0 0 0 Cases
Total Crime Detected As A Result Of Police Action 364 399 584 605 541 -64 -10.6%
All theft not mentioned elsewhere 278 311 342 241 241 0 0.0%
Commercial crime 79 65 83 121 164 43 35.5%
Shoplifting 73 104 126 113 111 -2 -1.8%
Total Other Serious Crimes 430 480 551 475 516 41 8.6%
Carjacking 9 4 3 5 5 0 0.0%
Truck hijacking 1 0 1 1 0 -1 -100.0%
Robbery at residential premises 6 5 10 12 6 -6 -50.0%
Robbery at non-residential premises 3 15 14 20 20 0 0.0%
SUBCATEGORIES OF AGGRAVATED ROBBERY
OTHER SERIOUS CRIMES
CRIME DETECTED AS A RESULT OF POLICE ACTION
PROPERTY-RELATED CRIMES
CONTACT-RELATED CRIMES
CONTACT CRIMES ( CRIMES AGAINST THE PERSON)
CRIME CATEGORY
April 2010
to
March 2011
April 2011
to
March 2012
April 2012
to
March 2013
April 2013
to
March 2014
April 2014
to
March 2015

107
Table A.3.2: Crime in Durban, 2010 to 2015
Source: SAPS, 2015
Comparison 2013-2014 with
2014-2015
Case
Difference% Change
Murder 38 42 39 41 29 -12 -29.3%
Total Sexual Offences 762 134 124 104 91 -13 -12.5%
Attempted murder 31 25 36 28 22 -6 -21.4%
Assault with the intent to inflict grievous bodily harm 364 325 310 333 295 -38 -11.4%
Common assault 812 878 787 634 577 -57 -9.0%
Common robbery 487 514 467 445 429 -16 -3.6%
Robbery with aggravating circumstances 899 924 885 951 982 31 3.3%
Total Contact Crimes ( Crimes Against The Person) 3 393 2 842 2 648 2 536 2 425 -111 -4.4%
Arson 2 2 0 1 0 -1 -100.0%
Malicious damage to property 390 329 378 386 332 -54 -14.0%
Total Contact-Related Crimes 392 331 378 387 332 -55 -14.2%
Burglary at non-residential premises 572 537 599 579 521 -58 -10.0%
Burglary at residential premises 153 184 199 194 192 -2 -1.0%
Theft of motor vehicle and motorcycle 670 584 668 620 570 -50 -8.1%
Theft out of or from motor vehicle 1 144 1 074 1 251 1 245 1 171 -74 -5.9%
Stock-theft 0 0 0 0 0 0 0 Cases
Total Property-Related Crimes 2 539 2 379 2 717 2 638 2 454 -184 -7.0%
Illegal possession of firearms and ammunition 73 87 91 49 57 8 16.3%
Drug-related crime 1 872 2 304 2 336 2 528 2 477 -51 -2.0%
Driving under the influence of alcohol or drugs 616 978 1 111 1 166 1 201 35 3.0%
Sexual offences detected as result of police action - 391 451 567 566 -1 -0.2%
Total Crime Detected As A Result Of Police Action 2 561 3 760 3 989 4 310 4 301 -9 -0.2%
All theft not mentioned elsewhere 2 933 3 219 3 418 3 390 2 872 -518 -15.3%
Commercial crime 1 228 1 158 1 141 1 127 969 -158 -14.0%
Shoplifting 1 843 1 958 1 840 1 694 1 589 -105 -6.2%
Total Other Serious Crimes 6 004 6 335 6 399 6 211 5 430 -781 -12.6%
Carjacking 36 37 38 39 35 -4 -10.3%
Truck hijacking 0 0 1 0 0 0 0 Cases
Robbery at residential premises 7 11 9 13 8 -5 -38.5%
Robbery at non-residential premises 56 65 66 67 95 28 41.8%
CONTACT CRIMES ( CRIMES AGAINST THE PERSON)
CONTACT-RELATED CRIMES
PROPERTY-RELATED CRIMES
CRIME DETECTED AS A RESULT OF POLICE ACTION
OTHER SERIOUS CRIMES
SUBCATEGORIES OF AGGRAVATED ROBBERY
CRIME CATEGORY
April 2010
to
March 2011
April 2011
to
March 2012
April 2012
to
March 2013
April 2013
to
March 2014
April 2014
to
March 2015

108
Table A3.3: Crime in Jozini, 2010 to 2015
Source: SAPS, 2015
Comparison 2013-2014 with
2014-2015
Case
Difference% Change
Murder 17 22 22 14 16 2 14.3%
Total Sexual Offences 88 94 86 92 46 -46 -50.0%
Attempted murder 18 18 18 11 19 8 72.7%
Assault with the intent to inflict grievous bodily harm 189 228 191 170 161 -9 -5.3%
Common assault 94 80 73 71 54 -17 -23.9%
Common robbery 15 26 37 27 24 -3 -11.1%
Robbery with aggravating circumstances 73 70 91 56 63 7 12.5%
Total Contact Crimes ( Crimes Against The Person) 494 538 518 441 383 -58 -13.2%
Arson 7 13 18 16 11 -5 -31.3%
Malicious damage to property 37 44 35 30 47 17 56.7%
Total Contact-Related Crimes 44 57 53 46 58 12 26.1%
Burglary at non-residential premises 58 58 66 58 55 -3 -5.2%
Burglary at residential premises 124 98 139 102 87 -15 -14.7%
Theft of motor vehicle and motorcycle 4 6 9 5 3 -2 -40.0%
Theft out of or from motor vehicle 18 19 14 19 30 11 57.9%
Stock-theft 44 45 25 50 28 -22 -44.0%
Total Property-Related Crimes 248 226 253 234 203 -31 -13.2%
Illegal possession of firearms and ammunition 40 15 29 27 8 -19 -70.4%
Drug-related crime 31 40 37 34 23 -11 -32.4%
Driving under the influence of alcohol or drugs 82 93 106 79 53 -26 -32.9%
Sexual offences detected as result of police action - 0 0 0 0 0 0 Cases
Total Crime Detected As A Result Of Police Action 153 148 172 140 84 -56 -40.0%
All theft not mentioned elsewhere 101 112 121 131 100 -31 -23.7%
Commercial crime 28 45 39 59 59 0 0.0%
Shoplifting 3 4 6 12 16 4 33.3%
Total Other Serious Crimes 132 161 166 202 175 -27 -13.4%
Carjacking 0 3 8 1 5 4 400.0%
Truck hijacking 0 1 0 0 0 0 0 Cases
Robbery at residential premises 28 32 26 12 14 2 16.7%
Robbery at non-residential premises 24 17 24 21 26 5 23.8%
SUBCATEGORIES OF AGGRAVATED ROBBERY
OTHER SERIOUS CRIMES
CRIME DETECTED AS A RESULT OF POLICE ACTION
PROPERTY-RELATED CRIMES
CONTACT-RELATED CRIMES
CONTACT CRIMES ( CRIMES AGAINST THE PERSON)
CRIME CATEGORY
April 2010
to
March 2011
April 2011
to
March 2012
April 2012
to
March 2013
April 2013
to
March 2014
April 2014
to
March 2015

109
Table A3.4: Crime in Kokstad, 2010 to 2015
Source: SAPS, 2015
Comparison 2013-2014 with
2014-2015
Case
Difference% Change
Murder 16 25 14 25 18 -7 -28.0%
Total Sexual Offences 84 62 93 61 62 1 1.6%
Attempted murder 12 18 10 10 12 2 20.0%
Assault with the intent to inflict grievous bodily harm 292 233 259 217 219 2 0.9%
Common assault 157 132 127 105 88 -17 -16.2%
Common robbery 50 48 48 53 58 5 9.4%
Robbery with aggravating circumstances 49 77 62 64 89 25 39.1%
Total Contact Crimes ( Crimes Against The Person) 660 595 613 535 546 11 2.1%
Arson 3 8 7 4 5 1 25.0%
Malicious damage to property 96 76 101 124 103 -21 -16.9%
Total Contact-Related Crimes 99 84 108 128 108 -20 -15.6%
Burglary at non-residential premises 50 40 39 24 26 2 8.3%
Burglary at residential premises 256 267 300 296 258 -38 -12.8%
Theft of motor vehicle and motorcycle 14 19 10 23 17 -6 -26.1%
Theft out of or from motor vehicle 143 167 251 297 372 75 25.3%
Stock-theft 48 52 65 36 50 14 38.9%
Total Property-Related Crimes 511 545 665 676 723 47 7.0%
Illegal possession of firearms and ammunition 13 15 8 18 16 -2 -11.1%
Drug-related crime 396 258 290 262 274 12 4.6%
Driving under the influence of alcohol or drugs 123 139 196 108 144 36 33.3%
Sexual offences detected as result of police action - 0 0 1 0 -1 -100.0%
Total Crime Detected As A Result Of Police Action 532 412 494 389 434 45 11.6%
All theft not mentioned elsewhere 247 208 241 212 257 45 21.2%
Commercial crime 105 127 107 142 158 16 11.3%
Shoplifting 119 133 107 74 86 12 16.2%
Total Other Serious Crimes 471 468 455 428 501 73 17.1%
Carjacking 0 1 2 3 3 0 0.0%
Truck hijacking 0 0 0 0 0 0 0 Cases
Robbery at residential premises 7 13 11 19 10 -9 -47.4%
Robbery at non-residential premises 5 4 8 8 15 7 87.5%
SUBCATEGORIES OF AGGRAVATED ROBBERY
OTHER SERIOUS CRIMES
CRIME DETECTED AS A RESULT OF POLICE ACTION
PROPERTY-RELATED CRIMES
CONTACT-RELATED CRIMES
CONTACT CRIMES ( CRIMES AGAINST THE PERSON)
CRIME CATEGORY
April 2010
to
March 2011
April 2011
to
March 2012
April 2012
to
March 2013
April 2013
to
March 2014
April 2014
to
March 2015

110
Table A3.5: Crime in KwaDukuza, 2010 to 2015
Source: SAPS, 2015
Comparison 2013-2014 with
2014-2015
Case
Difference% Change
Murder 68 57 47 55 69 14 25.5%
Total Sexual Offences 209 195 219 218 197 -21 -9.6%
Attempted murder 73 81 71 66 92 26 39.4%
Assault with the intent to inflict grievous bodily harm 499 462 493 457 471 14 3.1%
Common assault 636 766 682 665 491 -174 -26.2%
Common robbery 94 117 118 133 143 10 7.5%
Robbery with aggravating circumstances 499 459 486 635 538 -97 -15.3%
Total Contact Crimes ( Crimes Against The Person) 2 078 2 137 2 116 2 229 2 001 -228 -10.2%
Arson 23 14 10 11 9 -2 -18.2%
Malicious damage to property 320 343 303 325 396 71 21.8%
Total Contact-Related Crimes 343 357 313 336 405 69 20.5%
Burglary at non-residential premises 150 185 176 129 143 14 10.9%
Burglary at residential premises 754 732 967 1 152 1 044 -108 -9.4%
Theft of motor vehicle and motorcycle 131 133 85 98 148 50 51.0%
Theft out of or from motor vehicle 266 245 250 284 384 100 35.2%
Stock-theft 13 4 10 15 14 -1 -6.7%
Total Property-Related Crimes 1 314 1 299 1 488 1 678 1 733 55 3.3%
Illegal possession of firearms and ammunition 100 77 70 54 58 4 7.4%
Drug-related crime 698 957 953 1 027 1 168 141 13.7%
Driving under the influence of alcohol or drugs 131 234 207 268 189 -79 -29.5%
Sexual offences detected as result of police action - 0 5 15 6 -9 -60.0%
Total Crime Detected As A Result Of Police Action 929 1 268 1 235 1 364 1 421 57 4.2%
All theft not mentioned elsewhere 885 1 067 1 034 1 099 1 025 -74 -6.7%
Commercial crime 486 538 323 292 254 -38 -13.0%
Shoplifting 215 242 251 342 446 104 30.4%
Total Other Serious Crimes 1 586 1 847 1 608 1 733 1 725 -8 -0.5%
Carjacking 48 33 35 40 23 -17 -42.5%
Truck hijacking 1 0 0 0 1 1 1 Case Higher
Robbery at residential premises 79 77 88 86 99 13 15.1%
Robbery at non-residential premises 26 36 46 87 56 -31 -35.6%
CONTACT CRIMES ( CRIMES AGAINST THE PERSON)
CONTACT-RELATED CRIMES
PROPERTY-RELATED CRIMES
CRIME DETECTED AS A RESULT OF POLICE ACTION
OTHER SERIOUS CRIMES
SUBCATEGORIES OF AGGRAVATED ROBBERY
CRIME CATEGORY
April 2010
to
March 2011
April 2011
to
March 2012
April 2012
to
March 2013
April 2013
to
March 2014
April 2014
to
March 2015

111
Table A3.6: Crime in Ladysmith, 2010 to 2015
Source: SAPS, 2015
Comparison 2013-2014 with
2014-2015
Case
Difference% Change
Murder 44 39 46 39 34 -5 -12.8%
Total Sexual Offences 168 137 155 136 126 -10 -7.4%
Attempted murder 52 64 56 51 54 3 5.9%
Assault with the intent to inflict grievous bodily harm 517 537 485 433 427 -6 -1.4%
Common assault 701 703 708 563 537 -26 -4.6%
Common robbery 123 117 130 104 109 5 4.8%
Robbery with aggravating circumstances 326 300 266 369 267 -102 -27.6%
Total Contact Crimes ( Crimes Against The Person) 1 931 1 897 1 846 1 695 1 554 -141 -8.3%
Arson 15 16 9 9 9 0 0.0%
Malicious damage to property 293 268 261 238 224 -14 -5.9%
Total Contact-Related Crimes 308 284 270 247 233 -14 -5.7%
Burglary at non-residential premises 165 201 236 206 209 3 1.5%
Burglary at residential premises 511 479 614 676 638 -38 -5.6%
Theft of motor vehicle and motorcycle 80 82 104 74 64 -10 -13.5%
Theft out of or from motor vehicle 295 253 256 344 256 -88 -25.6%
Stock-theft 190 174 211 161 143 -18 -11.2%
Total Property-Related Crimes 1 241 1 189 1 421 1 461 1 310 -151 -10.3%
Illegal possession of firearms and ammunition 32 61 35 64 30 -34 -53.1%
Drug-related crime 119 158 73 100 57 -43 -43.0%
Driving under the influence of alcohol or drugs 539 651 718 727 241 -486 -66.9%
Sexual offences detected as result of police action - 1 1 1 4 3 300.0%
Total Crime Detected As A Result Of Police Action 690 871 827 892 332 -560 -62.8%
All theft not mentioned elsewhere 917 1 060 1 003 1 082 1 016 -66 -6.1%
Commercial crime 263 125 138 161 119 -42 -26.1%
Shoplifting 542 476 488 465 378 -87 -18.7%
Total Other Serious Crimes 1 722 1 661 1 629 1 708 1 513 -195 -11.4%
Carjacking 11 11 16 11 7 -4 -36.4%
Truck hijacking 2 6 6 6 3 -3 -50.0%
Robbery at residential premises 33 27 32 57 41 -16 -28.1%
Robbery at non-residential premises 33 18 24 32 23 -9 -28.1%
CONTACT CRIMES ( CRIMES AGAINST THE PERSON)
CONTACT-RELATED CRIMES
PROPERTY-RELATED CRIMES
CRIME DETECTED AS A RESULT OF POLICE ACTION
OTHER SERIOUS CRIMES
SUBCATEGORIES OF AGGRAVATED ROBBERY
CRIME CATEGORY
April 2010
to
March 2011
April 2011
to
March 2012
April 2012
to
March 2013
April 2013
to
March 2014
April 2014
to
March 2015
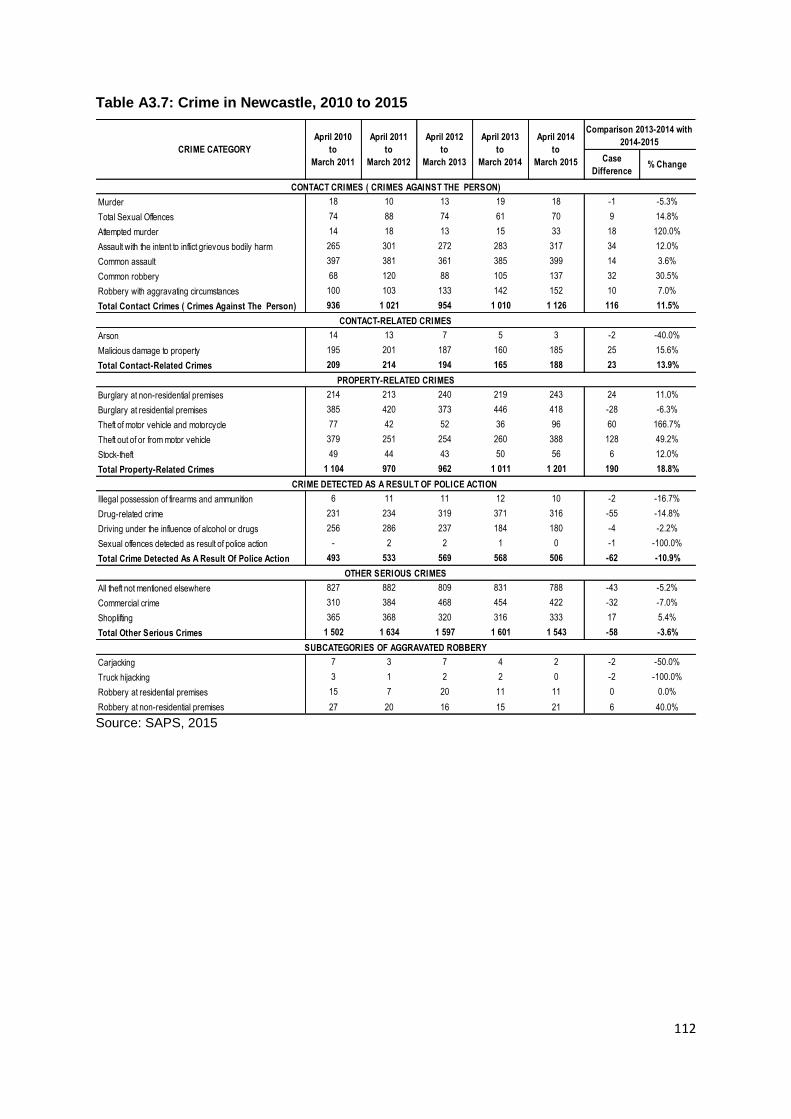
112
Table A3.7: Crime in Newcastle, 2010 to 2015
Source: SAPS, 2015
Comparison 2013-2014 with
2014-2015
Case
Difference% Change
Murder 18 10 13 19 18 -1 -5.3%
Total Sexual Offences 74 88 74 61 70 9 14.8%
Attempted murder 14 18 13 15 33 18 120.0%
Assault with the intent to inflict grievous bodily harm 265 301 272 283 317 34 12.0%
Common assault 397 381 361 385 399 14 3.6%
Common robbery 68 120 88 105 137 32 30.5%
Robbery with aggravating circumstances 100 103 133 142 152 10 7.0%
Total Contact Crimes ( Crimes Against The Person) 936 1 021 954 1 010 1 126 116 11.5%
Arson 14 13 7 5 3 -2 -40.0%
Malicious damage to property 195 201 187 160 185 25 15.6%
Total Contact-Related Crimes 209 214 194 165 188 23 13.9%
Burglary at non-residential premises 214 213 240 219 243 24 11.0%
Burglary at residential premises 385 420 373 446 418 -28 -6.3%
Theft of motor vehicle and motorcycle 77 42 52 36 96 60 166.7%
Theft out of or from motor vehicle 379 251 254 260 388 128 49.2%
Stock-theft 49 44 43 50 56 6 12.0%
Total Property-Related Crimes 1 104 970 962 1 011 1 201 190 18.8%
Illegal possession of firearms and ammunition 6 11 11 12 10 -2 -16.7%
Drug-related crime 231 234 319 371 316 -55 -14.8%
Driving under the influence of alcohol or drugs 256 286 237 184 180 -4 -2.2%
Sexual offences detected as result of police action - 2 2 1 0 -1 -100.0%
Total Crime Detected As A Result Of Police Action 493 533 569 568 506 -62 -10.9%
All theft not mentioned elsewhere 827 882 809 831 788 -43 -5.2%
Commercial crime 310 384 468 454 422 -32 -7.0%
Shoplifting 365 368 320 316 333 17 5.4%
Total Other Serious Crimes 1 502 1 634 1 597 1 601 1 543 -58 -3.6%
Carjacking 7 3 7 4 2 -2 -50.0%
Truck hijacking 3 1 2 2 0 -2 -100.0%
Robbery at residential premises 15 7 20 11 11 0 0.0%
Robbery at non-residential premises 27 20 16 15 21 6 40.0%
CONTACT CRIMES ( CRIMES AGAINST THE PERSON)
CONTACT-RELATED CRIMES
PROPERTY-RELATED CRIMES
CRIME DETECTED AS A RESULT OF POLICE ACTION
OTHER SERIOUS CRIMES
SUBCATEGORIES OF AGGRAVATED ROBBERY
April 2014
to
March 2015
April 2013
to
March 2014
April 2012
to
March 2013
April 2011
to
March 2012
April 2010
to
March 2011
CRIME CATEGORY

113
Table A3.8: Crime in Pietermaritzburg, 2010 to 2015
Source: SAPS, 2015
Comparison 2013-2014 with
2014-2015
Case
Difference% Change
Murder 30 30 43 26 35 9 34.6%
Total Sexual Offences 67 63 79 56 73 17 30.4%
Attempted murder 13 16 26 17 40 23 135.3%
Assault with the intent to inflict grievous bodily harm 233 237 233 186 253 67 36.0%
Common assault 447 415 465 424 562 138 32.5%
Common robbery 117 180 367 501 479 -22 -4.4%
Robbery with aggravating circumstances 314 346 433 564 596 32 5.7%
Total Contact Crimes ( Crimes Against The Person) 1 221 1 287 1 646 1 774 2 038 264 14.9%
Arson 1 4 1 0 1 1 1 Case Higher
Malicious damage to property 202 230 226 182 188 6 3.3%
Total Contact-Related Crimes 203 234 227 182 189 7 3.8%
Burglary at non-residential premises 262 338 320 378 343 -35 -9.3%
Burglary at residential premises 103 123 125 144 229 85 59.0%
Theft of motor vehicle and motorcycle 203 175 163 127 123 -4 -3.1%
Theft out of or from motor vehicle 410 368 401 750 741 -9 -1.2%
Stock-theft 0 0 0 0 0 0 0 Cases
Total Property-Related Crimes 978 1 004 1 009 1 399 1 436 37 2.6%
Illegal possession of firearms and ammunition 36 40 45 34 39 5 14.7%
Drug-related crime 804 835 880 922 1 131 209 22.7%
Driving under the influence of alcohol or drugs 96 95 92 85 120 35 41.2%
Sexual offences detected as result of police action - 0 133 97 196 99 102.1%
Total Crime Detected As A Result Of Police Action 936 970 1 150 1 138 1 486 348 30.6%
All theft not mentioned elsewhere 1 074 1 195 1 211 1 394 1 459 65 4.7%
Commercial crime 941 606 498 561 393 -168 -29.9%
Shoplifting 757 741 798 678 714 36 5.3%
Total Other Serious Crimes 2 772 2 542 2 507 2 633 2 566 -67 -2.5%
Carjacking 7 7 8 7 6 -1 -14.3%
Truck hijacking 0 0 2 1 0 -1 -100.0%
Robbery at residential premises 10 12 15 14 10 -4 -28.6%
Robbery at non-residential premises 37 33 39 37 40 3 8.1%
CONTACT CRIMES ( CRIMES AGAINST THE PERSON)
CONTACT-RELATED CRIMES
PROPERTY-RELATED CRIMES
OTHER SERIOUS CRIMES
SUBCATEGORIES OF AGGRAVATED ROBBERY
CRIME DETECTED AS A RESULT OF POLICE ACTION
CRIME CATEGORY
April 2010
to
March 2011
April 2011
to
March 2012
April 2012
to
March 2013
April 2013
to
March 2014
April 2014
to
March 2015

114
Table A3.9: Crime in Port Shepstone, 2010 to 2015
Source: SAPS, 2015
Comparison 2013-2014
with 2014-2015
Case
Difference% Change
Murder 50 49 48 45 58 13 28.9%
Total Sexual Offences 137 143 129 110 85 -25 -22.7%
Attempted murder 51 62 84 84 54 -30 -35.7%
Assault with the intent to inflict grievous bodily harm 414 380 332 298 249 -49 -16.4%
Common assault 511 468 381 410 322 -88 -21.5%
Common robbery 96 103 94 126 87 -39 -31.0%
Robbery with aggravating circumstances 184 208 238 217 224 7 3.2%
Total Contact Crimes ( Crimes Against The Person) 1443 1413 1306 1290 1079 -211 -16.4%
Arson 9 9 3 6 7 1 16.7%
Malicious damage to property 168 178 163 113 116 3 2.7%
Total Contact-Related Crimes 177 187 166 119 123 4 3.4%
Burglary at non-residential premises 189 210 203 218 182 -36 -16.5%
Burglary at residential premises 635 692 690 713 717 4 0.6%
Theft of motor vehicle and motorcycle 57 50 64 107 74 -33 -30.8%
Theft out of or from motor vehicle 291 299 250 322 212 -110 -34.2%
Stock-theft 5 5 2 3 8 5 166.7%
Total Property-Related Crimes 1177 1256 1209 1363 1193 -170 -12.5%
Illegal possession of firearms and ammunition 39 43 28 28 41 13 46.4%
Drug-related crime 329 417 906 493 578 85 17.2%
Driving under the influence of alcohol or drugs 340 379 164 145 188 43 29.7%
Sexual offences detected as result of police action - 42 89 346 443 97 28.0%
Total Crime Detected As A Result Of Police Action 708 881 1187 1012 1250 238 23.5%
All theft not mentioned elsewhere 654 660 648 616 654 38 6.2%
Commercial crime 357 303 316 309 254 -55 -17.8%
Shoplifting 292 287 396 480 334 -146 -30.4%
Total Other Serious Crimes 1303 1250 1360 1405 1242 -163 -11.6%
Carjacking 4 2 3 0 4 4 4 Cases Higher
Truck hijacking 0 0 1 0 0 0 0 Cases
Robbery at residential premises 23 37 43 30 30 0 0.0%
Robbery at non-residential premises 17 20 30 33 29 -4 -12.1%
CONTACT CRIMES ( CRIMES AGAINST THE PERSON)
CONTACT-RELATED CRIMES
PROPERTY-RELATED CRIMES
CRIME DETECTED AS A RESULT OF POLICE ACTION
OTHER SERIOUS CRIMES
SUBCATEGORIES OF AGGRAVATED ROBBERY
April 2014
to
March 2015
April 2013
to
March 2014
April 2012
to
March 2013
April 2011
to
March 2012
April 2010
to
March 2011
CRIME CATEGORY

115
Table A3.10: Crime in Vryheid, 2010 to 2015
Source: SAPS, 2015
Comparison 2013-2014 with
2014-2015
Case
Difference% Change
Murder 19 23 24 20 23 3 15.0%
Total Sexual Offences 82 113 94 118 89 -29 -24.6%
Attempted murder 13 12 21 16 26 10 62.5%
Assault with the intent to inflict grievous bodily harm 255 222 254 198 242 44 22.2%
Common assault 318 267 214 201 248 47 23.4%
Common robbery 71 47 55 99 117 18 18.2%
Robbery with aggravating circumstances 36 43 65 77 107 30 39.0%
Total Contact Crimes ( Crimes Against The Person) 794 727 727 729 852 123 16.9%
Arson 0 1 4 1 2 1 100.0%
Malicious damage to property 172 180 187 238 230 -8 -3.4%
Total Contact-Related Crimes 172 181 191 239 232 -7 -2.9%
Burglary at non-residential premises 89 64 87 71 69 -2 -2.8%
Burglary at residential premises 236 145 149 180 283 103 57.2%
Theft of motor vehicle and motorcycle 67 68 76 87 70 -17 -19.5%
Theft out of or from motor vehicle 122 97 110 209 253 44 21.1%
Stock-theft 131 120 127 131 122 -9 -6.9%
Total Property-Related Crimes 645 494 549 678 797 119 17.6%
Illegal possession of firearms and ammunition 19 28 24 41 22 -19 -46.3%
Drug-related crime 93 127 85 124 93 -31 -25.0%
Driving under the influence of alcohol or drugs 180 213 384 107 151 44 41.1%
Sexual offences detected as result of police action - 1 0 0 1 1 1 Case Higher
Total Crime Detected As A Result Of Police Action 292 369 493 272 267 -5 -1.8%
All theft not mentioned elsewhere 730 691 646 850 803 -47 -5.5%
Commercial crime 238 224 202 203 193 -10 -4.9%
Shoplifting 272 232 196 169 205 36 21.3%
Total Other Serious Crimes 1 240 1 147 1 044 1 222 1 201 -21 -1.7%
Carjacking 3 0 5 4 1 -3 -75.0%
Truck hijacking 0 0 1 0 1 1 1 Case Higher
Robbery at residential premises 11 7 7 8 18 10 125.0%
Robbery at non-residential premises 7 11 6 9 11 2 22.2%
CONTACT CRIMES ( CRIMES AGAINST THE PERSON)
CONTACT-RELATED CRIMES
PROPERTY-RELATED CRIMES
CRIME DETECTED AS A RESULT OF POLICE ACTION
OTHER SERIOUS CRIMES
SUBCATEGORIES OF AGGRAVATED ROBBERY
CRIME CATEGORY
April 2014
to
March 2015
April 2013
to
March 2014
April 2012
to
March 2013
April 2011
to
March 2012
April 2010
to
March 2011

116
Figure A4.1: KZN provincial GDP by district municipality, 2014
Ugu, 4.2%
uMgungundlovu, 10.2%
Uthukela, 3.8%
Umzinyathi , 1.6%
Amajuba , 3.5%Zululand , 3.2%
Umkhanyakude , 2.5%
Uthungulu , 8.0%
iLembe , 3.8%
Sisonke, 2.0%
eThekwini, 57.2%
Source: Global insight, 2015 Table A4.1: Sectors’ average annual growth rate i n KZN, 2004 to2014
eThekwini Ugu uMgungundlovu Uthukela Umzinyathi Amajuba Zululand Umkhanyakude uTthungulu iLembe Harry Gwala
Agriculture 9.4 9.7 20.0 6.0 4.8 2.8 6.4 9.8 12.0 11.3 7.7Mining 8.5 1.8 3.3 3.0 4.2 21.8 14.8 2.4 38.6 1.4 0.3
Manufacturing 56.8 3.9 8.7 4.0 0.9 3.8 1.2 1.0 12.5 6.2 1.0Electricity 33.1 6.4 16.3 9.0 3.0 4.8 7.8 7.4 6.0 2.8 3.3Construction 61.5 5.2 9.3 3.3 1.2 2.7 2.7 2.1 6.7 3.4 1.8Trade 65.0 4.5 8.9 3.3 1.5 2.5 2.3 1.9 4.8 2.6 2.6Transport 66.9 2.8 8.8 3.5 1.1 2.4 2.3 1.4 7.3 2.2 1.2Finance 68.7 3.6 8.9 2.5 1.0 2.7 2.4 2.0 4.6 2.7 0.9Community services 53.7 4.1 12.2 4.0 2.4 3.8 4.9 3.4 6.3 2.5 2.7
Source: Global insight, 2015
Table A4.2: Sectors contribution to the real GDP, 2014 1996 2004 2013 2014
Primary Sector 8.9 6.9 6.6 6.8
Agriculture 5.4 4.4 4.7 4.8Mining 3.5 2.5 2.0 1.9
Secondary Sector 28.4 24.7 25.6 25.2
Manufacturing 21.0 18.8 18.5 18.3Electricity 3.5 2.9 2.5 2.5Construction 3.8 3.1 4.5 4.5Tertiary Sector 62.7 59.1 67.8 68.0
Trade 13.5 13.8 15.7 15.5Transport 9.7 10.9 12.2 12.3Finance 14.2 14.7 18.1 18.2Community services 25.3 19.7 21.9 22.1 Source: Global insight, 2015

117
Table A4.3: Sub-sector’s average annual growth rate (percentages) in KZN, 2004 to 2014
KZN Ethekwini Ugu uMgungundlovu Uthukela Umzinyathi Amajuba Zululand Umkhanyakude uThungulu iLembe Harry GwalaPrimary Sector 3.6 -14.6 5.0 6.9 4.5 7.7 5.2 1.9 8.4 10.4 5.0 20.0
11 Agriculture and hunting 3.1 0.1 2.9 3.9 2.6 3.5 3.0 2.9 3.4 4.4 3.3 5.4
12 Forestry and logging 4.3 1.0 4.4 4.3 3.0 4.9 3.5 3.3 4.0 4.8 2.2 5.9
13 Fishing, operation of fish farms 4.4 2.6 5.6 6.2 5.9 5.8 6.2 5.7 5.7 7.2 6.2 8.2
21 Mining of coal and lignite -1.3 -3.4 -0.9 -0.6 -0.6 -0.6 -1.6 -1.4 -0.4 -0.3 -0.3 1.5
23 Mining of gold and uranium ore -8.2 -11.1 -8.5 -8.4 -8.2 -8.2 -8.1 -9.9 -7.0 -7.9 -9.4 -6.2
24 Mining of metal ores 3.0 0.3 2.9 2.9 3.6 3.5 3.4 2.8 3.4 3.3 3.8 4.9
25-29 Other mining and quarrying (incl 22) -1.7 -4.0 -1.4 -1.4 -1.8 -1.2 -1.3 -1.6 -0.7 -1.0 -0.8 0.4
Secondary Sector 33.8 21.7 41.6 46.1 45.0 47.0 48.9 37.7 51.1 54.6 48.6 71.7
30 Food, beverages and tobacco products 2.2 1.7 2.3 2.7 1.6 2.8 2.9 2.4 3.0 3.5 2.9 5.0
31 Textiles, clothing and leather goods 2.9 2.2 3.5 4.2 4.5 4.2 4.4 3.6 4.1 5.5 4.3 6.1
32 Wood and wood products 1.8 0.8 1.9 2.3 1.5 2.6 2.5 1.8 2.6 2.9 2.8 3.9
33 Fuel, petroleum, chemical and rubber products 2.2 1.8 2.8 3.6 4.0 3.4 3.6 2.7 3.4 3.9 3.6 5.4
34 Other non-metallic mineral products 0.7 -0.9 2.0 2.2 2.0 1.9 2.4 1.2 2.4 2.8 2.5 4.3
35 Metal products, machinery and household appliances 0.8 -0.5 0.7 1.1 1.8 1.0 1.5 0.5 1.3 1.6 1.8 3.3
36 Electrical machinery and apparatus 4.7 3.3 6.2 6.6 7.1 6.4 6.9 5.7 6.7 7.3 6.9 9.0
37 Electronic, sound/vision, medical & other appliances 5.5 4.4 7.5 7.7 8.3 7.4 8.1 6.4 8.0 8.3 7.9 9.8
38 Transport equipment 3.0 2.6 3.9 4.4 4.6 4.6 4.5 3.4 4.4 4.8 4.5 6.5
39 Furniture and other items NEC and recycling 1.5 0.1 2.9 3.3 3.5 3.3 3.6 2.6 3.3 4.2 3.6 5.5
41 Electricity, gas, steam and hot water supply 0.0 -2.3 1.7 1.0 0.0 1.7 1.4 1.0 4.0 2.1 2.1 2.9
42 Collection, purification and distribution of water 2.1 -0.1 2.9 3.3 2.6 3.9 3.3 3.2 4.0 3.6 2.1 4.4
50 Construction 6.4 8.5 3.3 3.6 3.5 3.8 3.6 3.2 3.9 4.2 3.6 5.6
Tertiary Sector 57.7 57.6 52.4 55.2 53.8 52.6 56.7 46.2 66.0 62.6 61.5 80.1
61 Wholesale and commission trade 3.4 3.8 2.2 2.4 2.3 2.5 2.6 1.9 2.6 2.9 2.4 4.3
62 Retail trade and repairs of goods 3.4 3.9 2.0 2.3 2.3 2.5 2.5 2.1 2.6 3.0 2.3 4.3
63 Sale and repairs of motor vehicles, sale of fuel 5.0 5.2 4.2 4.4 4.5 4.5 4.6 3.7 4.7 5.1 4.5 6.8
64 Hotels and restaurants 2.1 0.5 3.5 4.0 2.8 3.9 4.0 3.2 3.8 4.4 3.8 5.8
71-72 Land and Water transport 2.5 2.5 2.0 2.3 2.7 2.5 2.4 1.6 2.6 2.8 2.4 4.3
73-74 Air transport and transport supporting activities 7.2 7.1 7.0 7.6 8.3 7.9 7.8 6.5 7.3 7.9 7.6 9.6
75 Post and telecommunication 6.3 5.5 7.3 7.7 8.0 7.6 7.9 6.8 7.6 8.2 7.7 9.9
81-83 Finance and Insurance 7.2 7.3 6.4 6.6 6.8 6.7 6.9 6.0 7.1 7.2 6.8 8.9
84 Real estate activities 1.4 0.9 3.0 1.7 -0.1 -2.7 0.8 0.5 8.9 1.5 7.9 0.2
85-88 Other business activities 4.5 4.7 3.7 3.9 3.9 4.0 4.2 3.5 4.5 4.6 4.0 6.2
91 Public administration and defence activities 3.6 4.3 2.5 2.8 3.1 3.2 2.8 2.3 3.3 3.6 2.9 4.7
92 Education 2.6 2.7 2.0 2.4 2.2 2.7 2.4 2.1 2.7 3.0 2.2 4.1
93 Health and social work 4.4 4.7 3.4 3.6 3.7 4.0 4.0 3.4 4.2 4.3 3.6 5.4
94-99 Other service activities 4.2 4.6 3.1 3.5 3.3 3.4 3.6 2.7 3.9 4.0 3.5 5.5
Source: Global insight, 2015

118
Table A4.4: Sub-sector’s growth rate (percentages) in KZN, 2014
KZN Ethekwini Ugu uMgungundlovu Uthukela Umzinyathi Amajuba Zululand Umkhanyakude uThungulu iLembePrimary Sector 21.5 13.7 14.2 19.6 20.0 25.5 23.8 22.9 21.1 25.0 19.2
11 Agriculture and hunting 5.5 4.3 4.6 5.4 5.5 6.3 5.7 6.1 5.7 6.2 6.0
12 Forestry and logging 5.9 5.5 4.6 5.8 4.7 7.4 6.0 6.5 4.7 6.5 4.2
13 Fishing, operation of fish farms 9.5 8.7 9.3 10.0 10.2 10.6 10.9 10.6 10.1 10.6 10.6
21 Mining of coal and lignite 4.1 2.9 2.9 3.7 4.1 4.4 3.9 4.1 3.7 4.7 3.8
23 Mining of gold and uranium ore -0.9 -3.3 -2.9 -2.4 -1.9 -1.3 -1.4 -2.3 0.1 -1.0 -2.1
24 Mining of metal ores -2.9 -3.2 -3.6 -2.6 -2.5 -2.2 -1.5 -2.5 -4.2 -3.1 -3.6
25-29 Other mining and quarrying (incl 22) 0.4 -1.3 -0.6 -0.5 -0.1 0.4 0.2 0.4 1.1 1.2 0.4
Secondary Sector 11.9 3.7 3.7 14.6 18.1 25.3 26.9 21.7 18.8 26.8 21.5
30 Food, beverages and tobacco products 2.1 1.6 1.5 2.3 1.7 3.1 3.3 3.1 2.9 3.4 3.1
31 Textiles, clothing and leather goods 0.5 0.1 -0.4 1.0 1.2 1.6 2.0 1.4 0.5 1.5 1.1
32 Wood and wood products 0.9 0.2 0.1 0.9 0.6 1.9 1.9 1.6 1.7 2.1 1.7
33 Fuel, petroleum, chemical and rubber products -0.3 -0.6 -1.3 0.3 0.8 0.8 1.2 0.5 -0.4 0.8 0.4
34 Other non-metallic mineral products -0.5 -1.1 -0.8 -0.2 -0.3 0.1 0.7 0.1 -0.5 0.6 0.3
35 Metal products, machinery and household appliances -3.2 -4.1 -4.7 -3.4 -2.8 -3.0 -2.4 -3.0 -3.9 -2.7 -3.2
36 Electrical machinery and apparatus -2.3 -2.6 -3.3 -1.8 -1.5 -1.6 -0.9 -1.7 -3.6 -1.7 -2.0
37 Electronic, sound/vision, medical & other appliances 10.1 9.6 10.1 10.6 11.4 11.1 11.7 11.0 11.2 12.0 11.4
38 Transport equipment -0.6 -0.9 -1.2 0.0 0.3 0.8 0.8 0.3 -0.5 0.7 0.4
39 Furniture and other items NEC and recycling 3.2 2.7 2.7 3.6 3.9 4.3 4.7 4.1 3.2 4.3 4.1
41 Electricity, gas, steam and hot water supply 0.2 -1.3 0.3 -0.2 0.5 1.6 0.7 1.0 3.7 1.8 1.3
42 Collection, purification and distribution of water 0.4 -0.9 0.0 0.2 0.8 2.3 1.0 1.3 3.0 1.7 0.9
50 Construction 1.3 1.1 0.7 1.3 1.5 2.2 2.2 1.9 1.7 2.2 1.8
Tertiary Sector 19.4 14.1 13.2 23.9 29.8 36.8 36.6 30.7 26.9 35.6 30.5
61 Wholesale and commission trade 1.0 0.8 0.8 1.3 1.6 2.1 2.4 1.9 1.5 2.3 1.9
62 Retail trade and repairs of goods 1.1 0.9 0.6 1.4 1.6 2.1 2.4 1.9 1.3 2.0 1.6
63 Sale and repairs of motor vehicles, sale of fuel -1.9 -2.3 -2.1 -1.8 -1.3 -1.0 -0.9 -1.2 -0.7 -0.5 -1.0
64 Hotels and restaurants 4.4 3.8 4.2 4.8 4.4 5.6 5.8 5.3 4.9 5.7 5.4
71-72 Land and Water transport 5.1 4.6 4.8 5.2 5.9 6.4 6.2 5.9 6.4 6.7 6.1
73-74 Air transport and transport supporting activities -6.2 -6.4 -7.3 -5.8 -5.3 -5.0 -4.9 -5.6 -6.9 -5.2 -5.4
75 Post and telecommunication 0.1 -0.2 -0.4 0.5 0.8 1.1 1.4 0.8 -0.5 1.0 0.7
81-83 Finance and Insurance 6.0 5.7 6.1 6.4 7.0 7.3 7.5 7.0 7.7 7.7 7.3
84 Real estate activities -2.3 -2.9 -3.0 -1.0 0.6 0.7 -0.8 -1.0 -3.7 -1.6 -1.4
85-88 Other business activities -0.1 -0.4 -0.4 0.3 0.5 1.0 1.3 0.8 0.9 1.2 0.8
91 Public administration and defence activities 5.3 4.8 4.6 5.3 5.8 6.4 6.0 5.7 6.0 6.2 5.8
92 Education 1.6 1.0 0.9 1.6 1.9 2.8 2.5 2.3 2.5 2.5 2.0
93 Health and social work 2.7 2.3 2.2 2.8 3.2 3.9 3.9 3.4 3.9 3.8 3.3
94-99 Other service activities 2.7 2.4 2.3 2.9 3.1 3.6 3.9 3.3 3.5 3.8 3.4 Source: Global insight, 2015

119
Table A4.5: Sectors contribution to District real GDP, 2014 KZN Ethekwini Ugu uMgungundlovu Uthukela Umzinyathi Amajuba Zululand Umkhanyakude uThungulu iLembe Harry Gwala
Primary Sector 6.7 3.6 4.1 5.6 7.6 10.3 8.6 9.8 5.6 6.0 5.2 7.7
Agriculture 5.7 4.8 4.7 5.6 5.4 6.8 5.8 6.3 5.4 6.4 5.9 6.4
Mining 1.1 -1.2 -0.6 0.0 2.1 3.5 2.8 3.5 0.2 -0.4 -0.7 1.3
Secondary Sector 1.9 -0.1 1.1 2.0 3.0 5.3 2.1 4.5 6.7 4.6 4.9 6.8
Manufacturing 0.3 0.0 0.3 0.7 0.8 1.2 -0.8 1.5 1.6 0.6 1.9 2.4
Electricity 0.3 -1.2 0.2 0.0 0.6 2.0 0.7 1.1 3.4 1.8 1.2 2.2
Construction 1.3 1.1 0.7 1.3 1.5 2.2 2.2 1.9 1.7 2.2 1.8 2.2
Tertiary Sector 8.2 6.9 5.7 9.3 12.6 13.6 12.8 11.4 7.5 11.8 9.5 14.7
Trade 0.8 0.5 0.5 1.0 1.4 1.7 2.0 1.6 1.5 1.9 1.5 1.9
Transport 2.7 2.1 2.2 2.8 4.9 4.8 4.6 4.8 3.0 4.2 3.8 4.9
Finance 2.0 2.0 0.9 2.6 3.3 3.2 2.5 1.4 -0.7 2.1 1.1 4.3
Community services 2.7 2.3 2.1 2.9 3.1 3.9 3.8 3.6 3.6 3.6 3.1 3.7
Source: Global insight, 2015 Table A4.6: Sectors contribution to KZN real GDP by district municipality, 2014
eThekwini Ugu uMgungundlovu Uthukela Umzinyathi Amajuba Zululand Umkhanyakude uThungulu iLembe Harry Gwala
Agriculture 9.4 9.7 20.0 6.0 4.8 2.8 6.4 9.8 12.0 11.3 7.7Mining 8.5 1.8 3.3 3.0 4.2 21.8 14.8 2.4 38.6 1.4 0.3
Manufacturing 56.8 3.9 8.7 4.0 0.9 3.8 1.2 1.0 12.5 6.2 1.0Electricity 33.1 6.4 16.3 9.0 3.0 4.8 7.8 7.4 6.0 2.8 3.3Construction 61.5 5.2 9.3 3.3 1.2 2.7 2.7 2.1 6.7 3.4 1.8Trade 65.0 4.5 8.9 3.3 1.5 2.5 2.3 1.9 4.8 2.6 2.6Transport 66.9 2.8 8.8 3.5 1.1 2.4 2.3 1.4 7.3 2.2 1.2Finance 68.7 3.6 8.9 2.5 1.0 2.7 2.4 2.0 4.6 2.7 0.9Community services 53.7 4.1 12.2 4.0 2.4 3.8 4.9 3.4 6.3 2.5 2.7 Source: Global insight, 2015 Table A9.1: Descriptive statistics for the variables included in the estimations
GDP IEF EFW FW
Mean 3.055000 63.43500 6.934000 1.750000
Median 3.050000 63.35000 6.925000 1.500000
Maximum 5.600000 67.10000 7.850000 2.500000
Minimum -1.500000 60.70000 6.560000 1.500000
Std. Dev. 1.696273 1.392943 0.344909 0.303488
Skewness -0.758221 0.919562 1.345303 0.724418
Kurtosis 3.933685 4.620335 4.578245 2.551020
Jarque-Bera 2.642803 5.006552 8.108512 1.917257
Probability 0.266761 0.081817 0.017348 0.383418
Sum 61.10000 1268.700 138.6800 35.00000
Sum Sq. Dev. 54.66950 36.86550 2.260280 1.750000
Observations 20 20 20 20
Source: Own calculations using data from Heritage Foundation’s Index of Economic Freedom report
(2015), Fraser Institute’s, Economic Freedom of the World (2014), Freedom House, Freedom in the
World 2015) and Stats SA (2015).
GDP: gross domestic product annual percentage change (economic growth rate)
IEF: Heritage Foundation’s Index of Economic Freedom

120
EFW: Fraser Institute’s Economic Freedom of the World
FW: Freedom House Freedom in the World
Table A9.2: Cross-correlation results
Lag IEF(-1) IEF(+1) EFW(-1) EFW(+1) FW(-1) FW(+1)
1 0.1388 0.1388 0.203 0.203 -0.2633 -0.2633
2 0.3129 0.2204 0.4351 -0.1811 -0.2593 -0.098
3 0.5455 0.2097 0.2842 -0.1981 -0.4087 0.0386
4 0.6001 0.136 0.3908 0.0167 -0.4022 0.1394
5 0.3976 0.1349 0.2381 -0.1376 -0.2704 0.1278
Source: Own calculations using data from Heritage Foundation’s Index of Economic Freedom report
(2015), Fraser Institute’s, Economic Freedom of the World (2014), Freedom House, Freedom in the
World 2015) and Stats SA (2015).
Table A9.3: Cross-correlation results
Pairwise Granger Causality Tests F-Statistic Prob.
IEF does not Granger Cause GDP 6.42 0.01
GDP does not Granger Cause IEF 0.43 0.78
EFW does not Granger Cause GDP 0.95 0.54
GDP does not Granger Cause EFW 0.91 0.55
FW does not Granger Cause GDP 17.16 0.01
GDP does not Granger Cause FW 1.11 0.47
Source: Own calculations using data from Heritage Foundation’s Index of Economic Freedom report
(2015), Fraser Institute’s, Economic Freedom of the World (2014), Freedom House, Freedom in the
World 2015) and Stats SA (2015).

121
Appendix B: Calculating the Index
The economic risk index for the province and each of the 6 regions are calculated as follows:
Step1: Calculate or compute the monthly percentage change in each of the 8 economic risk
variables (t = 1 to 8 and i = 1 to 184)
%∆𝑒𝑟𝑡𝑖 = {(𝑒𝑟𝑡𝑖−𝑒𝑟𝑡𝑖−1)
𝑒𝑟𝑡𝑖−1} × 100 7.1
Where:
𝑒𝑟𝑡 isthe different economic risk variables
𝑖is the time in months
Step 2: Calculate or compute the monthly economic sector weights for each of the 9
economic sectors (s = 1 to 9 and i = 1 to 184)
𝑊𝑠𝑖 =𝐺𝐷𝑃𝑠𝑖
𝐺𝐷𝑃𝐾𝑍𝑁𝑖× 100 7.2
Where:
𝑤𝑠𝑖 isrelative weight of each economic sector
𝐺𝐷𝑃𝑠𝑖 isthegross domestic product per economic sector in period i
𝐺𝐷𝑃𝐾𝑍𝑁𝑖 isthegross domestic product for the province in period i
Step 3: Calculate or compute the economic sector risk for each of the 9 sectors
𝐸𝑅𝐶𝑠𝑡𝑖 = ∑(𝑊𝑠𝑖 × %∆𝑒𝑟𝑡𝑖 × 𝑒𝑟𝑤𝑡𝑖) 7.3
Where:
𝐸𝑅𝐶𝑠𝑡 is economic risk of the particular sector
𝐸𝑅𝑊is a weight of each of the economic risk variables per economic sector
Step 4: Calculate or compute the provincial or regional economic risk index
𝐸𝑅𝐶𝑙𝑜𝑐 = ∑ 𝐸𝑅𝐶𝑠𝑡𝑖 7.4
Where:
𝐸𝑅𝐶𝑙𝑜𝑐 is the economic risk index for the province or region

122
References
Arimah, B. (2004) Poverty reduction and human development in Africa. Journal of Human
Development, 5, 399-415.
Barker F.S., (1998) Productivity in South Africa. Labor Economics.South Africans Labor
Market and Practice 6th Ed.
Barrett, C.B. (2005) Rural poverty dynamics: development policy implications. Agricultural
Economics, 32, 45-60
Baumol, W., (2002) The Free-Market Innovation Machine: Analyzing the Growth Miracle of
Capitalism Princeton University Press
Beach, W.W. & Kane T., (2009) “Methodology: Measuring the 10 Economic Freedoms”,
available online at http://www.appstate.edu/~ehrhardtgc/Economic_freedom_codebook.pdf,
[Accessed on 2 December 2015]
Business Dictionary (2015) “Economic Freedom”, accessed on 1 December 2015 and
available online: http://www.businessdictionary.com/definition/economic-freedom.html.
[Accessed on 1 December 2015]
Carlsson, F. &Lundström, S., (2001) “Economic Freedom and Growth: Decomposing the
Effects”, Working Paper in Economics no. 33.
Charles Koch Institute (2015) About, available online: http://www.charleskochinstitute.org/,
[Accessed on 1 December 2015]
Crisp, A, M., Rode, M., Knoll, B. & Pitlik, H., (2013) Economic Freedom of the World, 2013
Annual Report, available online: http://www.freetheworld.com/2013/EFW2013-complete.pdf,
[Accessed on 3 December 2015]
Crush, J. & Frayne 1, B. (2007) The migration and development nexus in Southern Africa
Introduction. Development Southern Africa, 24, 1-23.

123
DBE (2015) 2015 School realities. Available online:
http://www.education.gov.za/LinkClick.aspx?fileticket=EO8ijVuXSE8%3D&tabid=36&mid=15
48 [Accessed 21 January 2016)
Department of labour (2014) Productivity Statistics Launch, available online:
www.labour.gov.za/.../welcome-address-by-the-deputy-minister-of-labor, [Accessed on 4
December 2014]
Development Bank of Southern Africa (2012) South Africa: State of Economic Infrastructure
Durban Officially Voted New 7 Wonder City of The World (2014) Available online:
http://icc.co.za/durban-voted [Accessed on 29 January 2015]
Dutz, M.A. & Hayri, A., (2000) “Does more intense competition lead to higher
growth?”,availableonline: https://ideas.repec.org/p/wbk/wbrwps/2320.html, [Accessed on 1
December 2015]
Economic Commission for Africa (2013) Infrastructure Development and Rural
Transformation. Available online:
http://www.nepad.org/sites/default/files/4e%20infrastructure%20theme%204%20Eng.pdf.
[Accessed on 6 November 2015]
Fosu, A.K. (2007) Poverty and development. Bulletin of the World Health Organization.
Fraser Institute (2015) About, available online: https://www.fraserinstitute.org, [Accessed on
1 December 2015]
Fujita, Y. (2012) Policy challenges for infrastructure development in Asian LICs: Lessons
from the region. Jica Research Institute.
Garrett, T.A.& Rhine R.M., (2010) “Economic Freedom and Employment Growth in U.S.
States” Research Division, Federal Reserve Bank of St. Louis, Working Paper Series,
Working Paper 2010-006A.
Goldsmith, A.A., (1995) “Democracy, Property Rights, and Economic Growth”.Journal of
Development Studies 32, no. 2: 157–74.

124
Gorlach, V.I.& Le Roux P., (2013) “The Impact of Economic Freedom on Economic Growth
in the SADC: AnIndividual Component Analysis”ERSA working paper 327
Gwartney, J.G. & Lawson, R.A., (2002) “Economic Freedom of the World”,2002 Annual
Report. Vancouver: Fraser Institute.
Heritage Foundation (2015): About, available online: http://www.heritage.org/index/about,
[Accessed on 1 December 2015]
IMF (January 2016 ) World Economic Outlook Update, an update of the key WEO
projections, available from www.imf.org [Accessed on 19 January 2016]
Isunju, J., Schwartz, K., Schoten, M., Johnson, W.P. & Van Dijk, M.P. (2011) Socio-
economic aspects of improved sanitation in slums: a review. Public health, 125, 368-376.
Jagdish, B., (1999) “Economic Freedom: Prosperity and Social Progress”. Paper presented
to the Conference on Economic Freedom and Development, Tokyo, June 17 - 18.
Justesen, M.K., (2006) “The Effect of Economic Freedom on Growth: Evidence on causality
from a panel of countries 1970-2000”, Paper accepted for presentation at the annual
meeting of The European Public Choice Society 2006, Turku, Finland
Kelly, M. (2000) Inequality and crime. Review of economics and Statistics, 82, 530-539
KZN Treasury (2015/16) Estimates of Provincial Revenue and Expenditure – 2015/16
Lawson, R.A., (1997) “Measuring Economic Freedom”, available online http://www.cato.org/
publications/commentary/measuring-economic-freedom, [Accessed on 3 December 2015]
Mankiw, N.G., Romer, D. & Weil, D.N., (1992): “A contribution to the empirics of economic
growth”.NBER Working papers series n. 3541
Moran, D.D., Wackernagel, M., Kitses, J.A., Goldfinger, S.H. & Boutaud, A. (2008)
Measuring sustainable development—Nation by nation. Ecological economics, 64, 470-474
National Department of Tourism (2011). National Tourism Sector Strategy 2011

125
OECD (2001), Trends in international migration: Continuous Reporting System on Migration.
Available online http://www.oecd.org/migration/mig/2508596.pdf [Accessed on 30 January
2015]
National Treasury (2015) Expenditure priorities and the division of revenue. Available online:
http://www.treasury.gov.za/documents/mtbps/2014/mtbps/Chapter%204.pdf. [Accessed 6
February 2016]
OECD (2014), TALIS 2013 Results: An International Perspective on Teaching and Learning,
TALIS, OECD Publishing, Paris, Available online: http://dx.doi.org/10.1787/9789264196261-
en [Accessed 11 February 2016]
OECD (2015a) United States - Economic forecast, summary, Available online
http://www.oecd.org/eco/outlook/united-states-economic-forecast. [Accessed on 10 January
2015]
OECD (2015b) Japan - Economic forecast, summary, Available online
http://www.oecd.org/eco/outlook/Japan-economic-forecast. [Accessed on 10 January 2015]
OECD (2015c) Russian Federation - Economic forecast, summary, accessed on 10/01/2015,
available from http://www.oecd.org/eco/outlook/russian-federation-economic-forecast.
[Accessed on 10 January 2015]
OECD (2015d) India - Economic forecast, summary, accessed on 10/01/2015, available
from http://www.oecd.org/eco/outlook/India economic-forecast.
OECD (2015d) China - Economic forecast, summary, accessed on 10/01/2015, available
from http://www.oecd.org/eco/outlook/China economic-forecast.
OECD (2016) Infrastructure investment (indicator). Available online: doi: 10.1787/b06ce3ad-
en [Accessed on 09 February 2016]
Panahi,H., Assadzadeh, A. & Refaei, R., (2014) “Economic Freedom and Economic Growth
in Mena Countries” http://www.aessweb.com/pdf-files/aefr-4(1)-105-116.pdf, [Accessed on 5
December 2015]

126
Peter, D.H. et al (2008) Poverty and access to health care in developing countries. Annals of
the New York Academy of Sciences, 1136, 161-171.
Population Reference Bureau (2010) China’s Rapidly Aging Population. Available online:
http://www.prb.org/pdf10/todaysresearchaging20.pdf [Accessed 3 January 2016]
Population Reference Bureau (2015) 2015 World population data sheet. Available online:
www.prb.org/pdf15/2015-world-population-data-sheet_eng.pdf. [Accessed 5 February 2016]
SARB (2015) Statement of the Monetary Policy Committee, Press statement delivered by
the Governor of the SARB. Available online: https://www.resbank.co.za, [Accessed, 20
December 2015]
Public Service Commission (2008) Basic Concepts in Monitoring and Evaluation
SARB (2016) Quarterly Bulletin (December 2015 No. 279). South African Reserve Bank,
Pretoria. Available Online: https://www.resbank.co.za, [Accessed on 10 January 2016]
Schultz, T.P. (2007) Population policies, fertility, women's human capital, and child quality.
Handbook of development economics, 4, 3249-3303.
Sims, C.A. (1980): Macroeconomics and Reality, Econometrica, 48, 1-48.
South Africa’s Natural Wetland Heritage Available online: http://www.isimangaliso.co.za
[Accessed on 29 January 2015]
South Africa’s Tourism Industry.
Available:http:www.southafrica.info/business/economy/sectors/tourism-overview.htm.
[Accessed on 17 February 2015]
Stats SA (2006) Mid-year population estimates 2006. Statistical release P0302 (1 August
2006). Pretoria, Government Printer
Stats SA (2011) Mid-year population estimates 2011. Statistical release P0302 (27 July
2011). Pretoria, Government Printer

127
Stats SA (2015) Mid-year population estimates 2015. Statistical release P0302 (23 July
2015). Pretoria, Government Printer
Stats SA (2015) Gross domestic product, Third quarter 2015, Statistical Release Statistical
release P0441 (November 2015). Pretoria, Government Printer, accessed on 1 December
2015 and available online: www.statssa.gov.za
Stats SA (2015) Quarterly Labour Force Survey, Quarter three 2015, Available online:
http://beta2.statssa.gov.za/publications/P0211/P02112, [Accessed on 25 November 2015]
Stats SA (2016) Consumer Price Index December 2015, Embargoed until: 20 January 2016,
available online: www.beta2.statssa.gov.za, [Accessed on 24 January 2016]
Stats SA (2015b) Quarterly Labour Force Survey, Quarter three 2015, Statistical release
number P0211, available Online: http://www.statssa.gov.za/publications, [Accessed on 11
February 2015]
Strttmatter, A. & Sunde, U. (2013) Health and economic development—evidence from the
introduction of public health care. Journal of Population Economics, 26, 1549-1584.
United Nations (2013). World Population Ageing 2013, Department of Economic and Social
Affairs, Population Division. New York. Available online:http://passthrough.fw-
notify.net/download/386507/http://www.un.org/en/development/desa/population/publications/
pdf/ageing/WorldPopulationAgeing2013.pdf [Accessed on 27 January 2015]
Wolde-Rufael, Y. (2006). Electricity consumption and economic growth: a time series
experience for 17 African countries. Energy Policy, 34, 1106-1114
World Bank (2015) Africa’s Population Boom: Will It Mean Disaster or Economic and Human
Development Gains? Available online:
http://www.worldbank.org/en/region/afr/publication/africas-demographic-transition [Accessed
5 February 2016]
World Bank (2016) Global Economic Prospects, Spillovers amid Weak Growth, available
from http://www.worldbank.org/en/publication/global-economic [Accessed on 12 January
2016]

128
World Travel & Tourism Council (2014).Travel & Tourism Economic Impact
Wulandari, D., (2015) “Analysis of the Relationship between Economic Freedom and
Economic Growth in Indonesia”, Interdisciplinary Journal Of Contemporary Research In
Business Copy Right © 2015 Institute Of Interdisciplinary Business Research 63 Vol 6, No
10.
Zulu Kingdom (2014) .Statistics of Our Tourism Sector. Available online: www.zulu.org.za