2016-2020 implementation phase - mcgill university
TRANSCRIPT

Energy Management Plan 2016-2020 Implementation Phase 2017-08-01 Update

Produced by:
Utilities and Energy Management
Facilities Management and Ancillary Services
McGill University.
2017-08-01 Update
Cover page photo credits:
Clockwise, from the top left corner:
The Arts Building’s cupola, McGill©
Renovated lab in the Maass Chemistry building, NFOE©
Macdonald Campus’s North Powerhouse, McGill©
Students in a lab, McGill©

ii
EXECUTIVE SUMMARY McGill, as a world-class research and teaching institution, has a very high energy use intensity1 and a
sizeable carbon footprint. McGill uses more energy per square foot compared to peer institutions in
Canada but compares favourably in terms of greenhouse gas emissions. Indeed, when normalized to
gross building area or student enrolment, McGill’s building-related greenhouse gas emissions are in fact
50% below the 1990 levels.
Since 2010, the University has invested $20M in energy conservation and managed to reduce energy use
intensity and building-related greenhouse gas emissions respectively by 26% and 34% below the MEES2-
defined 2002-2003 reference baseline. Utilities & Energy Management, a unit of Facilities Management
& Ancillary Services, spearheaded the implementation of energy conservation measures in collaboration
with a variety of stakeholders, both internal and external. McGill has gained recognition in energy
management from its peers, utility companies, and the province. Among the lessons learned between
2010 and 2015, Utilities & Energy Management realized that smart tools and technologies deployed on
campus don’t obviate the need for brainpower: human resources are McGill’s most valuable asset and
long-term energy efficiency can only be achieved by changing mindsets and behaviours. Furthermore,
the more McGill’s energy efficiency increases, the more challenging it gets to make marginal savings.
Figure 2 below gives an overview of investments and savings made with the first iteration of McGill’s
Energy Management Plan, as well as the impact on energy use intensity and greenhouse gas emissions,
put in perspective with campus growth in terms of building area and student enrolment.
Recently, the provincial government set ambitious targets for institutions to reduce their energy use and
carbon footprint which aligns well with McGill’s ambition to become carbon neutral. A study of
compliance requirements and McGill’s institutional priorities shows there is a convergence in objectives
to reduce energy consumption, reduce greenhouse gas emissions with a long-term goal of becoming
carbon neutral, and manage peak power demand to reduce the strain on the province’s utility
infrastructure.
To respond to these requirements, Utilities & Energy Management is proposing a 2016-2020 iteration of
the Energy Management Plan that will focus on the transition of buildings from discrete, static energy
consumers to dynamic smart grids that make use of synergies between exothermic3 and endothermic4
buildings. This will be done by building the backbone for heat exchange between buildings on the
downtown campus. Expected impacts include a 22% reduction in energy use intensity below the
provincial government-newly defined 2012-2013 baseline as well as a 64% reduction in building-related
greenhouse gas emissions below the 1990 levels. Investments in energy conservation in the order of
$22M have been identified to reach these targets. Annual savings upon implementation are estimated
at $3.99M for an overall payback of 4.3 years and a net present value calculated over 20 years of
$14.89M.
The 2016-2020 action plan is articulated around five main areas of intervention:
- A set of projects motivated entirely by the Energy Management Plan which includes the
deployment of smart grids downtown, recovering heat from the downtown powerhouse, and a
demand-side management program.
1 Energy use intensity: overall energy used in buildings to gross building area ratio. 2 MEES: Ministère de l’Éducation et de l’Enseignement supérieur du Québec 3 An exothermic building is a building in excess of heat, i.e. which needs cooling. 4 An endothermic building is a building that needs heating.

iii
- A set of mixed projects, so-called because they aren’t solely motivated by the Energy
Management Plan. These projects include major HVAC upgrades, deploying non-conventional
renewable energy systems, and completing the deployments of smart grids downtown.
- A set of energy programs including building retro-commissioning, insulation, and systems
optimization.
- A new section called “efficient operations” that aims to improve building operations, improve
the efficiency of the energy generation and distribution systems, and ensure the continuity of
energy savings.
- The last area of intervention is community engagement and includes: supporting McGill’s
Sustainable Procurement strategy, research and energy, applied student research, as well as
increasing exposure by communicating McGill’s ambitions and successes to the community.
Our analysis shows the proposed action plan will allow McGill to meet compliance requirements and
institutional objectives for the years to come, as illustrated below.
Area of intervention
Red
uce
en
ergy
use
inte
nsi
ty o
f b
uild
ing
sto
ck
Incr
ease
en
ergy
per
form
ance
of
new
b
uild
ings
incl
. maj
or
ren
ova
tio
ns
Ph
ase
ou
t u
se o
f h
eati
ng
oil
in
bu
ildin
gs
Red
uce
pea
k p
ow
er
dem
and
Red
uce
en
ergy
-re
late
d G
HG
emis
sio
ns
of
bu
ildin
gs
Use
ren
ewab
le
ener
gy a
s th
e m
ain
sou
rce
of
hea
tin
g
bu
ildin
gs
Red
uce
ove
rall
GH
G
emis
sio
ns
(QC
)
Wo
rk t
ow
ard
s ca
rbo
n
neu
tral
ity
(McG
ill)
Red
uce
GH
G
emis
sio
ns
rela
ted
to
tran
spo
rt
Smart grids DT ✓ ✓ ✓ ✓ ✓
Increase DT powerhouse efficiency
✓ ✓ ✓ ✓
Peak demand management
✓
Major HVAC upgrades
✓ ✓ ✓ ✓ ✓ ✓ ✓
Non-conventional renewable energy systems
✓ ✓ ✓ ✓ ✓
Retro-commissioning
✓ ✓ ✓ ✓ ✓ ✓
Insulation ✓ ✓ ✓ ✓
Buildings and systems optimization
✓ ✓ ✓ ✓
Efficient operations
✓ ✓ ✓ ✓ ✓ ✓ ✓
Improve distribution efficiency
✓ ✓ ✓ ✓
Energy savings persistence
✓ ✓ ✓ ✓ ✓ ✓ ✓
Community engagement
✓ ✓ ✓ ✓

iv
TIMELINE
Figure 1 - Evolution of Energy Use Intensity, 2003-2016
0.00
0.50
1.00
1.50
2.00
2.50
Ener
gy U
se In
ten
sity
(G
J/m
²)
Evolution of Energy Use Intensity, 2003-2016
25
% red
uctio
n
33
% red
uctio
n
Actuals Forecasts
McGill
QC UniversitiesAverage
14% target
15% target
If we had not investedin energy conservation
Actual expenditures

v
Figure 2 - Investments in Energy Conservation and Evolution of Energy Expenditures and Savings, 2003-2016
$0.0M
$5.0M
$10.0M
$15.0M
$20.0M
$25.0M
$30.0M
$35.0M
An
nu
al S
pen
d (
M$
)
Investments in Energy Conservation and Evolution of Energy Expenditures and Savings, 2003-2016
Actuals Forecasts
If we had not investedin energy conservation
Actual expenditures
Energy savings
Energy cost
Investments in energy conservation

vi
Figure 3 - Evolution of Greenhouse Gas Emissions, 2003-2016
0
10
20
30
40
50
60
70
80
90
GH
G E
mis
sio
ns
per
Gro
ss A
rea
(kgC
O2
e/m
²)
Evolution of Greenhouse Gas Emissions, 2003-2016
40
% red
uctio
n
70
% red
uctio
n
Actuals Forecasts
McGill
QC UniversitiesAverage

vii
Figure 4 - Evolution of Campus Population and Building Area, 2003-2016
-
5,000
10,000
15,000
20,000
25,000
30,000
35,000
0
200,000
400,000
600,000
800,000
1,000,000
1,200,000
1,400,000
Stu
den
t En
rollm
ent
(FTE
)
Cam
pu
s G
ross
Are
a (m
²)Evolution of Campus Population and Building Area, 2003-2016
Actuals Forecasts

viii
CONTENTS Executive Summary ....................................................................................................................................... ii
Timeline ....................................................................................................................................................... iv
List of Figures ............................................................................................................................................... ix
List of Tables ................................................................................................................................................ ix
Mission Statement ........................................................................................................................................ 1
1. Background ........................................................................................................................................... 2
1.1. Narrative ....................................................................................................................................... 2
1.2. Highlights ...................................................................................................................................... 2
2. Regulatory and Policy Context .............................................................................................................. 6
2.1. Compliance Framework ................................................................................................................ 6
2.2. Utilities Tariffs and Programs ........................................................................................................ 7
2.3. Institutional Orientations .............................................................................................................. 7
2.4. Other Best Practices ...................................................................................................................... 8
2.5. Summary of Compliance Requirements and Institutional Orientations ..................................... 10
3. Situational Analysis of Energy Management at McGill ....................................................................... 11
3.1. Key Performance Indicators ........................................................................................................ 11
SWOT Analysis ......................................................................................................................................... 12
4. 2016-2020 Strategy ............................................................................................................................. 13
4.1. Vision ........................................................................................................................................... 13
4.2. Goal for the 2016-2020 Period ................................................................................................... 13
4.3. Objectives .................................................................................................................................... 13
4.4. Activities ...................................................................................................................................... 13
4.5. Impacts ........................................................................................................................................ 13
5. Action Plan .......................................................................................................................................... 14
5.1. 100% Energy Conservation Projects ........................................................................................... 14
5.2. Mixed Projects (Energy Conservation + Alternative Sources of Funding) .................................. 16
5.3. Energy Conservation Programs ................................................................................................... 17
5.4. Efficient Operations .................................................................................................................... 18
5.5. Community Engagement ............................................................................................................ 19
5.6. Meeting Compliance Requirements and Institutional Objectives .............................................. 21
5.7. Summary Table ........................................................................................................................... 22
Appendices .................................................................................................................................................. 23

ix
LIST OF FIGURES Figure 1 - Evolution of Energy Use Intensity, 2003-2016 ............................................................................................. iv
Figure 2 - Investments in Energy Conservation and Evolution of Energy Expenditures and Savings, 2003-2016 ......... v
Figure 3 - Evolution of Greenhouse Gas Emissions, 2003-2016 ................................................................................... vi
Figure 4 - Evolution of Campus Population and Building Area, 2003-2016 ................................................................. vii
Figure 5 - Evolution of McGill's EUI ................................................................................................................................ 3
Figure 6 - Buildings Impacted by the 2010-2015 Energy Management Plan ................................................................. 3
Figure 7 - Internal Stakeholders..................................................................................................................................... 4
Figure 8 - External Stakeholders .................................................................................................................................... 4
Figure 9 - SWOT Analysis of Energy Management at McGill ....................................................................................... 12
LIST OF TABLES Table 1 - Overview of 2010-2015 EMP Programs and Projects ..................................................................................... 2
Table 2 - Energy Performance Metrics - McGill vs Research-Oriented Canadian Universities ...................................... 9
Table 3 - Energy Performance Metrics - McGill vs. US Research Universities ............................................................... 9
Table 4 - Summary of Compliance Requirements and Institutional Orientations ....................................................... 10
Table 5 - Key Performance Indicators, 1990 vs 2016 ................................................................................................... 11
Table 6 - 100% Energy Conservation Projects ............................................................................................................. 14
Table 7 - Mixed Projects (Energy Conservation + Alternative Sources of Funding)..................................................... 16
Table 8 - Energy Conservation Programs ..................................................................................................................... 17
Table 9 - Efficient Operations ...................................................................................................................................... 18
Table 10 - Meeting Compliance Requirements and Institutional Orientations ........................................................... 21
Table 11 - Summary of 2016-2020 EMP Programs and Projects ................................................................................. 22

1
MISSION STATEMENT The role of McGill Utilities & Energy Management (UEM) is to support the University’s teaching and
research mission. UEM serves all McGill energy end-users by providing them with reliable energy. The
Utilities Group efficiently operates and maintains energy generation and distribution systems on campus.
The Energy Management Group is the authority on energy at McGill and strives to reduce energy
consumption. Our team of knowledgeable and engaged individuals are empowered to foster initiatives
geared toward energy savings. We work closely with our stakeholders and give them tools to understand
energy use on campus and influence positive behavioural change. We collaborate with administrative
units and faculties to inform decision-making processes in order to increase on-campus energy efficiency.
To reach our goals, we follow a long-term strategy outlined in our rolling five-year Energy Management
Plan which, we regularly update, that comprises capital investment, maintenance, and optimization
programs as well as behavioural change programs. Our activities rely on three pillars: the expertise and
technical background of our team, careful project scheduling, and sound funding and accounting. Energy
conservation initiatives are mostly funded by loans and repaid with energy savings. We are committed to
transparent, regular reporting on the progress of the plan to McGill’s senior administration and
community.
Looking beyond our core activities, we espouse the missions of the University and of Facilities
Management and Ancillary Services and we actively engage with students, professors, and researchers by
sharing knowledge on energy use at McGill and providing venues for academic and research projects. We
nurture our relationship with academia. We recognize Vision2020 as a community vision and we pursue
McGill’s sustainability objectives by empowering change agents and supporting the University in the
implementation of the Vision2020 Action Plan.
We work collaboratively and participate actively in a practice community and exchange with similar
organizations such as universities and hospitals to keep abreast of the most recent trends in energy
management.
We value reliability by ensuring optimal efficiency in all our activities, transparency which we seek to
demonstrate through cooperation and proactive disclosure, and expertise which we maintain and enrich
through continuous learning. We blend these values in all our endeavours.

2
1. BACKGROUND
1.1. NARRATIVE McGill’s first Five-Year Energy Management Plan and its 2013 update responded to the Ministry of
Higher Education’s (then Ministère de l’Éducation, du Loisir et des Sports du Québec) request that all
post-secondary institutions in the province should reduce their EUI (GJ/m²) by 14% relative to 2002-
2003 without specifying targets for individual institutions.
Since 2010-2011, McGill has invested $67M in energy conservation, $27M of which were funded
through a loan repaid with the savings generated by the different projects. At the end of 2015-2016,
annual savings reached $3.8M annually for an overall payback on energy loan-funded projects of 5
years.
As of May 2016, both EUI and greenhouse gas emissions related to stationary combustion were 26% and
34% below the 2002-2003 baseline.
1.2. HIGHLIGHTS As of 2015-2016 Q3 and since 2010-2011, McGill has made $19.1M investments in energy conservation
(out of a $27M budget) resulting in $3.8M savings. The University has received $2.7M in incentives
from utility programs (Gaz Métro and Hydro Québec) and Québec’s climate action incentive program
(managed by Transition énergétique Québec). The plan has an overall payback of 4.7 years. These
energy conservation measures have resulted in a 26% reduction in energy intensity (see Figure 5) and a
34% reduction in greenhouse gas emissions from stationary combustions, relative to the 2002-2003
levels. 43 buildings were impacted by the program as illustrated on Figure 6. Table 1 below shows
detailed financials for investments made between 2010-11 and 2015-16.
EMIS LIGHTING
RETROFITS
ReCx
&
ENERGY AUDITS
MAJOR
UPGRADES
(PROJECTS)
INSULATION &
OPTIMIZATION
PROGRAMS
INVESTMENTS $2.8M $5.2M $1.1M $11.0M $339k
INCENTIVES $75k $972k $329k $1.2M N/A
SAVINGS $384k $581k $1.3M $1.2m $355k
PAYBACK 7.1 yrs 7.3 yrs 0.6 yr 8.1 yrs 1.0 yr
BUILDINGS
IMPACTED 80 45 15
11 (directly)
80 (indirectly) 10
Table 1 - Overview of 2010-2015 EMP Programs and Projects

3
Figure 5 - Evolution of McGill's EUI
Figure 6 - Buildings Impacted by the 2010-2015 Energy Management Plan
1.40
1.50
1.60
1.70
1.80
1.90
2.00
2.10
2.20
2.30
Annual Energy Intensity (in GJ/m²)
If we hadn't invested in energy conservation
Actual energy usage
-14% reduction target
Downtown Campus Macdonald Campus

4
McGill’s Energy Management Plan is a collaborative effort that has involved scores of stakeholders, both
on and off campus as illustrated by Figure 8 and Figure 7.
INTERNAL STAKEHOLDERS: Building Operations | Project
Management | Design Services | Macdonald Campus
Operations | Procurement | McGill Energy Project | Vision
2020 | Vision 2020 Sustainable Labs Work Group |
Environmental Health and Safety | Financial Services |
McGill Athletics | Student Housing and Hospitality Services |
Student Services | Sustainability in Engineering at McGill
(SEAM) | Students’ Society of McGill University (SSMU) | the
Post-Graduate Students’ Society (PGSS) | Macdonald
Campus Students’ Society (MCSS)| the Sustainability Project
Fund (SPF) | Faculty of Management | Faculty of Medicine |
Faculty of Agriculture and Environmental Sciences | Faculty
of Science | Faculty of Law | Gault Nature Reserve | McGill
School of Environment | CFI Office | VP Research &
International Relations Office | scores of SPF project, CFI
projects, and renovation projects across campus
EXTERNAL STAKEHOLDERS: Gaz Métro | Hydro
Québec | Ministère de l’Éducation supérieure et de la
recherche du Québec | Ministère des Ressources
naturelles du Québec | Bureau de l’efficacité et de
l’innovation énergétiques | Association québécoise
pour la maîtrise de l’énergie | Groupe DATCH |
Natural Resources Canada | Office of Energy
Efficiency | Statistics Canada | UQÀM | Université de
Montréal | Université de Sherbrooke | Polytechnique
Montréal | ÉTS | Concordia | Université Laval |
University of Toronto | UBC | Harvard | Ville de
Montréal | Office municipal d’habitation de Montréal
| Association of Energy Engineers | ASHRAE |
Sustainable Labs Canada (SLCan) | AGPI | and more...
Figure 7 - Internal Stakeholders
Figure 8 - External Stakeholders

5
The first implementation phase of McGill’s Energy Management Plan was also an opportunity for
Utilities & Energy Management to test the reception of energy conservation programs within the
organization and the community. Some of the main projects outcomes are:
- Smart tools and technologies don’t obviate the need for brainpower.
- Human resources are our best and most valuable asset. Operators and technicians can
assimilate new skills and develop knowledge essential to the proper operation of ever more
complex systems and technologies that are becoming the new norm.
- Actively involving building operations staff early in the process is crucial to success.
- Long-term energy efficiency isn’t achieved by energy conservation projects but by changing
mindsets and habits.
- Improving energy performance is achieved through a constant collaborative process involving
energy staff, building operations staff, decision makers, and building users.
- The more on-campus energy performance increases, the harder it is to make incremental
savings.

6
2. REGULATORY AND POLICY CONTEXT
2.1. COMPLIANCE FRAMEWORK The Province of Québec has long been committed to climate action. The Province demonstrated
leadership with its Plan d’action 2013-2020 sur les changements climatiques whose targets for the
institution sector are outlined in the Mesures d’exemplarité de l’État document. The targets are:
- A 15% reduction in greenhouse gas emissions for institutional buildings by 2020 with reference
to 2009-2010;
- As of 2016, all new buildings and buildings undergoing major renovation must use renewable
energy as primary source of heating: fossil fuels cannot meet more than 25% of the heating
requirements of the building; during their operation phase, fossil fuels can only make up to 20%
of the building’s total annual energy use.
- Buildings on heat distribution networks such as McGill’s do not have to meet this requirement;
however, should heat generation equipment be upgraded in any way (capacity increase,
equipment upgrade or replacement), the network would have to comply with this requirement.
- All new constructions and major renovations must be 20% more efficient than the 2011 National
Energy Code of Canada for Buildings
- Institutional buildings whose heating oil usage represents more than 20% of the building’s total
annual energy use must be converted by 2020; after conversion, fossil fuels can only make up to
20% of the building’s total energy use and no more than 30% of the building’s heating
requirements can be met with fossil fuels.
In the wake of COP21, Québec unveiled its Politique énergétique 2030 in early 2016. The strategy sets
the roadmap for energy management and climate action to meet the Province’s commitment to reduce
GHG emissions 37.5% below the 1990 levels.
A few facts from this policy of interest to McGill’s operations include:
- An overarching goal of 37.5% reduction in greenhouse gas emissions and reaching 61%
renewable energy in the province’s energy mix by 2030;
- The reduction of petroleum-based fuel consumption and, as a cleaner alternative, the use of
natural gas;
- A 50% increase in the use of energy from biomass;
- Transport electrification with the target of 1 million electric vehicles on the roads by 2030 and
the use of natural gas for commercial transport;
- A reduction in energy intensity of 15% below the 2012 levels for institutional buildings by 2021;
- The requirement that renewable energy be the main source of heating and cooling for new
institutional buildings.
The policy has yet to be turned into action plans by each Ministry including the Ministère de l’Éducation
et de l’Enseignement supérieur, however, it is safe to assume that ministry action plans should use the
same targets and overarching goal as the Politique énergétique 2030.

7
2.2. UTILITIES TARIFFS AND PROGRAMS Further to developing programs to help meet energy efficiency and climate action targets set by the
provincial government, the two main utilities in Québec, Hydro Québec and Gaz Métro, also report to
the Québec Energy Board (la Régie de l’énergie) which has lately focused on the cost of peak demand on
end-users. The two utilities have historically driven market changes through their tariff offers and
incentive programs. It is essential that McGill’s Energy Management Plan leverage these programs to
maximize opportunities on campus.
2.2.1. Hydro Québec
The utility hasn’t yet developed an action plan to respond to the Politique énergétique 2030. Rather, it
appears Hydro Québec will maintain its energy conservation incentive program as is. Also, the utility
spearheaded a demand-side management program during peak hours in the winter (Dec 1st through
March 31st) in 2015-2016. Québec has an untypical profile when it comes to electricity usage. While
power demand peaks on hot, humid days, typically in the summer in the rest of North America, peak
demand hours occur on cold, windy days in Québec due to the widespread use of electricity for space
heating. On extremely cold days, Québec doesn’t generate enough electricity and must purchase some
from its neighbours (mainly Ontario and New England) at a very high cost. To reduce the burden, Hydro
Québec launched a demand-side management program that incentivizes clients who willingly reduce
their power demand during these hours. The utility has indicated the pilot year was a success and the
program is now recurring. Hydro Québec also launched an incentive program for the replacement of
heating oil-fueled heating systems which could be used to convert the last buildings burning heating oil
on campus, namely the Gault Nature Reserve and a few buildings on the Macdonald Campus.
2.2.2. Gaz Métro
Much like Hydro Québec, Gaz Métro’s energy efficiency incentive programs will remain in place for the
time being to support the Politique énergétique 2030 and shift the market. The 50% increase in biomass
target set in the Politique énergétique 2030 as well as the use of natural gas as a cleaner alternative to
heating oil and diesel both poise Gaz Métro in a favourable position to diversify its activities and
broaden its offer of renewable energy solutions. Gaz Métro is also working actively in the field of
renewable natural gas, i.e. methane from biomass, which is considered a renewable energy source and
part of the equation to decarbonize energy systems.
2.3. INSTITUTIONAL ORIENTATIONS 2.3.1. Vision 2020:
In 2010, the McGill Office of Sustainability engaged in a broad community process that resulted in Vision
2020, the University’s sustainability strategy. Vision 2020 identifies five categories where change needs
to happen to bring about the community’s vision for a more sustainable McGill. Among the actions5 of
interest to our energy management plan are:
5 See actions 3 (Sustainable Labs), 8 (Green Building), and 11 (Energy & Climate) in Vision 2020 Priority Action Briefs

8
- Sustainable Labs under the Research category. This action focuses on how we do research at
McGill. Utilities & Energy Management is collaborating with several stakeholders under the
leadership of Environmental Health and Safety to introduce change in the labs.
- Energy & Climate and Green Building both under the Operations category. McGill’s Energy
Management Plan is a key component of the Energy & Climate action as well as GHG
quantification. Utilities & Energy Management has also been instrumental to McGill’s Green
Building Standards and the hiring of a sustainable construction officer.
The second implementation phase of Vision 2020 will also focus on climate action which will seek to
make McGill become carbon neutral in the future. This plan will bring McGill closer to its vision that
“renewable energy sources supply the vast majority of McGill’s energy needs and McGill is progressively
increasing the share of its energy coming from renewable sources while minimizing non-renewables”
and “McGill’s natural and built environment supports resilient ecosystems, strong communities and
individual well-being”6.
2.3.2. Principal’s priorities:
Principal Fortier, installed as McGill’s principal in 2013, has developed five priority areas among which
the two priorities below echo with Utilities & Energy Management’s mission:
- Unleashing McGill’s full potential of research7: research is the most energy-intensive activity on
campus and Utilities & Energy Management will continue to engage with the research
community and with Facilities to find innovative solutions to ensure that researchers have
access to leading-edge facilities that are also energy efficient.
- Transforming our Campus8: McGill needs more space to fulfill its mission. Numerous projects
are on the table and Utilities & Energy Management will ensure that energy conservation and
sustainability be at the core of each project.
2.4. OTHER BEST PRACTICES 2.4.1. Universities in Québec and Canada
Utilities & Energy Management fosters ongoing relationships with the main universities in Québec
including Université de Montréal, UQÀM, Concordia, HEC Montréal, Université de Sherbrooke and
Université Laval. All have slightly different approaches to energy management. Université Laval and
Université de Sherbrooke are the most engaged in climate action: Laval claims to be the first university
to have become carbon neutral in Québec in November 20159 while Sherbrooke has the ambitious goal
to reduce greenhouse gas emissions between 80% and 95% below the 1990 levels by 205010. Among
the interesting projects recently implemented are the conversion of energy systems to work with low-
temperature hot water at Université de Sherbrooke, extremely-efficiency heat recovery from servers at
Université Laval, or fresh air and ventilation management in research buildings at UQÀM.
6 See Operations category in Vision 2020 Sustainability Strategy 7 Unleashing McGill’s Full Research Potential 8 Transforming our Campus 9 Plan de lutte aux changements climatiques de l’Université Laval 10 Budget carbone de l’Université de Sherbrooke

9
In Canada, UBC has a long proven track record of achievements in sustainability. UBC aims at reducing
its greenhouse gas emissions 100% and becoming a net positive energy producer by 2050. Among the
many initiatives it implemented, UBC replaced aging steam infrastructure with more efficient hot water
heating systems, made major lighting and ventilation upgrades, and put in place a continuous building
optimization program. UBC is presently working on a Community Energy and Emissions Plan to meet
the UBC’s ambitious targets.
Performance Metrics and Units
McGill Université de
Montréal Université
Laval Université de Sherbrooke
UBC Vancouver
Campus
University of Toronto
St George Campus
Site EUI GJ/m² 1.75 1.51 1.48 1.39 1.30 ±1.69
Energy per student enrolment
GJ per FTE
44 26 32 30 42 39
Energy use per sponsored research income
GJ per M$
2,903 2,227 3,216 4,621 3,397 1,901
GHG emissions per student enrolment
tCO2e per FTE
1.18 0.55 0.97 0.56 0.90 2.04
GHG emissions per sponsored research income
tCO2e per $M
78 47 98 88 73 101
GHG emissions per gross area
tCO2e per m²
0.047 0.032 0.045 0.028 0.028 ±0.085
Table 2 - Energy Performance Metrics - McGill vs Research-Oriented Canadian Universities
Table Legend: Lowest value Highest value
2.4.2. Universities in the USA
The table below shows how McGill compares with three of the most research-intensive universities in
the US.
Performance Metrics and Units
McGill Harvard MIT Stanford
Site EUI GJ/m² 1.75 1.47 ±2.93 ±2.65
Energy per student enrolment
GJ per FTE
44 181 306 230
Energy per sponsored research income (CAN) or R&D expenditures (USA)
GJ per M$
2,903 3,348 3,421 3,852
GHG emissions per gross area
tCO2e per m²
0.047 0.096 0.178 0.148
GHG emissions per FTE tCO2e per
FTE 1.18 11.77 18.57 12.85
GHG emissions per sponsored research income (CAN) or R&D expenditures (USA)
tCO2e per M$
78 218 208 216
Table 3 - Energy Performance Metrics - McGill vs. US Research Universities
The energy management and climate action context that prevails south of the border is very different
from Canada. For one thing, most electricity in the US is generated from fossil fuels, driving up scope 2
emissions. This combined with a strong leadership to make university campuses greener has led to the
creation of several policies at the national and state level as well as incentive programs to shift

10
paradigms. These mechanisms help boost the payback of renewable energy systems and traditional
energy conservation measures.
Most universities have implemented traditional energy-conservation measures the like of which McGill
has been implementing on campus since 2010. Harvard stands out with its green building program
whereby most of the renovations made on campus are LEED® certified, thereby ensuring optimal energy
performance and a minimum environmental impact. Scores of universities have installed solar panels
on their campuses and most of them purchase RECs (renewable energy certificates). Universities
located in areas where power grids are overused, such as California and New England, have been
implementing power demand management strategies and are starting to deploy smart grids.
2.5. SUMMARY OF COMPLIANCE REQUIREMENTS AND INSTITUTIONAL ORIENTATIONS The table below summarizes the many compliance requirements and institutional orientations McGill’s
Energy Management Plan must address.
Description Target Compliance
date Reference Metric Scope Framework
Reduce energy use intensity of building stock
-15% 2021 2012 Energy use intensity (GJ/m²/yr.)
All buildings QC PP
V2020
Increase energy performance of new buildings incl. major renovations
-20% 2016
National Energy Code of
Canada for Buildings
(2011)
Total energy use (GJ/yr.)
Per building, applicable to new constructions and major renovations
QC PP
Vision2020
Phase out use of heating oil in buildings
≤20% 2020 Current Heating oil use to total energy use ratio
Per building, applicable to buildings whose ratio is over threshold
QC V2020
Reduce peak power demand
N/A N/A Current Peak demand (kW(
Applicable to buildings enrolled
HQ
Reduce energy-related GHG emissions of buildings
-15% 2020 2009-2010 Scope 1 building-related GHG emissions (tCO2e/yr.)
All buildings QC PP
V2020
Use renewable energy as the main source of heating buildings
≤20% 2016 Current Fossil fuel use to total energy use ratio
Applicable to new stand-alone construction, existing stand-alone buildings undergoing major renovation, and McGill’s distribution should it undergo changes
QC
Reduce overall GHG emissions (QC)
-37.5% 2030 1990 Total GHG emissions (tCO2e/yr.)
All buildings QC
Work towards carbon neutrality (McGill)
-100% TBD current Total GHG emissions (tCO2e/yr.)
All sectors identified in McGill’s GHG inventory
QC V2020
Reduce GHG emissions related to transport
N/A N/A Current Transport-related emissions (tCO2e/yr.)
McGill-owned vehicles and Macdonald shuttle
QC V2020
Table 4 - Summary of Compliance Requirements and Institutional Orientations
HQ: utilities orientation (Hydro Québec) QC: provincial compliance requirements
PP: Principal’s Priorities V2020: Vision 2020 orientations

11
3. SITUATIONAL ANALYSIS OF ENERGY MANAGEMENT AT MCGILL
3.1. KEY PERFORMANCE INDICATORS UEM tracked down information from 1990 and was able to estimate with reasonable accuracy McGill’s
performance then. The table below shows key performance indicators as well as the relative change
between 1990 and 2015-2016. The 1990 baseline was chosen to align McGill’s targets with those of
Québec’s Politique énergétique 2030 and other international climate change agreements such as COP21.
The use of EUI (energy use intensity) as the main key performance indicator in energy management is
debatable. Indeed, this metric doesn’t take into account how efficiently space is used. For instance,
areas only used part of the time (e.g. weekdays 9 am to 5 pm) are allegedly used less efficiently than
similar areas that are also used weeknights and weekends or even 24/7; however, intensely-used areas
have a greater EUI and therefore appear be less energy efficient when they are in fact used more
efficiently. A more meaningful metric could be energy use intensity per working hour for instance.
Utilities & Energy Management is working toward defining another indicator that would account for
occupancy.
Performance indicator 1990 2016 Relative change
Gross area 549,421 m² 791,140 m² +44%
FTEs 22,61611
* 30,53511
* +35%
Total energy use 1,284,809 GJ11
* 1,223,675 GJ -5%
Renewable energy 28% 49% +21%
Normalized EUI – McGill 2.34 GJ/m² 1.63 GJ/m² -30%
Normalized EUI – QC average 1.71 GJ/m² 1.39 GJ/m²* -19%
McGill vs. QC average 37% higher 18% higher -19%
Total spend $8.8M $18.6M +113%
Total spend per area $15.95/m² $23.56/m² +48%
Energy rate (overall) $6.82/GJ $15.23/GJ +123%
GHG emissions12
(absolute) 48,501 tCO2eq 31,110 tCO2eq -36%
GHG emissions12 per area 88.3 kg CO2eq/m² 39.32 kg CO2eq/m² -55%
GHG emissions12
per FTE 2.14 tCO2eq/FTE 1.02 t CO2eq/FTE -52%
GHG emissions12
per energy
unit 37.8 kg CO2eq/GJ 25.42 kg CO2eq/GJ -33%
Table 5 - Key Performance Indicators, 1990 vs 2016
11 Estimates 12 Scope 1 emissions from stationary sources only

12
SWOT ANALYSIS The table below shows how well McGill is positioned to meet the targets set out in Québec’s Politique
énergétique 2030 and the opportunities to go even further in energy management and climate change
action.
Figure 9 - SWOT Analysis of Energy Management at McGill
Strengths
GHG emission reduction target 96% met
Energy use reduction target already met
Solidly established energy mgmt. practices
Strong cooperation with McGill Operations
Solid partnerships with utilities & tech experts
Opportunities
Hydro Québec’s new demand-side mgmt. and
heating oil conversion programs.
Province to develop/revamp climate action
incentive programs
Gaz Métro’s new orientations to diversify
operations incl. renewable natural gas
Canada Strategic Infrastructure Fund pgm.
Redevelopment of the Royal Vic
Weaknesses
Inertia typical of big organizations
End-users don’t pay for energy charges
Old heritage buildings with high facilities
condition index (i.e. requiring major
investment)
Lack of clear campus plan
Threats
Incentive programs from utilities & agencies
can be suspended at any time
McGill competes with private sector for
climate action incentive monies
Low energy prices penalize energy
conservation and renewable energy projects
Emission rights: federal & provincial
regulations, international agreements, market
forces.

13
4. 2016-2020 STRATEGY
4.1. VISION Our long-term vision is that McGill’s campuses are net-zero energy consumers and carbon neutral.
Energy performance is embedded in the culture of operation staff and building users as part of a more
global sustainability mindset.
4.2. GOAL FOR THE 2016-2020 PERIOD The 2016-2020 implementation phase will see to the transition of McGill’s energy systems from discrete
static “consumers” to dynamic smart grids that make use of synergies between endothermic and
exothermic systems. Renewable energy systems will be deployed and connected to these smart grids.
4.3. OBJECTIVES - Build backbone for heat exchange between buildings on downtown campus
- Deploy renewable energy systems on Macdonald, Campus building on the new low-temperature
distribution network
- Continue investing in energy conservation and push for greater energy efficiency in renovation
and construction projects
- Ensure achieved savings are sustained
4.4. ACTIVITIES - 100% energy conservation projects
- Mixed projects (energy conservation + alternative sources of funding)
- Energy programs
- Efficiency in Operations
- Community Engagement
4.5. IMPACTS - Reduction of energy intensity on campus 22% below 2012-13 level | 35% below 2002-03 level
- Absolute reduction of GHG emissions from stationary combustion of 13,500 tons of CO2e, i.e.
64% below 1990 level
- 53% renewable energy in McGill’s overall energy mix, 68% for Macdonald Campus
- 1.6 MW of peak demand charge avoided on average

14
5. ACTION PLAN
5.1. 100% ENERGY CONSERVATION PROJECTS Most of the success of McGill’s Energy Management Plan relies on an innovative funding mechanism:
projects are funded by internal loans repaid with the savings generated by the said projects. We are
calling this section 100% Energy Conservation Projects not because funding comes entirely from an
energy conservation loan but because the only drive behind the project is energy conservation and cost
savings.
One of our challenges is that we have grabbed the low-hanging fruit during the first implementation
phase of the Energy Management Plan. We must now tackle projects with longer paybacks that require
heavier upfront capital investment. Climate action and energy efficiency incentive programs must be
leveraged to maximize opportunities. Table 6 summarizes key figures of this project.
Investment of which energy loan
Savings Incentives Net payback
GHG reduction (tCO2e)
Deploy smart grids on DT campus
$4.59M
0.0%
$194k
$0.87M
19.2
1,101
Heat recovery from DT powerhouse stacks
$1.33M
100.0% $266k $0.53M
3.0
1,417
Peak demand management
$8.28M 14.3% $179k $0.00M
6.6
-52
Total $14.20M
17.7%
$639k
$1.40M
8.9
2,466
Table 6 - 100% Energy Conservation Projects
5.1.1. Deploy smart energy grids on downtown campus
In 2015, Utilities & Energy Management mandated a firm of consultants to develop a strategy to deploy
a heat recovery loop linking together the buildings of the southeast quadrant of downtown campus.
The consultants identified short- and medium-term measures that could save 14% of the quadrant’s
energy use and reduce greenhouse gas emissions 38%. Measures are broken down into two categories:
those that can benefit from synergies with upcoming infrastructure projects in this sector and the
remaining measures, including looping the buildings together, which will be implemented in a single
overarching project. Multiple incentive programs are considered to help fund this strategy.
5.1.2. Improve powerhouse and distribution networks efficiency
The downtown powerhouse has a total output capacity of 470,000 lb/h (i.e. 120 MW). It supplies most
of the downtown campus buildings with steam used for space heating, humidification, and sterilization.
It burns 13 to 15 million m³ of natural gas every year with an overall combustion efficiency of 80%. This
means that 20% energy is lost, i.e. around 100,000 GJ per year or ±8% of McGill’s annual energy use.
Investments will be made to install economizers on boiler stacks. There are scores of examples of
facilities that have installed boiler stack economizers and McGill will carefully review the pros and cons,
dos and don’ts of such a measure.

15
5.1.3. Manage peak demand
Peak demand management has become a stake for Gaz Métro and for Hydro Québec for slightly
different reasons. While natural gas supply greatly exceeds demand in North America at this time,
transport from gas fields in Western Canada to end-users in Central Canada has reached capacity and
extra transport, especially during cold winter days, has become extremely costly. As for Hydro Québec,
the utility has to purchase power from neighbouring states and provinces during extremely cold winter
days at a great cost. Both utilities have been instructed by the Québec Energy Board to develop
solutions to minimize the cost on end-users. Gaz Métro is revising its interruptible offer and Hydro
Québec spearheaded a demand-side management program in the winter of 2015-2016. McGill took
part in the pilot project and implemented load shedding measures in the Genome Building. Note that,
unlike McGill, most organizations that participated in the program used their emergency power
generators to reduce their power demand. Critics voiced concerns over the environmental impact of
running diesel generators to replace electricity purchased from neighbouring utilities. According to
Hydro Québec, taking into account the much greater emission factors of neighbouring utility networks13
(e.g. the overall emission factor for New England is 145, Ontario is 38 times greater, etc.) and
transmission losses, it still makes sense to use onsite emergency generators in Québec rather than
importing electricity.
Further to these offers, McGill also has an incentive to manage its peak demand in the summer. Indeed,
power demand reaches its apex on campus during the summer. The downtown distribution is at Hydro
Québec rate LG which charges for energy consumed (in kWh) and peak power demand (kW). In FY15-16
for instance, the downtown power distribution cost $4.7M in energy charges and $3.2M in demand
charges. Monthly demand charges are on average $70,000 greater during the summer months.
The proposed strategy consists in:
- Implementing demand-side management measures in the main buildings on downtown campus
including running emergency generators when Hydro Québec calls for peak demand hours and
implementing load shedding measures such as the ones implemented in the Genome building.
- Relocate and convert the downtown powerhouse generator from diesel to a co-generation,
natural gas engine. The powerhouse generator is temporarily located close to the James
Administration building. A project is on the table to relocate it behind the powerhouse. Instead
of replacing it with a traditional diesel engine, Utilities & Energy Management is looking into
installing a co-generation system fueled by natural gas. This system is proposed for two
reasons: natural gas as a greenhouse gas emission factor per unit of energy 32% less than that of
diesel and emits 90% less nitrous oxides which is the main source of urban smog and acid rain.
The second reason is that traditional engines have an overall efficiency of 20 to 30%. Co-
generation systems, also called combined heat and power (CHP), make use of the heat lost by
the engine and the stack and convert it to hot water to be used for space heating or other
purposes. CHP can reach 50 to 75% efficiency14.
13 Table 2 – Québec’s Default Emission Factors for Electricity Imports 14 US EPA – Combined Heat and Power Benefits

16
5.2. MIXED PROJECTS (ENERGY CONSERVATION + ALTERNATIVE SOURCES OF FUNDING) Some project do not offer reasonable paybacks or net-present values for Utilities & Energy Management
to undertake on its own. However opportunities exist and Utilities & Energy Management will seek to
create synergies to grab each opportunity.
Investment of which energy loan
Savings Incentives Net payback
GHG reduction (tCO2e)
Major HVAC System Upgrades
$40.00M
25.0%
$1.00M
$2.65M
7.3
3,991
Deploy non-conventional renewable energy systems
$1.50M
100.0%
$120k
$0.69M
6.7
978
Deploy smart grids on DT campus
$6.47M
77.3%
$445k
$0.00M
11.2
57
Total
$47.97M
34.4%
$1.56M
$3.35M
8.4
5,035
Table 7 - Mixed Projects (Energy Conservation + Alternative Sources of Funding)
5.2.1. Major HVAC system upgrades
With a building portfolio fifty years of age on average, McGill manages anywhere between $20M and
$100M worth of major renovations every year. Major buildings will be upgraded in the years to come.
Utilities & Energy Management is mostly interested in building HVAC systems as they drive anywhere
between 50 to 80% of a building’s consumption. When appropriate, Utilities & Energy Management will
participate technically and financially to such projects in order to increase energy efficiency on campus
and to grab opportunities that would otherwise be missed in a generally very tight budget context.
5.2.2. Deploy non-conventional renewable energy systems
In a retrofit context, and even more so in McGill’s context, most renewable energy technologies don’t
have acceptable paybacks or a positive net present value over the expected lifetime of the systems.
Installing any such system must therefore be financed in part by alternate sources of funding such as
donations to a fund to make McGill energy systems greener or by climate action incentive programs. In
support of McGill’s Vision 2020, Utilities & Energy Management will seek to increase the presence of
renewable energy systems on campus. It should also be noted that the cost of renewable energy is
decreasing at an accelerated pace relative to the cost of traditional energy; renewable energy
technologies should thus become much more affordable in a near future.
5.2.3. Deploy smart energy grids on downtown campus
Synergies will be created between the smart grid deployment project and other infrastructure projects
so as to leverage capital investments already required to update HVAC and mechanical systems. The
idea is to influence these project designs and contribute in part to their funding so as to implement the
long-term network strategy developed for the four quadrants of the downtown campus.

17
5.2.4. Propose a strategy for the deployment of charging stations
Utilities & Energy Management along with Transportation & Parking Services are the two main
stakeholders in this project. McGill must adapt to changing market conditions. Québec has set
ambitious goals to increase the market penetration of electric vehicles and real estate owners and
managers such as McGill must prepare for the market shift. UEM will be strongly involved in the
selection of the appropriate technology to charge electric vehicles on campus.
5.3. ENERGY CONSERVATION PROGRAMS Building on the success of the first implementation phase of McGill’s Energy Management Plan, Utilities
& Energy Management proposes to carry on with the programs listed below. These programs require
minimum investment, light interventions, and have a very short payback.
Investment
of which energy loan
Savings Incentives Net payback
GHG reduction (tCO2e)
Retro-Commissioning
$1.05M
100.0%
$386k
$0.21M
2.2
1,540
Insulation
$0.50M
100.0%
$500k
$0.00M
1.0
2,661
Building and Systems Optimization
$2.00M
50.0%
$458k
$0.00M
2.2
1,829
Total
$3.55M
71.8%
$1.34
M
$0.21M
1.7
6,030
Table 8 - Energy Conservation Programs
5.3.1. Retro-commissioning
Retro-commissioning is one of the plan’s programs with the shortest payback. It is much like doing a
health check-up of a building’s systems and fixing what ought to be fixed. A team of consultant do a
walk-through of the building, review the sequence of operation of the different systems, analyze energy
logs and identify inefficiencies. The goal is to make sure that the systems work as efficiently as possible
to deliver optimal conditions for building users. 15 buildings were retrofitted during the first
implementation phase for an overall payback of 1 year. 15 smaller buildings including student
residences have been identified for the new implementation phase.
5.3.2. Insulation
Insulating uninsulated pipes is the program with the shortest payback, i.e. less than one year. With
more than 15 km of main distribution pipes, more than 1,000 HVAC systems on campus and countless
interventions, there are always sections of pipes to be re-insulated.

18
5.3.3. Building and systems optimization
This program is for short payback, limited-scale interventions that either fall out of scope of Utilities &
Energy Management’s regular programs (e.g. Retro-commissioning) or are competing with other more
urgent interventions in Building Operations’ budget. A good example would be heat recovery systems: a
malfunctioning heat recovery coil wouldn’t impede the normal operation of a system and wouldn’t be
treated as an emergency by Building Operations. In the meantime, every day the said heat recovery coil
is out of function can cost thousands of dollars to the University. This program, in partnership with
Building Operations, is meant to fund such interventions.
The program is divided into two categories: project with a two- to three-year payback (e.g., installation
of CO2 sensors for demand control ventilation) and projects with a six- to eight-year payback (e.g.,
installation of variable frequency drives).
5.4. EFFICIENT OPERATIONS In any organization, operations staff are crucial to the longevity of savings. The first implementation phase
of McGill’s Energy Management Plan saw the birth and strengthening of the relationship between Utilities
& Energy Management and Building Operations. Utilities & Energy Management will continue to nurture
this relationship and develop new relationships with other operations areas in the organization.
Investment of which energy loan
Savings Net payback
GHG reduction (tCO2e)
Efficient operations
$0.03M
0.0%
$68k
0.4
74
Improve powerhouse and distribution networks efficiency
$0.38M
100.0%
$377k
1.0
0
Ensure continuity of energy savings
$0.65M
0.0%
$0k
--
0
Total
$1.05M
35.8%
$445k
0.8
74
Table 9 - Efficient Operations
5.4.1. Empower building operators
As mentioned times and again, operations staff are critical to energy efficiency. Utilities & Energy
Management has actively collaborated with building control technicians during the first implementation
phase of the plan. We now wish to develop a new partnership with building operators, to empower
them with the tools and knowledge they need to increase energy performance on campus. The plan is
to:
- Offer the Building Operators Certification (BOC) training to interested building operators. This
certification program was launched in the mid ‘90s in the USA where over 10,000 building
operators have been certified since. The certification program seeks to empower building
operators to operate HVAC systems more efficiently and consists of training sessions around
building engineering, systems controls, etc. Surveys show BOC-certified operators save on
19
average 2.5% of their building’s energy. The different modules were mostly designed and are
taught by senior building operators.
- Offer Lean white- and yellow-belt training to interested building operators. This phase of the
program is meant to supply basic problem-analysis and solution-seeking tools to building
operators.
- Organize Kaizen workshops with trained operators, ideally in buildings that have already been
retro-commissioned. During this final step, trained operators will use the knowledge and skills
they have honed in to participate in workshops animated by Lean experts along with staff from
Building Operations and Utilities & Energy Management. The goal is to pinpoint inefficiencies
and collectively find solutions to improve building energy performance.
5.4.2. Improve powerhouse and distribution networks efficiency
McGill’s downtown and Macdonald campus powerhouses represent 45% of McGill’s overall energy and
90% of McGill’s thermal energy. Energy is extracted from natural gas to generate steam and hot water
for space heating, humidification, and sterilization. Over 15 km of networks link the powerhouses with
the main buildings on the downtown and Macdonald campuses. Losses and inefficiencies can occur in
many places and have an exponential impact on McGill’s overall energy performance. Much as building
operators, the powerhouse staff are critical to energy efficiency. Utilities & Energy Management
proposes to review activities and analyze opportunities for improvement using a Lean – Six-Sigma
approach with expertise of key resources from McGill’s central administration.
5.4.3. Ensure continuity of energy savings
Monitoring performance is a sine qua non condition to sound management. Back in 2010, hundreds of
energy meters were installed in more than 70 buildings downtown, on the Macdonald campus, and in
off-campus residences. These meters monitor 80% of the University’s overall demand in real time. A
software solution was deployed to visualize data, analyze trends, and generate reports. The 400 and
more meters now installed must be inspected at regular intervals and around 2% of them need to be
replaced at any time. This set of tools allows tracking savings and detecting deviation from normal
trends.
5.5. COMMUNITY ENGAGEMENT 5.5.1. Sustainable Procurement
McGill procures hundreds of millions of dollars of goods and services every year. New equipment,
particularly research equipment, has a major impact on energy usage on campus and contributes to an
ever-growing demand. Procurement Services assumes its leadership and has developed a five-year
sustainability strategy to influence purchases on campus and make sure McGill lives up to its aspirations.
Utilities & Energy Management is an active stakeholder in this process and collaborates with
Procurement Services to change purchasing habits of researchers, decision-making parameters (e.g.
consider total cost of ownership instead of lowest upfront cost), and requirements from granting
agencies.
5.5.2. Research and Energy
The Sustainable Labs workgroup was set up in response to Vision 2020. Research represents more than
40% of McGill’s energy use while research space only covers around 25% of the University’s total square
footage. There are more than 1,300 research fume hoods on campus. Fume hood users and lab users in

20
general have a significant impact on McGill’s energy and sustainability performance. Utilities & Energy
Management is an active stakeholder of the Sustainable Labs workgroup which strives to continuously
educate a high-turnover population on energy conservation in labs via trainings, the inclusion of energy
criteria in the lab inspection process, awareness campaigns, etc.
A student-led initiative called Shut Your Sash15 in the Life Sciences Complex in 2011 showed the impact
of lab users on energy use: savings in the order of 5% of the building’s overall energy use were observed
at the end of the project. In 2013, Utilities & Energy Management, supported by the Sustainability
Projects Fund16, experimented different prompts and messages to nudge lab users to shut their sash.
The results were manifold: such programs only have an impact in labs with high fume hood to square
footage ratios; dynamic messages based on gamification principles led to greater savings than static
messages such as the ones installed in Life Sciences; fume hood users get used to static messages and
their effect wears off with time, making it necessary to relaunch an awareness campaign, train incoming
lab users, or use dynamic prompts.
We will continue those efforts, work with stakeholders on campus to develop trainings for all new lab
users, and support change leaders in the research community to push for newer, more environmentally-
friendly and energy-efficient practices.
5.5.3. Applied Student Research
Applied Student Research is an opportunity for students to address the needs of their community for
academic credit in a hands-on way, bridging the gap between theories taught in the classroom and their
practical application17. For Utilities & Energy Management this means tapping into the knowledge of
McGill’s student population to investigate technologies in development and how to deploy them on
campus while offering students the opportunity to learn more about these technologies and energy
systems in general.
There are many challenges to ASR: finding the right students with enough background and an
understanding of systems thinking, finding projects that work well with students timeline (typically one
or two terms), or getting staff’s buy-in on the project output.
5.5.4. Communications
McGill has several success stories to tell when it comes to energy management. Over the course of
2010-2015, energy use veered sharply downward and greenhouse gas emissions were cut down. The
University is at the forefront of energy management in the province and in Canada. Our
communications strategy will be twofold. We will share positive stories with the McGill community to
raise awareness on McGill’s achievements in energy conservation and seek the participation of the
community to the different programs and projects on campus. We will also work with external
stakeholders to better disseminate our successes which will contribute to reaffirm McGill’s image.
15 Shut Your Sash 16 The Fume Hood Experiment 17 Definition of ASR from the McGill Office of Sustainability website

21
5.6. MEETING COMPLIANCE REQUIREMENTS AND MCGILL’S OBJECTIVES
Area of intervention
Red
uce
en
ergy
use
inte
nsi
ty o
f b
uild
ing
sto
ck
Incr
ease
en
ergy
per
form
ance
of
new
b
uild
ings
incl
. maj
or
ren
ova
tio
ns
Ph
ase
ou
t u
se o
f h
eati
ng
oil
in
bu
ildin
gs
Red
uce
pea
k p
ow
er
dem
and
Red
uce
en
ergy
-re
late
d G
HG
emis
sio
ns
of
bu
ildin
gs
Use
ren
ewab
le
ener
gy a
s th
e m
ain
sou
rce
of
hea
tin
g
bu
ildin
gs
Red
uce
ove
rall
GH
G
emis
sio
ns
(QC
)
Wo
rk t
ow
ard
s ca
rbo
n
neu
tral
ity
(McG
ill)
Red
uce
GH
G
emis
sio
ns
rela
ted
to
tran
spo
rt
Smart grids DT ✓ ✓ ✓ ✓ ✓
Increase DT powerhouse efficiency
✓ ✓ ✓ ✓
Peak demand management
✓
Major HVAC upgrades
✓ ✓ ✓ ✓ ✓ ✓ ✓
Non-conventional renewable energy systems
✓ ✓ ✓ ✓ ✓
Retro-commissioning
✓ ✓ ✓ ✓ ✓ ✓
Insulation ✓ ✓ ✓ ✓
Buildings and systems optimization
✓ ✓ ✓ ✓
Efficient operations
✓ ✓ ✓ ✓ ✓ ✓ ✓
Improve distribution efficiency
✓ ✓ ✓ ✓
Energy savings persistence
✓ ✓ ✓ ✓ ✓ ✓ ✓
Community engagement
✓ ✓ ✓ ✓
Table 10 - Meeting Compliance Requirements and Institutional Orientations
22
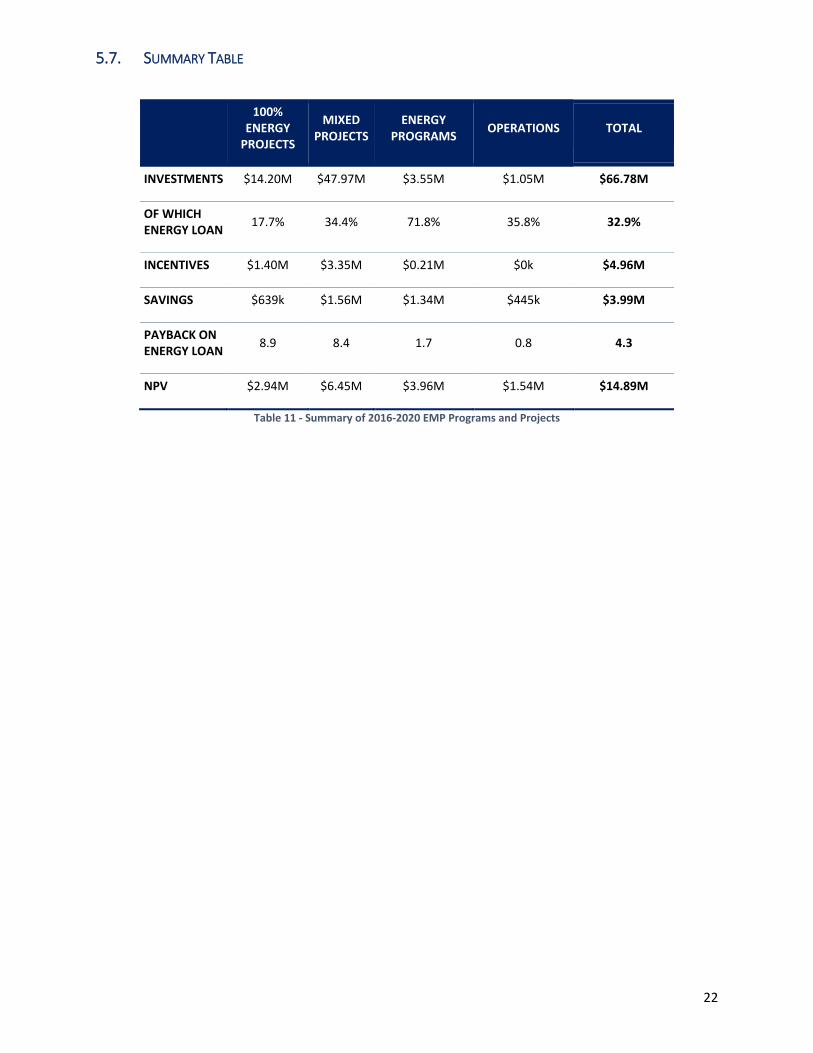
5.7. SUMMARY TABLE
100% ENERGY
PROJECTS
MIXED PROJECTS
ENERGY PROGRAMS
OPERATIONS TOTAL
INVESTMENTS $14.20M $47.97M $3.55M $1.05M $66.78M
OF WHICH ENERGY LOAN
17.7% 34.4% 71.8% 35.8% 32.9%
INCENTIVES $1.40M $3.35M $0.21M $0k $4.96M
SAVINGS $639k $1.56M $1.34M $445k $3.99M
PAYBACK ON ENERGY LOAN
8.9 8.4 1.7 0.8 4.3
NPV $2.94M $6.45M $3.96M $1.54M $14.89M
Table 11 - Summary of 2016-2020 EMP Programs and Projects

23
APPENDICES

24
Appendix A – Detailed Proposal

25
Appendix B – Key Performance Indicators – 1990 vs. 2016
Performance indicator 1990 2015-2016
Relative change
Total (%) Average annual (%)
Gross area 549,421 m² 791,140 m² +44% +1.4%
FTEs 22,61618 30,53518 +35% +1.2%
Total energy use 1,284,809 GJ18 1,223,675 GJ -5% -0.2%
- electricity 28% 49% +21% --
- natural gas 66% 50% -16% --
- heating oil & other 6% 0% -6% --
Normalized EUI – McGill 2.34 GJ/m² 1.63 GJ/m² -30% -1.4%
Normalized EUI – QC average 1.71 GJ/m² 1.39 GJ/m²* -19% -0.8%
McGill vs. QC average 37% higher 18% higher -19% --
Total spend $8.8M $18.6M +113% +2.9%
- electricity 54% 64% +10% --
- natural gas 41% 36% -5% --
- heating oil & other 5% 0% -5% --
Total spend per area $15.95/m² $23.56/m² +48% +1.5%
Energy rate (overall) $6.82/GJ $15.23/GJ +123% +3.1%
- electricity $13.20/GJ $19.58/GJ +48% +1.5%
- natural gas $4.22/GJ $10.05/GJ +159% +3.7%
- heating oil & other $6.01/GJ $15.73/GJ +162% +3.8%
GHG emissions19 (absolute) 48,501 tCO2eq 31,110 tCO2eq -36% -1.7%
GHG emissions per area 88.3 kg CO2eq/m² 39.32 kg CO2eq/m² -55% -3%
GHG emissions per FTE 2.14 tCO2eq/FTE 1.02 t CO2eq/FTE -52% -2%
GHG emissions per energy unit 37.8 kg CO2eq/GJ 25.42 kg CO2eq/GJ -33% -2%
18 Estimated data 19 Scope 1 emissions from stationary combustion only