2016 ambient air monitoring network plan report€¦ · · 2017-05-302016 ambient air monitoring...
TRANSCRIPT
Salt River Pima-Maricopa Indian Community (SRPMIC)
2016 Ambient Air Monitoring Network Plan Report
May 2017
Community Development Department (CDD) Environmental Protection & Natural Resources (EPNR)
10005 East Osborn Road Scottsdale, AZ 85256

2
INTRODUCTION
The Salt River Pima-Maricopa Indian Community (SRPMIC) has developed an air monitoring network for measuring ambient concentrations of criteria pollutants and associated meteorological parameters. The operation of these Tribal Monitoring Sites (TMS) follows the United States Environmental Protection Agency (USEPA) State and Local Air Monitoring Sites (SLAMS) guidance recommendations and documents. This Annual Air Monitoring Network Review for 2016 is being submitted by the SRPMIC Community Development Department (CDD) Environmental Protection & Natural Resources (EPNR) Division to the United States Environmental Protection Agency (USEPA) Region 9 as outlined in 40 CFR Part 58.10. In addition, changes made to the network design and special projects conducted during 2016 and a 3-year data summary are included in this document.
AMBIENT MONITORING NETWORK
The purpose of the SRPMIC air-monitoring network is to measure ambient concentrations of the selected criteria pollutants at various locations across the Community. These data are used to assess health and welfare effects and determine pollution source both on and off the Community. The criteria pollutants measured are ozone (O3), PM10 and PM2.5; the meteorological parameters include wind speed, wind direction, ambient temperature, precipitation, delta temperature, solar radiation, relative humidity, and ambient pressure. The collection of these data began in 2002 and continues to date. The three basic monitoring objectives with six types of monitoring sites and five measuring scales were used to develop the monitoring network.
MONITORING OBJECTIVES
1. Provide air pollution data to the general public in timely manner; 2. Support compliance with ambient air quality standards and emission strategy development;
and 3. Support for air pollution research studies.
TYPES OF MONITORING SITE OBJECTIVES
Determine the highest concentrations expected to occur in the area covered by the network;
Measure typical concentrations in areas of high population density;
Determine general background concentration levels;
Determine the impact of significant sources or source categories on air quality;
Determine the extent of regional pollutant transport among populated areas, and in support of secondary standards; and
Measure air pollution impacts on visibility, vegetation damage, or other welfare-based impacts.

3
SPATIAL SCALES This SLAMS (Tribal) network consists of ambient air monitoring sites that provide data to meet the required monitoring objectives. All SRPMIC air monitoring sites have the basic monitoring objective of NAAQS comparison. Monitoring sites generally correspond to a spatial scale identified in 40 CFR Part 58 Appendix D. The goal of locating monitors is to correctly match the spatial scale represented by the sample of monitored air with the spatial scale most appropriate for the monitoring site type, air pollutant be measured, and the monitoring objective. Spatial scale of representativeness is described in terms of the physical dimension of the air parcel nearest to a monitoring station throughout which actual pollutant concentrations are reasonably similar. Table 1 lists these spatial scales that is reference to 40 CFR Part 58, Appendix D, 1.2.
Table 1: Spatial Scales
Spatial Scale Dimension Microscale Several meters up to 100 meters
Middle Scale 100 meters up to 0.5 kilometers
Neighborhood Scale 0.5 kilometers to 4.0 kilometers
Urban Scale 4 kilometers to 50 kilometers
Regional Scale Tens to hundreds of kilometers
40 CFR Part 58 Appendix D also describes the relationship between the site type and the spatial scales that are generally most appropriate for each site type. Table 2 summarizes this relationship.
Table 2: Site Type and Scales
Site Type Appropriate Siting Scales Highest Concentration Micro, Middle, Neighborhood (Sometimes Urban or regional
for secondary formed pollutants)
Population Oriented Neighborhood, Urban
Source Impact Micro, Middle, Neighborhood
General / Background & Regional Transport
Urban, Regional
Welfare-related Impact Urban, Regional
NETWORK LOCATION Four monitoring sites were operated by the SRPMIC during 2016 at various locations and for various durations and purposes. The site name, abbreviation, AQS Code, Site Type, Site Scale and the Criteria Pollutants monitored are included in Table 3; the location of each site, including the longitude/latitude and major cross-streets is presented in Table 4. The monitoring network meets the monitoring objectives defined in Appendix D to 40 CFR Part 58. A location map of the Community and monitoring site locations are presented in Figures 1 and 2, respectively. Photographs of the sites and associated data summaries are included at the end of this report.

4
Table 3: SLAMS Summary
Site Name AQS Code Site Type Site Scale Pollutants
Senior Center (SC) 04-013-7020 Population Exposure Neighborhood PM10, PM2.5, O3
Red Mountain (RM) 04-013-7021 Regional Transport, Highest Conc.
Urban O3
Lehi (LE) 04-013-7022 Population Exposure Neighborhood PM10, O3
High School (HS) 04-013-7024 Population Exposure Neighborhood PM10, O3
Table 4: Site Locations
Site Latitude Longitude Location SC 33.488166 111.854933 Osborn Rd/Alma School Rd
RM 33.507916 111.754616 SR87/Arizona Canal
LE 33.474533 111.80505 Oak Street/Stapley Drive
HS 33.50805 111.8378 Chaparral Rd/Country Club Drive
INSTRUMENTATION 40 CFR Parts 50 and 53 define Federal Reference Methods (FRMs) and Federal Equivalent Methods (FEMs), which provide precise methodology for quantifying ambient concentrations of air pollutants. FRMs are monitoring methods that are associated with the NAAQS for the pollutant described in the appendices to 40 CFR 50 and determined by EPA to be FRMs. FEMs are alternative monitoring methods that have been designated by EPA as obtaining equivalent results when compared to the FRM, as determined by 40 CFR 53. An additional option for air monitoring agencies is the Approved Regional Method (ARM). This designation requires the applying agency to conduct specific field testing and evaluation demonstrating that the method meets Class III precision and accuracy requirements listed in Subpart C of 40 CFR Part 53. During 2016, SRPMIC used FRMs to collect filter-based PM10 and PM2.5 samples and FEMs for continuous PM10 and ozone. SRPMIC does not have approval for any ARMs. Two types of PM10 monitors were used throughout the monitoring network: 1) filter-based low volume monitors, and 2) Tapered Element Oscillating Microbalance (TEOM) monitors which measure PM10 continuously.
During 2016, the PM2.5 monitors used throughout the monitoring network were filter-based low volume monitors equipped with the appropriate size fractioning; a TEOM Filter Dynamics Measurement Systems (FDMS) FEM which measures PM2.5 continuously is planned to be operational in 2018. A listing of the parameters and quantity of site instrumentation is presented in Table 5.

5

6
7
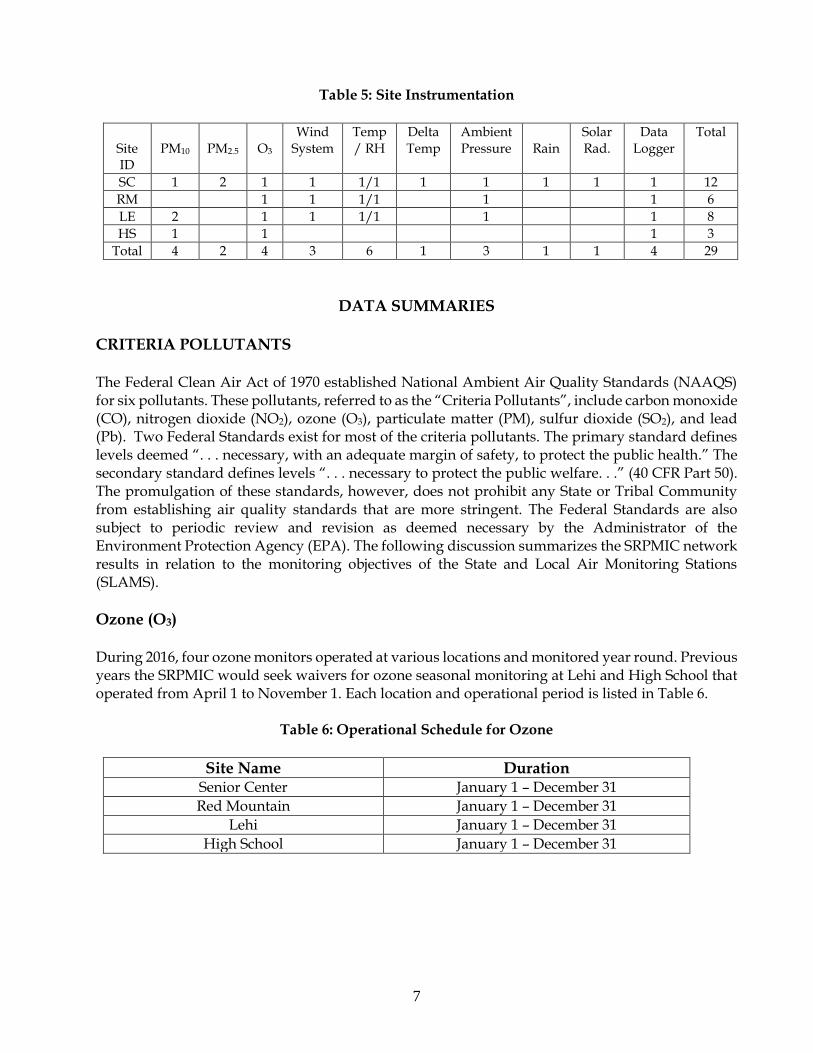
Table 5: Site Instrumentation
Site ID
PM10
PM2.5
O3
Wind System
Temp / RH
Delta Temp
Ambient Pressure
Rain
Solar Rad.
Data Logger
Total
SC 1 2 1 1 1/1 1 1 1 1 1 12
RM 1 1 1/1 1 1 6
LE 2 1 1 1/1 1 1 8
HS 1 1 1 3
Total 4 2 4 3 6 1 3 1 1 4 29
DATA SUMMARIES
CRITERIA POLLUTANTS The Federal Clean Air Act of 1970 established National Ambient Air Quality Standards (NAAQS) for six pollutants. These pollutants, referred to as the “Criteria Pollutants”, include carbon monoxide (CO), nitrogen dioxide (NO2), ozone (O3), particulate matter (PM), sulfur dioxide (SO2), and lead (Pb). Two Federal Standards exist for most of the criteria pollutants. The primary standard defines levels deemed “. . . necessary, with an adequate margin of safety, to protect the public health.” The secondary standard defines levels “. . . necessary to protect the public welfare. . .” (40 CFR Part 50). The promulgation of these standards, however, does not prohibit any State or Tribal Community from establishing air quality standards that are more stringent. The Federal Standards are also subject to periodic review and revision as deemed necessary by the Administrator of the Environment Protection Agency (EPA). The following discussion summarizes the SRPMIC network results in relation to the monitoring objectives of the State and Local Air Monitoring Stations (SLAMS).
Ozone (O3) During 2016, four ozone monitors operated at various locations and monitored year round. Previous years the SRPMIC would seek waivers for ozone seasonal monitoring at Lehi and High School that operated from April 1 to November 1. Each location and operational period is listed in Table 6.
Table 6: Operational Schedule for Ozone
Site Name Duration Senior Center January 1 – December 31
Red Mountain January 1 – December 31
Lehi January 1 – December 31
High School January 1 – December 31

8
One-hour Average Concentrations One-hour concentrations of ozone during 2016 were moderate; no exceedance of the former one-hour ozone standard was observed. A summary of the one-hour concentrations obtained at the four locations is presented in Table 7; the distribution of the one-hour concentrations is presented in Table 8.
Table 7: 1-Hour Summary
Site
Max. (ppm) Date Time
2nd High (ppm) Date Time
3rd High (ppm) Date Time
4th High (ppm) Date Time
Number Of
Exceedances
Number of Samples
RM 0.098 7/28 1600
0.091 6/21 1500
0.090 7/19 1600
0.089 6/13 1400
0 8696
SC 0.095 7/28 1500
0.091 6/21 1400
0.090 6/3 1300
0.085 7/26 1300
0 8737
LE 0.099 7/28 1500
0.089 6/21 1400
0.089 7/19 1600
0.088 6/3 1300
0 8685
HS 0.093 6/3 1300
0.092 7/28 1500
0.088 6/21 1400
0.085 7/26 1300
0 8618
Table 8: Distributions
Number of 1-Hour Average Values (ppm)
Interval: 0.000 to 0.040
0.041 to 0.080
0.081 to 0.120
0.121 to 0.160
0.161 to 0.200
0.201 to 0.240
0.241 to 0.280
>0.280
Site
RM 5630 3039 27 0 0 0 0 0
SC 6465 2589 13 0 0 0 0 0
LE 5893 2773 19 0 0 0 0 0
HS 6054 2553 11 0 0 0 0 0

9
Eight-hour Average Concentrations Eight-hour average concentrations of ozone were moderate to high. There were seventeen exceedance-days of the new eight-hour ozone standard (0.070ppm) and four violations of the standard. A summary of the eight-hour concentrations is presented in Table 9; the distribution of the concentrations is presented in Table 10.
Table 9: Eight-Hour Summary
Site
Max. (ppm) Date
Time*
2nd High (ppm) Date
Time*
3rd High (ppm) Date
Time*
4th High (ppm) Date
Time*
Number Of
Exceedances
Number of Samples
RM 0.076 7/21 1100
0.076 7/28 1100
0.074 5/13 1000
0.074 6/28 1100
7 8717
SC 0.075 7/28 1100
0.073 7/21 1100
0.071 6/28 1100
0.070 7/20 1000
3 8769
LE 0.076 7/28 1100
0.075 7/21 1100
0.073 6/28 1100
0.072 5/13 1000
4 8727
HS 0.074 7/28 1100
0.072 6/28 1100
0.071 8/15 1100
0.070 7/20 1000
3 8638
*Time – Time is beginning hour (Mountain Standard Time)
Table 10: Distribution
Number of Eight-Hour Average Values (ppm)
Interval: 0.000 to 0.030
0.031 to 0.060
0.061 to 0.075
0.076 to 0.095
0.096 to 0.115
0.116 to 0.135
0.136 to 0.155
>0.155
Site
RM 2868 5560 285 4 0 0 0 0
SC 4202 4355 212 0 0 0 0 0
LE 3717 4752 256 2 0 0 0 0
HS 3904 4507 227 0 0 0 0 0

10
Ozone Minimum Monitoring Requirements The ozone design criteria of SLAMS minimum monitoring requirements specifies that state and local agencies must operate ozone sites for various locations depending upon area size in terms of population and geographic characteristics as define in 40 CFR Part 58, Appendix D, 4.1. SRPMIC is within the Core Base Statistical Area (CBSA) of the Phoenix metropolitan. Therefore, the CBSA is applied to SRPMIC monitoring network. The SRPMIC network meets the minimum monitoring requirements for all criteria pollutants measured. A summary of the ozone minimum monitoring requirements is presented in Table 11.
Table 11: 2016 Ozone Minimum Monitoring Requirements
CBSA
County
Population & Census
Year (July 2016)
8-Hour Design Value 2014 – 2016
(ppm)
Site Name AQS ID
Required Monitors
Active Monitors
Monitors Needed
Phoenix – Mesa –
Scottsdale
Maricopa
4,242,9971
0.072
Senior Center
040137020
32
42
0
Phoenix – Mesa -
Scottsdale
Maricopa
4,242,9971
0.075 Red
Mountain 040137021
32
42
0
Phoenix – Mesa -
Scottsdale
Maricopa
4,242,9971
0.074
Lehi 040137022
32
42
0
Phoenix – Mesa -
Scottsdale
Maricopa
4,242,9971
0.071
High School
040137024
32
42
0
1 – United States Census Bureau estimate July 1, 2016 2 – For entire network

11
Particulate Matter (PM10) During 2016, PM10 samplers operated at one location on a 1 in 6 day schedule throughout the year; two locations operated continuously throughout the year. Each location and operational period is listed in Table 12.
Table 12: Operational Schedule for PM10
Site Name Duration Senior Center (continuous) January 1 – December 31
Lehi Fire (6-day schedule) January 1 – December 31
High School (continuous) January 1 – December 31
One-hour Average Concentrations During 2016, a continuous PM10 sampler operated at the High School and Senior Center. A summary of the hourly average concentrations and distribution are provided in Tables 13 and 14, respectively. One-hour average concentrations of PM10 generally were low. Negative and extremely high outliers did occur, although approximately 84% of the values were less than 50 µg/m3 and approximately 98% were less than 150µg/m3.
Table 13: One-Hour Average PM10 Concentration Summary
Site
Max. (ug/m3)
Date
2nd High (ug/m3)
Date
Min. (ug/m3)
Date
Annual Average (ug/m3)
Number of
Samples
% Recovery
HS 1573 7/29
1538 8/24
-4 7/31
36.5 8717 99.2
SC 819 7/19
772 8/24
-3 10/1
31.0 8738 99.5
Table 14: One-Hour Average PM10 Concentration Distribution
Number of One-hour Average Concentrations (ug/m3)
Interval: <0 0 to 50 51 to 100
101 to 150
151 to 250
251 to 500
501 to 750
751 to 1000
>1000
Site
HS 11 7159 1095 264 119 55 11 3 2
SC 9 7502 937 185 72 24 7 2 0

12
Twenty-Four Hour Average Concentrations Twenty-four hour average concentrations of PM10 were generally low during 2016. There were no exceedances or violations of the 24-hour standard. A summary of the 24-hour average concentrations is presented in Table 15; the distribution of the concentrations is presented in Table 16.
Table 15: Twenty-Four Hour Average PM10Concentration Summary
Site
Max. (ug/m3)
Date
2ndHigh (ug/m3)
Date
Number of
Exceedances
Annual Average (ug/m3)
Number of Samples
HSa 115 6/16
111 8/24
0 36.1 364
SCa 93 4/25
86 4/15
0 30.5 365
LE-Pb 110 9/27
76 10/21
0 26.7 60
LE-Cb 108 9/27
72 10/21
0
26.3 61
P-Primary C-Collocated aContinuous (TEOM) bFilter-based (6-day schedule)
Table 16: Twenty-Four Hour Average PM10 Concentration Distributions
Number of Twenty-Four Hour Average Concentrations (ug/m3)
Interval: 0 to 25 26 to 50
51 to 75
76 to 100
101 to 125
126 to 150
151 to 175
176 to 200
>200
Site
HSa 126 157 62 14 5 0 0 0 0
SCa 151 169 40 5 0 0 0 0 0
LE-Pb 38 15 5 1 1 0 0 0 0
LE-Cb 39 16 5 0 1 0 0 0 0

13
PM10 Minimum Monitoring Requirements The PM10 design criteria where state and local agencies must operate the minimum number of required SLAMS sites as referred to 40 CFR Part 58, Appendix D, 4.6 (a). SRPMIC is within the Core Base Statistical Area (CBSA) of the Phoenix metropolitan. Therefore, the CBSA is applied to SRPMIC monitoring network. The SRPMIC network meets the minimum monitoring requirements for all criteria pollutants measured. A summary of the PM10 minimum monitoring requirements is presented in Table 17.
Table 17: PM10 Minimum Monitoring Requirement
CBSA
County
Population & Census
Year (July 2016)
Max Concentration
24-Hour (ug/m3)
Max Concentration
Site Name (AQS ID)
Required Monitors
Active Monitors
Needed Monitors
Phoenix – Mesa -
Scottsdale
Maricopa
4,242,9971
93
Senior Center
040137020
6 – 102
42
0
Phoenix – Mesa -
Scottsdale
Maricopa
4,242,9971
110
Lehi
040137022
6 – 102
42
0
Phoenix – Mesa –
Scottsdale
Maricopa
4,242,9971
115
High School 040137024
6 – 102
42
0
1 – United States Census Bureau estimate July 1, 2016 2 – For entire network

14
Particulate Matter (PM2.5) During 2016, PM2.5 samplers operated at one location on a 1 and 6 day schedule. The 1 and 6 day schedule was granted by EPA Region 9 in October 2008. The operational period is listed in Table 18.
Table 18: Operational Schedule for PM2.5
Site Name Duration Senior Center (6-day schedule) January 1– December 31
Twenty-four hour average concentrations of PM2.5 were low during 2016. There was no exceedance or violation of the 24-hour or annual standards during 2016. A summary of the 24-hour average concentrations is presented in Table 19 for those concentrations obtained on a 6-day schedule; the distributions of the concentrations for the corresponding schedules are presented in Table 20.
Table 19: Twenty-Four Hour Average PM2.5 Concentration Summary
6-Day Schedule
Site
Max. (ug/m3)
Date
2ndHigh (ug/m3)
Date
Number of
Exceedances
98th Percentile
Value
Annual Average (ug/m3)
Number of
Samples
SC – Pb
28.6 1/1
21.5 9/15
0 21.5 8.5
60
SC – Cb 28.1 1/1
18.1 12/8
0 18.1 7.6 51
Table 20: 24-Hour Average Concentration PM2.5 Distributions
6-Day Schedule
Number of 24-Hour Average Concentrations (ug/m3)
Interval: 0 to 15 16 to 30 31 to 50 51 to 70 71 to 90 91 to 110 >110
Site
SC – P 54 6 0 0 0 0 0
SC – C 48 3 0 0 0 0 0

15
PM2.5 Minimum Monitoring Requirements The PM2.5 design criteria where states and local agencies must operate the minimum number of required SLAMS sites as referred to 40 CFR Part 58, Appendix D, 4.7.1 for FRM/FEM/ARM monitors. SRPMIC is within the Core Base Statistical Area (CBSA) of the Phoenix metropolitan. Therefore, the CBSA is applied to SRPMIC monitoring network. The SRPMIC network meets the minimum monitoring requirements for all criteria pollutants measured. A summary of the PM2.5 minimum monitoring requirements is presented in Table 21.
Table 21: PM2.5 Minimum Monitoring Requirement
CBSA
Phoenix – Mesa – Scottsdale
County
Maricopa
Population & Census Year (July 2016)
4,242,9971
Annual Design Value - Years 2014 – 2016 (ug/m3)
6.2
Annual Design Value – Site Name (AQS ID)
Senior Center (040137020)
24-Hour Design Value (ug/m3)
13.5
24-Hour Design Value – Site Name (AQS ID)
Senior Center (040137020)
Required SLAMS Monitors
32
Active SLAMS Monitors
22
Needed SLAMS Monitors
0
1 – United States Census Bureau estimate July 1, 2016 2 – For entire network

16
DATA COMPLETENESS A summary of the annual data completeness for the criteria pollutants monitored during 2016 is presented in Tables 22-24. These tables represent the number of samples collected during each site’s operation versus the number of scheduled samples during each site’s operation.
Table 22: Ozone (O3)
Interval
Site
Number of Actual Samples
Number of Scheduled Samples
Data Completeness (Actual/Scheduled)
One-Hour
RM 8696 8784 99.0% SC 8737 8784 99.5% LE 8685 8784 98.9% HS 8618 8784 98.1%
Eight-Hour
RM 8717 8784 99.2% SC 8769 8784 99.8% LE 8727 8784 99.4% HS 8638 8784 98.3%
TOTAL 69587 70272 99.0%

17
Table 23: Particulate Matter (PM)
PM10 Interval
Site
Number of Actual Samples
Number of Scheduled Samples
Data Completeness (Actual/Scheduled)
1 in 6 days
LE-Pb 60 61 98.4% LE-Cb 61 61 100.0%
Continuous
HSa 364 366 99.5% SCa 365 366 99.7%
TOTAL PM10 850 854 99.5%
PM2.5 Interval
Site
1 in 6 days
SC – Pb 60 61 98.4% SC – Cb 51 61 83.6%
TOTAL PM2.5 111 122 91.0%
Table 24: Data Completeness Summary
Pollutant Number of Actual Samples
Number of Scheduled Samples
Data Completeness (Actual/Scheduled)
Ozone 69587 70272 99.0%
PM10 850 854 99.5%
PM2.5 111 122 91.0%
TOTAL 70548 71248 99.0%

18
EXCEEDANCE OF THE NATIONAL AMBIENT AIR QUALITY STANDARDS (NAAQS) Included in Table 25 is a summary of exceedances of the NAAQS during 2016.
Table 25: 2016 NAAQS Exceedances
Pollutant Interval Site Concentration Date
Ozone 1-Hour None - - 8-Hour RM 0.076 7/21
SC
LE
HS
0.076 0.074 0.074 0.071 0.071 0.071
0.075 0.073 0.071
0.076 0.075 0.073 0.072
0.074 0.072 0.071
7/28 5/13 6/28 5/27 5/28 7/26
7/28 7/21 6/28
7/28 7/21 6/28 5/13
7/28 6/28 8/15
PM10 24-Hour SC - - LE - - HS - - Annual None - -
PM2.5 24-Hour None - - Annual None - -

19
VIOLATIONS OF THE NATIONAL AMBIENT AIR QUALITY STANDARDS
Ozone (O3)
Table 26: Violations of the 8-hour Ozone Standard
Site
2014 4th High
(ppm)
2015 4th High
(ppm)
2016 4th High
(ppm)
3-Year Average of 4th High
(ppm)
RM 0.080 0.074 0.074 0.076
SC 0.073 0.073 0.070 0.072
LE 0.076 0.076 0.072 0.074
HS 0.071 0.072 0.070 0.071
Particulates - PM10
Table 27: Violations of the Twenty-Four Hour PM10 Standard
2014 2015 2016
Site
24-Hr Max
(ug/m3)
Expected
Exceedances
24-Hr Max
(ug/m3)
Expected
Exceedances
24-Hr Max
(ug/m3)
Expected
Exceedances
Rate of Expected
Exceedances
HSa 241c 3.0 137 0 115 0 1.0
SCa 106 0 69 0 93 0 0.0
LE-Pb 147 0 59 0 110 0 0.0
Table 28: Violations the Annual PM10 Standard
Site
2014 Annual Average (ug/m3)
2015 Annual Average (ug/m3)
2016 Annual Average (ug/m3)
Three-Year Average (ug/m3)
HSa 39.3 31.4 36.1 35.6
SCa 31.8 24.6 30.5 29.0
LE-Pb 29.9 22.8 26.7 26.5
aContinuous (TEOM) bFilter-based (6-day schedule) cAgricultural operations

20
Particulates – PM2.5
Table 29: Violations of the Twenty-Four Hour PM2.5 Standard
Site
2014 Annual 98th Percentile
(ug/m3)
2015 Annual 98th Percentile
(ug/m3)
2016 Annual 98th Percentile
(ug/m3)
Three-Year Average
98th Percentile (ug/m3)
SC-P 11.0 8.1 21.5 13.5
Table 30: Violations the Annual PM2.5 Standard
Site
2014 Annual Average (ug/m3)
2015 Annual Average (ug/m3)
2016 Annual Average (ug/m3)
Three-Year Average (ug/m3)
SC-P 5.4 4.8 8.5 6.2

21
NETWORK INFORMATION The following is a list of information on SRPMIC monitoring network activities that occurred during 2016.
Ozone Monitoring: During 2016, four ozone monitors were reported operational year-round. There were seventeen exceedance days of the eight-hour primary standard for ozone and four violations of the eight-hour primary standard NAAQS for the three-year average of the fourth highest concentration. Tables 25 and 26 present the data summaries for the eight-hour ozone report. On October 1, 2015, EPA updated the ozone NAAQS from .075 ppm to .070 ppm an effort to reduce the ozone pollution and to improve the public health protection. The effect date of the revised standard was December 28. 2015 (FR 10/26/15, Vol. 80, No. 206, pp 65292-65468). SRPMIC will continue the active efforts to implement the updated standards and reviewing the ozone designations process.
PM10 Monitoring: During 2016, three PM10 site monitors were reported operational. Two site monitors at the Senior Center and High School sites operated continuously, collecting hourly data while the PM10 samplers at Lehi site were FRM filter-based low volume and operated on a 1 in 6-day schedule. There were no exceedance-days of the 24-hour primary standard for PM10 of 150ug/m3 and no violation of the 24-hour standard of expected number of exceedances. Tables 15 and 27 provide data summaries of PM10 exceedances. The PM10 collocate sampler was relocated to Lehi air station on March 25, 2015 from Senior Center air station. The manual collocation sampling at Lehi is on a 1 in 6-day schedule for purposes of precision assessment for the network and both the primary and collocate samplers are FRM filter-based having the same EPA FRM method designation on standard condition collection. SRPMIC continues to submit the daily air quality PM10 data from High School monitor and meteorological parameter of wind speed and wind direction data to Rousseau Farm Company that started in June 2015. The High School PM10 exceedances in 2014 was caused by the agricultural field tilling that prompted an active meetings with the farming company to address the fugitive dust issues and their agricultural practices. This lead to educating the farmers about the air quality data then providing the daily air data to understand the measures and enabled them to manage their BMP better and have not observed any high concentrations of PM10 measurement. Rousseau Farms is one of the four farming operators in SRPMIC.

22
PM2.5 Monitoring: Two PM2.5 monitors were reported operational in AQS for 2016. Primary and collocate PM2.5 FRM filter-based low volume monitors both operated on 1 in 6-day schedules at the Senior Center site. There was no exceedance or violation of the 24-hour or annual NAAQS during 2016. The SRPMIC implemented the use of VSCC (very short-cut cyclone) method in both the PM2.5 samplers in the monitoring network on April 2016. These item replaces the second stage separators in PM2.5 samplers from WINS impactor as guided by the EPA Office of Air Quality Planning and Standards (OAQPS) decision that VSCC has less maintenance, better precision through PEP audits and the method is consistence with the PM2.5 continuous FEMs. The primary sampler continues to operate on 1 in 6-day sampling frequency that was approved by the EPA Region 9 on October 2008 to reduce the sampling schedule of the primary monitor from a 1 in 3-day schedule due to lack of filter support from the former laboratory facility. A renewal letter was sent to EPA Region 9 on May 25, 2017 to request waiver to continue the 1 and 6-day sampling schedule. SRPMIC is in attainment for PM2.5 NAAQS in annual average over 3-years of 12.0 ug/m3 and the 24-hours of 98th percentile over 3-year average of 35 ug/m3 and the monitors never had a 24-hour exceedance. However, during the winter months the concentration levels tends to elevate that arises from the wood burning smoke from residential fireplaces especially on the days of temperature inversions. To avoid going into nonattainment status, the AQP participates in the community wide No Burn Day Campaign during the winter holidays on outreach efforts not to burn wood on No Burn Days. The tools that is utilized for the campaign are the flyers, posters, ads in local newspaper, videos on the website and the Employee Alerts section in the Internet.
Network and Non-Regulatory Information: An independent auditor conducts a quarterly audit on SRPMIC air monitoring network. Criteria pollutants ozone, PM10 and PM2.5 are audited quarterly and all meteorological parameters are done twice annually. During each quarter, SRPMIC submitted the results of all valid measurement quality checks of precision and accuracy data to AQS. The SRPMIC monitoring network meets the minimum data assessment requirements for SLAMS sites of 40 CFR Part 58 Appendix A and 40 CFR Part 58.16 in reporting of all ambient air quality data and associated quality assurance data for criteria pollutant of ozone, PM10 and PM2.5 to the AQS database. The 2016 SRPMIC Data Certification document packet was sent to the EPA Region 9 on April 3, 2017 and EPA Region 9 confirmed that the data is certified and logged into their system and has fully met the required 40 CFR Part 58.15 on April 4, 2017. The following lists the EPA audits conducted in 2016:
• EPA Ozone National Performance Audit Program (NPAP) Through-the-Probe Audit
conducted at Lehi Air Monitoring Station on April 20, 2016; and

23
• EPA PM2.5 Performance Evaluation Program (PEP) Audits conducted: February 6, 2016, April
24 & 30, 2016, August 10 & 16, 2016 and November 3, 2016 at Senior Center Air Monitoring Station.
The SRPMIC 2015 Air Monitoring Network Report document was sent to EPA Region 9 on June 30, 2016. Prior to network report submission, SRPMIC held a Public Notice Meeting on June 21, 2016 for the public comment on 2015 Air Monitoring Network Report. 40 CFR Part 51.1203 addresses the air agency to submit a list that pertains to the source report of SO2 emissions that have annual actual emissions of 2,000 tons per year or more to the EPA. SRPMIC is in Maricopa County and the criteria pollutant SO2 is in attainment and the SRPMIC does not monitor the pollutant. Therefore, the subject report was not applicable to SRPMIC. AQP staff conducted an air quality PM10 audit on March 18, 2016 at two locations for the White Mountain Apache Tribe to assist their air program by helping them remain in compliance with EPA standards. The AQP continues to submit hourly data (FTP) of ozone and PM10 to AIRNow data center that was first established with ozone reports in 2007. SRPMIC relies on Sonoma Technology AIRNow reporting tools of navigational mapping of hourly data comparisons with local monitors and the site trajectory for source traces. The AQP continues to provide public outreach using a Flag Communication Network. The colored flags are flied on flag poles, representing colors are based on air quality index (AQI) that numerical scale value and coded colors with different levels of health concerns provides a communication about the pollution and its associated health risks for the public. They are setup at five different locations, including one at Salt River High School. AQP also distributes public outreach information of air quality advisories through the SRPMIC website and digital signage displays that reports high pollution and health watch advisories.
Proposed Changes Within Next 18 Months: The two proposed changes below are carried on from 2015 Air Monitoring Network Report: AQP installed a continuous PM10 Thermo 1405 monitor at Lehi air monitoring station in October 2015 to monitor side-by-side with the FRM samplers to compare the data results then introduced as a reporting monitor. The 1405 will replace the collocated site, primary and collocated filter-based FRM samplers that eventually will have all SRPMIC PM10 network a continuous monitors. The new PM2.5 Thermo 1405 FDMS continuous FEM monitor was installed and projected to be operational in 2018 as reporting monitor at Senior Center air monitoring station. The 1405 FDMS needs more time for data assessments with current FRM samplers and continuous monitor is not fully functional. The FEM will designated as primary monitor and shall be collocated with an FRM audit monitor that will be operate on a 1 and 12-day schedule. The site is the only location that monitors PM2.5 with a primary and collocated filter-based R&P FRM 2000 that collects in local conditions.

24
TRENDS The air quality in the Phoenix Metropolitan Area is generally improving despite the tremendous growth experienced in the region. Since monitoring began in the 1960s, ambient concentrations for most of the criteria pollutants have been reduced to below the NAAQS. Graphs of the trends seen in those criteria pollutants that are monitored on the SRPMIC are illustrated in Graphs 1 through 7. Ozone (O3) One-Hour Concentrations Maximum 1-hour concentrations of O3 at the SRPMIC monitoring locations have shown a large decline from 2005 to 2009 and a small overall increase occurring from 2009 to 2016. Between 2005 and 2016, maximum concentrations decreased approximately 20%. A graph of the maximum one-hour concentrations is provided in Graph 1.

25
Eight-Hour Concentrations
Eight-hour average concentrations of O3 at the SRPMIC monitoring locations reflect the trend seen in the 1-hour concentrations. The three-year moving averages of the fourth-highest 8-hour concentration at the four locations are illustrated in Graph 2.

26
Particulate Matter (PM10)
Twenty-Four Hour Concentrations Maximum twenty-four hour average concentrations of PM10 at the three monitoring locations have generally remained below the standard since 2006. A sharp decline occurred during 2008-2010, followed by a general increase through 2013 and a general decrease through 2016. High concentrations during 2013 and 2014 at the High School location were identified as exceptional events resulting from nearby agricultural operations. A graph of the trend is provided in Graph 3.

27
Annual Concentrations Annual average concentrations of PM10 at the SRPMIC locations have shown a general decline between 2005 and 2015; a slight increase occurred in 2016. There has been no exceedance of the previous annual standard since 2007; a graph is presented in Graph 4. A graph of the three-year moving averages of the annual PM10 concentrations is provided in Graph 5. Data recovery at the High School (HS) location was less than 75% during 2012, therefore, data for 2012 were not included in Graphs 4 and 5.

28

29
Particulate Matter (PM2.5)
98th Percentiles Concentrations of PM2.5 were well below the standard. A graph of the three-year moving averages of the 98th percentile of the 24-hour average concentrations is provided in Graph 6. Data collected during 2007 was included in the moving averages although data recovery for that year was less than 75%.

30
Annual Concentrations Annual average concentrations of PM2.5 at the SRPMIC locations have shown a general decline since 2005, although a slight increase occurred during 2014-2016. A graph of the three-year moving averages of the annual PM2.5 concentrations is provided in Graph 7. Data collected during 2007 was included in the moving averages although data recovery for that year was less than 75%.
31
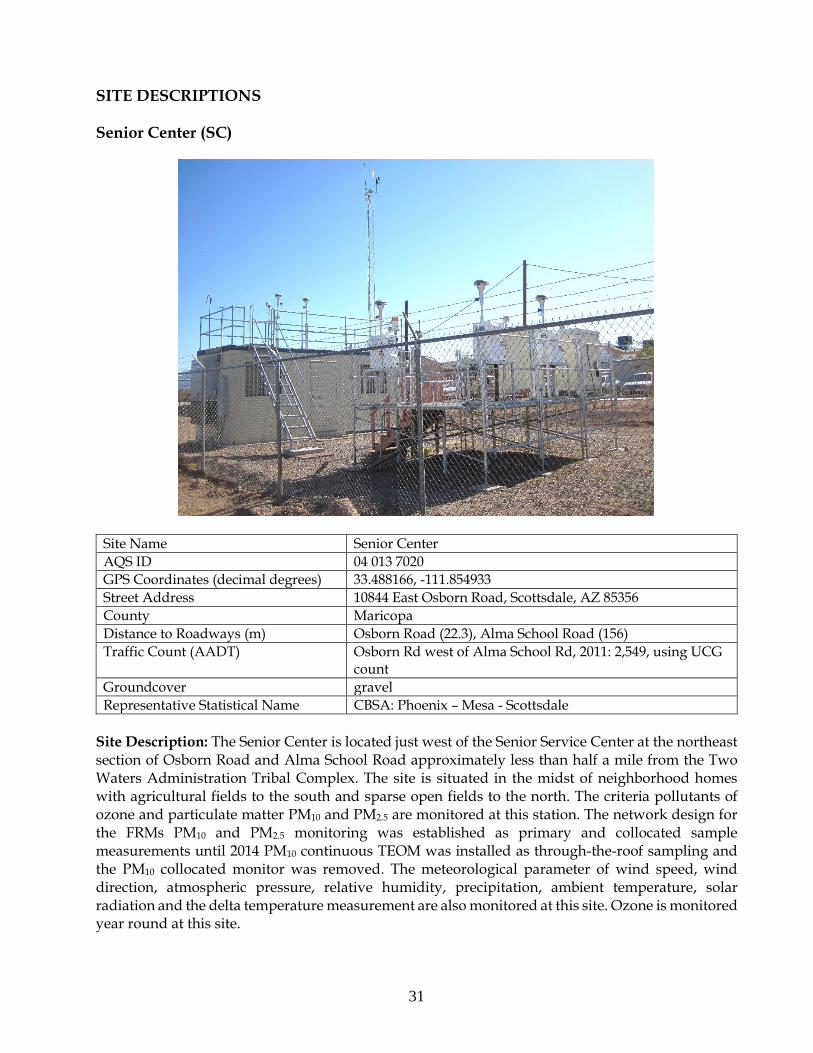
SITE DESCRIPTIONS
Senior Center (SC)
Site Name Senior Center
AQS ID 04 013 7020
GPS Coordinates (decimal degrees) 33.488166, -111.854933
Street Address 10844 East Osborn Road, Scottsdale, AZ 85356
County Maricopa
Distance to Roadways (m) Osborn Road (22.3), Alma School Road (156)
Traffic Count (AADT) Osborn Rd west of Alma School Rd, 2011: 2,549, using UCG count
Groundcover gravel
Representative Statistical Name CBSA: Phoenix – Mesa - Scottsdale
Site Description: The Senior Center is located just west of the Senior Service Center at the northeast section of Osborn Road and Alma School Road approximately less than half a mile from the Two Waters Administration Tribal Complex. The site is situated in the midst of neighborhood homes with agricultural fields to the south and sparse open fields to the north. The criteria pollutants of ozone and particulate matter PM10 and PM2.5 are monitored at this station. The network design for the FRMs PM10 and PM2.5 monitoring was established as primary and collocated sample measurements until 2014 PM10 continuous TEOM was installed as through-the-roof sampling and the PM10 collocated monitor was removed. The meteorological parameter of wind speed, wind direction, atmospheric pressure, relative humidity, precipitation, ambient temperature, solar radiation and the delta temperature measurement are also monitored at this site. Ozone is monitored year round at this site.

32
Table 31: Senior Center
Pollutant, POC Ozone, 1 PM10 (continuous), 3 PM2.5, 1 & 2
Primary/QA Collocated
NA NA QA Collocated
Parameter Code 44201 81102 88101
Basic monitoring objective(s)
NAAQS comparison, Public info
NAAQS comparison, Public info
NAAQS comparison, Public info
Site type(s) Population exposure, regional transport
Population exposure Population exposure
Monitor type SLAMS (Tribal) SLAMS (Tribal) SLAMS (Tribal)
Site type(s) Population exposure, regional transport
Population exposure Population exposure
Network Affiliation(s) NA NA NA
Manufacturer/Model Thermo/49i R&P/1400ab R&P/2000FRM
Method code 047 079 Changed from 117 to 143 in April 2016
FRM/FEM/ARM FEM FEM FRMs
Collecting Agency SRPMIC SRPMIC SRPMIC
Analytical lab NA NA IML/IML
Reporting Agency SRPMIC SRPMIC SRPMIC
Spatial Scale Neighborhood Neighborhood Neighborhood
Monitoring Start Date 02/10/2011 01/01/2014 05/01/2004
Current Sampling Frequency
Continuous Continuous 1 : 6
Required Sampling Frequency
NA Continuous 1:3 approved to 1:6 October 2008 by EPA
Sampling Season 01/01 – 12/31 01/01 – 12/31 01/01 – 12/31
Probe height (m) 4.2 4.3 3.1/3.1
Airflow arch (degrees) 360 360 360/360
Distance from supporting structure (m)
1.5 1.9 1.9
Distance from obstructions on roof; horizontal distance + vertical height above probe for obstructions nearby (m)
NA
NA
NA
Distance from obstructions not on roof; horizontal distance + vertical height above probe for obstructions nearby (m)
NA NA NA
Distance from tree drip-lines (m)
14.6 16.7 17.7/14.7

33
Distance to furnace or incinerator flue (m)
NA NA NA
Distance between monitors fulfilling a QA collocation requirements (m)
NA
NA
2.9
Unrestricted airflow (degrees around probe/inlet) (m)
360
360
360
Probe material for reactive gases
Borosilicate glass NA NA
Residence time for reactive gases
10 NA NA
Will there be changes within the next 18 months? (Y/N)
N
N
Y
Is it suitable for comparison against annual PM2.5? (Y/N)
NA
NA
NA
Frequency of flow rate verification for manual PM samplers
NA NA Biweekly
Frequency of flow rate verification for automated PM analyzers
NA
Biweekly
NA
Frequency of one-point QC check for gaseous instruments
Biweekly NA NA
Date of Annual Performance Evaluation for gaseous parameters
03/17/2016, 06/16/2016, 09/12/2016, 12/19/2016
NA NA
Date of semi-annual flow rate audits for PM monitors
NA
03/17/2016, 06/16/2016, 09/12/2016, 12/19/2016
03/17/2016, 06/16/2016, 09/12/2016, 12/19/2016
Meteorological measurements at the Senior Center site includes wind speed, wind direction, ambient temperature, relative humidity, barometric pressure, precipitation, differential temperature and solar radiation.

34
Red Mountain (RM)
Site Name Red Mountain
AQS ID 04 013 7021
GPS Coordinates (decimal degrees) 33.507916, -111.754616
Street Address 15115 Beeline Highway, Scottsdale, AZ 85256
County Maricopa
Distance to Roadways (m) Beeline Highway (608)
Traffic Count (AADT) Beeline Hwy (SR87) from Gilbert Rd to Shea Blvd, 2014: 23,540, ADOT AADT count
Groundcover Gravel
Representative Statistical Name CBSA: Phoenix – Mesa - Scottsdale
Site Description: The monitoring site is located south of the old Red Mountain Trap & Skeet building. A large portion of the area is open range populated with creosote scrubs and desert plants and it is approximately one-half mile southeast of State Route 87 (Beeline Highway. This station monitors ozone and the meteorological parameters of wind speed, wind direction, atmospheric pressure, ambient temperature and relative humidity. The data acquisition instrument of hourly data reports is in-house along with the ozone monitor calibration system. Ozone is monitored year round at this site.

35
Table 32: Red Mountain
Pollutant, POC Ozone, 1
Primary / QA Collocated NA
Parameter code 44201
Basic monitoring objective(s) NAAQS comparison, Public info
Site type(s) Highest conc., regional transport
Monitor type(s) SLAMS (Tribal)
Network affiliation(s) NA
Manufacturer/Model Thermo/49i
Method code 047
FRM/FEM/ARM FEM
Collecting Agency SRPMIC
Analytical lab NA
Reporting Agency SRPMIC
Spatial Scale Urban
Monitoring start date 01/27/2012
Current Sampling Frequency Continuous
Required sampling frequency NA
Sampling Season 01/01 – 12/31
Probe height (m) 4.1
Distance from supporting structure (m) 1.5
Distance from obstructions on roof; horizontal distance + vertical height above probe for obstructions nearby (m)
NA
Distance from obstructions not on roof; horizontal distance + vertical height above probe for obstructions nearby (m)
NA
Distance from tree drip-lines (m) NA
Distance to furnace or incinerator flue (m) NA
Distance between monitors fulfilling a QA collocation requirement (m)
NA
Unrestricted airflow (degrees around probe/inlet) (m)
360
Probe material for reactive gases Borosilicate glass
Residence time for reactive gases (s) 9
Will there be changes within the next 18 months? (Y/N)
N
Is it suitable for comparison against the annual PM2.5? (Y/N)
N
Frequency of flow rate verification for manual PM samplers
NA
Frequency of flow rate verification for automated PM analyzers
NA
Frequency of one-point QC check for gaseous instruments
Biweekly

36
Date of Annual Performance Evaluation for gaseous parameters
03/17/2016, 06/16/2016, 09/12/2016, 12/19/2016
Date of semi-annual flow rate audits for PM monitors
NA
Meteorological measurements at the Red Mountain site include wind speed, wind direction, ambient temperature, relative humidity and barometric pressure.

37
Lehi (LE)
Site Name Lehi
AQS ID 04 013 7022
GPS Coordinates (decimal degrees) 33.474533, -111.80505
Street Address 3250 North Stapley Drive, Mesa, AZ 85203
County Maricopa
Distance to Roadways (m) Stapley Drive 18.3), Oak Street (81)
Traffic Count (AADT) Stapley Drive south of Oak St, 2011: 492, UCG count
Groundcover Paved, gravel
Representative Statistical Name CBSA: Phoenix – Mesa - Scottsdale
Site Description: The Lehi monitoring site is inside the Police/Fire Substation building. The equipment for PM10 and meteorological monitoring is located on the roof. The site is bordered on the north and east by agricultural fields, on the west by neighborhood homes, a Booster Pump Facility to the north, and on the south the Community Recreation Center. The SRPMIC monitors ambient air quality ozone and PM10 with the collocation sampler started March 2015 from this site as well as the meteorological parameters of wind speed, wind direction, relative humidity, barometric pressure, and ambient temperature with the data acquisition system. Ozone is monitored year round at this site.

38
Table 33: Lehi
Pollutant, POC Ozone, 1 PM10, 1 PM10, 2
Primary/QA Collocate
NA QA Collocated QA Collocated
Parameter Code 44201 81102 81102
Basic monitoring objective(s)
NAAQS comparison, Public info
NAAQS comparison, Public info
NAAQS comparison, Public info
Site type(s) Population Exposure, regional transport
Population exposure Population exposure
Monitor type SLAMS (Tribal) SLAMS (Tribal) SLAMS (Tribal)
Network Affiliation(s) NA NA NA
Manufacturer/Model Teledyne/T400 R&P/2000FRM R&P/2000FRM
Method code 087 098 098
FRM/FEM/ARM FEM FRM FRM
Collecting Agency SRPMIC SRPMIC SRPMIC
Analytical lab NA IML IML
Reporting Agency SRPMIC SRPMIC SRPMIC
Spatial scale Neighborhood Neighborhood Neighborhood
Monitoring start date 05/21/2014 12/2004 03/25/2015
Current Sampling Frequency
Continuous 1:6 1:6
Required sampling frequency
NA 1:6 1:6
Sampling Season 01/01 – 12/31 01/01 – 12/31 01/01 – 12/31
Probe height (m) 6.7 6.4 6.4
Distance from supporting structure (m)
2.4
2.3
2.3
Distance from obstructions on roof; horizontal distance + vertical height above probe for obstructions nearby (m)
29.8
9.1
6.5
Distance from obstructions not on roof; horizontal distance + vertical height above probe for obstructions nearby (m)
NA
NA
NA
Distance from tree drip-lines (m)
11.1 11.5 14.1
Distance to furnace or incinerator flue (m)
1Furnace (16.7) 1Furnace (35.2) 1Furnace (35.2)
Distance between monitors fulfilling a
NA
2.6
2.6

39
QA collocation requirement (m)
Unrestricted airflow (degrees around probe/inlet)
360
360
360
Probe material for reactive gases
Borosilicate glass NA NA
Residence time for reactive gases (s)
8.9 NA NA
Will there be changes within the next 18 months? (Y/N)
N
Y
Y
Is it suitable for comparison against annual PM2.5? (Y/N)
N
N
N
Frequency of flow rate verification for manual PM samplers
NA
Biweekly
Biweekly
Frequency of flow rate for automated PM analyzers
NA
NA
NA
Frequency of one-point QC check for gaseous instruments
Biweekly
NA
NA
Date of Annual Performance Evaluation for gaseous parameters
03/17/2016, 06/17/2016, 09/12/2016, 12/19/2016
NA NA
Date of semi-annual flow rate audits for PM monitors
NA 03/17/2016, 03/17/2016, 09/12/2016, 12/19/2016
03/17/2016, 06/17/2016, 09/12/2016, 12/19/2016
1 – Furnace referred is outdoor patio grille
Meteorological measurements at the Lehi site include wind speed, wind direction, ambient temperature, relative humidity and barometric pressure.

40
High School (HS)
Site Name High School
AQS ID 04 013 7024
GPS Coordinates (decimal degrees) 33.50805, -111.8378
Street Address 4827 North Country Club Drive, Scottsdale, AZ 85256
County Maricopa
Distance to Roadways (m) North Country Club Drive (141), Chaparral Road (172)
Traffic Count (AADT) Chaparral Rd east of Country Club Drive, 2012: 823, UCG count
Groundcover Paved, gravel
Representative statistical name CBSA: Phoenix – Mesa - Scottsdale
Site Description: The High School site is located on the property of Salt River High School in the annex of the Maintenance Electrical Facility room. The site was established in April 2006. The area had rapid facility growth that includes a new high school in 2006, a new elementary school to the southeast, new residential homes, and a new school ballparks to the east. The Central Arizona Project Aqueduct Canal borders along the north section and the surrounding area to the north and south are agricultural fields. The PM10 continuous is monitored through-the-roof method. Ozone is monitored year round at this site.

41
Table 34: High School
Pollutant, POC Ozone, 1 PM10 , 2
Primary / QA Collocated NA NA
Parameter code 44201 81102
Basic monitoring objective(s) NAAQS comparison, Public info
NAAQS comparison, Public info
Site type(s) Population exposure, regional transport
Population exposure
Monitor type SLAMS (Tribal) SLAMS (Tribal)
Network affiliation(s) NA NA
Manufacturer/Model Thermo/49i Thermo/1405
Method code 047 079
Collecting Agency SRPMIC SRPMIC
Analytical lab NA NA
Reporting Agency SRPMIC SRPMIC
Spatial scale Neighborhood Neighborhood
Monitoring start date 04/21/2014 10/01/2012
Current Sampling Frequency Continuous Continuous
Required sampling frequency NA NA
Sampling Season 01/01 – 12/31 01/01 – 12/31
Probe height (m) 7.3 6.7
Distance from supporting structure (m)
1.9 1.9
Distance from obstructions on roof; horizontal distance + vertical height above probe for obstructions nearby (m)
16.9
13.5
Distance from obstructions not on roof; horizontal distance + vertical height above probe for obstructions nearby (m)
NA
NA
Distance from tree drip-lines (m)
12.2 16.1
Distance to furnace or incinerator flue (m)
Furnace (37.4) Furnace (35.9)
Distance between monitors fulfilling a QA collocation requirement (m)
NA
NA
Unrestricted airflow (degrees around probe/inlet)
360 360
Probe material for reactive gases
Borosilicate glass NA
Residence time for reactive gases (s)
10 NA
Will there be changes within the next 18 months? (Y/N)
N N

42
Is it suitable for comparison against annual PM2.5? (Y/N)
N N
Frequency of flow rate verification for manual PM samplers
NA
NA
Frequency of flow rate verification for automated PM analyzers
NA
Biweekly
Frequency of one-point QC check for gaseous instruments
Biweekly
NA
Date of Annual Performance Evaluation for gaseous parameters
03/17/2016, 06/16/2016, 09/12/2016, 12/19/2016
NA
Date of semi-annual flow rate audits for PM monitors
NA 03/17/2016, 06/16/2016, 09/12/2016, 12/19/2016
The meteorological measurements at High School site include wind speed, wind direction, ambient temperature, relative humidity and barometric pressure. The parameters are not in the data collection network.