2016 annual report - inscape – furniture and walls for...
TRANSCRIPT

2016 annual report

012016 annual report | inscape
contents03 05 06 19 21 22 26 49
Financial HighlightsLetter to Shareholders Management’s Discussion & Analysis Management ReportIndependent Auditor’s ReportConsolidated Statements of Financial Position Notes to the Consolidated Financial Statements Corporate Information

02 inscape | 2016 annual report
032016 annual report | inscape
financial highlightsYears ended April 30, (in thousands, except per share amounts)
2016 2015
Statement of Operations DataSales $ 79,846 $ 69,424
Gross profit $ 19,803 $ 14,808
Net loss $ (1,254) $ (13,076)
Basic and diluted loss per share $ (0.09) $ (0.91)
Cash Flow DataCash outflow from operations prior to non-cash working capital changes
$ (2,595) $ (3,338)
Balance Sheet DataTotal cash, cash equivalents and short-term investments
$ 10,495 $ 13,024
Total assets $ 46,784 $ 48,582
Shareholders’ equity $ 26,527 $ 29,826

04 inscape | 2016 annual report
052016 annual report | inscape
letter to shareholdersDear Fellow Shareholders,
During Fiscal 2016, we made significant strides in building a strong foundation for growth.
We are encouraged by the improvement in our sales performance that reflects our commitment to our four key strategic objectives:
1 Committed Distribution: creating, supporting and enhancing our distribution network.
2 Expanded Product Offering: enhancing and expanding Inscape’s products to provide a full range of solutions that focus on end user needs.
3 Global Fulfillment & Visualization: creating a global fulfillment platform that leverages technology to simplify the interface between clients and the Inscape supply chain.
4 Reinvent Industrial System: reinventing our industrial engine and supply chain.
Successes in building our dealer network included increased participation in the most robust training program in our company’s history and the solidification of our West Elm Workspace with Inscape reseller network with 7 new showrooms open. In addition, we have 19 dealers in our new Platinum Dealer Program who are committed to leading with Inscape’s products in their market areas.
We continue to enhance and expand our product offering to respond to the evolving workplace. New products launched at this year’s NeoCon World’s Trade Fair included Longo, a Best of NeoCon Gold award winner and Badminton guest seating under our Inscape brand. We also introduced two screen systems, a height-adjustable bench, plus a lounge seating collection under our West Elm Workspace with Inscape brand as we build on the momentum this line has generated since its launch in 2015.
We have also seen increased utilization of our F.I.R.E. software, a key differentiator linking visualization, specification, order acknowledgement and shipment of our products to market. We are committed to delivering not only superior service, but also innovative products that meet the needs of today’s workspaces.
We are pleased with the improved momentum resulting from the execution of our strategy. Increases in year-over-year quoting activity in Inscape’s systems, storage and architectural product groups indicate continued progress in reinvigorating our organic business. While the company is experiencing some market challenges and pricing pressures resulting from competitive projects, our supply chain team works actively with our vendors to keep our materials costs low and achieve shorter lead times.
We remain committed to all of these strategic initiatives to drive revenue growth and margin improvement over the longer term.
We would like to thank our Management, Employees and Partners for their ongoing efforts and dedication as we continue to build a strong foundation for growth. We are grateful to our Board of Directors for their ongoing guidance and support.
Madan Bhayana Chairman of the Board
Jim Stelter Director and Chief Executive Officer
06 inscape | 2016 annual report
management’s discussion & analysisThe following Management’s Discussion and Analysis (“MD&A”) of operating results and financial condition of Inscape Corporation and its subsidiaries (“the Company”) for the year ended April 30, 2016 should be read in conjunction with the accompanying Consolidated Financial Statements and Notes for the years ended April 30, 2016 and 2015.
The discussion and analysis are as of June 23, 2016 unless otherwise stated.
Additional information relating to the Company, including the Annual Information Form, is available on SEDAR at www.sedar.com or on our website www.inscapesolutions.com.
Non GAAP Measures
In this MD&A, reference is made to EBITDA, which is not a measure of financial performance under International Financial Reporting Standards (“IFRS”). Inscape calculates EBITDA as earnings before interest, taxes, depreciation and amortization with the exclusion of share-based compensation, impairment loss, unrealized derivative and foreign exchange gain/loss. Management believes EBITDA is a useful measure that facilitates period-to-period operating comparisons and we believe some investors and analysts use it as well. This measure, as calculated by Inscape, does not have any standardized meaning prescribed by IFRS and is not necessarily comparable to similar measure presented by other issuers.
Reference is also made to adjusted income or loss with the exclusion of hedge contract fair value adjustments, unrealized exchange gain/loss, non-operational expenses and expenses higher than historical levels. Management believes adjusted income/loss is a useful measure that facilitates period-to-period operating comparisons. The adjusted income or loss is a non-GAAP measure, which does not have any standardized meaning prescribed by GAAP and is therefore unlikely to be comparable to similar measures presented by other issuers.
Forward-looking Statements
This report includes certain forward-looking statements that are based on the Company’s best information and judgments as at the date of this report. Readers are cautioned not to place undue reliance on forward-looking
072016 annual report | inscape
statements found mainly in the Outlook section but also elsewhere throughout this document. These forward-looking statements are based on our plans, intentions or expectations which are based on, among other things, assumptions about the rate of economic growth in North America, continuing recovery of the contract furniture business and currency fluctuations.
These forward-looking statements include known and unknown risks, uncertainties, assumptions and other factors which may cause actual results or achievements to be materially different from those expressed or implied. The forward-looking statements are subject to risks and uncertainties that may cause the actual results to differ materially from those anticipated in the discussion (see “Risks and Uncertainties” for more information).
While management believes that the expectations expressed by such forward-looking statements are reasonable, we cannot assure that they will be correct. In evaluating forward-looking information and statements, readers should carefully consider the various factors which could cause actual results or events to differ materially from those indicated in the forward-looking information and statements. Readers are cautioned that the foregoing list of important factors is not exhaustive. Furthermore, the Company will update its disclosure upon publication of each fiscal quarter’s financial results and otherwise disclaims any obligations to update publicly or otherwise revise any such factors or any of the forward-looking information or statements contained herein to reflect subsequent information, events or developments, changes in risk factors or otherwise.
Company Profile and Core Business
Inscape Corporation is a limited company incorporated in Ontario, Canada, with Class B common shares listed on the Toronto Stock Exchange (TMX). The Company’s registered office and headquarters is at 67 Toll Road, Holland Landing, Ontario, Canada.
For over 125 years, Inscape has applied innovative design and engineering principles to the development of their products and delivered customized workplace solutions for clients. Inscape’s pursuit of design excellence includes a commitment to design for sustainability. The Company’s portfolio of products provides flexibility to create applications at a lower cost of ownership.
The Company reports in two business segments: the Office Furniture segment includes storage, benching, systems and seating solutions, plus West Elm Workspace products. The Inscape Walls segment has a manufacturing facility located in upstate New York. The combined manufacturing footprint of these two facilities is approximately 438,000 square feet. Inscape serves its clients through a network of dealers and representatives supported by showrooms across North America.
08 inscape | 2016 annual report
Vision and Strategy
Management continued to focus and build on its four key strategic objectives. These are the foundation of the Company’s strategic growth and development and they include: (1) Enhance and expand the Company’s products to provide a full range of products for end users; (2) Generate a dedicated distribution network; (3) Create a customer interface platform that leverages leading edge technology and will simplify fulfillment process and allow us to meet customer needs more quickly; (4) Re-invent the industrial system.
The Company continually looks to add new products to its product portfolio. These products are complementary to its existing platform of office systems, benching, storage, filing and walls.
The Company has four guiding principles to product design: • Delight Users• Empower Technology• Foster Agility• Design for Sustainability
Delight Users means including thoughtful details that keep people happy and productive in their work environment. Empower Technology refers to the ability of Inscape’s products to provide users with convenient, flexible access to power and data. Foster Agility in the workspace means letting users customize and change their space as their needs change over time. Design for Sustainability highlights that good choices matter from product concept through design, manufacturing and application and beyond, extending product life through component reuse.
The Company has developed partnerships with global contract furniture manufactures to increase the Company’s product offerings in laminate storage products, task and lounge seating, and storefront wall systems.
In November 2014, the Company announced a partnership with West Elm (a division of retailer Williams Sonoma Inc.) to create a new product line that will complement Inscape’s existing products and meet a market demand for high design products at significantly better value than is currently seen in the market. The official launch of the new West Elm Workspace product line was unveiled at NeoCon 2015 where over 75 new products were launched and the Company was awarded two Best of NeoCon Awards.
The second quarter of the Fiscal 2016 marked the initial shipment of the West Elm Workspace with Inscape products. Project wins with both large growth media/tech firms as well as smaller innovative companies confirm the market desires the products launched in partnership with West Elm. The West Elm Workspace with Inscape reseller network has also been further solidified, with showrooms opened in New York, Tampa, Seattle and LA in March of 2016.
In December 2014 the Company announced the development of F.I.R.E. (Fully Integrated Resource for Enterprise management) which integrates industry leading technology to create a single customer-centric solution unlike any other currently available. F.I.R.E. unites the leading industry partners to create one integrated solution that re-imagines the client experience from idea to order, and shipment to satisfaction. Over a two year period, the Company invested close to $2.0 million to create this new platform. In F2016, project spending for F.I.R.E. was $1.5 million (2015 –$0.4 million).
F.I.R.E is being used by 15 dealers and is functional for Inscape’s Office Furniture segment including West Elm Workspace with Inscape. F.I.R.E development remained on schedule with new products added and training at headquarters and in the field at dealer locations. This technology supports the Company’s dealers, appeals to the design community and integrates into the Company’s fulfillment system.
As part of the Company’s efforts to reinvent the industrial system, the manufacturing and the supply chain groups continue to look for new innovative ways to maintain product quality, reduce costs and identify new suppliers and partners who can meet its needs. Internally the Company uses techniques such as Continuous Improvements, Kaizens, and Lean Manufacturing techniques to reduce factory overheads and improve efficiencies. The Company’s supply chain group identifies local and international sources to meet the exacting end user requirements.
These key strategic initiatives are creating a strong foundation for growth of the Company. In the upcoming year, management expects to have over 15 West Elm Workspace dealers and approximately 20 committed Platinum dealers, as well as, add new products and accessories that will enhance and support our existing product lines.
092016 annual report | inscape
Overview
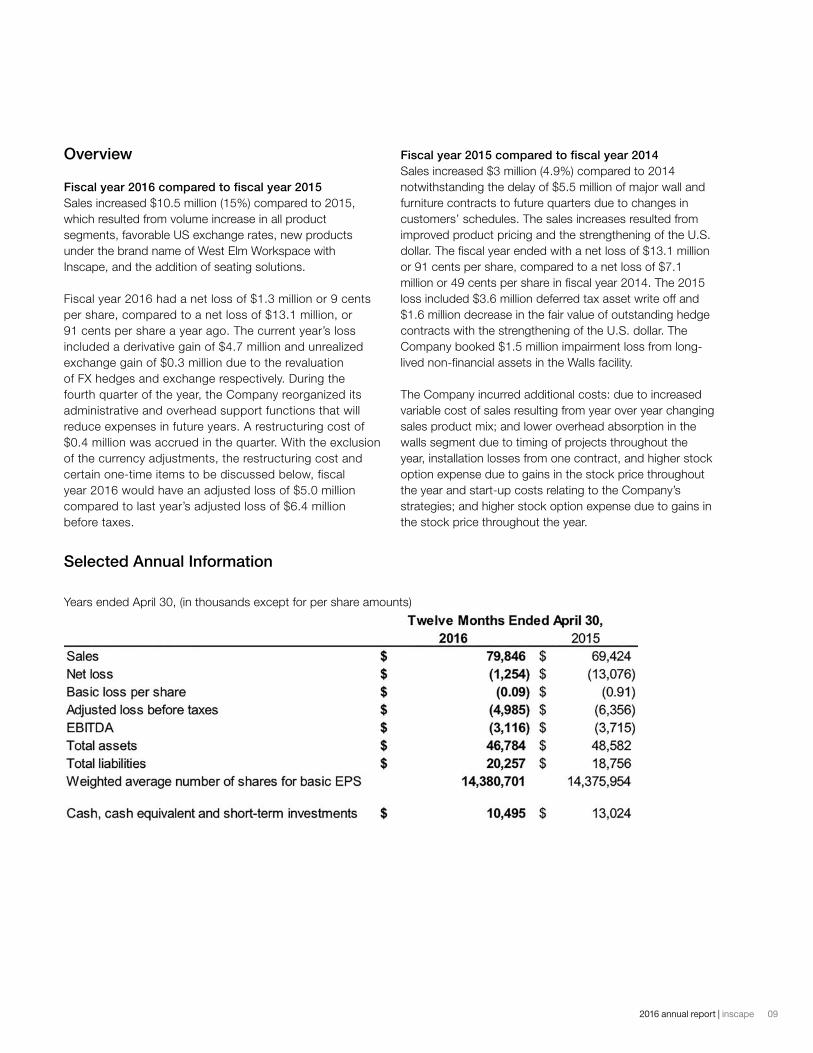
Fiscal year 2016 compared to fiscal year 2015Sales increased $10.5 million (15%) compared to 2015, which resulted from volume increase in all product segments, favorable US exchange rates, new products under the brand name of West Elm Workspace with Inscape, and the addition of seating solutions.
Fiscal year 2016 had a net loss of $1.3 million or 9 cents per share, compared to a net loss of $13.1 million, or 91 cents per share a year ago. The current year’s loss included a derivative gain of $4.7 million and unrealized exchange gain of $0.3 million due to the revaluation of FX hedges and exchange respectively. During the fourth quarter of the year, the Company reorganized its administrative and overhead support functions that will reduce expenses in future years. A restructuring cost of $0.4 million was accrued in the quarter. With the exclusion of the currency adjustments, the restructuring cost and certain one-time items to be discussed below, fiscal year 2016 would have an adjusted loss of $5.0 million compared to last year’s adjusted loss of $6.4 million before taxes.
Fiscal year 2015 compared to fiscal year 2014Sales increased $3 million (4.9%) compared to 2014 notwithstanding the delay of $5.5 million of major wall and furniture contracts to future quarters due to changes in customers’ schedules. The sales increases resulted from improved product pricing and the strengthening of the U.S. dollar. The fiscal year ended with a net loss of $13.1 million or 91 cents per share, compared to a net loss of $7.1 million or 49 cents per share in fiscal year 2014. The 2015 loss included $3.6 million deferred tax asset write off and $1.6 million decrease in the fair value of outstanding hedge contracts with the strengthening of the U.S. dollar. The Company booked $1.5 million impairment loss from long-lived non-financial assets in the Walls facility.
The Company incurred additional costs: due to increased variable cost of sales resulting from year over year changing sales product mix; and lower overhead absorption in the walls segment due to timing of projects throughout the year, installation losses from one contract, and higher stock option expense due to gains in the stock price throughout the year and start-up costs relating to the Company’s strategies; and higher stock option expense due to gains in the stock price throughout the year.
Selected Annual Information
Years ended April 30, (in thousands except for per share amounts)
10 inscape | 2016 annual report
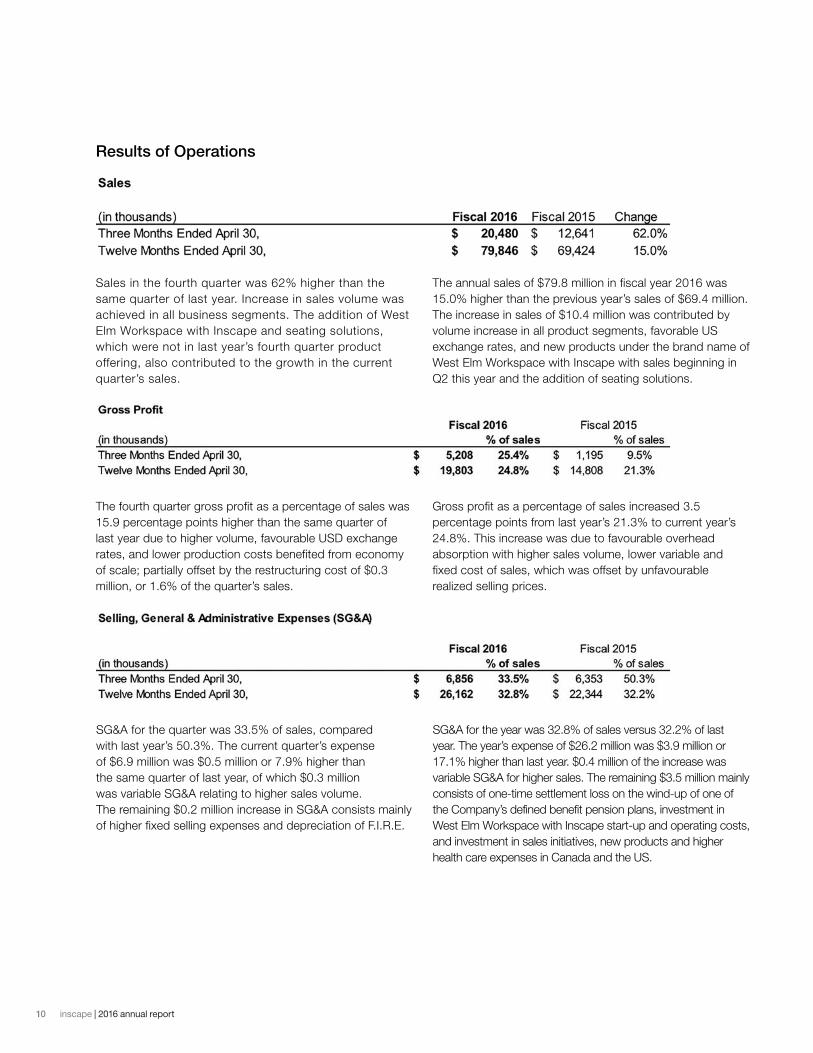
Results of Operations
Sales in the fourth quarter was 62% higher than the same quarter of last year. Increase in sales volume was achieved in all business segments. The addition of West Elm Workspace with Inscape and seating solutions, which were not in last year’s fourth quarter product offering, also contributed to the growth in the current quarter’s sales.
The annual sales of $79.8 million in fiscal year 2016 was 15.0% higher than the previous year’s sales of $69.4 million. The increase in sales of $10.4 million was contributed by volume increase in all product segments, favorable US exchange rates, and new products under the brand name of West Elm Workspace with Inscape with sales beginning in Q2 this year and the addition of seating solutions.
The fourth quarter gross profit as a percentage of sales was 15.9 percentage points higher than the same quarter of last year due to higher volume, favourable USD exchange rates, and lower production costs benefited from economy of scale; partially offset by the restructuring cost of $0.3 million, or 1.6% of the quarter’s sales.
Gross profit as a percentage of sales increased 3.5 percentage points from last year’s 21.3% to current year’s 24.8%. This increase was due to favourable overhead absorption with higher sales volume, lower variable and fixed cost of sales, which was offset by unfavourable realized selling prices.
SG&A for the quarter was 33.5% of sales, compared with last year’s 50.3%. The current quarter’s expense of $6.9 million was $0.5 million or 7.9% higher than the same quarter of last year, of which $0.3 million was variable SG&A relating to higher sales volume. The remaining $0.2 million increase in SG&A consists mainly of higher fixed selling expenses and depreciation of F.I.R.E.
SG&A for the year was 32.8% of sales versus 32.2% of last year. The year’s expense of $26.2 million was $3.9 million or 17.1% higher than last year. $0.4 million of the increase was variable SG&A for higher sales. The remaining $3.5 million mainly consists of one-time settlement loss on the wind-up of one of the Company’s defined benefit pension plans, investment in West Elm Workspace with Inscape start-up and operating costs, and investment in sales initiatives, new products and higher health care expenses in Canada and the US.
112016 annual report | inscape
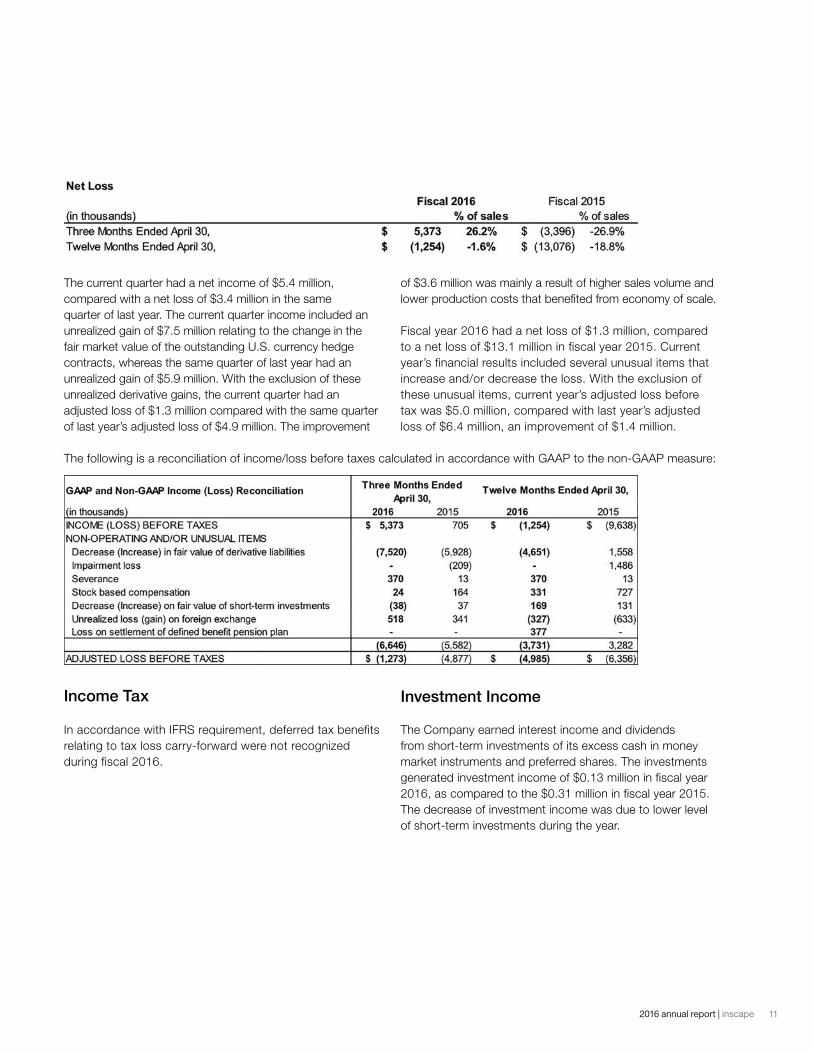
The current quarter had a net income of $5.4 million, compared with a net loss of $3.4 million in the same quarter of last year. The current quarter income included an unrealized gain of $7.5 million relating to the change in the fair market value of the outstanding U.S. currency hedge contracts, whereas the same quarter of last year had an unrealized gain of $5.9 million. With the exclusion of these unrealized derivative gains, the current quarter had an adjusted loss of $1.3 million compared with the same quarter of last year’s adjusted loss of $4.9 million. The improvement
of $3.6 million was mainly a result of higher sales volume and lower production costs that benefited from economy of scale.
Fiscal year 2016 had a net loss of $1.3 million, compared to a net loss of $13.1 million in fiscal year 2015. Current year’s financial results included several unusual items that increase and/or decrease the loss. With the exclusion of these unusual items, current year’s adjusted loss before tax was $5.0 million, compared with last year’s adjusted loss of $6.4 million, an improvement of $1.4 million.
The following is a reconciliation of income/loss before taxes calculated in accordance with GAAP to the non-GAAP measure:
Income Tax
In accordance with IFRS requirement, deferred tax benefits relating to tax loss carry-forward were not recognized during fiscal 2016.
Investment Income
The Company earned interest income and dividends from short-term investments of its excess cash in money market instruments and preferred shares. The investments generated investment income of $0.13 million in fiscal year 2016, as compared to the $0.31 million in fiscal year 2015. The decrease of investment income was due to lower level of short-term investments during the year.
12 inscape | 2016 annual report
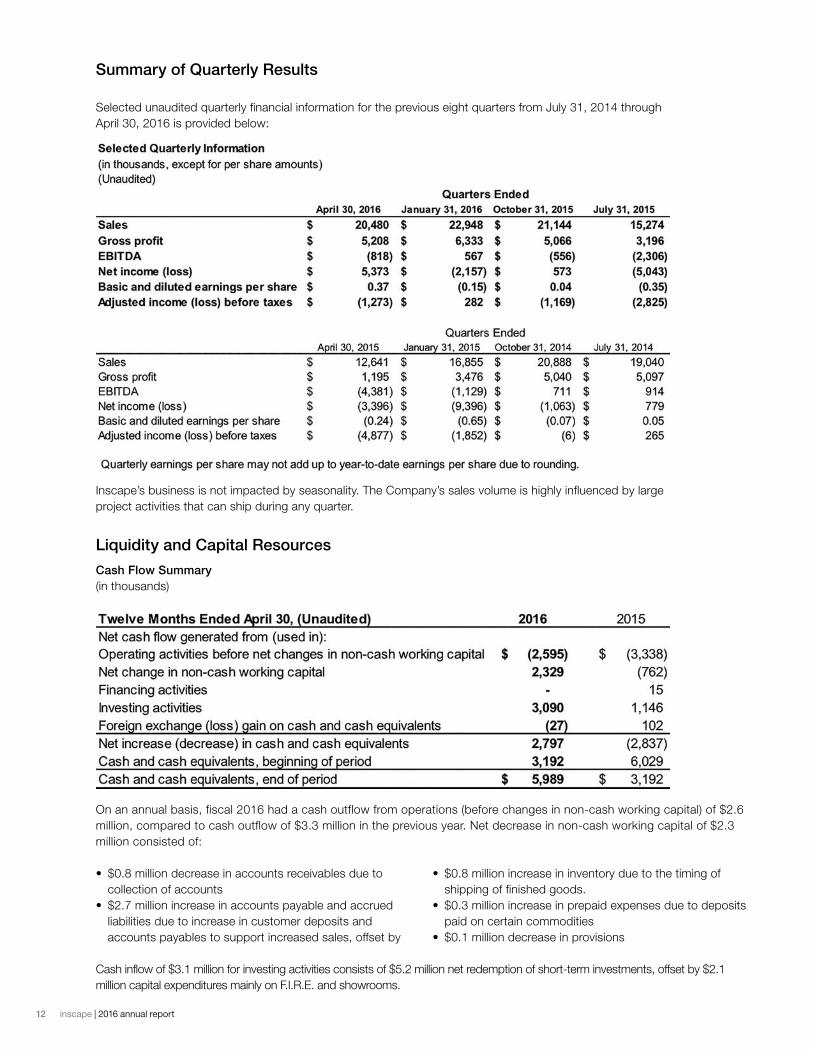
Summary of Quarterly Results
Selected unaudited quarterly financial information for the previous eight quarters from July 31, 2014 through April 30, 2016 is provided below:
Inscape’s business is not impacted by seasonality. The Company’s sales volume is highly influenced by large project activities that can ship during any quarter.
Liquidity and Capital Resources
Cash Flow Summary(in thousands)
On an annual basis, fiscal 2016 had a cash outflow from operations (before changes in non-cash working capital) of $2.6 million, compared to cash outflow of $3.3 million in the previous year. Net decrease in non-cash working capital of $2.3 million consisted of:
• $0.8 million decrease in accounts receivables due to collection of accounts
• $2.7 million increase in accounts payable and accrued liabilities due to increase in customer deposits and accounts payables to support increased sales, offset by
• $0.8 million increase in inventory due to the timing of shipping of finished goods.
• $0.3 million increase in prepaid expenses due to deposits paid on certain commodities
• $0.1 million decrease in provisions
Cash inflow of $3.1 million for investing activities consists of $5.2 million net redemption of short-term investments, offset by $2.1 million capital expenditures mainly on F.I.R.E. and showrooms.
132016 annual report | inscape
Credit Facility
The Company has a demand operating credit of $10 million and a demand credit for foreign exchange contracts of US $10 million with its bank. The interest rate on the demand operating credit facility is Prime Rate plus 0.25% for Canadian dollar loans, US Base Rate plus 0.25% for US dollar loans and 1.5% for Canadian dollar Banker’s Acceptance. The agreement is secured by the Company’s personal property.
The credit facility agreement has the following covenants:
1. The ratio of “total liabilities less postponed debt to shareholders’ equity less intangible assets” does not exceed 1.4 to 1.0, measured quarterly.
2. Current ratio, excluding any derivative assets and liabilities, not to be less than 1.5 to 1.0, measured quarterly.
The Company was in compliance with the covenants as at April 30, 2016.
The Company has not drawn on the demand operating and foreign exchange contracts credit.
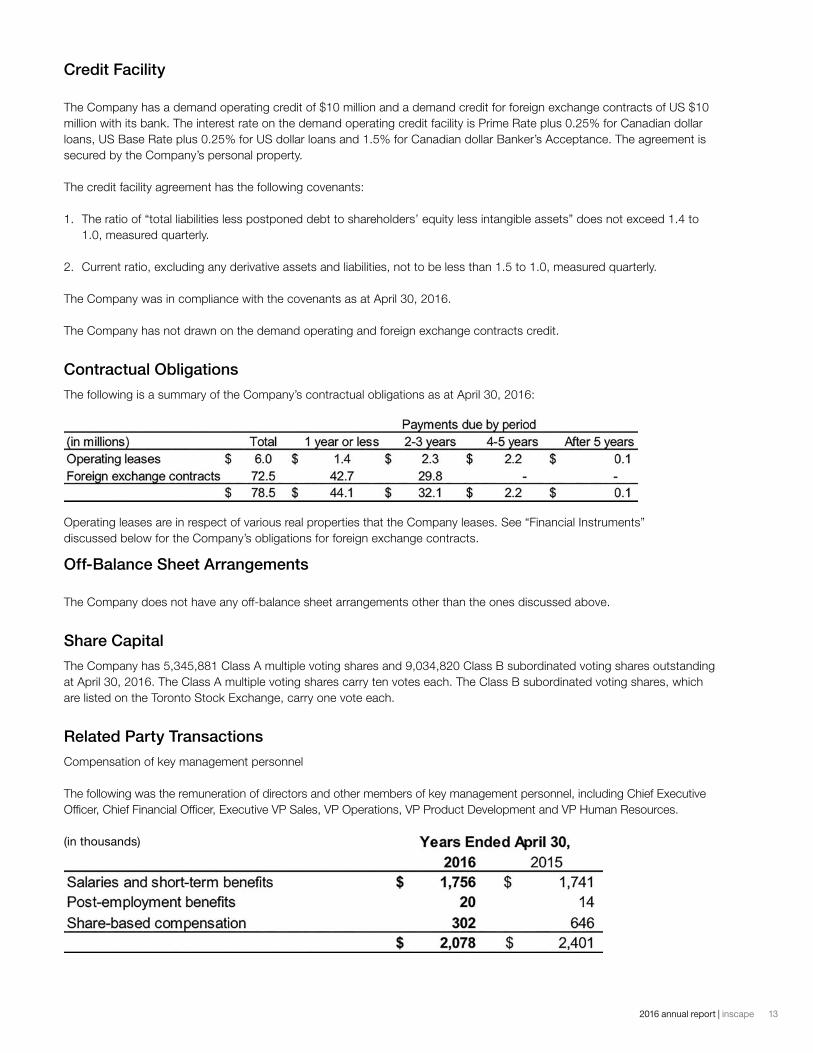
Contractual Obligations
The following is a summary of the Company’s contractual obligations as at April 30, 2016:
Operating leases are in respect of various real properties that the Company leases. See “Financial Instruments” discussed below for the Company’s obligations for foreign exchange contracts.
Off-Balance Sheet Arrangements
The Company does not have any off-balance sheet arrangements other than the ones discussed above.
Share Capital
The Company has 5,345,881 Class A multiple voting shares and 9,034,820 Class B subordinated voting shares outstanding at April 30, 2016. The Class A multiple voting shares carry ten votes each. The Class B subordinated voting shares, which are listed on the Toronto Stock Exchange, carry one vote each.
Related Party Transactions
Compensation of key management personnel
The following was the remuneration of directors and other members of key management personnel, including Chief Executive Officer, Chief Financial Officer, Executive VP Sales, VP Operations, VP Product Development and VP Human Resources.
(in thousands)
14 inscape | 2016 annual report
During the year, the Company incurred expenses of $310 thousand (2015 - $165) to a related party for goods and services associated with the Company’s strategic initiatives. The entity is deemed a related party because the Chief Executive Officer is a shareholder of that entity. The relationship provides the Company immediate resources to implement new initiatives.
During the year, the Company incurred expenses of $30 thousand (2015 – nil) to a related party for consulting services associated with the Company’s strategic plan. The entity is deemed a related party because a Board Director is a shareholder of that entity.
Future Accounting Changes
IFRS 9 Financial Instruments:In July 2014, the IASB issued IFRS 9 (2014) – Financial Instruments (“IFRS 9”). IFRS 9 replaces IAS 39 – Financial Instruments: Recognition and Measurement (“IAS 39”), in its entirety. IFRS 9 uses a single approach to determine whether a financial asset or liability is measured at amortized cost or fair value, replacing the multiple rules in IAS 39. For financial assets, the approach in IFRS is based on how an entity manages its financial instruments in the context of its business model and the contractual cash flow characteristics of the financial assets and limited changes to the classification and measurement requirements for financial assets. For financial liabilities measured at fair value, fair value changes due to changes in the Company’s credit risk are presented in other comprehensive income (“OCI”), instead of net income (loss), unless this would create an accounting mismatch. The new standard also requires a single impairment method to be used, replacing the multiple impairment methods in IAS 39 and introduces a new expected loss impairment model. IFRS 9 also provides relief from the requirement to restate comparative financial statements for the effect of applying IFRS 9. This amendment completes the IASB’s financial instruments project and the standard is effective for reporting periods beginning on or after January 1, 2018 with early adoption permitted. The Company is currently evaluating the impact of the adoption of this standard on its consolidated financial statements.
IFRS 15 Revenue from Contracts with Customers:In May 2014, the IASB released IFRS 15 Revenue from Contracts with Customers, which establishes principles for reporting the nature, amount, timing and uncertainty of revenue and cash flows arising from an entity’s contracts with customers. It provides a single model in order to depict the transfer of promised goods or services to customers. The core principle of IFRS 15 is that an entity recognizes revenue to depict the transfer of promised goods or services to customers in an amount that reflects the consideration to which an entity expects to be entitled in exchange for those goods and services. IFRS 15 also requires more comprehensive disclosures about the nature, amount, timing and uncertainty of revenue and cash flows arising from an entity’s contracts with customers.
IFRS 15 supersedes IAS 11 Construction Contracts, IAS 18 Revenue and a number of revenue-related interpretations (IFRIC 13 Customer Loyalty Programmes, IFRIC 15 Agreements for the Construction of Real Estate, IFRIC 18 Transfers of Assets from Customers and SIC-31 Revenue - Barter Transactions Involving Advertising Service). IFRS 15 is effective for annual periods beginning on or after January 1, 2018, with earlier adoption permitted. The Company is currently evaluating the impact of the adoption of this standard on its consolidated financial statements.
IFRS 16 Leases:In January 2016, the IASB issued IFRS 16 Leases, which specifies how an IFRS reporter will recognize, measure, present and disclose leases. The standard provides a single lessee accounting model, requiring lessees to recognize assets and liabilities for all leases unless the lease term is 12 months or less or the underlying asset has a low value. Lessors continue to classify leases as operating or finance, with IFRS 16’s approach to lessor accounting substantially unchanged from its predecessor, IAS 17. IFRS 16 is effective for annual reporting periods beginning on or after January 1, 2019, with earlier adoption permitted. The Company is currently evaluating the impact of the adoption of this standard on its consolidated financial statements.
152016 annual report | inscape
Significant Accounting Policies and Estimates
In the application of the Company’s accounting policies, management is required to make judgments, estimates and assumptions about the carrying amounts of assets and liabilities that are not readily apparent from other sources. The estimates and associated assumptions are based on historical experience and other factors that are considered to be relevant. Actual results may differ from these estimates.
Critical judgmentsThe following are the critical estimates and judgments that the management has made in the process of applying the Company’s accounting policies and that have the most significant effect on the amounts recognized in the financial statements.
Allowance for doubtful accounts is based on management’s judgment and review of any known exposures, customer creditworthiness, and collection experience.
Reserve for inventory is based on the aging of inventory and management’s judgment of product life cycles in identifying obsolete items.
Identification of cash generating units for the purposes of performing impairment test of asset is based on management’s judgment of what constitutes the smallest group of assets that can generate cash flows largely independent of other assets.
Determination of valuation allowance on deferred tax assets is based on management’s judgment of the ability of the Company to achieve sufficient taxable income to use the deferred tax assets.
Critical estimatesEstimated useful lives and residual values of intangible asset, property, plant and equipment are based on management’s experience, the intended usage of the
assets and the expected technological advancement that may affect the life cycle and residual values of the assets.
Defined benefit pension obligations are based on the Management’s best estimates on the long-term investment return on pension fund assets, the discount rate of obligations, mortality and the future rate of salary increase.
Liability for the Company’s performance and restricted share units is based on the management’s best estimates on the Company’s financial performance during the vesting period of the performance and restricted share units.
Cash flow projections of the Company’s cash generating units for the purposes of impairment tests of assets are based on the Company’s best estimate of the range of business and economic conditions.
The Company computes an income tax provision in each of the jurisdiction in which it operates. Actual amounts of income tax expense are finalized upon filing and acceptance of the tax return by the relevant authorities, which occur subsequent to the issuance of the financial statements. The estimation of income taxes includes evaluating the recoverability of deferred tax assets based on an assessment of the ability to use the underlying future tax deductions before they expire against future taxable income. The assessment is based upon existing tax laws and estimates of future taxable income. To the extent estimates differ from the final tax returns; net earnings would be affected in a subsequent period.
The Company is subject to taxation in numerous jurisdictions. There are many transactions and calculations for which the ultimate tax determination is uncertain during the ordinary course of business. The Company maintains provisions for uncertain tax positions that it believes appropriately reflect its risk with respect to tax matters under active discussion, audit, dispute or appeal with tax authorities, or which are otherwise considered to involve uncertainty. These provisions are made using the best
16 inscape | 2016 annual report
estimate of the amount expected to be paid based on a qualitative assessment of all relevant factors. The Company reviews the adequacy of these provisions at the end of the reporting period. It is possible that at some future date an additional liability could result from audits by taxing authorities. Where the final outcome of these tax-related matters is different from the amounts that were initially recorded, such differences will affect the tax provision in the period in which such determination is made.
Financial Instruments
The Company’s cash and cash equivalents, short-term investments, trade accounts receivable and derivative assets are subject to the risk that the counter-parties may fail to discharge their obligation to pay the Company. The Company’s investment policy specifies the types of permissible investments, the minimum credit ratings required and the maximum balances allowed. The purchase of any securities carrying a credit rating below BBB for bonds or R1-Low for commercial paper is strictly prohibited. Management reports to the Board of Directors quarterly the Company’s investment portfolios to show their compliance with the investment policy. The counterparty of the Company’s derivatives is a major Canadian bank. The Company has credit policies and procedures to manage trade accounts receivable credit risk by assessing new customers’ credit history, reviewing of credit limits, monitoring the aging of accounts receivable and establishing an allowance for doubtful accounts based on specific customer information and general historical trends. The Company has historically experienced minimal customer defaults on trade accounts receivable.
The Company’s U.S. dollar denominated cash, trade accounts receivable, accounts payable and accrued liabilities are subject to the risk that their fair values will fluctuate because of changes in U.S. dollar exchange rate relative to the Canadian dollar. The Company uses U.S. currency hedge instruments to manage its U.S. dollars exchange risk. The counterparty of the financial instruments is a major Canadian bank. The Company has a policy in place to ensure that all such instruments are used only to manage risk and not for trading purposes. The outstanding
hedge instruments are marked to market at the balance sheet date. Unrealized gains and losses on the contracts are recorded as derivative assets and liabilities on the balance sheet and the change in fair value of the instruments is recognized in earnings in the period of change.
As at April 30, 2016, the Company had outstanding U.S. dollar hedge contracts with settlement dates from May 2016 to March 2018. The total nominal amounts under the contracts are U.S. $46.2 million to $57.8 million (2015 - $39.8 to $49.5). Dependent on the spot CAD/USD rate on each settlement date, the Company can sell U.S. dollars at rates ranging from $1.25 CAD/USD to $1.40 CAD/USD (2015 - $1.04 CAD/USD to $1.27 CAD/USD). These contracts had a mark-to-market gain of $0.7 million (U.S. $0.6 million), which was recognized on the consolidated statement of financial position as derivative liabilities. Any changes in the net gain or loss from the prior reporting period due to addition of forward contracts, movements in the U.S. currency exchange rate, reclassification of the unrealized gains or losses to realized income or loss are recognized on the consolidated statement of operations as increase or decrease in fair value of derivative assets or liabilities of the period.
Risks and Uncertainties
The following risks and uncertainties may adversely affect the Company’s business, operating results, cash flows and financial condition. These may not be the Company’s only risks and uncertainties. Other unknown or currently insignificant risks and uncertainties not discussed below can have an adverse impact on the Company’s business and financial performance.
General economic and market conditions
Demand for office furniture is sensitive to general economic conditions such as the white-collar employment rate, corporate growth and profitability, government spending, office relocations and commercial property development. The Company manages to moderate the impact of this risk by increasing the differentiation of our products to attract new customers, the launching of new products to gain market share and enhancing the coverage of customers and designers.
172016 annual report | inscape
Competitive environment
Office furniture is a mature and highly competitive industry. Our main competitors include global companies with strong brand name recognition and capability to utilize offshore outsourcing. This competitive environment results in price pressure and limits certain distributors’ ability to carry Inscape products along with those of the competitors. The Company competes on product design, functionality, innovation and customer service. Our success will depend on building a distribution network that is aligned with Inscape, targeting committed dealers who lead with Inscape’s product lines and automating processes to keep improving our productivity, quality and customer service.
Raw material and commodity costs
Fluctuations in raw material and commodity prices could have a significant impact on the Company’s cost of sales and operating results. Since most of the raw materials and commodities used by the Company are not unique to the office furniture industry, their costs are often affected by supply and demand in other industries and countries. As a result, the Company may experience rising raw material and commodity costs that cannot be recovered from customers in a highly competitive environment. The Company manages its manufacturing costs by locking in supply contract prices, improving production yields, reducing spoilage, focusing on quality control and overseas sourcing, where appropriate.
U.S. dollar exchange rate
The U.S. is the main market for the Company. Fluctuations in the U.S./Canadian dollar exchange rate have a significant impact on the operating results, cash flows and financial condition of the Company. One method the Company uses to manage its foreign currency exposure is through the use of U.S. dollar hedge instruments. The hedge instruments provide the Company with an opportunity to lock in the U.S. currency conversion rate at a prevailing hedge rate to facilitate the business planning process with pre-determined exchange rate exposure. However, the instruments do not completely eliminate the effects of exchange rate fluctuations. To minimize the effect of exchange rate fluctuations, the Company endeavors to create natural hedges through increasing U.S. suppliers where appropriate and seeks to increase Canadian dollar sales.
Access to the U.S. markets
The Company depends heavily on unrestricted access to the U.S. markets as a significant portion of the Company’s sales is derived from there. The Company’s business, operating results, cash flows and financial condition will be seriously affected if access to the U.S. markets is restricted due to political, social, economic or regulatory reasons. Buy America sentiment and regulations may deny the Company’s chance in bidding contracts, especially with the government. The Company needs to monitor closely developments in various U.S. statutes, regulations, procurement requirements and border crossing restrictions. Where appropriate, the Company publicizes its extensive investment in the U.S. and contribution to the economy by operating a production plant in New York State, providing employment opportunities in different states and purchasing from U.S. suppliers.
Effectiveness of market representatives
The Company relies on the effectiveness of independent market representatives to market our products to customers. A market representative may choose to terminate its relationship with us or the effectiveness of a market representative may decline. Disruption of the relationship or transition of an underperforming representative could have an adverse impact on our business in the affected market. The Company manages this risk by maintaining strong connection to performing representatives at the regional senior management level. The Company also assesses the effectiveness of the representatives on a regular basis.
Effectiveness of growth strategy implementation
The Company seeks to grow its business and market share by building committed distribution, developing products and applications to meet customer needs, and providing visualization tools to assist designers and clients with solutions for workspaces. Effective implementation of these strategies is essential to the future growth of the Company. The Company’s sales and results of operations will be adversely affected if there are delays or difficulties in carrying out the strategies.
18 inscape | 2016 annual report
Controls and Procedures
Disclosure Controls and ProceduresThe Chief Executive Officer and the Chief Financial Officer (the “Certifying Officers”), along with other members of management, have designed, or caused to be designed under their supervision, Disclosure Controls and Procedures (“DC&P”) to provide reasonable assurance that (i) material information relating to the Company is made known to them by others, particularly during the period in which the annual filings are being prepared; and (ii) information required to be disclosed by the Company in its annual filings, interim filings or other reports filed or submitted by it under securities legislation is recorded, processed, summarized and reported within the time periods specified in securities legislation.
The Certifying Officers have evaluated, or caused to be evaluated under their supervision, the design and operating effectiveness of DC&P and have found that the Company’s DC&P are effective at the financial year end.
Internal Control over Financial ReportingThe Certifying Officers, along with other members of management, have also designed, or caused to be designed under their supervision, Internal Control over Financial Reporting (“ICFR”) to provide reasonable assurance regarding the reliability of financial reporting and the preparation of financial statements for external purposes prepared in accordance with IFRS. The Certifying Officers have used the Internal Control – Integrated Framework (2013 COSO Framework) issued by the Committee of Sponsoring Organizations of the Treadway Commission (“COSO”) to design the Company’s ICFR.
The Certifying Officers have evaluated, or caused to be evaluated under their supervision, the design and operating effectiveness of ICFR and have found that the Company’s ICFR is effective in design and operation at the financial year end.
During the three months ended April 30, 2016, there has been no change in the Company’s ICFR that has materially affected, or is reasonably likely to materially affect, the Company’s ICFR.
Limitations of an Internal Control SystemThe Certifying Officers believe that any DC&P or ICFR, no matter how well designed and operated, can provide only reasonable, not absolute, assurance that the objectives of the control system are met and that all control issues, including instances of fraud, if any, within the Company
have been prevented or detected. Further, the design of a control system must reflect the fact that there are resource constraints, and the benefits of controls must be considered relative to their costs. The design of any system of controls is also based in part upon certain assumptions about the likelihood of future events, and there can be no assurance that any design will succeed in achieving its stated goals under all potential (future) conditions.
Outlook
The US office furniture market has seen favourable growth in the past three years (2013: 2.2%, 2014: 5.4%, and 2015: 6.5%) (BIFMA Monthly Consumption History). BIFMA’s forecast for 2016 and 2017 is 3.9% and 7.2% respectively.
Office furniture trends demonstrate the office furniture market is constantly changing. These trends include reliance on technology, open concept environment with space for individual work, wellness and health consciousness, increased design awareness, blending of residential and work aesthetics, and a broad demographic work population. Inscape products are inherently flexible to help companies address the latest trends and business issues.
Management feels that the Company is well positioned to meet the demands and growth in the industry. The Company’s financial strength and liquidity provide support to manage growth and invest in product development and design. The manufacturing footprint provides capacity to meet the expected market growth as well as growth resulting from our strategic distribution objectives. Our new platform, F.I.R.E, makes it more efficient for the Company to meet the needs of the customers from specification through to manufacturing and delivery. F.I.R.E. has received strong reviews from the Company’s dealer network.
June 23, 2016
192016 annual report | inscape
management reportTo the Shareholders of Inscape CorporationPreparation of the consolidated financial statements accompanying this annual report and the presentation of all other information in the report is the responsibility of Management. The financial statements have been prepared in accordance with International Financial Reporting Standards and reflect Management’s best estimates and judgments. All other financial information in the report is consistent with that contained in the financial statements.
The Board of Directors, through its Audit Committee, oversees Management in carrying out its responsibility for financial reporting and systems of internal control. The Audit Committee, which is composed of non-executive directors, meets regularly with Management and external auditors to satisfy itself as to the reliability and integrity of financial information and the safeguarding of assets. The financial statements have been reviewed and approved by the Board of Directors on the recommendation of the Audit Committee.
Jim Stelter Director and Chief Executive Officer
Matthew Posno Chief Financial Officer
June 29, 2016

20 inscape | 2016 annual report
212016 annual report | inscape
independent auditor’s reportTo the Shareholders of Inscape Corporation
We have audited the accompanying consolidated financial statements of Inscape Corporation, which comprise the consolidated statements of financial position as at April 30, 2016 and April 30, 2015, and the consolidated statements of operations, consolidated statements of comprehensive loss, consolidated statements of changes in shareholders’ equity and consolidated statements of cash flows for the years then ended, and a summary of significant accounting policies and other explanatory information.
Management’s responsibility for the consolidated Financial StatementsManagement is responsible for the preparation and fair presentation of these consolidated financial statements in accordance with International Financial Reporting Standards, and for such internal control as management determines is necessary to enable the preparation of consolidated financial statements that are free from material misstatement, whether due to fraud or error.
Auditor’s responsibilityOur responsibility is to express an opinion on these consolidated financial statements based on our audits. We conducted our audits in accordance with Canadian generally accepted auditing standards. Those standards require that we comply with ethical requirements and plan and perform the audit to obtain reasonable assurance about whether the consolidated financial statements are free from material misstatement.
An audit involves performing procedures to obtain audit evidence about the amounts and disclosures in the consolidated financial statements. The procedures selected depend on the auditor’s judgment, including the assessment of the risks of material misstatement of the consolidated financial statements, whether due to fraud or error. In making those risk assessments, the auditor considers internal control relevant to the entity’s preparation and fair presentation of the consolidated financial statements in order to design audit procedures that are appropriate in the circumstances, but not for the purpose of expressing an opinion on the effectiveness of the entity’s internal control. An audit also includes evaluating the appropriateness of accounting policies used and the reasonableness of accounting estimates made by management, as well as evaluating the overall presentation of the consolidated financial statements.
We believe that the audit evidence we have obtained in our audits is sufficient and appropriate to provide a basis for our audit opinion.
OpinionIn our opinion, the consolidated financial statements present fairly, in all material respects, the financial position of Inscape Corporation as at April 30, 2016 and April 30, 2015, and its financial performance and its cash flows for the years then ended in accordance with International Financial Reporting Standards.
Chartered Professional Accountants Licensed Public Accountants June 29, 2016
22 inscape | 2016 annual report
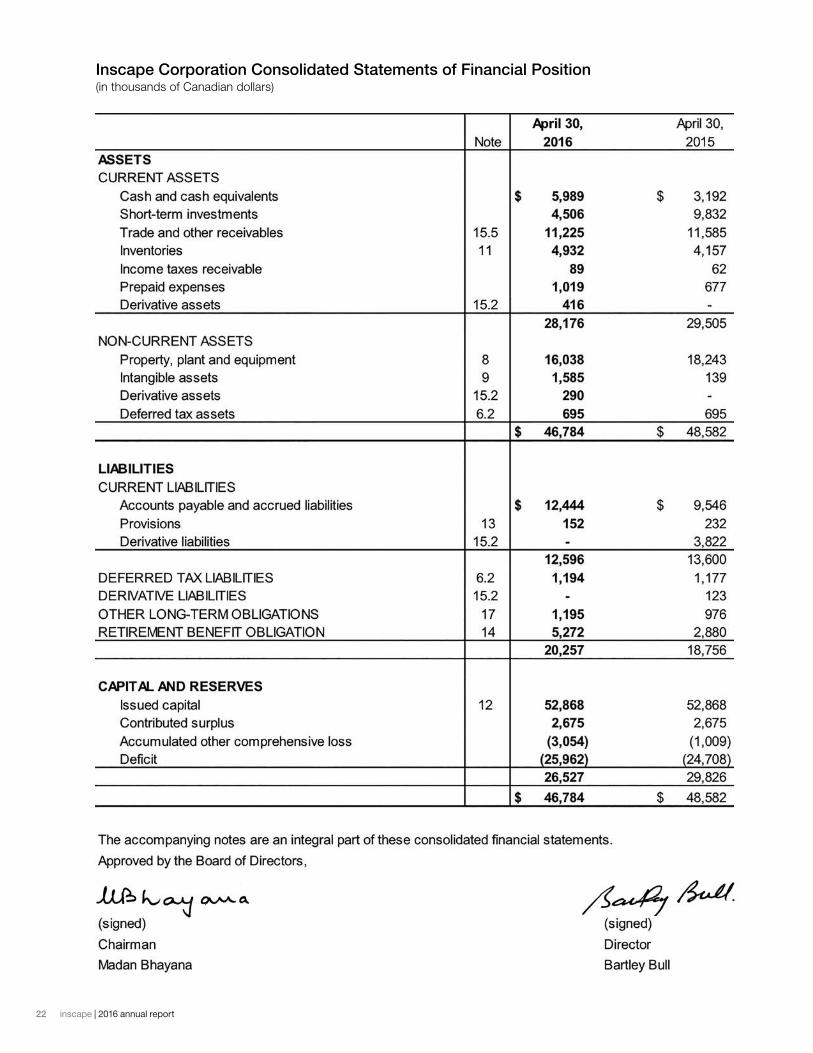
Inscape Corporation Consolidated Statements of Financial Position (in thousands of Canadian dollars)
232016 annual report | inscape
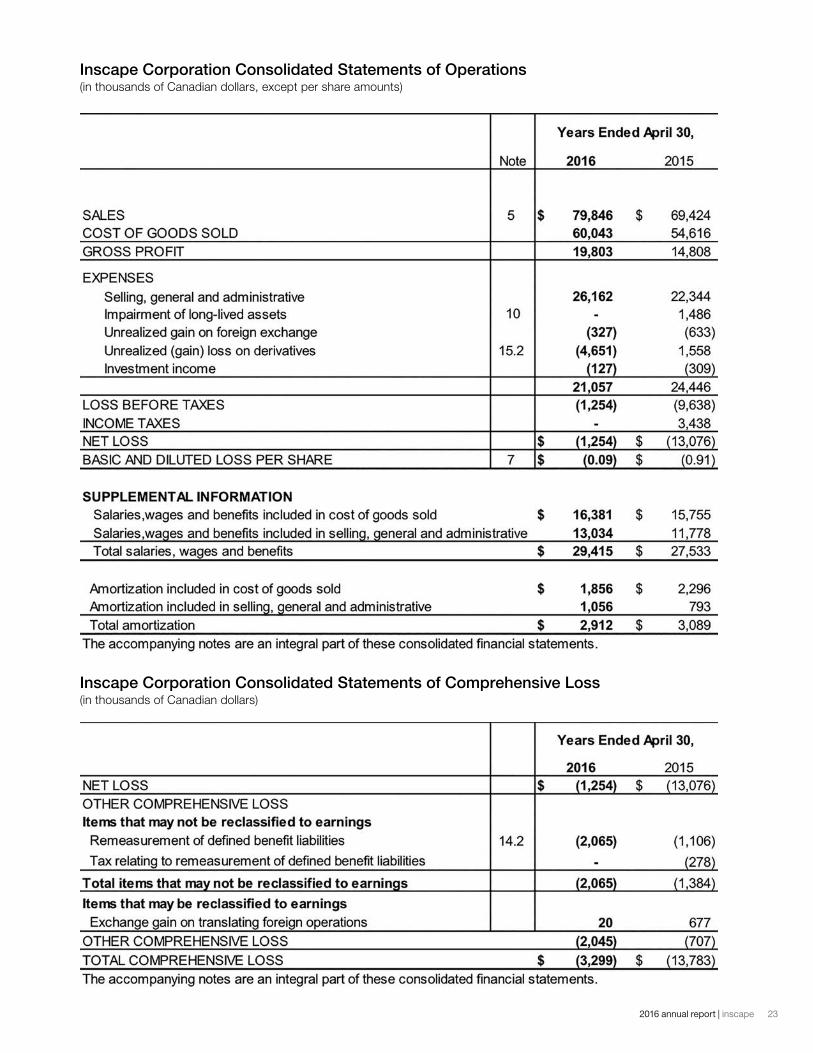
Inscape Corporation Consolidated Statements of Operations (in thousands of Canadian dollars, except per share amounts)
Inscape Corporation Consolidated Statements of Comprehensive Loss (in thousands of Canadian dollars)
24 inscape | 2016 annual report
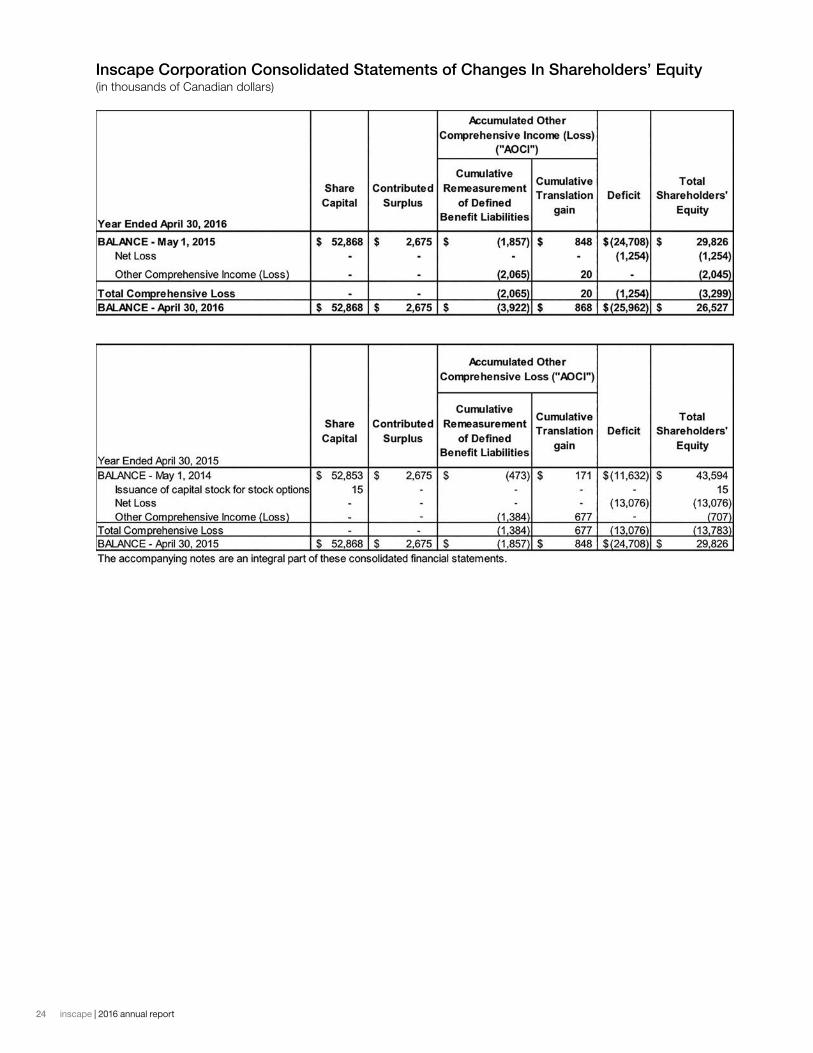
Inscape Corporation Consolidated Statements of Changes In Shareholders’ Equity (in thousands of Canadian dollars)
252016 annual report | inscape
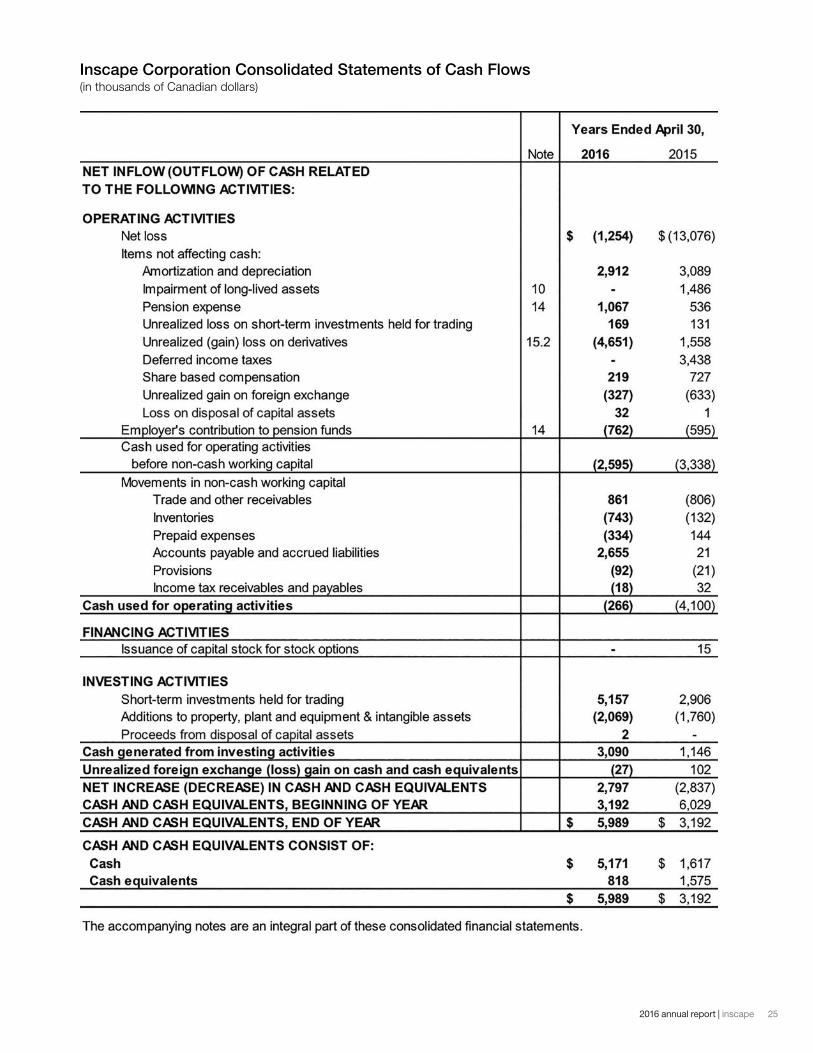
Inscape Corporation Consolidated Statements of Cash Flows (in thousands of Canadian dollars)
26 inscape | 2016 annual report notes to the consolidated financial statements for the year ended April 30, 2016
notes to the consolidated financial statements for the year ended April 30, 20161. General information
Inscape Corporation (the “Company”) is a limited company incorporated in Ontario, Canada, with Class B common shares listed on the Toronto Stock Exchange (TMX). The Company’s registered office is 67 Toll Road, Holland Landing, Ontario, Canada.
The Company is an office furniture and wall products manufacturer with production at two facilities in Canada and the United States in approximately 438,000 square feet of space. Inscape serves its customers through a network of authorized dealers.
2. Significant accounting policies
2.1 Statement of complianceThese consolidated financial statements including comparatives, have been prepared in accordance with International Financial Reporting Standards (”IFRS”) as issued by the International Accounting Standards Board.
These consolidated financial statements were prepared on a going concern assumption using the historical cost basis except for financial instruments.
These consolidated financial statements were approved and authorized for issuance by the Board of Directors of the Company on June 23, 2016.
2.2 Basis of consolidationThe consolidated financial statements incorporate the financial statements of the Company and its two wholly owned U.S. subsidiaries – Inscape Inc. and Inscape (New York) Inc.
All intra-group transactions, balances, income and expenses are eliminated in full on consolidation.
2.3 Revenue recognitionRevenue is measured at the fair value of the consideration received or receivable, net of dealer rebates.
2.3.1 Sale of goods and installation servicesRevenue from the sale of goods is recognized when the sales price is fixed or determinable, collection is reasonably assured, the costs incurred or to be incurred in respect of the sales can be measured reliably, the Company retains neither continuing
managerial involvement to the degree usually associated with ownership nor effective control over the goods sold, and the significant risks and rewards of ownership of the goods have been transferred to the customers.
For sales involving products and installation service, revenue from the sale of goods is recognized when the goods are shipped, while revenue from the installation service is recognized by reference to the stage of completion of the service at the end of the reporting period.
2.3.2 Investment incomeDividend income from investments is recognized when the Company’s right to receive payment has been established, it is probable that the economic benefits will flow to the Company and the amount of dividend can be measured reliably.
Interest income is recognized when it is probable that the economic benefits will flow to the Company and the amount of interest can be measured reliably.
2.4 Foreign currenciesThe Canadian dollar is the functional currency of the Company and the presentation currency for the consolidated financial statements.
Transactions in foreign currencies are recognized at the average exchange rate for the month in which the transactions occurred, unless exchange rates fluctuated significantly during that period or for non-recurring transactions of material amounts, in which case the exchange rates at the dates of the transactions are used. At the end of each reporting period, monetary items denominated in foreign currencies are retranslated at the rates prevailing at that date. Non-monetary items carried at fair value that are denominated in foreign currencies are retranslated at the rates prevailing at the date when the fair value was determined. Non-monetary items that are measured in terms of historical cost in a foreign currency are not retranslated. Exchange differences are recognized in profit or loss in the period in which they arise.
For the Company’s foreign operation where the Canadian dollar is its functional currency, the same policy described above is applied to the translation of its assets and liabilities for the purpose of presenting consolidated financial statements.
272016 annual report | inscape notes to the consolidated financial statements for the year ended April 30, 2016
For the Company’s foreign operation where the U.S. dollar is its functional currency, the assets and liabilities of the foreign operation for the purpose of presenting consolidated financial statements are expressed in Canadian dollars using exchange rates prevailing at the end of the reporting period. Exchange differences arising, if any, are recognized in other comprehensive income or loss and accumulated in equity until the disposal of the foreign operation, when all of the accumulated exchange differences in respect of that operation are reclassified to profit or loss. Revenues and expenses are translated into Canadian dollars at the average exchange rate for the month in which the transactions occurred, unless exchange rates fluctuated significantly during that period or for non-recurring transactions of material amounts, in which case the exchange rates at the dates of the transactions are used.
2.5 Employee future benefits Contributions to defined contribution retirement benefit plans are recognized as an expense when employees have rendered service entitling them to the contributions.
For defined benefit retirement benefit plans, the cost of providing benefits is determined using the Projected Unit Credit Method. Actuarial gains and losses and related taxes are recognized in other comprehensive income or loss as remeasurement of defined benefit liabilities.
The retirement benefit obligation recognized in the statements of financial position represents the present value of the defined benefit obligation as reduced by the fair value of plan assets. Any asset resulting from this calculation is limited to the present value of available refunds and reductions in future contributions to the plan.
The determination of a benefit expense requires assumptions such as the discount rate to measure obligations and the expected return on asset, the expected mortality rate and the expected rate of future compensation increases.
The present value of the defined benefit obligation is determined by discounting the estimated future cash outflows using interest rates of high quality corporate bonds and that have terms to maturity approximating the terms of the related pension liability.
2.6 Share-based compensationFor share-based compensation arrangement in which the term of the arrangement provides the employees and others providing similar services with the choice of settlement by equity instruments or in cash, the transaction is accounted for as a cash-settled share-based payment transaction.
For cash-settled share-based compensation, a liability is recognized for the goods or services acquired, measured initially at the fair value of the liability. Under the stock option plan, the fair value is determined by using the Black-Scholes-Merton Option Pricing Model, which factors in
the Company’s estimate of the number of options that will eventually vest. Under the executives’ long- term incentive plan and the deferred share unit plan, the fair value is based on the share price at the end of the reporting period as well as the Company’s estimate of the number of shares that will eventually vest.
At the end of each reporting period until the liability is settled, and at the date of settlement, the fair value of the liability is remeasured, with any changes in fair value recognized in profit or loss for the year.
2.7 TaxationIncome tax expense represents the sum of the tax currently payable and deferred tax.
2.7.1 Current taxThe tax currently payable is based on taxable profit for the year. Taxable profit differs from profit as reported in the consolidated statements of operations because of items of income or expense that are taxable or deductible in other years and items that are never taxable or deductible. The Company’s liability for current tax is calculated using tax rates that have been enacted or substantively enacted by the end of the reporting period.
2.7.2 Deferred taxDeferred tax is recognized on temporary differences between the carrying amounts of assets and liabilities in the financial statements and the corresponding tax bases used in the computation of taxable profit. Deferred tax liabilities are generally recognized for all taxable temporary differences. Deferred tax assets are generally recognized for all deductible temporary differences to the extent that it is probable that taxable profits will be available against which those deductible temporary differences can be utilized. The carrying amount of deferred tax assets is reviewed at the end of each reporting period and reduced to the extent that it is no longer probable that sufficient taxable profits will be available to allow all or part of the asset to be recovered.
Deferred tax assets and liabilities are measured at the tax rates that are expected to apply in the period in which the liability is settled or the asset realized, based on tax rates (and tax laws) that have been enacted or substantively enacted by the end of the reporting period.
2.8 Cash and cash equivalentsCash and cash equivalents include cash and liquid short-term investments in money market instruments with maturities of three months or less from the date of acquisition.
2.9 Short-term investmentsShort-term investments include liquid investments, such as Guaranteed Investment Certificates (“GICs”), preferred shares, bonds, in money market instruments with maturities greater than three months from the date of acquisition, measured at fair market value at the report date.
28 inscape | 2016 annual report notes to the consolidated financial statements for the year ended April 30, 2016
2.10 Trade receivablesTrade receivables are amounts due from customers from the sale of goods or rendering of services in the ordinary course of business. Trade receivables are classified as current assets if payment is due within one year or less. The financial instrument designation for trade receivables is “loans and receivables”. The Company maintains an allowance for impairment of trade receivables. The expense relating to doubtful accounts is included within “selling, general and administrative expense” in the statements of operations.
2.11 Trade payablesTrade payables are obligations to pay for goods or services that have been acquired in the ordinary course of business. Trade payables are classified as current liabilities if payment is due within one year or less. Trade payables are recognized initially at fair value and subsequently measured at amortized cost.
2.12 Earnings per share (“EPS”)Basic earnings per common share is calculated using the weighted daily average number of common shares outstanding. Diluted earnings per share is calculated using the treasury stock method.
2.13 Property, plant and equipmentProperty, plant and equipment are stated at cost less accumulated depreciation and accumulated impairment losses.
Depreciation is recognized when property, plant and equipment is available for use so as to write off the cost less their residual values over their useful lives, using the straight-line method. The estimated useful lives, residual values and depreciation method are reviewed at each year end, with the effect of any changes in estimate accounted for on a prospective basis. Depreciation ceases at the earlier of when the asset or component is derecognized, or when it is held for sale or included in a group that is classified as held for sale.
Each component of an item of property, plant and equipment with a cost which is significant in relation to the total cost of the item and has a significantly different estimated useful life than the parent asset is depreciated separately. Component accounting is used for the Company’s buildings.
2.14 Intangible assetsIntangible assets are carried at cost less accumulated amortization and accumulated impairment losses. Amortization is recognized on a straight-line basis over their estimated useful lives. The estimated useful life and amortization method are reviewed at the end of each year-end, with the effect of any changes in estimate being accounted for on a prospective basis.
Expenditure on research activities is recognized as an expense in the period in which it is incurred.
2.15 Impairment of long-lived non-financial assets At the end of each reporting period, the Company reviews the carrying amounts of its long-lived non-financial assets to determine whether there is any indication that those assets have suffered an impairment loss. If any such indication exists, the recoverable amount of the asset is estimated in order to determine the extent of the impairment loss, if any. Where it is not possible to estimate the recoverable amount of an individual asset, the Company estimates the recoverable amount of the cash-generating unit (“CGU”) to which the asset belongs. A CGU is the smallest identifiable group of assets that generates cash flows that are largely independent of the cash flows from other assets or group of assets.
Recoverable amount is the higher of fair value less costs to sell and value in use, which is the present value of the estimated future cash flows from the use of the asset (or cash-generating unit).
The discount rates used in the present value calculation are the pre-tax rates that reflect current market assessments of the time value of money and the risks specific to the asset.
If the recoverable amount is estimated to be less than the carrying amount of the asset (or cash-generating unit), the carrying amount is reduced to its recoverable amount. An impairment loss is recognized immediately in profit or loss. At the end of each reporting period, the Company reviews whether there is any indication that an impairment loss recognized in prior periods for an asset other than goodwill (or cash-generating unit) may no longer exist or may have decreased. If any such indication exists, the recoverable amount of the asset (or cash-generating unit) is estimated in order to determine whether the impairment loss should be reversed. Where an impairment loss subsequently reverses, the carrying amount of the asset (or cash-generating unit) is increased to the revised estimate of its recoverable amount, but so that the increased carrying amount does not exceed the carrying amount that would have been determined had no impairment loss been recognized for the asset (or cash-generating unit) in prior years. A reversal of an impairment loss is recognized immediately in profit or loss.
2.16 InventoriesRaw materials are measured at the lower of cost and net realizable value, determined on a first-in, first-out basis. Recoverable costs of raw materials that have no consumption over a period of eighteen months may be written down based on the Company’s assessment of their future usage. When circumstances that previously caused inventories to be written down below cost no longer exist, the amount of the write-down previously recorded is reversed. Work-in-progress and finished goods are measured at the lower of cost and net realizable value, determined on a first-in, first-out basis. Net realizable value is the estimated selling price in the ordinary course of business less the estimated costs necessary to make the sale. The cost of work-in-progress and finished goods includes the cost of raw materials, the applicable share of the cost of labour, fixed and variable production overheads.
292016 annual report | inscape notes to the consolidated financial statements for the year ended April 30, 2016
2.17 LeasesLeases are classified as finance or operating depending on the terms and conditions of the contracts. Leases which transfer substantially all the risks and ownership are classified as finance leases. An asset held under a finance lease is initially recognized at the inception of the lease at an amount equal to the lower of its fair value and the present value of the minimum lease payments. The corresponding liability to the lessor is included in the statements of financial position as a finance lease obligation. Subsequent to its initial recognition, the costs are depreciated in accordance with the accounting policy of the applicable asset. Obligations recorded under finance leases are reduced by lease payments, net of imputed interest. Interest expense is recognized in net earnings.
Leases that do not meet the criteria for finance leases are classified as operating leases. Payments made under operating leases are expensed on a straight-line basis over the term of the lease.
2.18 ProvisionsProvisions are recognized when the Company has a present obligation (legal or constructive) as a result of a past event, it is probable that the Company will be required to settle the obligation, and a reliable estimate can be made of the amount of the obligation.
The amount recognized as a provision is the best estimate of the consideration required to settle the present obligation at the end of the reporting period, taking into account the risks and uncertainties surrounding the obligation. Where a provision is measured using the cash flows estimated to settle the present obligation, its carrying amount is the present value of those cash flows.
2.19 Financial assetsAll financial assets are recognized and derecognized on trade date where the purchase or sale of a financial asset is under a contract whose terms require delivery of the financial asset within the timeframe established by the market concerned, and are initially measured at fair value, plus transaction costs.
Financial assets are classified into the following specified categories: financial assets ‘at fair value through profit or loss’ (FVTPL), ‘held-to-maturity’ investments, ‘loans and receivables’ and ‘available-for-sale’ (AFS) financial assets. The classification depends on the nature and purpose of the financial assets and is determined at the time of initial recognition.
2.19.1 Financial assets at FVTPL (including held-for-trading investments)Financial assets are classified as at FVTPL when the financial asset is either held for trading or it is designated as at FVTPL on initial recognition. Financial assets at FVTPL are stated at fair value, with any gains or losses arising on remeasurement recognized in profit or loss.
2.19.2 Held-to-maturity investmentsFinancial assets with fixed or determinable payments and fixed maturity dates that the Company has the positive intent and ability to hold to maturity are classified as held-to-maturity investments. Held-to-maturity investments are measured at amortized cost using the effective interest method less any impairment, with revenue recognized on an effective yield basis.
2.19.3 Loans and receivablesLoans and receivables are non-derivative financial assets with fixed or determinable payments that are not quoted in an active market. They are included in current assets, except for those with maturities greater than twelve months after the end of a reporting period, which are classified as non-current assets. Loans and receivables are measured at amortized cost using the effective interest method, less any impairment. Interest income is recognized by applying the effective interest rate.
2.19.4 Available for sale financial assetsAFS financial assets are those non-derivative financial assets that are designated as available for sale, or are not classified as loans and receivables or held-to-maturity investments, are not held for trading, and are not designated as financial assets at FVTPL on initial recognition. AFS assets are stated at fair value. Gains and losses arising from changes in fair value are recognized in other comprehensive income or loss and accumulated in the investments revaluation reserve. Impairment losses and interest calculated using the effective interest method are recognized in profit or loss. Where the investment is disposed of or is determined to be impaired, the cumulative gain or loss previously accumulated in the investments revaluation reserve is reclassified to profit or loss.
2.19.5 Impairment of financial assetsFinancial assets, other than those at FVTPL, are assessed for indicators of impairment at the end of each reporting period. Financial assets are considered to be impaired when there is objective evidence that, as a result of one or more events that occurred after the initial recognition of the financial asset, the estimated future cash flows of the investment have been affected. When impairment has occurred, the loss is recognized in net earnings with the offset to reduce the asset’s carrying value. For financial assets carried at amortized cost, the amount of the impairment is the difference between the asset’s carrying amount and the present value of the estimated future cash flows discounted at the financial asset’s original effective interest rate. In a subsequent period, if the impairment loss decreases and the decrease relates to an event occurring after the impairment was recognized, the previously recognized impairment loss is reversed through net earnings. On the date of impairment reversal, the carrying amount of the financial asset cannot exceed its amortized cost had impairment not been recognized.
30 inscape | 2016 annual report notes to the consolidated financial statements for the year ended April 30, 2016
2.20 Financial liabilities
Financial liabilities are classified as either financial liabilities at FVTPL or other financial liabilities.
Financial liabilities are classified as at FVTPL when the financial liability is either held for trading or it is designated as at FVTPL. Financial liabilities at FVTPL are stated at fair
value, with any gains or losses arising on remeasurement recognized in profit or loss.
Other financial liabilities are initially measured at fair value, net of transaction costs. Other financial liabilities are subsequently measured at amortized cost using the effective interest method, with interest expense recognized on an effective yield basis.
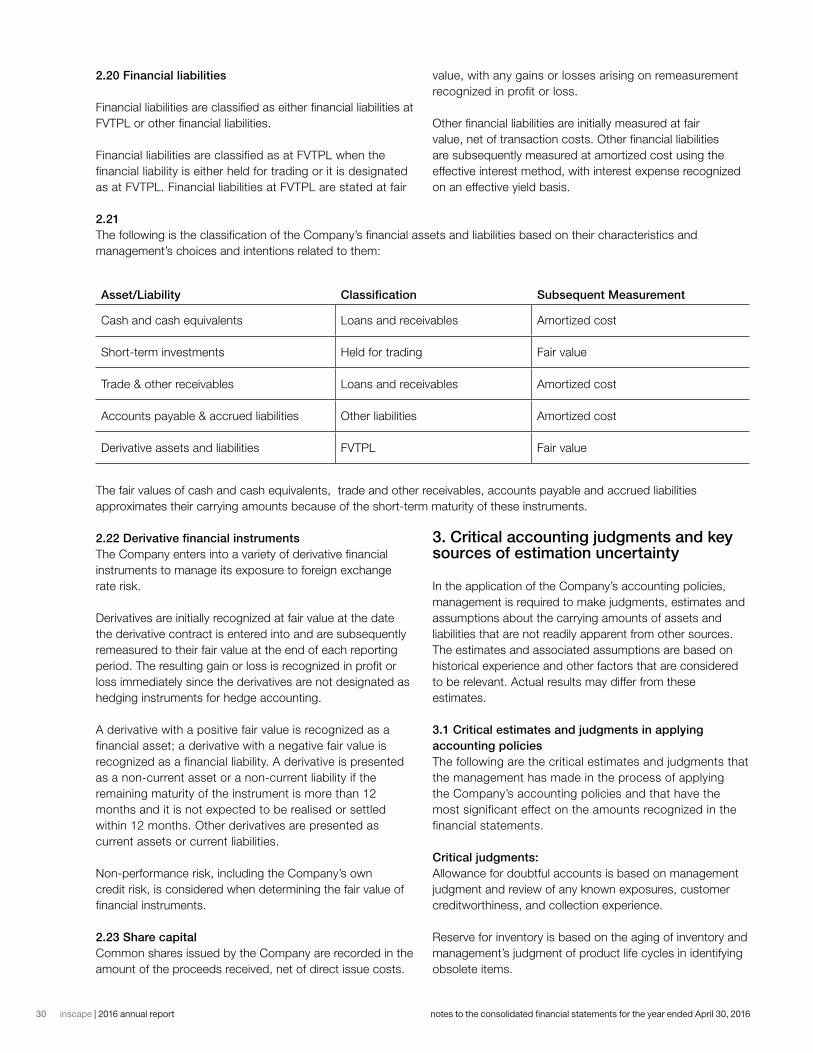
2.21 The following is the classification of the Company’s financial assets and liabilities based on their characteristics and management’s choices and intentions related to them:
Asset/Liability Classification Subsequent Measurement
Cash and cash equivalents Loans and receivables Amortized cost
Short-term investments Held for trading Fair value
Trade & other receivables Loans and receivables Amortized cost
Accounts payable & accrued liabilities Other liabilities Amortized cost
Derivative assets and liabilities FVTPL Fair value
The fair values of cash and cash equivalents, trade and other receivables, accounts payable and accrued liabilities approximates their carrying amounts because of the short-term maturity of these instruments.
2.22 Derivative financial instrumentsThe Company enters into a variety of derivative financial instruments to manage its exposure to foreign exchange rate risk.
Derivatives are initially recognized at fair value at the date the derivative contract is entered into and are subsequently remeasured to their fair value at the end of each reporting period. The resulting gain or loss is recognized in profit or loss immediately since the derivatives are not designated as hedging instruments for hedge accounting.
A derivative with a positive fair value is recognized as a financial asset; a derivative with a negative fair value is recognized as a financial liability. A derivative is presented as a non-current asset or a non-current liability if the remaining maturity of the instrument is more than 12 months and it is not expected to be realised or settled within 12 months. Other derivatives are presented as current assets or current liabilities.
Non-performance risk, including the Company’s own credit risk, is considered when determining the fair value of financial instruments.
2.23 Share capitalCommon shares issued by the Company are recorded in the amount of the proceeds received, net of direct issue costs.
3. Critical accounting judgments and key sources of estimation uncertainty
In the application of the Company’s accounting policies, management is required to make judgments, estimates and assumptions about the carrying amounts of assets and liabilities that are not readily apparent from other sources. The estimates and associated assumptions are based on historical experience and other factors that are considered to be relevant. Actual results may differ from these estimates.
3.1 Critical estimates and judgments in applying accounting policiesThe following are the critical estimates and judgments that the management has made in the process of applying the Company’s accounting policies and that have the most significant effect on the amounts recognized in the financial statements.
Critical judgments:Allowance for doubtful accounts is based on management judgment and review of any known exposures, customer creditworthiness, and collection experience.
Reserve for inventory is based on the aging of inventory and management’s judgment of product life cycles in identifying obsolete items.
312016 annual report | inscape notes to the consolidated financial statements for the year ended April 30, 2016
Identification of cash generating units for the purposes of performing impairment test of asset is based on management’s judgment of what constitutes the smallest group of assets that can generate cash flows largely independent of other assets.
Determination of valuation allowance on deferred tax assets is based on management’s judgment of the ability of the Company to achieve sufficient taxable income to use the deferred tax assets.
Critical estimates:Estimated useful lives and residual values of intangible assets, and property, plant and equipment are based on management’s experience, the intended usage of the assets and the expected technological advancement that may affect the life cycle and residual values of the assets.
Defined benefit pension obligations are based on the management’s best estimates on the discount rate of obligations, mortality rate and the future rate of salary increase.
Liability for the Company’s performance and restricted share units is based on the management’s best estimates on the Company’s financial performance during the vesting period of the performance and restricted share units.
Cash flow projections of the Company’s cash generating units for the purposes of performing an impairment test of assets are based on the Company’s best estimate of the range of business and economic conditions.
The Company computes an income tax provision in each of the jurisdictions in which it operates. Actual amounts of income tax expense are finalized upon filing and acceptance of the tax return by the relevant authorities, which occur subsequent to the issuance of the financial statements. The estimation of income taxes includes evaluating the recoverability of deferred tax assets based on an assessment of the ability to use the underlying future tax deductions before they expire against future taxable income. The assessment is based upon existing tax laws and estimates of future taxable income. To the extent estimates differ from the final tax returns, net earnings would be affected in a subsequent period.
The Company is subject to taxation in numerous jurisdictions. There are many transactions and calculations for which the ultimate tax determination is uncertain during the ordinary course of business. The Company maintains provisions for uncertain tax positions that it believes appropriately reflect its risk with respect to tax matters under active discussion, audit, dispute or appeal with tax authorities, or which are otherwise considered to involve uncertainty. These provisions are made using the best estimate of the amount expected to be paid based on a
qualitative assessment of all relevant factors. The Company reviews the adequacy of these provisions at the end of the reporting period. It is possible that at some future date an additional liability could result from audits by taxing authorities. Where the final outcome of these tax-related matters is different from the amounts that were initially recorded, such differences will affect the tax provision in the period in which such determination is made.
4. Future Accounting Changes
IFRS 9 Financial Instruments:In July 2014, the IASB issued IFRS 9 (2014) – Financial Instruments (“IFRS 9”). IFRS 9 replaces IAS 39 – Financial Instruments: Recognition and Measurement (“IAS 39”), in its entirety. IFRS 9 uses a single approach to determine whether a financial asset or liability is measured at amortized cost or fair value, replacing the multiple rules in IAS 39. For financial assets, the approach in IFRS is based on how an entity manages its financial instruments in the context of its business model and the contractual cash flow characteristics of the financial assets and limited changes to the classification and measurement requirements for financial assets. For financial liabilities measured at fair value, fair value changes due to changes in the Company’s credit risk are presented in other comprehensive income (“OCI”), instead of net income (loss), unless this would create an accounting mismatch. The new standard also requires a single impairment method to be used, replacing the multiple impairment methods in IAS 39 and introduces a new expected loss impairment model. IFRS 9 also provides relief from the requirement to restate comparative financial statements for the effect of applying IFRS 9. This amendment completes the IASB’s financial instruments project and the standard is effective for reporting periods beginning on or after January 1, 2018 with early adoption permitted. The Company is currently evaluating the impact of the adoption of this standard on its consolidated financial statements.
IFRS 15 Revenue from Contracts with Customers:In May 2014, the IASB released IFRS 15 Revenue from Contracts with Customers, which establishes principles for reporting the nature, amount, timing and uncertainty of revenue and cash flows arising from an entity’s contracts with customers. It provides a single model in order to depict the transfer of promised goods or services to customers. The core principle of IFRS 15 is that an entity recognizes revenue to depict the transfer of promised goods or services to customers in an amount that reflects the consideration to which an entity expects to be entitled in exchange for those goods and services. IFRS 15 also requires more comprehensive disclosures about the nature, amount, timing and uncertainty of revenue and cash flows arising from an entity’s contracts with customers.
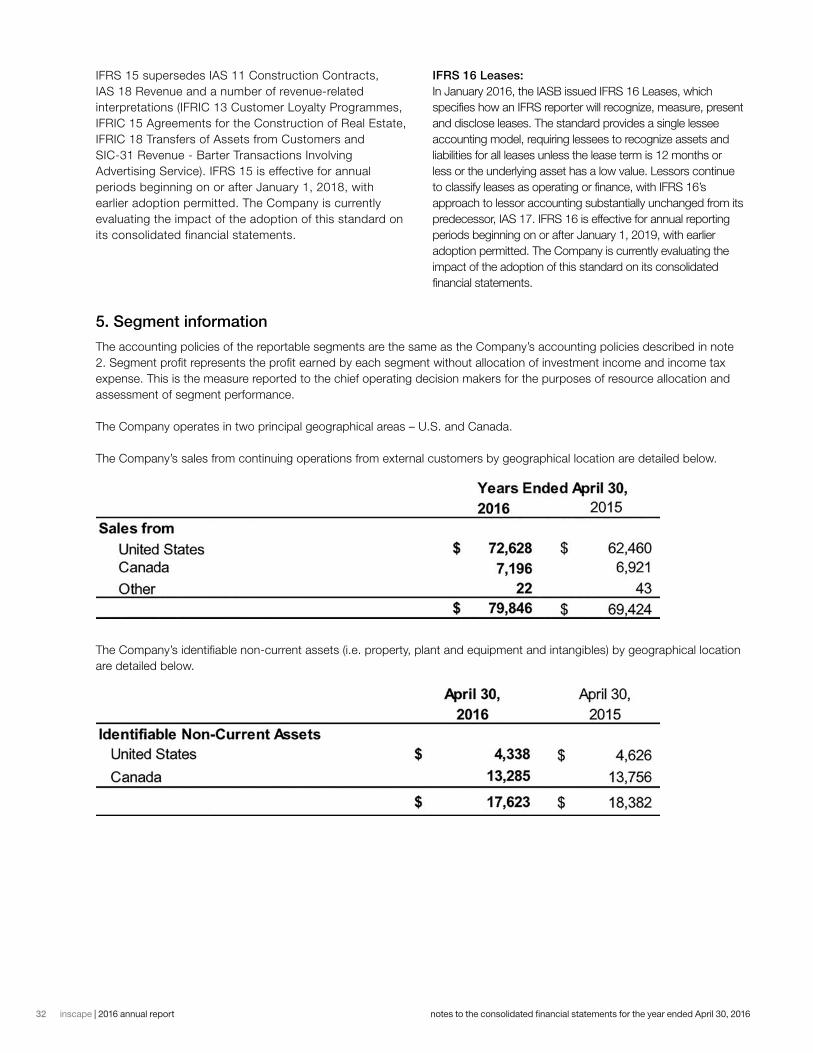
32 inscape | 2016 annual report notes to the consolidated financial statements for the year ended April 30, 2016
IFRS 15 supersedes IAS 11 Construction Contracts, IAS 18 Revenue and a number of revenue-related interpretations (IFRIC 13 Customer Loyalty Programmes, IFRIC 15 Agreements for the Construction of Real Estate, IFRIC 18 Transfers of Assets from Customers and SIC-31 Revenue - Barter Transactions Involving Advertising Service). IFRS 15 is effective for annual periods beginning on or after January 1, 2018, with earlier adoption permitted. The Company is currently evaluating the impact of the adoption of this standard on its consolidated financial statements.
IFRS 16 Leases:In January 2016, the IASB issued IFRS 16 Leases, which specifies how an IFRS reporter will recognize, measure, present and disclose leases. The standard provides a single lessee accounting model, requiring lessees to recognize assets and liabilities for all leases unless the lease term is 12 months or less or the underlying asset has a low value. Lessors continue to classify leases as operating or finance, with IFRS 16’s approach to lessor accounting substantially unchanged from its predecessor, IAS 17. IFRS 16 is effective for annual reporting periods beginning on or after January 1, 2019, with earlier adoption permitted. The Company is currently evaluating the impact of the adoption of this standard on its consolidated financial statements.
5. Segment information
The accounting policies of the reportable segments are the same as the Company’s accounting policies described in note 2. Segment profit represents the profit earned by each segment without allocation of investment income and income tax expense. This is the measure reported to the chief operating decision makers for the purposes of resource allocation and assessment of segment performance.
The Company operates in two principal geographical areas – U.S. and Canada.
The Company’s sales from continuing operations from external customers by geographical location are detailed below.
The Company’s identifiable non-current assets (i.e. property, plant and equipment and intangibles) by geographical location are detailed below.
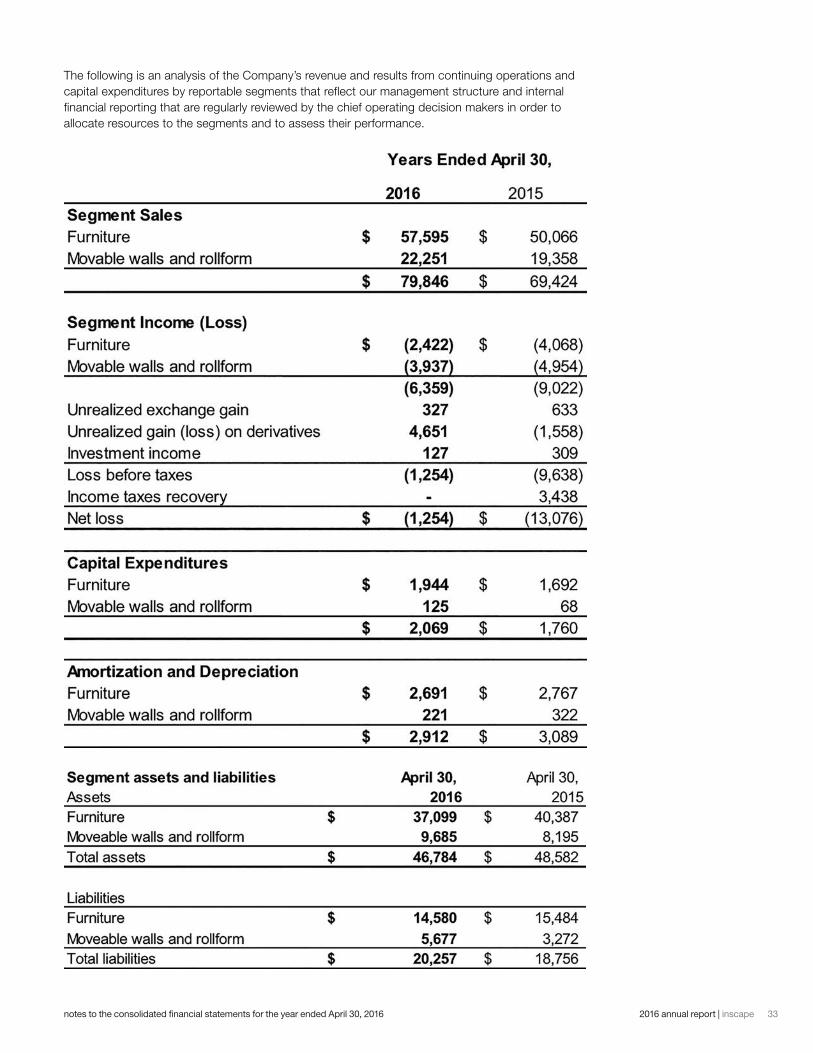
332016 annual report | inscape notes to the consolidated financial statements for the year ended April 30, 2016
The following is an analysis of the Company’s revenue and results from continuing operations and capital expenditures by reportable segments that reflect our management structure and internal financial reporting that are regularly reviewed by the chief operating decision makers in order to allocate resources to the segments and to assess their performance.
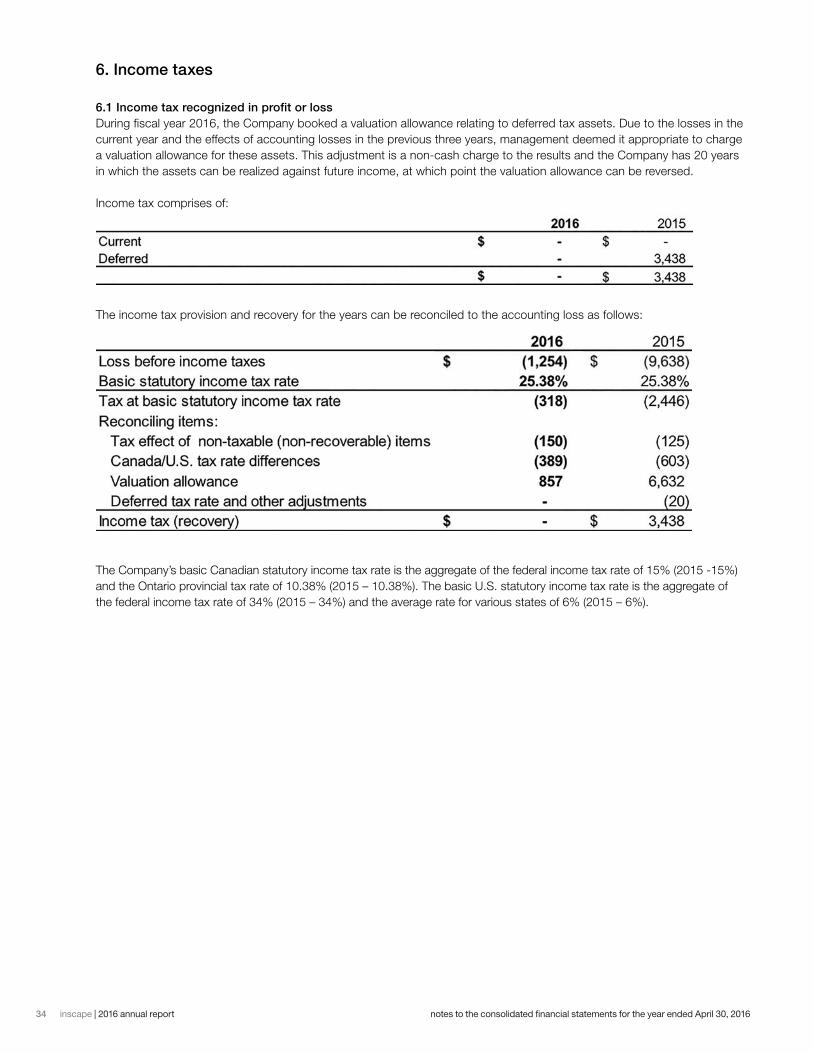
34 inscape | 2016 annual report notes to the consolidated financial statements for the year ended April 30, 2016
6. Income taxes
6.1 Income tax recognized in profit or lossDuring fiscal year 2016, the Company booked a valuation allowance relating to deferred tax assets. Due to the losses in the current year and the effects of accounting losses in the previous three years, management deemed it appropriate to charge a valuation allowance for these assets. This adjustment is a non-cash charge to the results and the Company has 20 years in which the assets can be realized against future income, at which point the valuation allowance can be reversed.
Income tax comprises of:
The income tax provision and recovery for the years can be reconciled to the accounting loss as follows:
The Company’s basic Canadian statutory income tax rate is the aggregate of the federal income tax rate of 15% (2015 -15%) and the Ontario provincial tax rate of 10.38% (2015 – 10.38%). The basic U.S. statutory income tax rate is the aggregate of the federal income tax rate of 34% (2015 – 34%) and the average rate for various states of 6% (2015 – 6%).
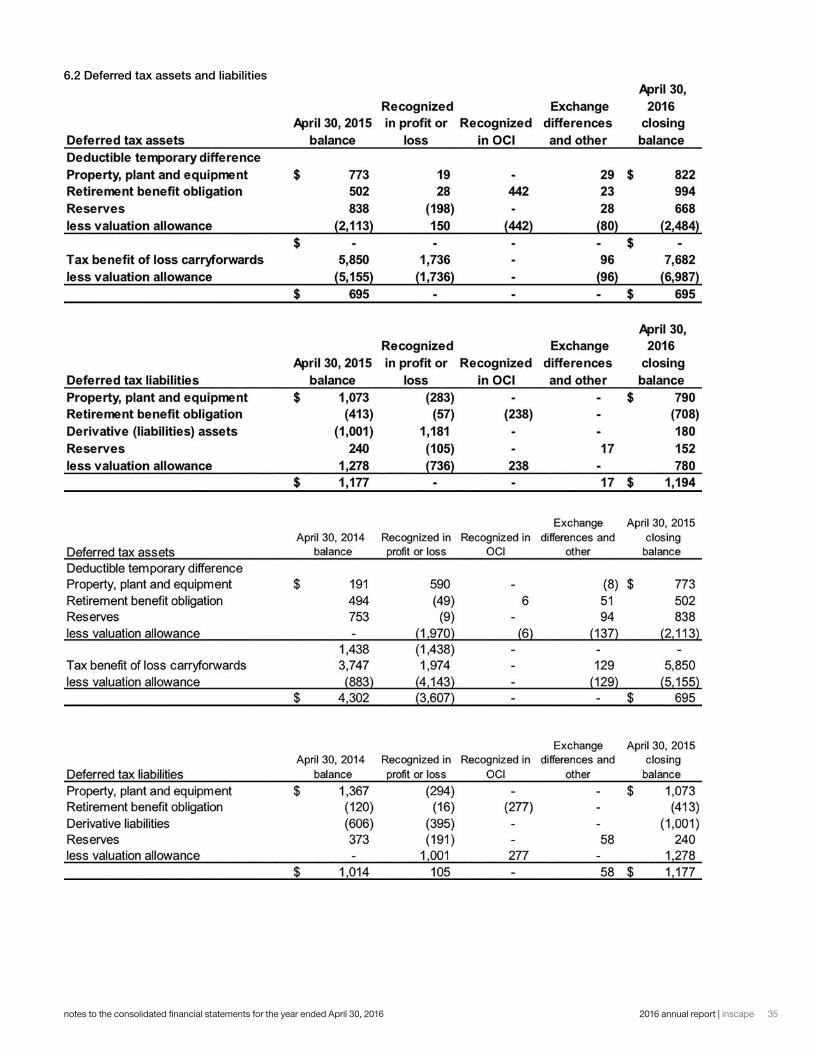
352016 annual report | inscape notes to the consolidated financial statements for the year ended April 30, 2016
6.2 Deferred tax assets and liabilities
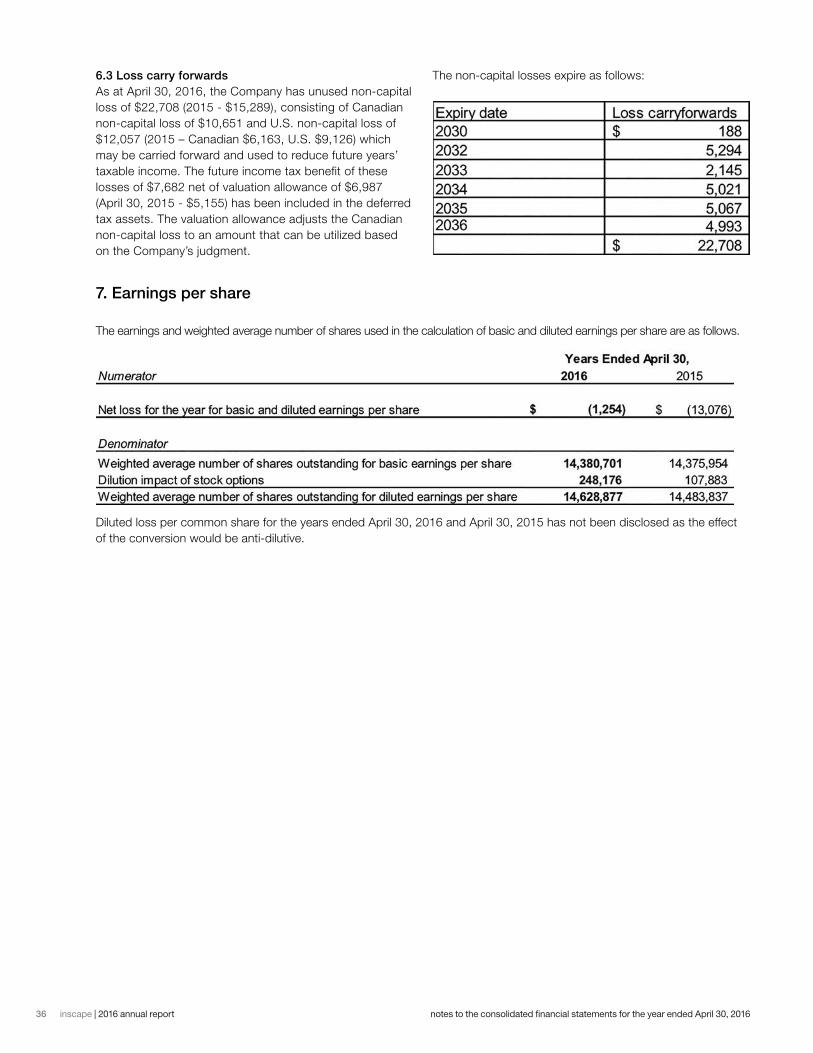
36 inscape | 2016 annual report notes to the consolidated financial statements for the year ended April 30, 2016
6.3 Loss carry forwardsAs at April 30, 2016, the Company has unused non-capital loss of $22,708 (2015 - $15,289), consisting of Canadian non-capital loss of $10,651 and U.S. non-capital loss of $12,057 (2015 – Canadian $6,163, U.S. $9,126) which may be carried forward and used to reduce future years’ taxable income. The future income tax benefit of these losses of $7,682 net of valuation allowance of $6,987 (April 30, 2015 - $5,155) has been included in the deferred tax assets. The valuation allowance adjusts the Canadian non-capital loss to an amount that can be utilized based on the Company’s judgment.
The non-capital losses expire as follows:
7. Earnings per share
The earnings and weighted average number of shares used in the calculation of basic and diluted earnings per share are as follows.
Diluted loss per common share for the years ended April 30, 2016 and April 30, 2015 has not been disclosed as the effect of the conversion would be anti-dilutive.
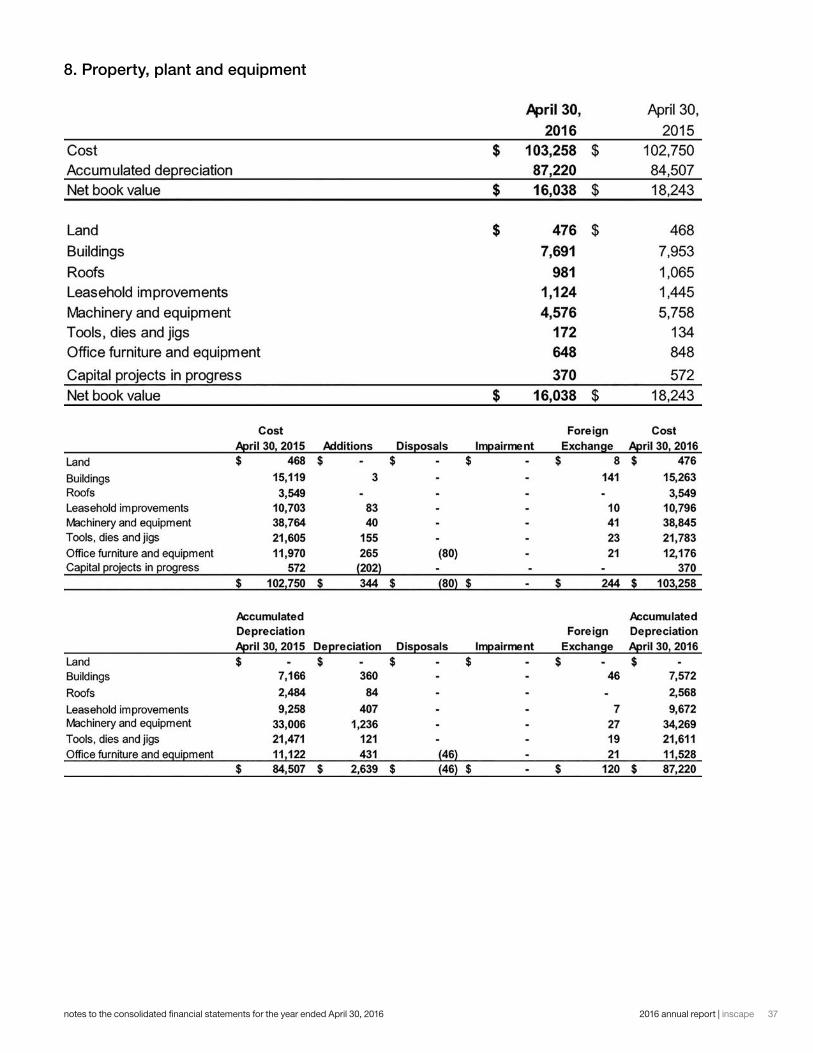
372016 annual report | inscape notes to the consolidated financial statements for the year ended April 30, 2016
8. Property, plant and equipment
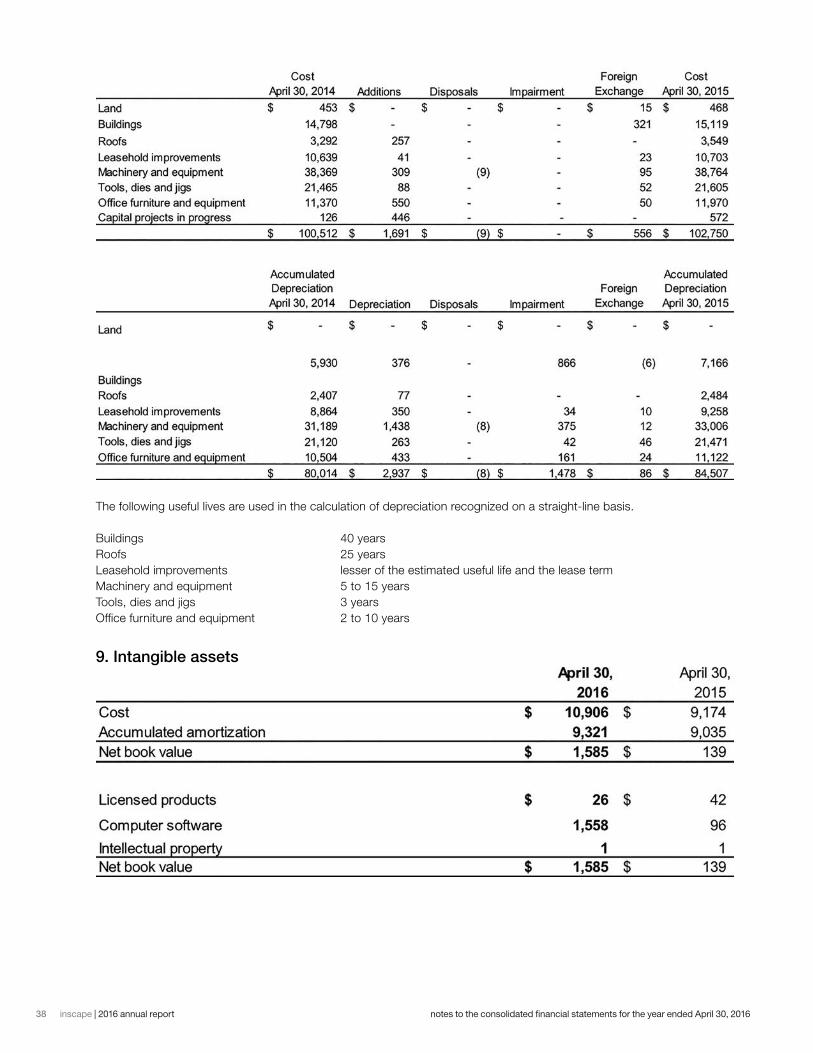
38 inscape | 2016 annual report notes to the consolidated financial statements for the year ended April 30, 2016
The following useful lives are used in the calculation of depreciation recognized on a straight-line basis.
Buildings 40 years Roofs 25 years Leasehold improvements lesser of the estimated useful life and the lease term Machinery and equipment 5 to 15 years Tools, dies and jigs 3 years Office furniture and equipment 2 to 10 years
9. Intangible assets
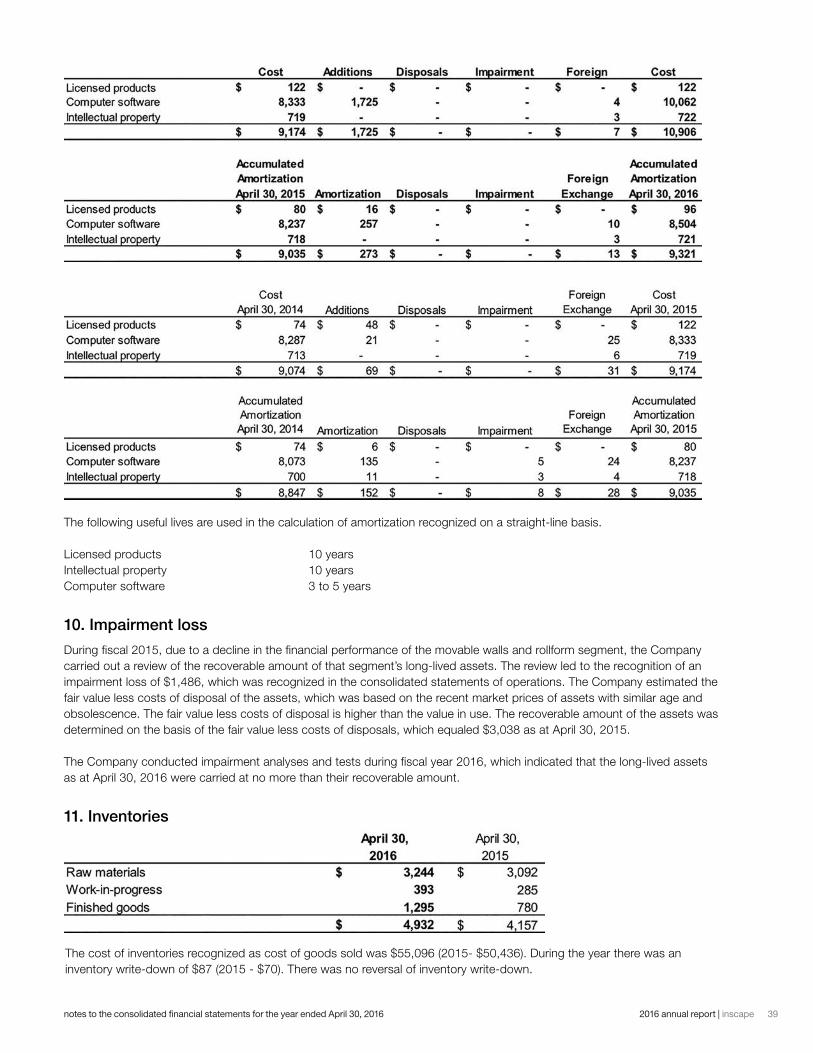
392016 annual report | inscape notes to the consolidated financial statements for the year ended April 30, 2016
The following useful lives are used in the calculation of amortization recognized on a straight-line basis.
Licensed products 10 years Intellectual property 10 years Computer software 3 to 5 years
10. Impairment loss
During fiscal 2015, due to a decline in the financial performance of the movable walls and rollform segment, the Company carried out a review of the recoverable amount of that segment’s long-lived assets. The review led to the recognition of an impairment loss of $1,486, which was recognized in the consolidated statements of operations. The Company estimated the fair value less costs of disposal of the assets, which was based on the recent market prices of assets with similar age and obsolescence. The fair value less costs of disposal is higher than the value in use. The recoverable amount of the assets was determined on the basis of the fair value less costs of disposals, which equaled $3,038 as at April 30, 2015.
The Company conducted impairment analyses and tests during fiscal year 2016, which indicated that the long-lived assets as at April 30, 2016 were carried at no more than their recoverable amount.
11. Inventories
The cost of inventories recognized as cost of goods sold was $55,096 (2015- $50,436). During the year there was an inventory write-down of $87 (2015 - $70). There was no reversal of inventory write-down.
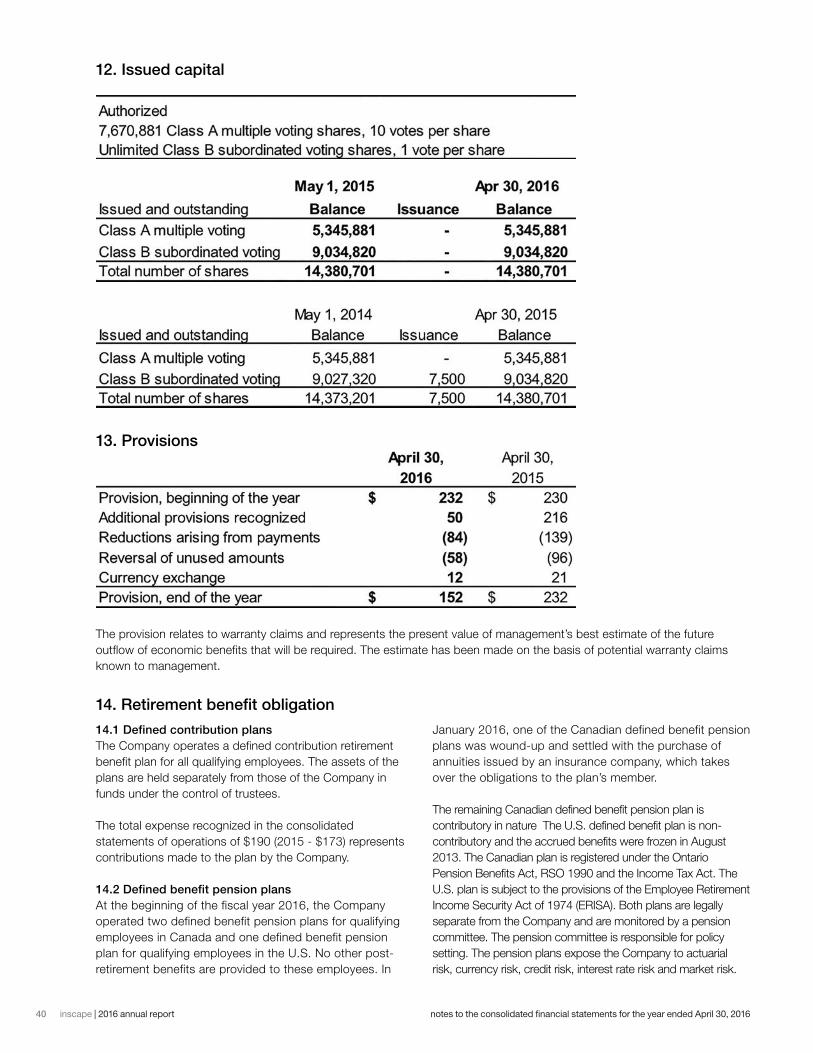
40 inscape | 2016 annual report notes to the consolidated financial statements for the year ended April 30, 2016
12. Issued capital
The provision relates to warranty claims and represents the present value of management’s best estimate of the future outflow of economic benefits that will be required. The estimate has been made on the basis of potential warranty claims known to management.
14. Retirement benefit obligation
14.1 Defined contribution plans The Company operates a defined contribution retirement benefit plan for all qualifying employees. The assets of the plans are held separately from those of the Company in funds under the control of trustees.
The total expense recognized in the consolidated statements of operations of $190 (2015 - $173) represents contributions made to the plan by the Company.
14.2 Defined benefit pension plans At the beginning of the fiscal year 2016, the Company operated two defined benefit pension plans for qualifying employees in Canada and one defined benefit pension plan for qualifying employees in the U.S. No other post-retirement benefits are provided to these employees. In
January 2016, one of the Canadian defined benefit pension plans was wound-up and settled with the purchase of annuities issued by an insurance company, which takes over the obligations to the plan’s member.
The remaining Canadian defined benefit pension plan is contributory in nature The U.S. defined benefit plan is non-contributory and the accrued benefits were frozen in August 2013. The Canadian plan is registered under the Ontario Pension Benefits Act, RSO 1990 and the Income Tax Act. The U.S. plan is subject to the provisions of the Employee Retirement Income Security Act of 1974 (ERISA). Both plans are legally separate from the Company and are monitored by a pension committee. The pension committee is responsible for policy setting. The pension plans expose the Company to actuarial risk, currency risk, credit risk, interest rate risk and market risk.
13. Provisions
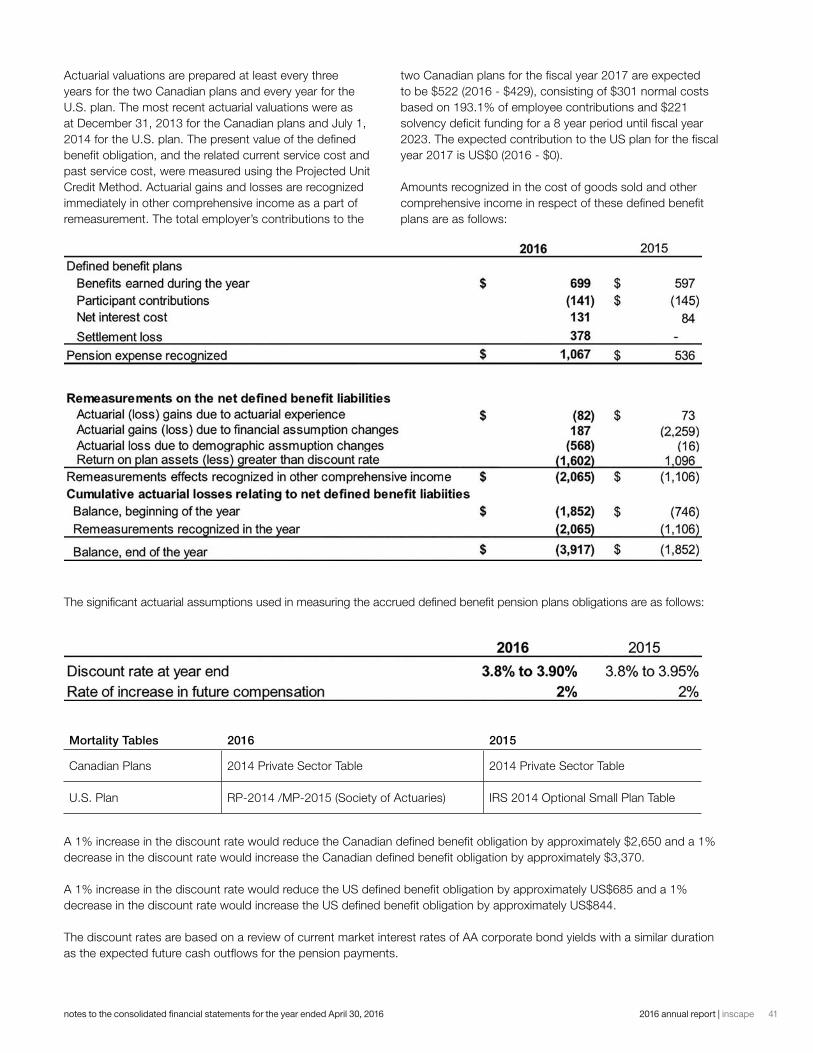
412016 annual report | inscape notes to the consolidated financial statements for the year ended April 30, 2016
Actuarial valuations are prepared at least every three years for the two Canadian plans and every year for the U.S. plan. The most recent actuarial valuations were as at December 31, 2013 for the Canadian plans and July 1, 2014 for the U.S. plan. The present value of the defined benefit obligation, and the related current service cost and past service cost, were measured using the Projected Unit Credit Method. Actuarial gains and losses are recognized immediately in other comprehensive income as a part of remeasurement. The total employer’s contributions to the
two Canadian plans for the fiscal year 2017 are expected to be $522 (2016 - $429), consisting of $301 normal costs based on 193.1% of employee contributions and $221 solvency deficit funding for a 8 year period until fiscal year 2023. The expected contribution to the US plan for the fiscal year 2017 is US$0 (2016 - $0).
Amounts recognized in the cost of goods sold and other comprehensive income in respect of these defined benefit plans are as follows:
The significant actuarial assumptions used in measuring the accrued defined benefit pension plans obligations are as follows:
Mortality Tables 2016 2015
Canadian Plans 2014 Private Sector Table 2014 Private Sector Table
U.S. Plan RP-2014 /MP-2015 (Society of Actuaries) IRS 2014 Optional Small Plan Table
A 1% increase in the discount rate would reduce the Canadian defined benefit obligation by approximately $2,650 and a 1% decrease in the discount rate would increase the Canadian defined benefit obligation by approximately $3,370.
A 1% increase in the discount rate would reduce the US defined benefit obligation by approximately US$685 and a 1% decrease in the discount rate would increase the US defined benefit obligation by approximately US$844.
The discount rates are based on a review of current market interest rates of AA corporate bond yields with a similar duration as the expected future cash outflows for the pension payments.
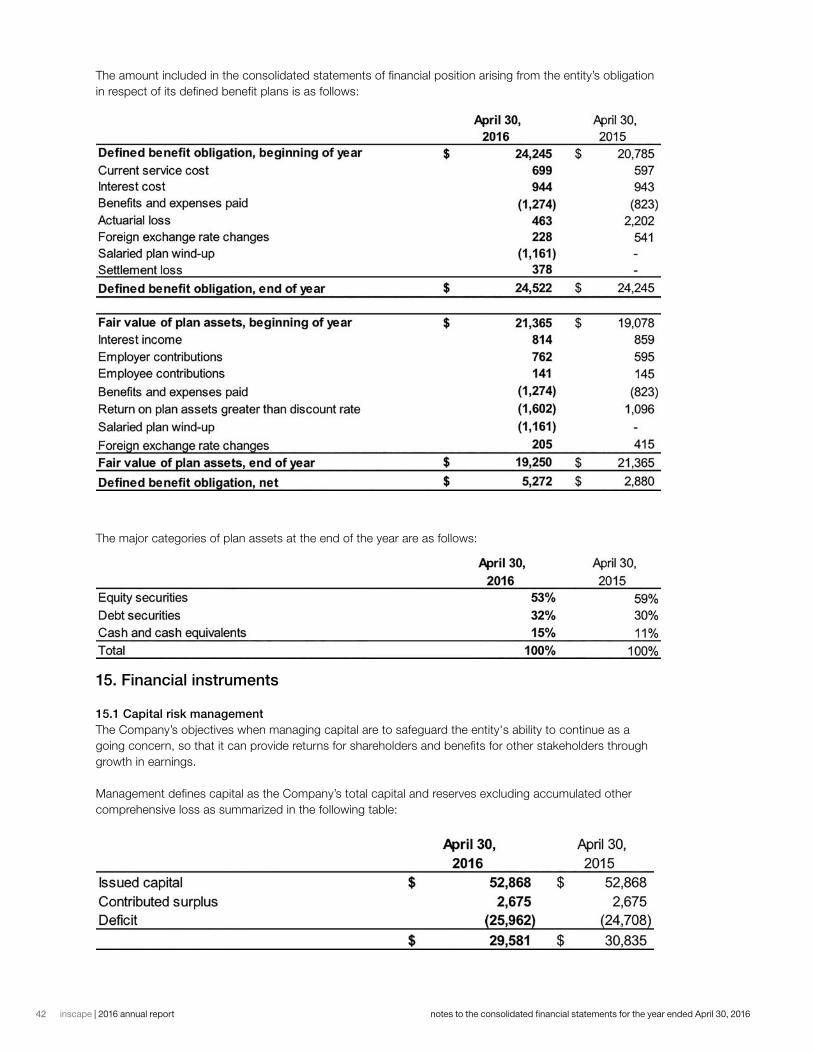
42 inscape | 2016 annual report notes to the consolidated financial statements for the year ended April 30, 2016
The amount included in the consolidated statements of financial position arising from the entity’s obligation in respect of its defined benefit plans is as follows:
The major categories of plan assets at the end of the year are as follows:
15. Financial instruments
15.1 Capital risk managementThe Company’s objectives when managing capital are to safeguard the entity's ability to continue as a going concern, so that it can provide returns for shareholders and benefits for other stakeholders through growth in earnings.
Management defines capital as the Company’s total capital and reserves excluding accumulated other comprehensive loss as summarized in the following table:
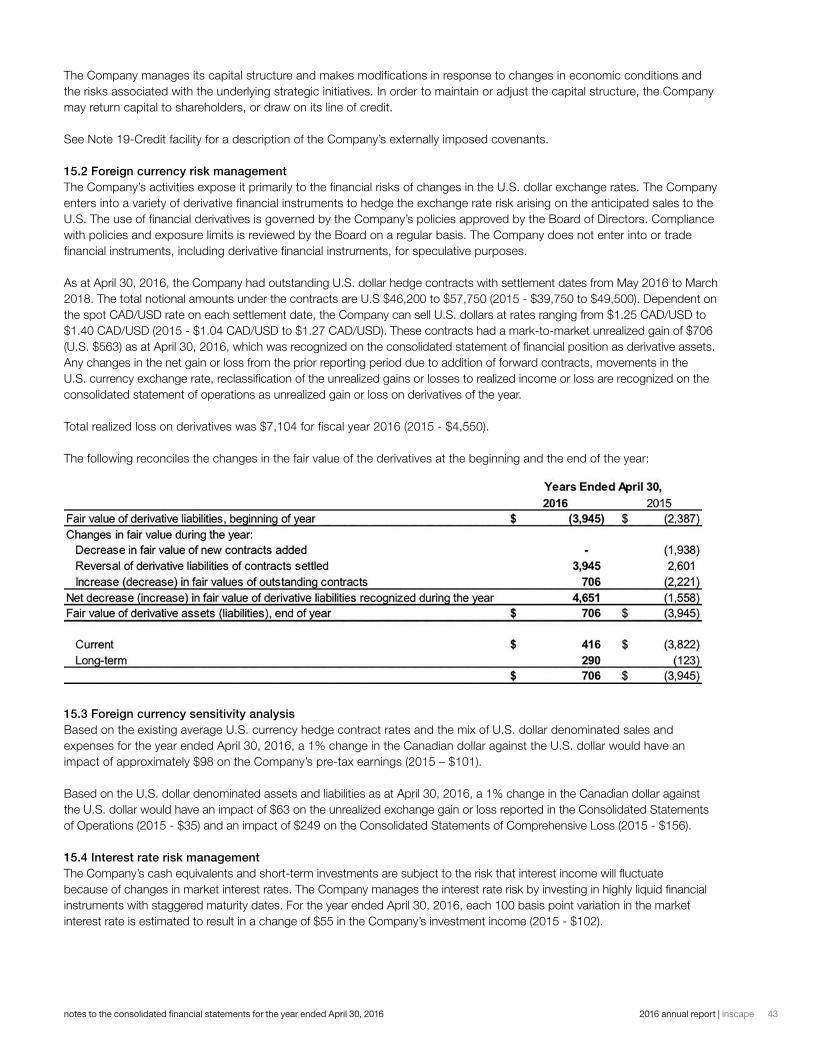
432016 annual report | inscape notes to the consolidated financial statements for the year ended April 30, 2016
The Company manages its capital structure and makes modifications in response to changes in economic conditions and the risks associated with the underlying strategic initiatives. In order to maintain or adjust the capital structure, the Company may return capital to shareholders, or draw on its line of credit.
See Note 19-Credit facility for a description of the Company’s externally imposed covenants.
15.2 Foreign currency risk managementThe Company’s activities expose it primarily to the financial risks of changes in the U.S. dollar exchange rates. The Company enters into a variety of derivative financial instruments to hedge the exchange rate risk arising on the anticipated sales to the U.S. The use of financial derivatives is governed by the Company’s policies approved by the Board of Directors. Compliance with policies and exposure limits is reviewed by the Board on a regular basis. The Company does not enter into or trade financial instruments, including derivative financial instruments, for speculative purposes.
As at April 30, 2016, the Company had outstanding U.S. dollar hedge contracts with settlement dates from May 2016 to March 2018. The total notional amounts under the contracts are U.S $46,200 to $57,750 (2015 - $39,750 to $49,500). Dependent on the spot CAD/USD rate on each settlement date, the Company can sell U.S. dollars at rates ranging from $1.25 CAD/USD to $1.40 CAD/USD (2015 - $1.04 CAD/USD to $1.27 CAD/USD). These contracts had a mark-to-market unrealized gain of $706 (U.S. $563) as at April 30, 2016, which was recognized on the consolidated statement of financial position as derivative assets. Any changes in the net gain or loss from the prior reporting period due to addition of forward contracts, movements in the U.S. currency exchange rate, reclassification of the unrealized gains or losses to realized income or loss are recognized on the consolidated statement of operations as unrealized gain or loss on derivatives of the year.
Total realized loss on derivatives was $7,104 for fiscal year 2016 (2015 - $4,550).
The following reconciles the changes in the fair value of the derivatives at the beginning and the end of the year:
15.3 Foreign currency sensitivity analysisBased on the existing average U.S. currency hedge contract rates and the mix of U.S. dollar denominated sales and expenses for the year ended April 30, 2016, a 1% change in the Canadian dollar against the U.S. dollar would have an impact of approximately $98 on the Company’s pre-tax earnings (2015 – $101).
Based on the U.S. dollar denominated assets and liabilities as at April 30, 2016, a 1% change in the Canadian dollar against the U.S. dollar would have an impact of $63 on the unrealized exchange gain or loss reported in the Consolidated Statements of Operations (2015 - $35) and an impact of $249 on the Consolidated Statements of Comprehensive Loss (2015 - $156).
15.4 Interest rate risk managementThe Company’s cash equivalents and short-term investments are subject to the risk that interest income will fluctuate because of changes in market interest rates. The Company manages the interest rate risk by investing in highly liquid financial instruments with staggered maturity dates. For the year ended April 30, 2016, each 100 basis point variation in the market interest rate is estimated to result in a change of $55 in the Company’s investment income (2015 - $102).
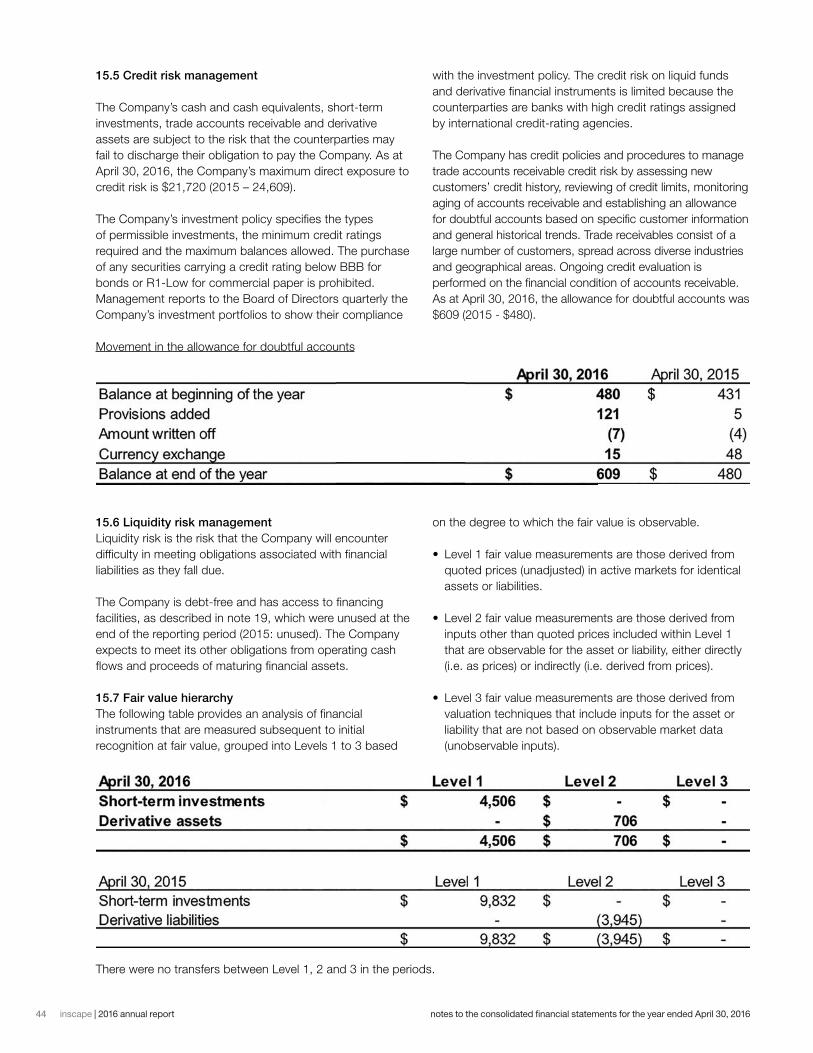
44 inscape | 2016 annual report notes to the consolidated financial statements for the year ended April 30, 2016
15.5 Credit risk management
The Company’s cash and cash equivalents, short-term investments, trade accounts receivable and derivative assets are subject to the risk that the counterparties may fail to discharge their obligation to pay the Company. As at April 30, 2016, the Company’s maximum direct exposure to credit risk is $21,720 (2015 – 24,609).
The Company’s investment policy specifies the types of permissible investments, the minimum credit ratings required and the maximum balances allowed. The purchase of any securities carrying a credit rating below BBB for bonds or R1-Low for commercial paper is prohibited. Management reports to the Board of Directors quarterly the Company’s investment portfolios to show their compliance
with the investment policy. The credit risk on liquid funds and derivative financial instruments is limited because the counterparties are banks with high credit ratings assigned by international credit-rating agencies.
The Company has credit policies and procedures to manage trade accounts receivable credit risk by assessing new customers’ credit history, reviewing of credit limits, monitoring aging of accounts receivable and establishing an allowance for doubtful accounts based on specific customer information and general historical trends. Trade receivables consist of a large number of customers, spread across diverse industries and geographical areas. Ongoing credit evaluation is performed on the financial condition of accounts receivable. As at April 30, 2016, the allowance for doubtful accounts was $609 (2015 - $480).
15.6 Liquidity risk managementLiquidity risk is the risk that the Company will encounter difficulty in meeting obligations associated with financial liabilities as they fall due.
The Company is debt-free and has access to financing facilities, as described in note 19, which were unused at the end of the reporting period (2015: unused). The Company expects to meet its other obligations from operating cash flows and proceeds of maturing financial assets.
15.7 Fair value hierarchyThe following table provides an analysis of financial instruments that are measured subsequent to initial recognition at fair value, grouped into Levels 1 to 3 based
on the degree to which the fair value is observable.
• Level 1 fair value measurements are those derived from quoted prices (unadjusted) in active markets for identical assets or liabilities.
• Level 2 fair value measurements are those derived from inputs other than quoted prices included within Level 1 that are observable for the asset or liability, either directly (i.e. as prices) or indirectly (i.e. derived from prices).
• Level 3 fair value measurements are those derived from valuation techniques that include inputs for the asset or liability that are not based on observable market data (unobservable inputs).
Movement in the allowance for doubtful accounts
There were no transfers between Level 1, 2 and 3 in the periods.
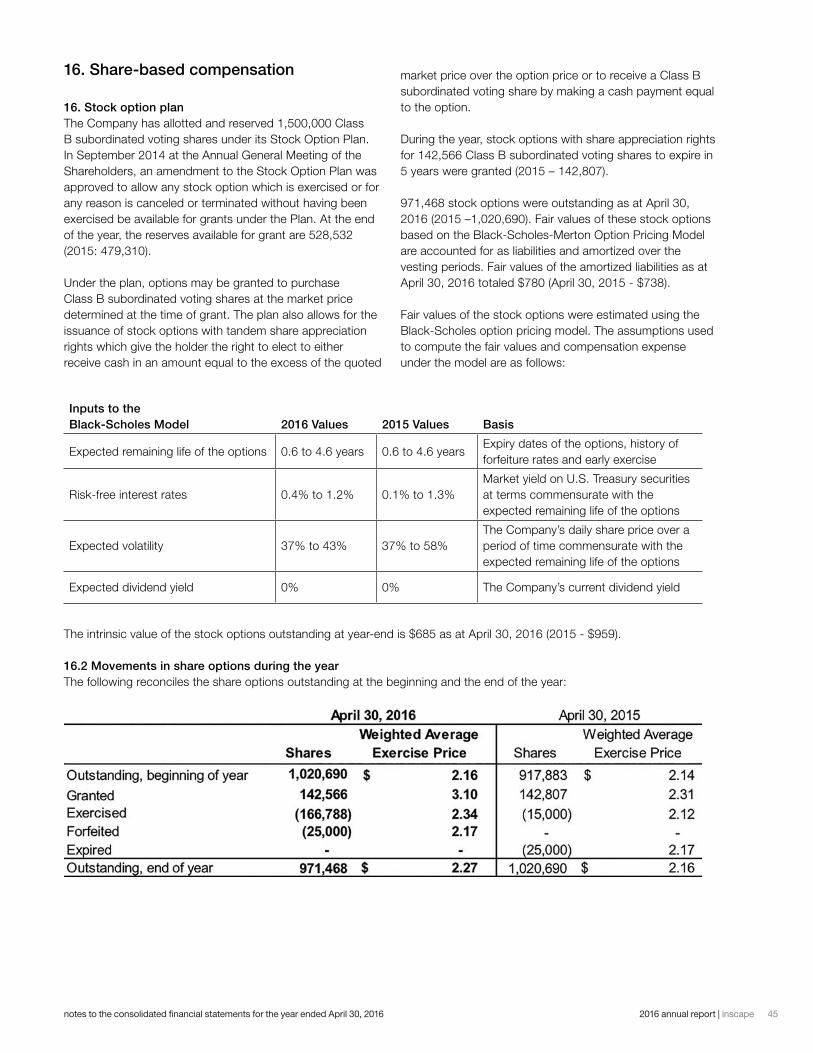
452016 annual report | inscape notes to the consolidated financial statements for the year ended April 30, 2016
16. Share-based compensation
16. Stock option plan The Company has allotted and reserved 1,500,000 Class B subordinated voting shares under its Stock Option Plan. In September 2014 at the Annual General Meeting of the Shareholders, an amendment to the Stock Option Plan was approved to allow any stock option which is exercised or for any reason is canceled or terminated without having been exercised be available for grants under the Plan. At the end of the year, the reserves available for grant are 528,532 (2015: 479,310).
Under the plan, options may be granted to purchase Class B subordinated voting shares at the market price determined at the time of grant. The plan also allows for the issuance of stock options with tandem share appreciation rights which give the holder the right to elect to either receive cash in an amount equal to the excess of the quoted
market price over the option price or to receive a Class B subordinated voting share by making a cash payment equal to the option.
During the year, stock options with share appreciation rights for 142,566 Class B subordinated voting shares to expire in 5 years were granted (2015 – 142,807).
971,468 stock options were outstanding as at April 30, 2016 (2015 –1,020,690). Fair values of these stock options based on the Black-Scholes-Merton Option Pricing Model are accounted for as liabilities and amortized over the vesting periods. Fair values of the amortized liabilities as at April 30, 2016 totaled $780 (April 30, 2015 - $738).
Fair values of the stock options were estimated using the Black-Scholes option pricing model. The assumptions used to compute the fair values and compensation expense under the model are as follows:
Inputs to the Black-Scholes Model 2016 Values 2015 Values Basis
Expected remaining life of the options 0.6 to 4.6 years 0.6 to 4.6 yearsExpiry dates of the options, history of forfeiture rates and early exercise
Risk-free interest rates 0.4% to 1.2% 0.1% to 1.3%Market yield on U.S. Treasury securities at terms commensurate with the expected remaining life of the options
Expected volatility 37% to 43% 37% to 58%The Company’s daily share price over a period of time commensurate with the expected remaining life of the options
Expected dividend yield 0% 0% The Company’s current dividend yield
The intrinsic value of the stock options outstanding at year-end is $685 as at April 30, 2016 (2015 - $959).
16.2 Movements in share options during the yearThe following reconciles the share options outstanding at the beginning and the end of the year:
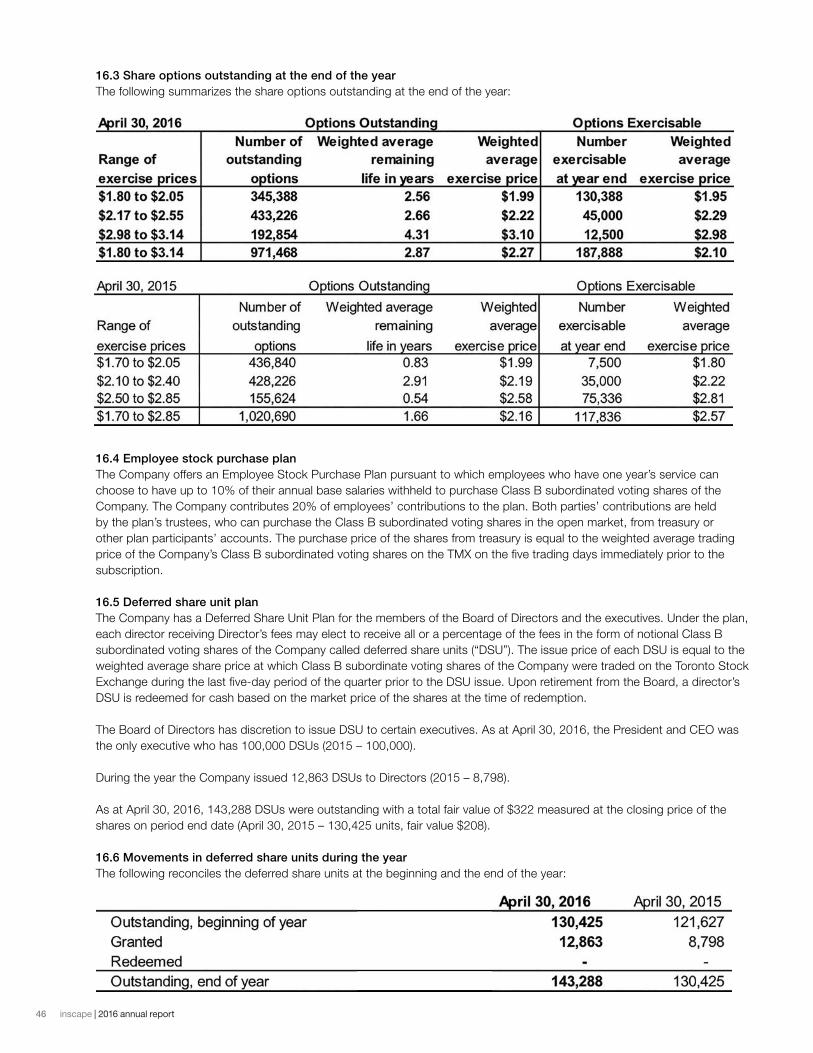
46 inscape | 2016 annual report
16.3 Share options outstanding at the end of the year The following summarizes the share options outstanding at the end of the year:
16.4 Employee stock purchase planThe Company offers an Employee Stock Purchase Plan pursuant to which employees who have one year’s service can choose to have up to 10% of their annual base salaries withheld to purchase Class B subordinated voting shares of the Company. The Company contributes 20% of employees’ contributions to the plan. Both parties’ contributions are held by the plan’s trustees, who can purchase the Class B subordinated voting shares in the open market, from treasury or other plan participants’ accounts. The purchase price of the shares from treasury is equal to the weighted average trading price of the Company’s Class B subordinated voting shares on the TMX on the five trading days immediately prior to the subscription.
16.5 Deferred share unit planThe Company has a Deferred Share Unit Plan for the members of the Board of Directors and the executives. Under the plan, each director receiving Director’s fees may elect to receive all or a percentage of the fees in the form of notional Class B subordinated voting shares of the Company called deferred share units (“DSU”). The issue price of each DSU is equal to the weighted average share price at which Class B subordinate voting shares of the Company were traded on the Toronto Stock Exchange during the last five-day period of the quarter prior to the DSU issue. Upon retirement from the Board, a director’s DSU is redeemed for cash based on the market price of the shares at the time of redemption.
The Board of Directors has discretion to issue DSU to certain executives. As at April 30, 2016, the President and CEO was the only executive who has 100,000 DSUs (2015 – 100,000).
During the year the Company issued 12,863 DSUs to Directors (2015 – 8,798).
As at April 30, 2016, 143,288 DSUs were outstanding with a total fair value of $322 measured at the closing price of the shares on period end date (April 30, 2015 – 130,425 units, fair value $208).
16.6 Movements in deferred share units during the yearThe following reconciles the deferred share units at the beginning and the end of the year:
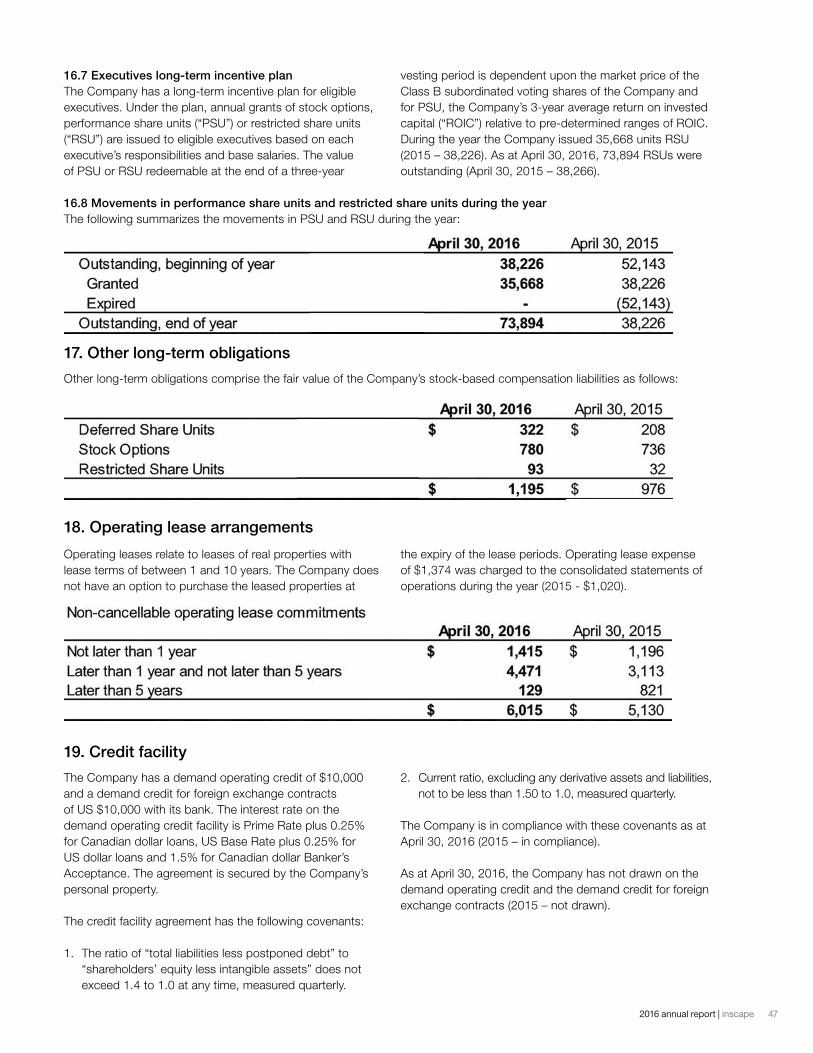
472016 annual report | inscape
16.7 Executives long-term incentive plan The Company has a long-term incentive plan for eligible executives. Under the plan, annual grants of stock options, performance share units (“PSU”) or restricted share units (“RSU”) are issued to eligible executives based on each executive’s responsibilities and base salaries. The value of PSU or RSU redeemable at the end of a three-year
vesting period is dependent upon the market price of the Class B subordinated voting shares of the Company and for PSU, the Company’s 3-year average return on invested capital (“ROIC”) relative to pre-determined ranges of ROIC. During the year the Company issued 35,668 units RSU (2015 – 38,226). As at April 30, 2016, 73,894 RSUs were outstanding (April 30, 2015 – 38,266).
16.8 Movements in performance share units and restricted share units during the yearThe following summarizes the movements in PSU and RSU during the year:
17. Other long-term obligations
Other long-term obligations comprise the fair value of the Company’s stock-based compensation liabilities as follows:
18. Operating lease arrangements
Operating leases relate to leases of real properties with lease terms of between 1 and 10 years. The Company does not have an option to purchase the leased properties at
the expiry of the lease periods. Operating lease expense of $1,374 was charged to the consolidated statements of operations during the year (2015 - $1,020).
19. Credit facility
The Company has a demand operating credit of $10,000 and a demand credit for foreign exchange contracts of US $10,000 with its bank. The interest rate on the demand operating credit facility is Prime Rate plus 0.25% for Canadian dollar loans, US Base Rate plus 0.25% for US dollar loans and 1.5% for Canadian dollar Banker’s Acceptance. The agreement is secured by the Company’s personal property.
The credit facility agreement has the following covenants:
1. The ratio of “total liabilities less postponed debt” to “shareholders’ equity less intangible assets” does not exceed 1.4 to 1.0 at any time, measured quarterly.
2. Current ratio, excluding any derivative assets and liabilities, not to be less than 1.50 to 1.0, measured quarterly.
The Company is in compliance with these covenants as at April 30, 2016 (2015 – in compliance).
As at April 30, 2016, the Company has not drawn on the demand operating credit and the demand credit for foreign exchange contracts (2015 – not drawn).
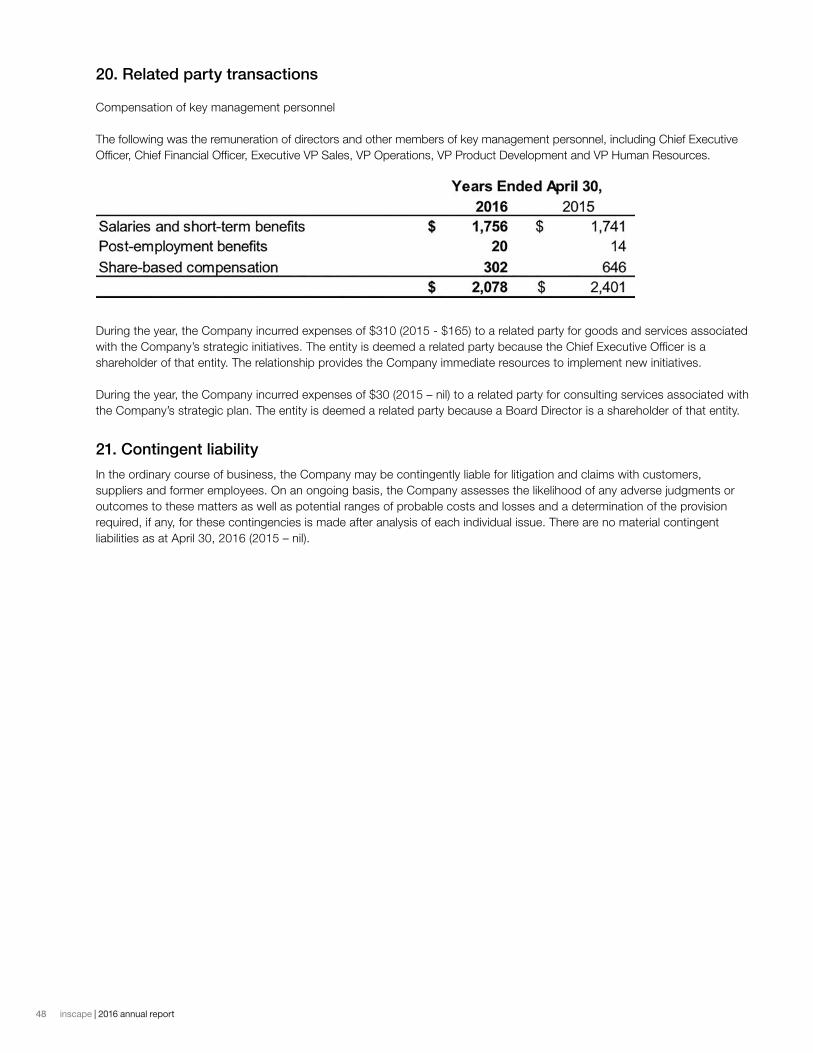
48 inscape | 2016 annual report
20. Related party transactions
Compensation of key management personnel
The following was the remuneration of directors and other members of key management personnel, including Chief Executive Officer, Chief Financial Officer, Executive VP Sales, VP Operations, VP Product Development and VP Human Resources.
During the year, the Company incurred expenses of $310 (2015 - $165) to a related party for goods and services associated with the Company’s strategic initiatives. The entity is deemed a related party because the Chief Executive Officer is a shareholder of that entity. The relationship provides the Company immediate resources to implement new initiatives.
During the year, the Company incurred expenses of $30 (2015 – nil) to a related party for consulting services associated with the Company’s strategic plan. The entity is deemed a related party because a Board Director is a shareholder of that entity.
21. Contingent liability
In the ordinary course of business, the Company may be contingently liable for litigation and claims with customers, suppliers and former employees. On an ongoing basis, the Company assesses the likelihood of any adverse judgments or outcomes to these matters as well as potential ranges of probable costs and losses and a determination of the provision required, if any, for these contingencies is made after analysis of each individual issue. There are no material contingent liabilities as at April 30, 2016 (2015 – nil).
492016 annual report | inscape
corporate information Board of Directors
Madan Bhayana Chair of the Board
Brian A. Mirsky Lead Director
Samir Bhayana Director
Bartley Bull Director
Frank Delfino Director
Eric Ehgoetz Director
Dezsö J. Horváth Director
Jim Stelter Director and Chief Executive Officer
Chief Executive Officer
Jim Stelter
Listing of Capital Stock
Toronto Stock Exchange (INQ)
Transfer Agent and Registrar
CST Trust Company P.O. Box 700, Station B Montreal, QC H3B 3K3 T 416 682 3860 or 800 387 0825 F 888 249 6189 canstockta.com
Auditor
Deloitte LLP Toronto, Ontario
Corporate Office
67 Toll Road Holland Landing, ON L9N 1H2
T 905 836 7676
inscapesolutions.com
Financial Calendar
May 1 to April 30
2016 Annual Meeting
The annual and special meeting of shareholders will be held on September 8, 2016 at 4:00 pm at Inscape’s Corporate Office, 67 Toll Road, Holland Landing, Ontario, L9N 1H2.
Investor Information
Shareholders seeking assistance or information about the Company are invited to contact Michelle Allard, Director, Marketing Communications, at:
67 Toll Road, Holland Landing, ON L9N 1H2
T 905 836 7676
[email protected] inscapesolutions.com

67 Toll Road Holland Landing, Ontario L9N 1H2 Canada
T 905 836 7676 F 905 836 6000
inscapesolutions.com
© Inscape Corporation 2016TM ® trademarks of Inscape Corporation. Patents may be pending. Certain names, words, logos and graphics or designs contained herein are trademarks or service marks of Inscape Corporation.