2016 ce snapshot electronic | nola.gov
TRANSCRIPT

OFFICE OF CULTURAL ECONOMY, CITY OF NEW ORLEANS, MITCHELL J. LANDRIEU, MAYOR
2016 NEW ORLEANS CULTURAL
ECONOMY SNAPSHOT
2
May 2017
Dear Friends and Colleagues:
I am pleased to present the latest and final New Orleans Cultural Economy Snapshot, the seventh edition of the groundbreaking report created at the beginning of my term as Mayor in 2010. My Administration has offered this unique, comprehensive annual review of our city’s cultural economy not only to document the real contributions of the creative community to our economy, but also to provide them with the information they need to get funding, create programming, start a business, and much more. This report outlines the cultural business and non-profit landscape of New Orleans extensively to achieve that goal.
The cultural economy is more important than ever. The cultural sector has 38,000 jobs, an increase of 59% since 2005. Many of these jobs come from the 1,718 cultural businesses that were counted in 2016, but there are also many cultural jobs in non-cultural industries such as education. The cultural economy has created employment for a creative workforce that is both native to the city and made up of highly skilled newcomers.
Fifty feature film and television tax credit projects spent $439 million in the city in 2016. Musicians in the city played 31,000 gigs in 2016 at clubs, theatres, or at many of the city’s 136 annual festivals. Over 3 million attended our diverse national and local events last year, contributing to an economic impact of $904 million. While the economics are impressive, the cultural economy is more than just dollars, it is a cultural engine creating quality of life in the city, its unique sights, melodies, and flavors that our residents produce.
I invite you to utilize this report so that we can maximize this impact and spread the word of the strength of our city’s diverse cultural economy. Thank you to all who contribute data to this report, and to all of our cultural producers that make this report possible.
Sincerely,
Mitchell J. Landrieu, Mayor
3
CULTURAL ECONOMY STAFF
Scott Hutcheson, Senior Advisor to the Mayor for Cultural Economy Roland “Sonny” Borey, Special Projects, Protocol Coordinator Alison Gavrell, Project Manager Asante Salaam, Outreach Manager Carroll Morton, Manager, Entertainment Industry Development Katherine Williams, Director, Film New Orleans Jennifer Kessler, Film & Special Event Coordinator
ACKNOWLEDGEMENTS
The Mayor’s Office of Cultural Economy wishes to thank all of the cultural businesses and workers in New Orleans that make this city a prominent example of how the cultural economy is an economic engine in today’s world. Mt. Auburn Associates, Inc. in particular has, through its contributions to economic data and cogent analysis of employment, wages and non-profit financials in the cultural economy in New Orleans, allowed this survey to continue to break ground in cultural economy quantification. Beth Siegel of Mt. Auburn has been instrumental in the creation of this report through her guidance to source material and potential data sources. Thank you also to the Bureau of Revenue and the City’s Geographical Information Systems; both were integral to completing this report. We would also like to thank all of our survey respondents without whom this report would not be possible.

4
TABLE OF CONTENTS
Executive Summary 5 Economic Contributions of the Cultural Economy Employment 6 Businesses 15 Earnings and Wages 20
Non-profits 22
Segment Feature: Entertainment
Film and Video 25
Music 29 Festivals and Events 33 Cultural Career Paths Survey 40 Methodology and Sources 44 Statistical information contained in this document has been obtained from sources believed to be reliable but such accuracy cannot be guaranteed. Any opinions expressed herein are subject to change without notice.
5
EXECUTIVE SUMMARY
We are proud to present the 7th New Orleans Cultural Economy Snapshot, an attempt at fully quantifying the cultural economy in New Orleans. This Snapshot is a tool to better understand the size, composition, and value of the cultural economy to the City of New Orleans, and we hope that it can be used by government, cultural producers, businesses, and non-profits to further opportunities to grow this industry and to continue to look towards our city’s future. This report affirms the centrality of indigenous arts and culture in the creation of our City’s organic fabric of neighborhoods and communities, as well as our economy. The cultural economy is vital to New Orleans:
New Orleans’ cultural industries accounted for 37,793 jobs in 2016.
Between 2005 and 2016, the total number of jobs in the cultural industries increased by 59%.
The cultural sector is a larger source of employment than the city’s private healthcare and social assistance sector, its private education sector, and its retail sector.
This report counted 1,718 cultural businesses in New Orleans in 2016. The most common cultural businesses are restaurants and specialty food stores (869), art galleries (141), and live music venues (136).
Since 2002, there has been a growth of $460 million in total earnings in the cultural industries, a growth of 35%. On average, annual earnings have increased by about $6,000 since 2002.
The city hosted 50 total feature film and television tax credit projects in 2016.
Local expenditure of film projects is estimated at $439 million for the New Orleans Region.
New Orleans’ 136 live entertainment venues hosted 31,127 live entertainment music gigs in 2016.
The local festival scene is thriving, with 136 festivals attended by an estimated 3 million people in 2016 and with an economic impact of $904 million.
6
ECONOMIC CONTRIBUTIONS OF THE CULTURAL ECONOMY
CULTURAL JOBS IN CULTURAL BUSINESSES1
DEFINING THE CULTURAL ECONOMY
Cultural Economy is defined as the people, enterprises, and communities that transform cultural skills, knowledge and ideas into economically productive goods, services and places. The definition of the cultural economy used for this report is consistent with the previous updates, and is based upon the 2005 report Louisiana: Where Culture Means Business. That report grouped the state’s cultural economy into six key segments:
Culinary Arts: Food-related cultural products including food processing, specialty food products and locally-owned, full service restaurants (does not include franchise/non-local chain restaurants);
Design: Individual designers and firms involved in the communication arts such as graphic design, printing, and advertising;
Entertainment: The performing arts (music, theater, and dance), individual performers, and the film industries;
Literary Arts and Humanities: Individual writers and editors and book, periodical, and newspaper publishing;
Preservation: Economic activities focused on the restoration and redevelopment of the built environment including architecture, landscape architecture and a percentage of construction activity focused on preservation and renovation; and
Visual Arts and Crafts: Individual artists and craftspeople as well as the galleries and museums that present cultural products.
CULTURAL INDUSTRY TRENDS
In 2016, the cultural industries in New Orleans were responsible for about 37,800 jobs and for 14% of total employment.2 Analysis of total jobs associated with the cultural industries, which includes both wage and salary jobs as well as creative freelancers and self-employed individuals, provides continuing evidence of the critical importance of this sector to the New Orleans economy. Just looking at the direct
1 This entire chapter was researched by Mt. Auburn Associates, commissioned by the Mayor’s Office of Cultural Economy. The format, figures, and text have been edited to suit the purposes of this report and conform to the format of the publication.
2 All of the statistics and figures in this update are based on data from EMSI’s 4th Quarter 2016 release. EMSI is a proprietary database that curates dozens of federal data sources. The Methodology attached to this report provides more information about the data. It is important to note that the most recent year data in each of the annual updates are based largely upon estimates by EMSI. The data are then revised and corrected by EMSI when new data are provided. The result is that there is less confidence in the precision of the more recent years of data, and this year’s data are not necessarily comparable to data released in 2015.
7
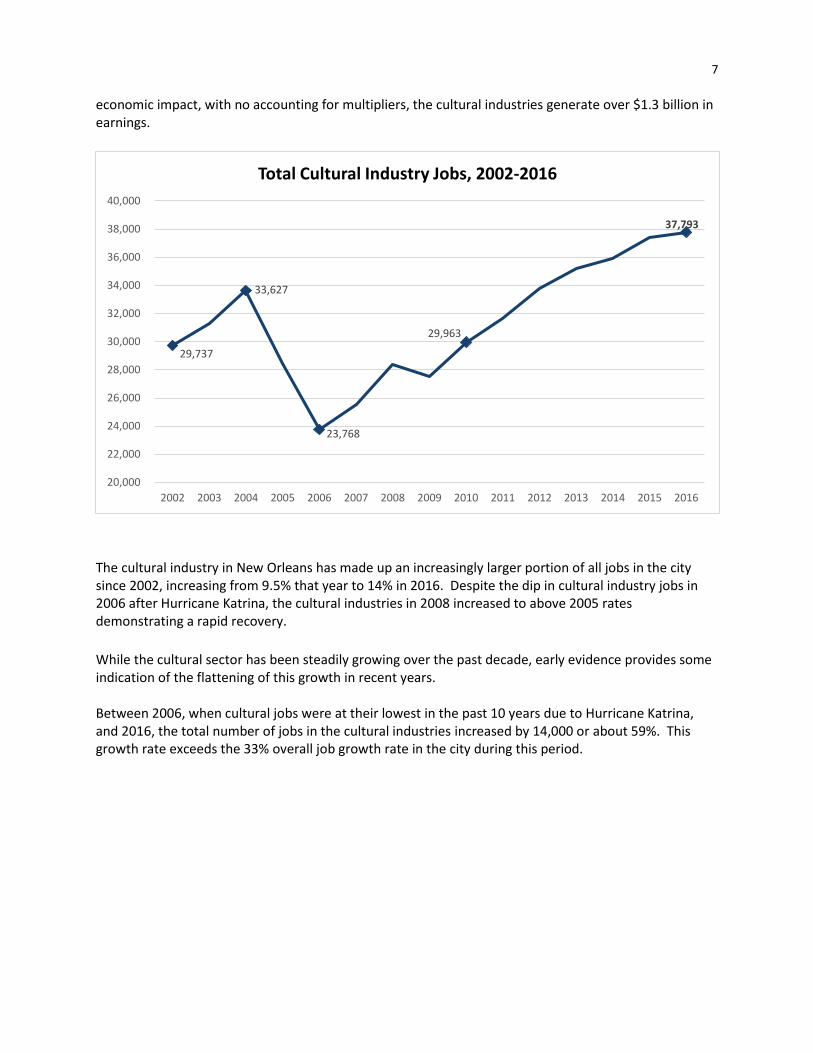
economic impact, with no accounting for multipliers, the cultural industries generate over $1.3 billion in earnings.
The cultural industry in New Orleans has made up an increasingly larger portion of all jobs in the city since 2002, increasing from 9.5% that year to 14% in 2016. Despite the dip in cultural industry jobs in 2006 after Hurricane Katrina, the cultural industries in 2008 increased to above 2005 rates demonstrating a rapid recovery.
While the cultural sector has been steadily growing over the past decade, early evidence provides some indication of the flattening of this growth in recent years. Between 2006, when cultural jobs were at their lowest in the past 10 years due to Hurricane Katrina, and 2016, the total number of jobs in the cultural industries increased by 14,000 or about 59%. This growth rate exceeds the 33% overall job growth rate in the city during this period.
29,737
33,627
23,768
29,963
37,793
20,000
22,000
24,000
26,000
28,000
30,000
32,000
34,000
36,000
38,000
40,000
2002 2003 2004 2005 2006 2007 2008 2009 2010 2011 2012 2013 2014 2015 2016
Total Cultural Industry Jobs, 2002-2016

8
Since 2009, the average annual growth of the cultural industry has varied. The most recent estimates for 2016, while still only estimates, show a lower annual growth rate than in the past, only about 1%. New Orleans’ cultural industries had a higher overall rate of job growth between 2002 and 2016 than the cultural industries at the state or national levels.
9.4%
10.6%
12.1%
14.0%
8.0%
9.0%
10.0%
11.0%
12.0%
13.0%
14.0%
15.0%
2002 2003 2004 2005 2006 2007 2008 2009 2010 2011 2012 2013 2014 2015 2016
Jobs in Cultural Industries as a Share of all Jobs in New Orleans
100%
110%
120%
130%
140%
150%
160%
2006 2007 2008 2009 2010 2011 2012 2013 2014 2015 2016
Per
cen
t o
f 2
00
6 E
mp
loym
ent
Growth of Cultural Industry Employment Since Katrina
GROWTH SINCE KATRINA CULTURAL GROWTH SINCE KATRINA ALL INDUSTRIES

9
Job growth over time in the “core cultural industries”3 in New Orleans has exceeded the level of growth in the same set of industries in Louisiana and the United States as a whole. Generally speaking, the smaller the locality, the larger the peaks and valleys are due to regression to the mean. With this in mind, outside of the Katrina and national recession years, employment in cultural industries in New Orleans has increased more rapidly than cultural industry employment in either the state of Louisiana or the nation as a whole. As the following exhibit shows, the cultural industries grew at a rapid rate in New Orleans between 2002 and 2004, but then declined at an even more rapid rate over the next two years, opening up a large gap between the city’s cultural sector job growth rate (measured from 2002) and the state and national rates.
After 2006, however, the city’s core cultural sector began to grow quickly once again, and by 2011 it had closed the gap. While 2015 recorded high rates of growth, preliminary data show that in 2016 both New Orleans and Louisiana’s core cultural industry growth slowed. In 2016, the core cultural industries lost about 300 jobs, and the state’s core cultural industries only grew by 2%, a decrease from the last year’s increase of 3%.
3 Core cultural industries is a set of industries that this update uses whenever New Orleans is being compared with a different geography. It includes all the industries in the New Orleans cultural economy definition except for those that would make comparison problematic: all the industries in the Culinary segment, the architectural preservation/rehabilitation industries in the Preservation segment, and bars in the Entertainment segment. Jobs in these industries were all included in the New Orleans data definition because of specific connections to New Orleans culture and, in many cases, only a certain proportion of the jobs in the industry code was included. (See Methodology section for more detail.) These proportions were estimates based on research on New Orleans businesses, and the proportion of jobs that are cultural in these industries in the U.S. would almost certainly be smaller.
85%
90%
95%
100%
105%
110%
115%
120%
125%
130%
135%
2002 2003 2004 2005 2006 2007 2008 2009 2010 2011 2012 2013 2014 2015 2016
Core Cultural Industries Employment Growth, 2002-2016
New Orleans
Louisiana
United States

10
When expressed as a percentage of total employment, core cultural industries in New Orleans remain strong during Katrina and thereafter, experiencing the most dramatic increase between 2002 and 2006. In 2002, the core cultural industries in New Orleans and in the nation at large represented a similar share at around 4% of all employment. However, since then, the core cultural industries have increased their share of employment in New Orleans, while the nationwide share has remained relatively constant. In the last year, preliminary data indicate a slight dip in core cultural industries employment as share of total employment in New Orleans, decreasing from 7% in 2015 to 6% in 2016. Nationally, the core cultural industries remain constant at around 3%.
Compared to other U.S. cities with significant cultural industries, New Orleans’ core cultural industry employment as a percentage of total employment is increasing rapidly. Core cultural jobs in New Orleans were compared to a set of cities that are comparable in size or that are well known as centers of cultural employment.4 In 2002, the core cultural industries in New Orleans were of less relative importance in the city’s general economy in comparison to these cities. However, in more recent years, the city has exceeded other comparable cities in the relative importance of the core cultural industries.
4 Data for each of the cities were based upon the county in which the city was located. In the case of New York City, the five counties that comprise New York City were combined.
0%
1%
2%
3%
4%
5%
6%
7%
2002 2003 2004 2005 2006 2007 2008 2009 2010 2011 2012 2013 2014 2015 2016
Employment in Core Cultural Industries as Share of Total Employment, 2002-2016
New Orleans
United States
Louisiana
11
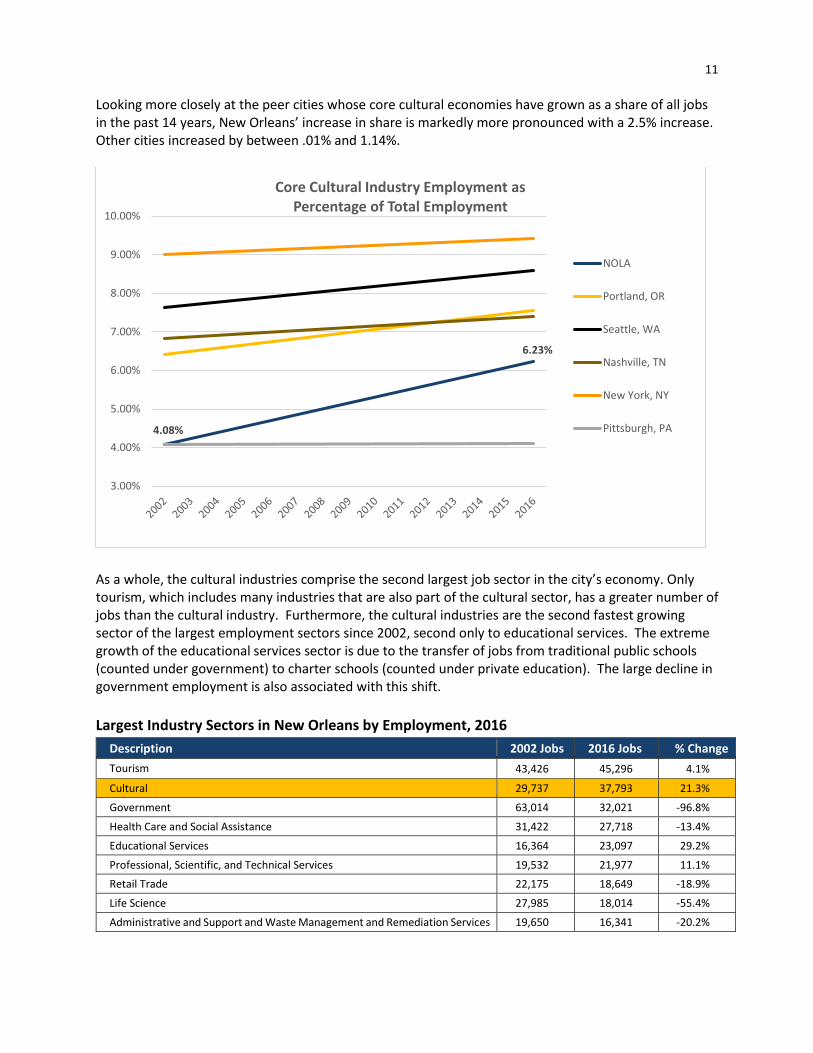
Looking more closely at the peer cities whose core cultural economies have grown as a share of all jobs in the past 14 years, New Orleans’ increase in share is markedly more pronounced with a 2.5% increase. Other cities increased by between .01% and 1.14%.
As a whole, the cultural industries comprise the second largest job sector in the city’s economy. Only tourism, which includes many industries that are also part of the cultural sector, has a greater number of jobs than the cultural industry. Furthermore, the cultural industries are the second fastest growing sector of the largest employment sectors since 2002, second only to educational services. The extreme growth of the educational services sector is due to the transfer of jobs from traditional public schools (counted under government) to charter schools (counted under private education). The large decline in government employment is also associated with this shift.
Largest Industry Sectors in New Orleans by Employment, 2016
Description 2002 Jobs 2016 Jobs % Change
Tourism 43,426 45,296 4.1%
Cultural 29,737 37,793 21.3%
Government 63,014 32,021 -96.8%
Health Care and Social Assistance 31,422 27,718 -13.4%
Educational Services 16,364 23,097 29.2%
Professional, Scientific, and Technical Services 19,532 21,977 11.1%
Retail Trade 22,175 18,649 -18.9%
Life Science 27,985 18,014 -55.4%
Administrative and Support and Waste Management and Remediation Services 19,650 16,341 -20.2%
4.08%
6.23%
3.00%
4.00%
5.00%
6.00%
7.00%
8.00%
9.00%
10.00%
Core Cultural Industry Employment as Percentage of Total Employment
NOLA
Portland, OR
Seattle, WA
Nashville, TN
New York, NY
Pittsburgh, PA
12
THE CULTURAL SEGMENTS
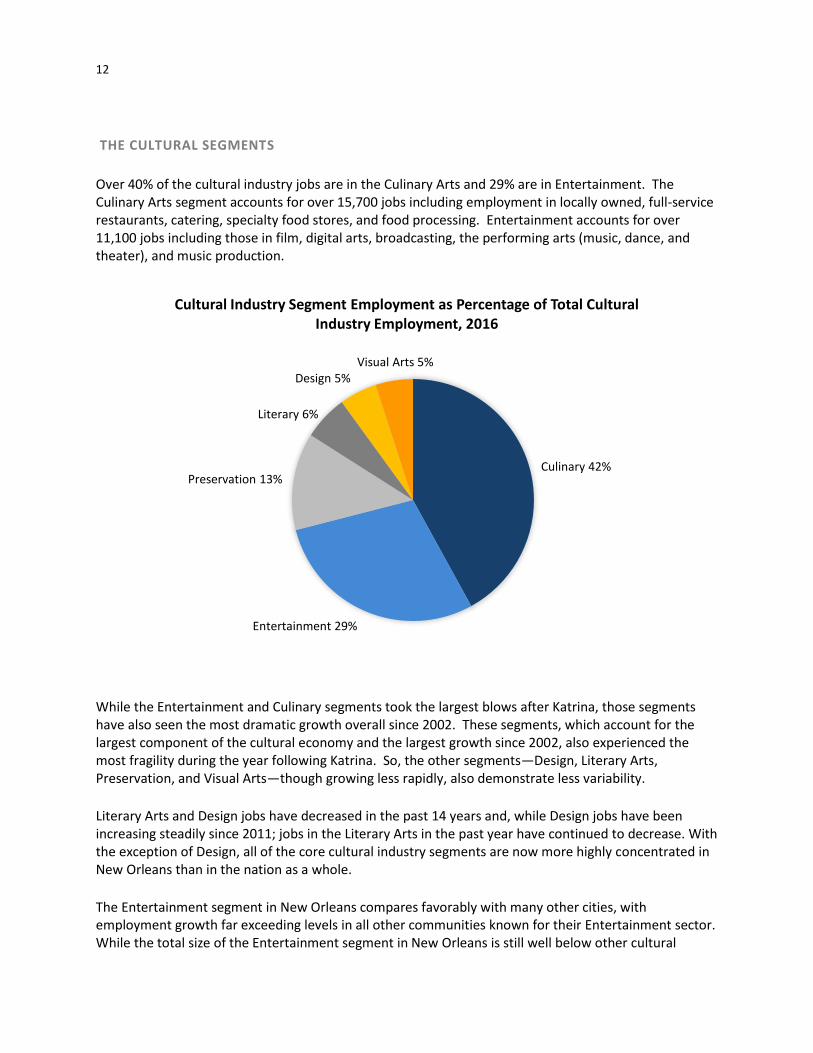
Over 40% of the cultural industry jobs are in the Culinary Arts and 29% are in Entertainment. The Culinary Arts segment accounts for over 15,700 jobs including employment in locally owned, full-service restaurants, catering, specialty food stores, and food processing. Entertainment accounts for over 11,100 jobs including those in film, digital arts, broadcasting, the performing arts (music, dance, and theater), and music production.
While the Entertainment and Culinary segments took the largest blows after Katrina, those segments have also seen the most dramatic growth overall since 2002. These segments, which account for the largest component of the cultural economy and the largest growth since 2002, also experienced the most fragility during the year following Katrina. So, the other segments—Design, Literary Arts, Preservation, and Visual Arts—though growing less rapidly, also demonstrate less variability.
Literary Arts and Design jobs have decreased in the past 14 years and, while Design jobs have been increasing steadily since 2011; jobs in the Literary Arts in the past year have continued to decrease. With the exception of Design, all of the core cultural industry segments are now more highly concentrated in New Orleans than in the nation as a whole.
The Entertainment segment in New Orleans compares favorably with many other cities, with employment growth far exceeding levels in all other communities known for their Entertainment sector. While the total size of the Entertainment segment in New Orleans is still well below other cultural
Culinary 42%
Entertainment 29%
Preservation 13%
Literary 6%
Design 5%Visual Arts 5%
Cultural Industry Segment Employment as Percentage of Total Cultural Industry Employment, 2016
13
centers such as Los Angeles, New York, and San Francisco, the overall growth in employment since 2002 far exceeded any of the other cities in the comparison group. The Entertainment segment in New Orleans exceeded Portland, Oregon and Austin, Texas.
Segment Employment Change
Since 2005 %
Change
Culinary 7,898 100%
Entertainment 4,676 72%
Visual Arts 533 42%
Design 333 21%
Preservation 554 12%
Literary Arts 30 1%
Total 14,024 59%
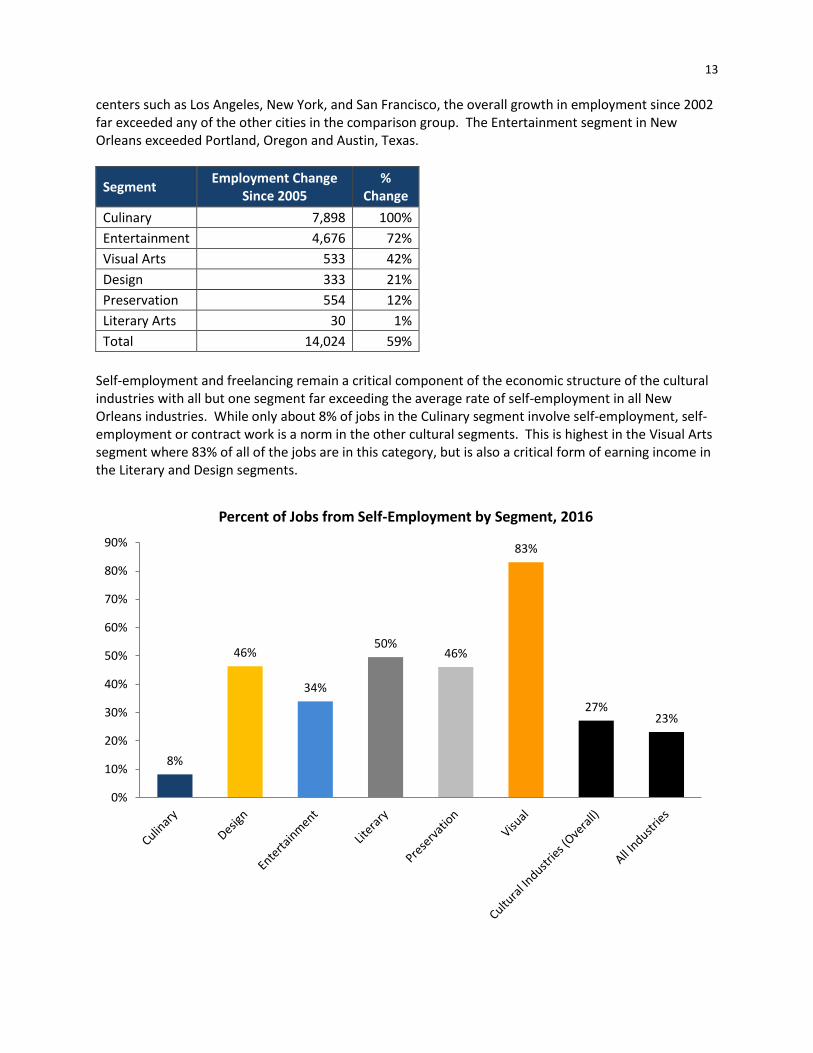
Self-employment and freelancing remain a critical component of the economic structure of the cultural industries with all but one segment far exceeding the average rate of self-employment in all New Orleans industries. While only about 8% of jobs in the Culinary segment involve self-employment, self-employment or contract work is a norm in the other cultural segments. This is highest in the Visual Arts segment where 83% of all of the jobs are in this category, but is also a critical form of earning income in the Literary and Design segments.
8%
46%
34%
50%46%
83%
27%23%
0%
10%
20%
30%
40%
50%
60%
70%
80%
90%
Percent of Jobs from Self-Employment by Segment, 2016
14
CULTURAL OCCUPATIONS OUTSIDE OF CULTURAL BUSINESSES
In addition to the jobs counted in previous sections of this analysis, there are thousands of cultural workers in the city who work for employers outside the cultural industries. If these jobs are included, there are probably close to 40,000 jobs related to the city’s cultural economy. Cultural occupations are different from jobs in cultural industries. A musician or graphic artist, for example, is an occupation. A musician could be self-employed, could work in a creative industry such as theater, but could also work in a non-creative industry such as a religious institution. Similarly, a graphic artist could work for herself, could work for a graphic Design firm (a cultural industry), or could work for a large financial institution in its communications department. To get a more complete picture of the economic importance of the cultural economy, it is thus also important to consider those individuals who have a “cultural occupation” but may be employed outside of the cultural industries. An analysis of EMSI’s occupational data and staffing patterns found that there are a total of 15,831 individuals who are in creative occupations, a 20% increase since 2002. A large number of these, approximately 8,437 or 53%, are self-employed and have been counted in the previous analysis of cultural industries. However, there are approximately 3,321 individuals in cultural occupations who have wage and salary jobs outside of the cultural industries. If these cultural jobs are added to the 37,800 jobs in the cultural industries, the total number of jobs associated with the cultural economy is closer to 41,000. Cultural workers are employed throughout the non-cultural industries, but there are particularly large clusters of them working in education, religion, and hospitality. The most important employers of cultural workers outside the cultural industries are the city’s institutions of higher education. According to EMSI’s staffing patterns data, there are more than 556 cultural jobs at colleges, universities, and professional schools. This number does not include librarians or library technicians, since this report counted jobs in these occupations as working in a cultural industry. It also does not include professors or other postsecondary teachers, since EMSI collapses all of the postsecondary teaching SOC occupation codes into a single occupation code. Beyond educational institutions, some of the largest employers of cultural workers are churches and other religious organizations. There are roughly 280 wage and salary jobs in cultural occupations working in this area, mostly musicians, singers, and music directors. In fact, of the 429 musicians, singers, and musical directors in New Orleans who do have a wage and salary job (vs. working in the gig economy) almost half, or 206, work in a religious organization. There are also many cultural workers who work in the hospitality industry, retail trade, and manufacturing. This includes cultural workers employed by the casino hotels and Designers working in some of the city’s manufacturing companies and commercial establishments
Finally, there are many individuals in cultural occupations who work in the government. There are 572 individuals with cultural occupations who work in state government, the federal government, and the city. A number of these work for state and local education providers (i.e., state colleges and university and city schools).
15
ECONOMIC CONTRIBUTIONS OF THE CULTURAL ECONOMY
BUSINESSES
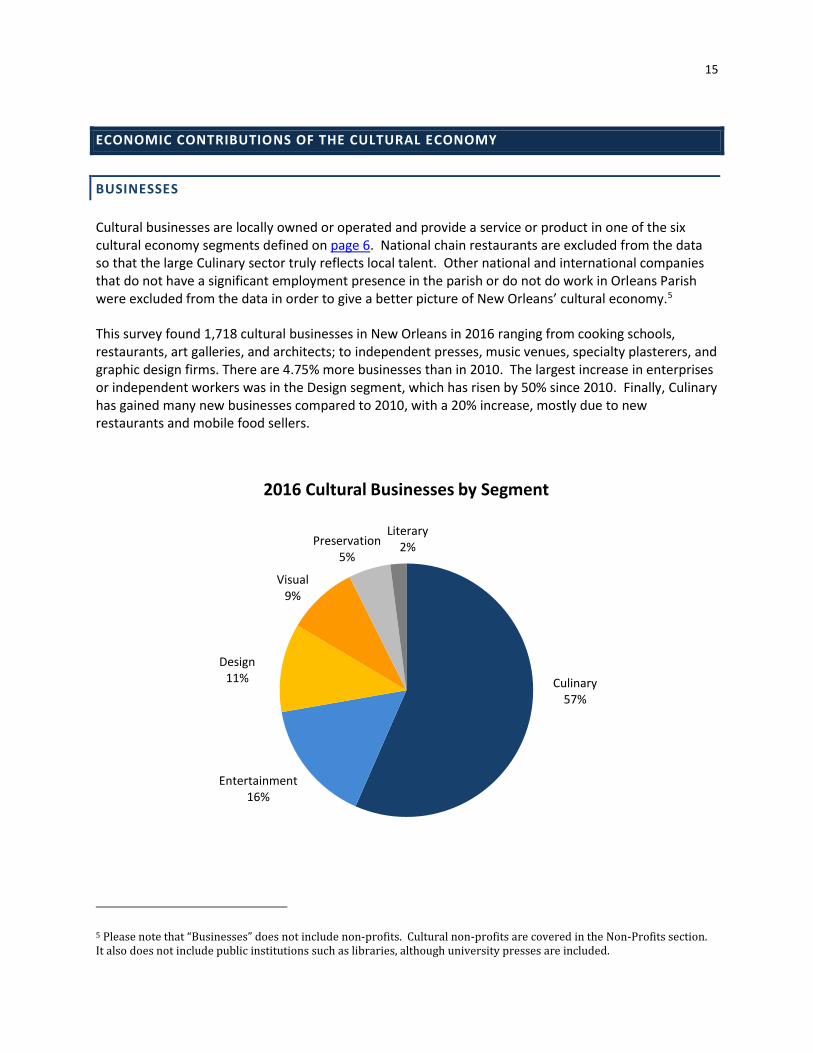
Cultural businesses are locally owned or operated and provide a service or product in one of the six cultural economy segments defined on page 6. National chain restaurants are excluded from the data so that the large Culinary sector truly reflects local talent. Other national and international companies that do not have a significant employment presence in the parish or do not do work in Orleans Parish were excluded from the data in order to give a better picture of New Orleans’ cultural economy.5
This survey found 1,718 cultural businesses in New Orleans in 2016 ranging from cooking schools, restaurants, art galleries, and architects; to independent presses, music venues, specialty plasterers, and graphic design firms. There are 4.75% more businesses than in 2010. The largest increase in enterprises or independent workers was in the Design segment, which has risen by 50% since 2010. Finally, Culinary has gained many new businesses compared to 2010, with a 20% increase, mostly due to new restaurants and mobile food sellers.
5 Please note that “Businesses” does not include non-profits. Cultural non-profits are covered in the Non-Profits section. It also does not include public institutions such as libraries, although university presses are included.
Culinary57%
Entertainment16%
Design11%
Visual9%
Preservation5%
Literary2%
2016 Cultural Businesses by Segment

16
CULINARY
Culinary includes 972 of the following types of locally owned and operated businesses: caterers, cooking schools, food manufacturing, mobile food trucks, restaurants, restaurant management, and specialty food stores.
DESIGN
This segment contains 194 of the following types of businesses: advertising, public relations, digital and commercial printing, fashion, graphic and web Design, media and media representatives, commercial photography, and specialized Design services. Design is one of the most diverse segments, with even proportions of the various types of businesses throughout the city.
69%
21%
6%2% 2%
Culinary Arts Businesses 2016, 972 Total
Restaurants
Specialty Food Stores
Mobile Food Trucks
Caterers, Cooking Schools, &Restaurant Management
Food Products/Manufacturing
27%
24%15%
14%
11%
5%3% 1%
Design Businesses 2016, 194 Total
Advertising & Public Relations
Commercial Photography
Graphic & Web Design
Media & Media Representatives
Digital & Commercial Printing
Specialized Design Services
Fashion
Video Games

17
LITERARY
This is the smallest commercial segment including only 35 businesses comprised of presses/publishing businesses and bookstores. Bookstores make up 94% of Literary businesses in the city in 2014, while Publishing has decreased its share by 7% since 2014.
ENTERTAINMENT
The Entertainment segment contains businesses of the following types: music and performing arts venues; film and video; performing groups; recording studios; retailers; and agents.
94%
6%
Literary Businesses 2016, 35 Total Businesses
Bookstores
Publishing
51%
17%
17%
6%
4%3% 2%
Entertainment Businesses 2016, 269 Businesses
Live Music Venue
Film and Video
Performance & Reception Facilities
Dance & Performing Groups
Music Retail
Recording Studios
Agents and Promoters
18
PRESERVATION
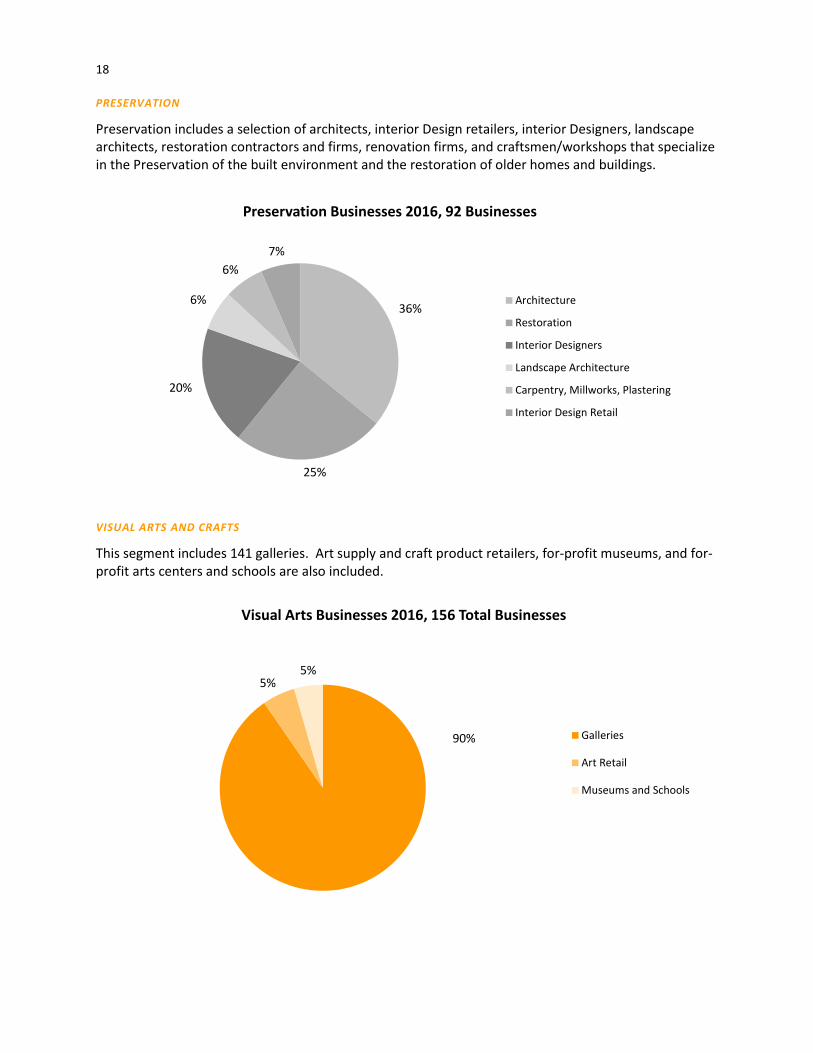
Preservation includes a selection of architects, interior Design retailers, interior Designers, landscape architects, restoration contractors and firms, renovation firms, and craftsmen/workshops that specialize in the Preservation of the built environment and the restoration of older homes and buildings.
VISUAL ARTS AND CRAFTS
This segment includes 141 galleries. Art supply and craft product retailers, for-profit museums, and for-profit arts centers and schools are also included.
36%
25%
20%
6%
6%
7%
Preservation Businesses 2016, 92 Businesses
Architecture
Restoration
Interior Designers
Landscape Architecture
Carpentry, Millworks, Plastering
Interior Design Retail
90%
5%5%
Visual Arts Businesses 2016, 156 Total Businesses
Galleries
Art Retail
Museums and Schools
19
METHODOLOGY
Cultural businesses were counted from a variety of sources. The Bureau of Revenue and the Geographical Information Systems of the Information Technology and Innovation Department of the City of New Orleans provided the base business list with occupational codes. This list was created by looking for all businesses in the metro area with active accounts. The Office of Cultural Economy selected those businesses whose occupational codes matched those used by Mt. Auburn Associates, a research firm procured by the Office of Cultural Economy, in the Employment chapter, and conducted primary research to correctly classify those businesses into one of the 6 cultural economy segments and confirmed their status as open businesses currently operating through the use of sales tax data. Next, the Office researched and contacted businesses throughout the city to record newer businesses that may not have been on the original Revenue list and to eliminate national chain stores and restaurants.
20
ECONOMIC CONTRIBUTIONS OF THE CULTURAL ECONOMY
EARNINGS AND WAGES6
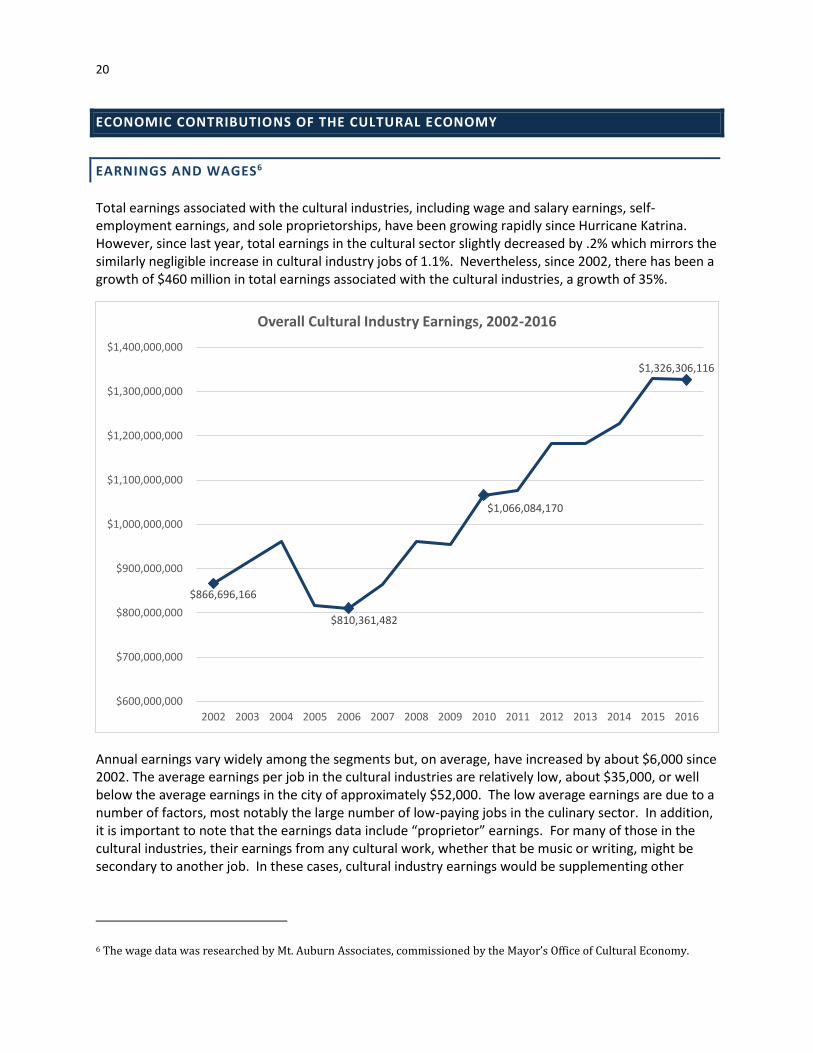
Total earnings associated with the cultural industries, including wage and salary earnings, self-employment earnings, and sole proprietorships, have been growing rapidly since Hurricane Katrina. However, since last year, total earnings in the cultural sector slightly decreased by .2% which mirrors the similarly negligible increase in cultural industry jobs of 1.1%. Nevertheless, since 2002, there has been a growth of $460 million in total earnings associated with the cultural industries, a growth of 35%.
Annual earnings vary widely among the segments but, on average, have increased by about $6,000 since 2002. The average earnings per job in the cultural industries are relatively low, about $35,000, or well below the average earnings in the city of approximately $52,000. The low average earnings are due to a number of factors, most notably the large number of low-paying jobs in the culinary sector. In addition, it is important to note that the earnings data include “proprietor” earnings. For many of those in the cultural industries, their earnings from any cultural work, whether that be music or writing, might be secondary to another job. In these cases, cultural industry earnings would be supplementing other
6 The wage data was researched by Mt. Auburn Associates, commissioned by the Mayor’s Office of Cultural Economy.
$866,696,166
$810,361,482
$1,066,084,170
$1,326,306,116
$600,000,000
$700,000,000
$800,000,000
$900,000,000
$1,000,000,000
$1,100,000,000
$1,200,000,000
$1,300,000,000
$1,400,000,000
2002 2003 2004 2005 2006 2007 2008 2009 2010 2011 2012 2013 2014 2015 2016
Overall Cultural Industry Earnings, 2002-2016

21
sources of income. The average earnings of the “covered” wage and salary jobs in the sector are much higher. The cultural segment with the highest average earnings in New Orleans in 2016 was Preservation and Design. These segments include construction-related jobs as well as professional jobs such as architects and graphic designers. The lowest annual earnings were in the Visual and Culinary Arts segments, where in 2016 average earnings were $20,259 and $32,620, respectively. These low earnings figures are partly a reflection of the fact that many artists and food service workers split their hours between more than one job, and earnings are calculated per job, not per person.
The cultural segment with the highest average earnings in New Orleans in 2015 was Preservation and Design. These segments include construction-related jobs as well as professional jobs such as architects and graphic Designers. The lowest annual earnings were in the Visual and Culinary Arts segments, where in 2015 average earnings were $24,798 and $31,117, respectively. These low earnings figures are partly a reflection of the fact that many artists and food service workers split their hours between more than one job, and earnings are calculated per job, not per person.
In every segment, average earnings grew between 2002 and 2015. However, with the exception of the Entertainment segment, most of the earnings growth happened between 2005, when Katrina hit, and 2006. This increase in average earnings occurred throughout the city’s economy, not just in the cultural industries, and it was probably a direct effect of the loss of many of the city’s lower income residents.
$46,241
$20,259
$34,887
$43,279
$33,856 $32,620$35,087
$0
$5,000
$10,000
$15,000
$20,000
$25,000
$30,000
$35,000
$40,000
$45,000
$50,000
Average Annual Wages by Segment, 2016

22
ECONOMIC CONTRIBUTIONS OF THE CULTURAL ECONOMY
NON-PROFITS
In 2016, 270 cultural non-profit7 organizations were found using a combination of data sources that focus on culture, the arts, and/or the cultural economy. Compared to 2015, this is a 5% increase. This is due in part to better counting of State of Louisiana non-profits, and organizations updating their financials with the IRS and thus becoming a 501(c)3 once more. Of the 270 organizations, 218 are 501(c)3s in good standing, 26 are state non-profits only, and 26 organizations were active, but had no official non-profit status due to late reporting or other issues.
Entertainment continues to be the predominant segment for cultural non-profits in Orleans Parish (47%); many of these organizations are performing groups, Carnival krewes, and social aid and pleasure clubs. Visual Arts and Museums remains in second place with 14% of non-profits. The Multiple Segments Designation represents the 13% of cultural organizations that devote themselves, and almost all their programming, to two or more cultural economy segments. Examples include the Arts Council of New Orleans, the Contemporary Arts Center, and the New Orleans Center for the Creative Arts. The Literary and Humanities segment includes the Louisiana Endowment for the Humanities, headquartered in the city, and historical and literary societies that collect or preserve literature or other historical traditions, items, sites, or archives. The Design organizations are those focused on media, graphic design, fashion, or communications and have the smallest share of organizations overall at 3%.
7 Either 501(c)(3) or registered non-profit with the state of Louisiana
Entertainment, 47%
Visual Arts and Museums, 14%
Multiple Segments, 13%
Preservation, 11%
Literary and Humanities, 7%
Culinary, 6%
Design, 3%
2016 Cultural Non-Profits by Segment

23
OVERALL FINANCIALS OF CULTURAL NON-PROFITS IN 20148
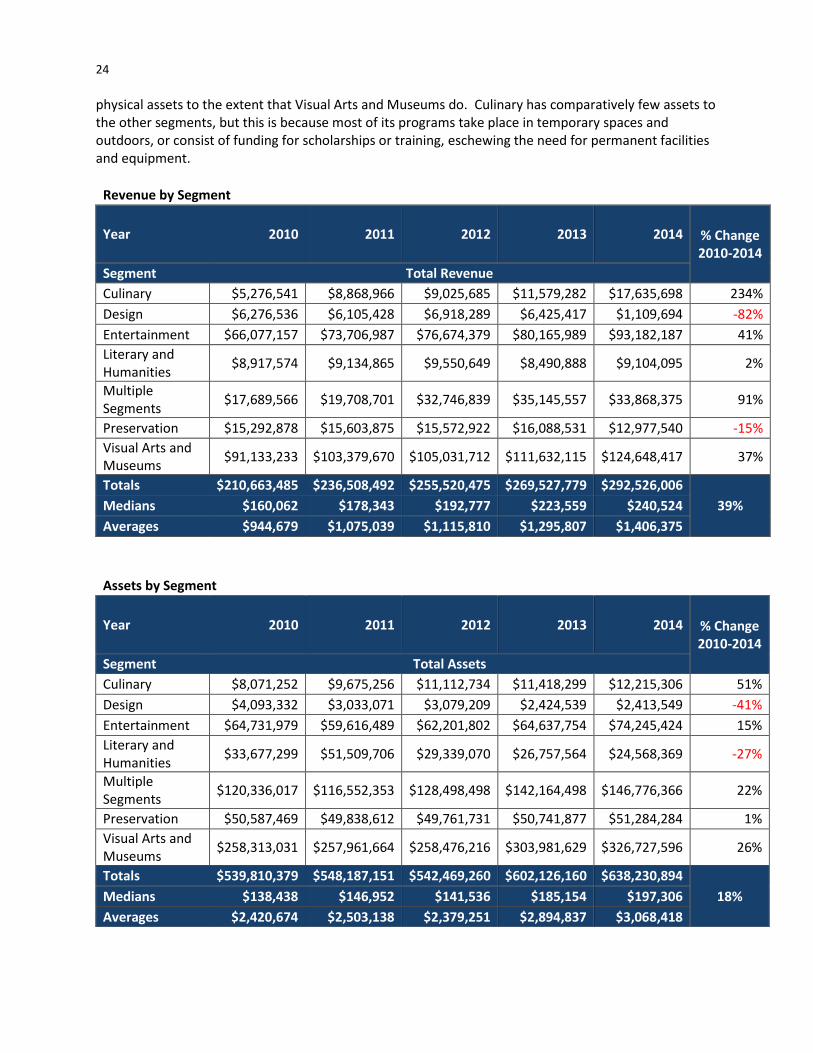
As in previous Snapshots, the revenue and assets of cultural non-profits were examined by segment to get a rough picture of cultural non-profit activity in New Orleans in 2013 and any significant changes from 2010.9 Overall, there was a 39% increase in revenue between 2010 and 2014.10 The Culinary segment gained four organizations and older organizations greatly increased their revenues, leading to revenues over double the amount from 2010. Multiple organizations almost doubled in revenue even though they lost a few organizations over the past 4 years. Visual Arts and Museums receive the most revenue of all segments, primarily from admissions, grants, and contributions. While there are many more Entertainment-oriented organizations, they do not have as large of a revenue stream as museums, art schools, art centers, and other institutions included in the Visual Arts category.
The Visual Arts and Museums category still had the majority of assets (51%) in 2014. Museums have significantly more assets than other organizations, including buildings and collections. Multiple segment organizations are second with 23% of assets. This segment also includes organizations that run art centers that have spaces and programming across segments. Entertainment, with 12% of assets, is mostly made of performing groups and festival producing organizations, neither of which invest in
8 Data comes from: GuideStar USA™ and primary research by the Mayor’s Office of Cultural Economy. Organizations in GuideStar that were determined to be inactive during 2014 were not included. Previous years’ data was updated for missing financial information. 9 990 tax forms for 2014 were examined for 208 of the 218 501c3 non-profits or 95%, as these were all that had available 2014 forms. Ten of the 218 organizations were in good standing with the IRS, but did not yet have a 2014 990 available. Twenty six (26) organizations, while still active in 2014, have had their status revoked by the IRS for failure to file a 990 over the past 3 or more years or declared Inactive by the Louisiana Secretary of State. Twenty six (26) of the organizations were only State of Louisiana non-profits. 10 2014 is the comparison year for this Snapshot because too many organizations did not have 2015 990s available at the time of this study.
334
270
200
220
240
260
280
300
320
340
360
2010 2011 2012 2013 2014 2015 2016
Nu
mb
er
of
Org
aniz
atio
ns
Cultural Non-Profits, 2010-2016
24
physical assets to the extent that Visual Arts and Museums do. Culinary has comparatively few assets to the other segments, but this is because most of its programs take place in temporary spaces and outdoors, or consist of funding for scholarships or training, eschewing the need for permanent facilities and equipment.
Revenue by Segment
Year 2010 2011 2012 2013 2014 % Change 2010-2014
Segment Total Revenue
Culinary $5,276,541 $8,868,966 $9,025,685 $11,579,282 $17,635,698 234%
Design $6,276,536 $6,105,428 $6,918,289 $6,425,417 $1,109,694 -82%
Entertainment $66,077,157 $73,706,987 $76,674,379 $80,165,989 $93,182,187 41%
Literary and Humanities
$8,917,574 $9,134,865 $9,550,649 $8,490,888 $9,104,095 2%
Multiple Segments
$17,689,566 $19,708,701 $32,746,839 $35,145,557 $33,868,375 91%
Preservation $15,292,878 $15,603,875 $15,572,922 $16,088,531 $12,977,540 -15%
Visual Arts and Museums
$91,133,233 $103,379,670 $105,031,712 $111,632,115 $124,648,417 37%
Totals $210,663,485 $236,508,492 $255,520,475 $269,527,779 $292,526,006
39% Medians $160,062 $178,343 $192,777 $223,559 $240,524
Averages $944,679 $1,075,039 $1,115,810 $1,295,807 $1,406,375
Assets by Segment
Year 2010 2011 2012 2013 2014 % Change 2010-2014
Segment Total Assets
Culinary $8,071,252 $9,675,256 $11,112,734 $11,418,299 $12,215,306 51%
Design $4,093,332 $3,033,071 $3,079,209 $2,424,539 $2,413,549 -41%
Entertainment $64,731,979 $59,616,489 $62,201,802 $64,637,754 $74,245,424 15%
Literary and Humanities
$33,677,299 $51,509,706 $29,339,070 $26,757,564 $24,568,369 -27%
Multiple Segments
$120,336,017 $116,552,353 $128,498,498 $142,164,498 $146,776,366 22%
Preservation $50,587,469 $49,838,612 $49,761,731 $50,741,877 $51,284,284 1%
Visual Arts and Museums
$258,313,031 $257,961,664 $258,476,216 $303,981,629 $326,727,596 26%
Totals $539,810,379 $548,187,151 $542,469,260 $602,126,160 $638,230,894
18% Medians $138,438 $146,952 $141,536 $185,154 $197,306
Averages $2,420,674 $2,503,138 $2,379,251 $2,894,837 $3,068,418
25
SEGMENTS OF THE CULTURAL ECONOMY: ENTERTAINMENT
FILM AND VIDEO
OVERVIEW OF FILM INCENTIVES AND FILM NEW ORLEANS
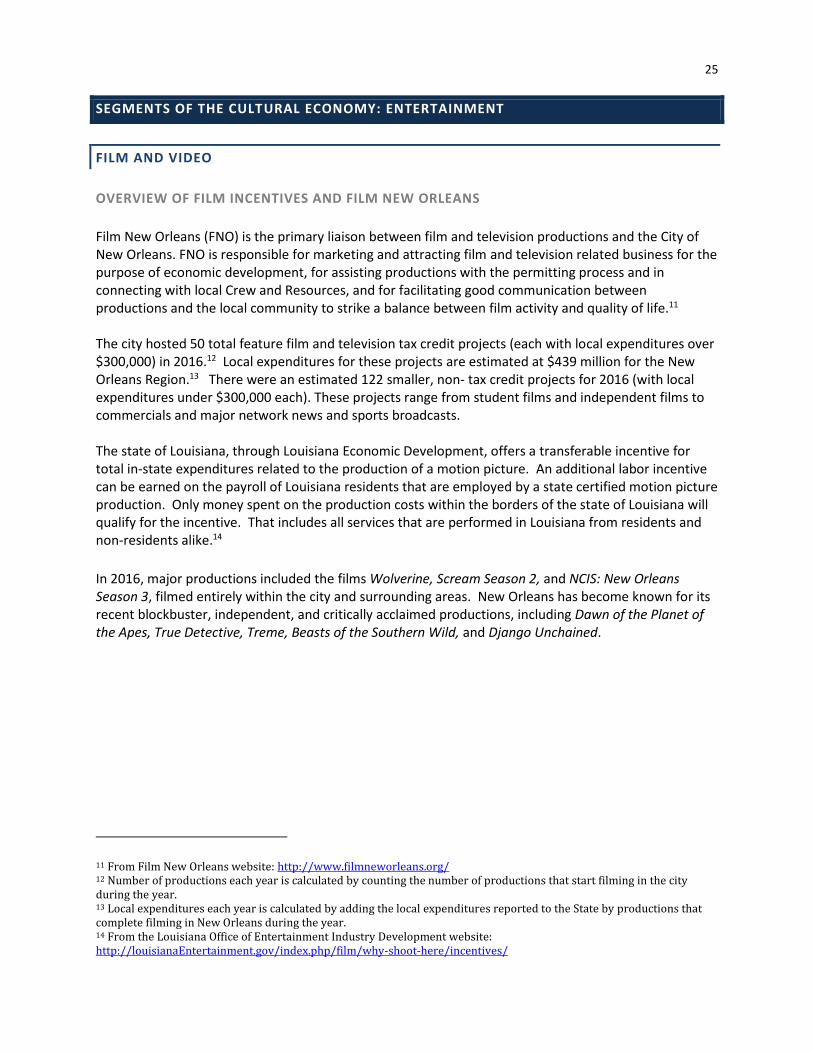
Film New Orleans (FNO) is the primary liaison between film and television productions and the City of New Orleans. FNO is responsible for marketing and attracting film and television related business for the purpose of economic development, for assisting productions with the permitting process and in connecting with local Crew and Resources, and for facilitating good communication between productions and the local community to strike a balance between film activity and quality of life.11 The city hosted 50 total feature film and television tax credit projects (each with local expenditures over $300,000) in 2016.12 Local expenditures for these projects are estimated at $439 million for the New Orleans Region.13 There were an estimated 122 smaller, non- tax credit projects for 2016 (with local expenditures under $300,000 each). These projects range from student films and independent films to commercials and major network news and sports broadcasts. The state of Louisiana, through Louisiana Economic Development, offers a transferable incentive for total in-state expenditures related to the production of a motion picture. An additional labor incentive can be earned on the payroll of Louisiana residents that are employed by a state certified motion picture production. Only money spent on the production costs within the borders of the state of Louisiana will qualify for the incentive. That includes all services that are performed in Louisiana from residents and non-residents alike.14
In 2016, major productions included the films Wolverine, Scream Season 2, and NCIS: New Orleans Season 3, filmed entirely within the city and surrounding areas. New Orleans has become known for its recent blockbuster, independent, and critically acclaimed productions, including Dawn of the Planet of the Apes, True Detective, Treme, Beasts of the Southern Wild, and Django Unchained.
11 From Film New Orleans website: http://www.filmneworleans.org/ 12 Number of productions each year is calculated by counting the number of productions that start filming in the city during the year. 13 Local expenditures each year is calculated by adding the local expenditures reported to the State by productions that complete filming in New Orleans during the year. 14 From the Louisiana Office of Entertainment Industry Development website: http://louisianaEntertainment.gov/index.php/film/why-shoot-here/incentives/
26
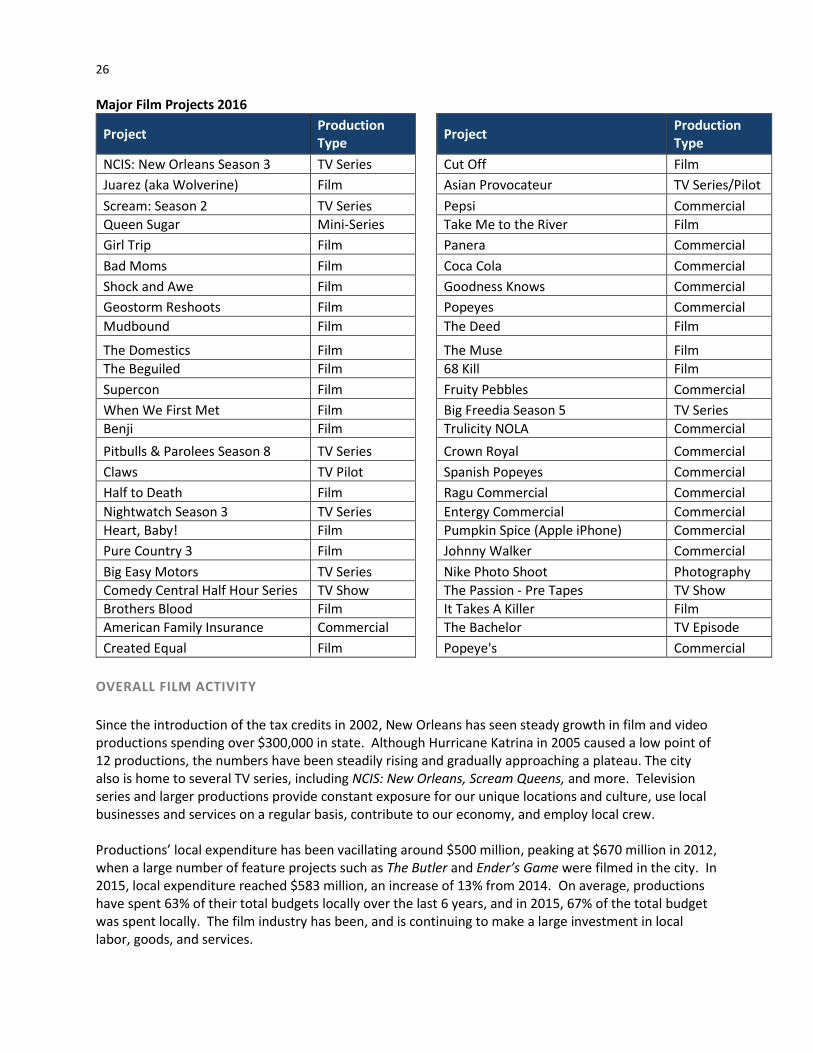
Major Film Projects 2016
Project Production Type
Project Production Type
NCIS: New Orleans Season 3 TV Series Cut Off Film
Juarez (aka Wolverine) Film Asian Provocateur TV Series/Pilot
Scream: Season 2 TV Series Pepsi Commercial
Queen Sugar Mini-Series Take Me to the River Film
Girl Trip Film Panera Commercial
Bad Moms Film Coca Cola Commercial
Shock and Awe Film Goodness Knows Commercial
Geostorm Reshoots Film Popeyes Commercial
Mudbound Film The Deed Film
The Domestics Film The Muse Film
The Beguiled Film 68 Kill Film
Supercon Film Fruity Pebbles Commercial
When We First Met Film Big Freedia Season 5 TV Series
Benji Film Trulicity NOLA Commercial
Pitbulls & Parolees Season 8 TV Series Crown Royal Commercial
Claws TV Pilot Spanish Popeyes Commercial
Half to Death Film Ragu Commercial Commercial
Nightwatch Season 3 TV Series Entergy Commercial Commercial
Heart, Baby! Film Pumpkin Spice (Apple iPhone) Commercial
Pure Country 3 Film Johnny Walker Commercial
Big Easy Motors TV Series Nike Photo Shoot Photography
Comedy Central Half Hour Series TV Show The Passion - Pre Tapes TV Show
Brothers Blood Film It Takes A Killer Film
American Family Insurance Commercial The Bachelor TV Episode
Created Equal Film Popeye's Commercial
OVERALL FILM ACTIVITY
Since the introduction of the tax credits in 2002, New Orleans has seen steady growth in film and video productions spending over $300,000 in state. Although Hurricane Katrina in 2005 caused a low point of 12 productions, the numbers have been steadily rising and gradually approaching a plateau. The city also is home to several TV series, including NCIS: New Orleans, Scream Queens, and more. Television series and larger productions provide constant exposure for our unique locations and culture, use local businesses and services on a regular basis, contribute to our economy, and employ local crew. Productions’ local expenditure has been vacillating around $500 million, peaking at $670 million in 2012, when a large number of feature projects such as The Butler and Ender’s Game were filmed in the city. In 2015, local expenditure reached $583 million, an increase of 13% from 2014. On average, productions have spent 63% of their total budgets locally over the last 6 years, and in 2015, 67% of the total budget was spent locally. The film industry has been, and is continuing to make a large investment in local labor, goods, and services.

27
14
12
37
61
42
50
0
10
20
30
40
50
60
70
2004 2005 2006 2007 2008 2009 2010 2011 2012 2013 2014 2015 2016
All Productions, New Orleans Region
$238,850,000
$155,701,592
$669,822,299
$456,639,462
$583,850,582
$439,146,508
$-
$100,000,000
$200,000,000
$300,000,000
$400,000,000
$500,000,000
$600,000,000
$700,000,000
$800,000,000
2008 2009 2010 2011 2012 2013 2014 2015 2016
Total Local Spend by all Tax-Credit Projects in New Orleans Region

28
44% of Total
71% of Total
72% of Total
52% of Total
76% of Total
66% of Total
67% of Total
$-
$100,000,000
$200,000,000
$300,000,000
$400,000,000
$500,000,000
$600,000,000
$700,000,000
$800,000,000
$900,000,000
$1,000,000,000
2010 2011 2012 2013 2014 2015 2016
Local Spend Compared to Total Tax Credit Project Spend
Local Spend
Total Budget

29
SEGMENTS OF THE CULTURAL ECONOMY: ENTERTAINMENT
MUSIC
MUSIC PERFORMANCES AND ECONOMIC IMPACT
In the Businesses chapter, this survey found that 51% (136) of Entertainment businesses are live music venues in 2016. Of all the drinking establishments in the city, we estimate that 30% have live music or DJs regularly. These are the bars and clubs that host local musicians multiple weekdays and weekends. To get an idea of how these venues and an estimated 4,000 individual musicians impact our economy, this survey looks at gig data. The Mayor’s Office of Cultural Economy has compiled data on the number of gigs per year by venue and differences in those offerings by month, weekday/weekend, and festival days. Examining the frequency and timing of live music gigs in New Orleans in 2016 will give us more information on what work is available to local musicians and how large events, particularly music festivals, effect the number of gigs. There were 31,127 music gigs last year, 19% more than in 2011 when the gig data starts.
The 2016 data shows that high volume tourism months (busy) have 13% more gigs than lower volume months (slow). For the fifth year in a row, the difference between tourism seasons seems to be negligible when compared to days of the week and especially festival days.
26,199
29,748
28,157
31,127
24,000
25,000
26,000
27,000
28,000
29,000
30,000
31,000
32,000
2011 2012 2013 2014 2015 2016
Total Gigs, 2011-2016

30
When we examine the average local music gigs per day, it can tell us what effect weekends15 and special events have on performance opportunities for musicians. Festivals have a large impact on the average number of gigs that are not related to the festival (25% more gigs on average on a festival day as opposed to an average day). Festivals taking place in the city tend to increase gigs on week days and any given day overall.
15 Weekends in this data refers to Friday and Saturday gigs, most of which take place in the evenings. Weekdays refers to Sunday through Thursday gigs, again, most of which take place in the evening.
2,433
2,594
2,755
- 500 1,000 1,500 2,000 2,500 3,000
Avg. Slow Month
Avg. Month
Avg. Busy Month
Average Music Gigs per Month, 2016
74
85
92
106
111
112
- 20 40 60 80 100 120
Avg. Weekday
Avg. Day
Avg. Festival Weekday
Avg. Festival Day
Avg. Festival Weekend
Avg. Weekend
Average Music Gigs per Day, 2016
31
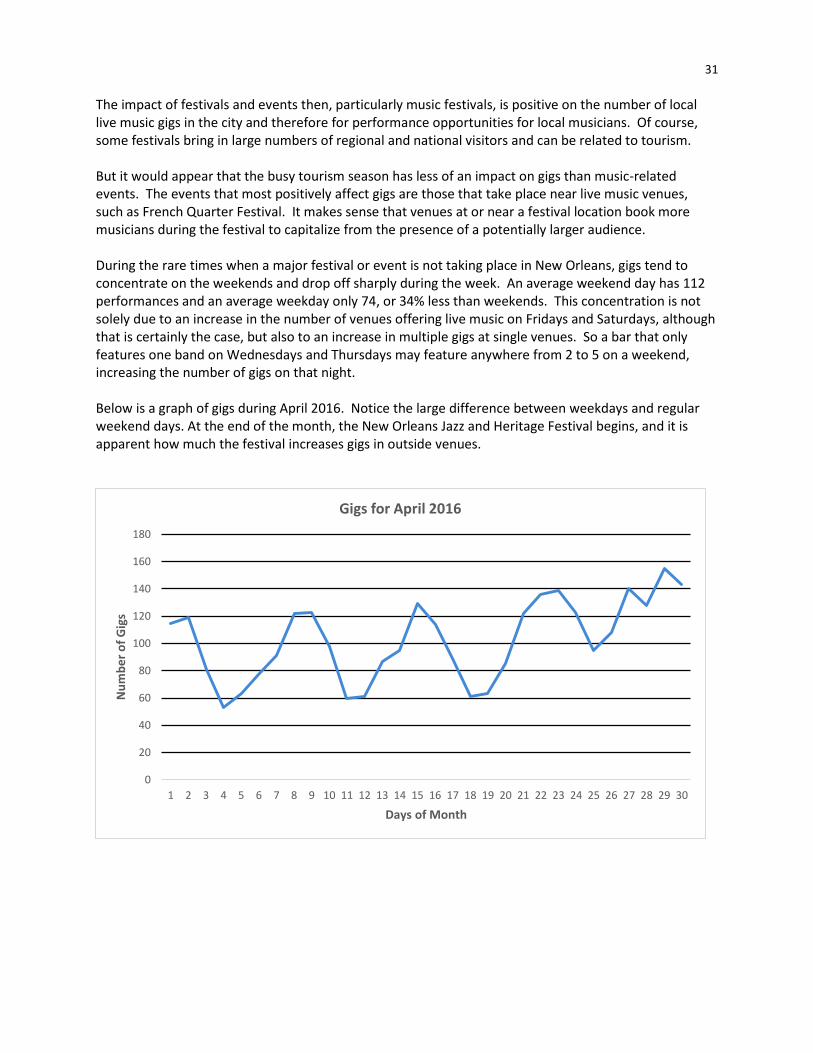
The impact of festivals and events then, particularly music festivals, is positive on the number of local live music gigs in the city and therefore for performance opportunities for local musicians. Of course, some festivals bring in large numbers of regional and national visitors and can be related to tourism. But it would appear that the busy tourism season has less of an impact on gigs than music-related events. The events that most positively affect gigs are those that take place near live music venues, such as French Quarter Festival. It makes sense that venues at or near a festival location book more musicians during the festival to capitalize from the presence of a potentially larger audience. During the rare times when a major festival or event is not taking place in New Orleans, gigs tend to concentrate on the weekends and drop off sharply during the week. An average weekend day has 112 performances and an average weekday only 74, or 34% less than weekends. This concentration is not solely due to an increase in the number of venues offering live music on Fridays and Saturdays, although that is certainly the case, but also to an increase in multiple gigs at single venues. So a bar that only features one band on Wednesdays and Thursdays may feature anywhere from 2 to 5 on a weekend, increasing the number of gigs on that night. Below is a graph of gigs during April 2016. Notice the large difference between weekdays and regular weekend days. At the end of the month, the New Orleans Jazz and Heritage Festival begins, and it is apparent how much the festival increases gigs in outside venues.
0
20
40
60
80
100
120
140
160
180
1 2 3 4 5 6 7 8 9 10 11 12 13 14 15 16 17 18 19 20 21 22 23 24 25 26 27 28 29 30
Nu
mb
er
of
Gig
s
Days of Month
Gigs for April 2016
32
33
FESTIVALS AND EVENTS
OVERVIEW
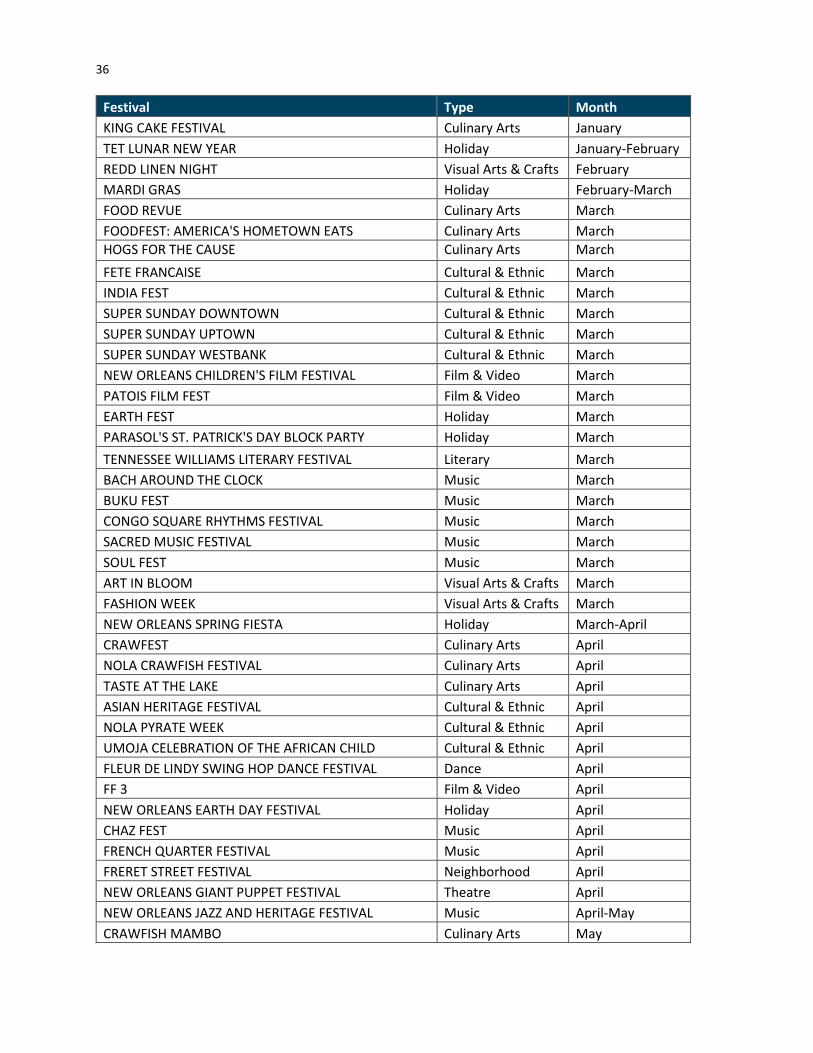
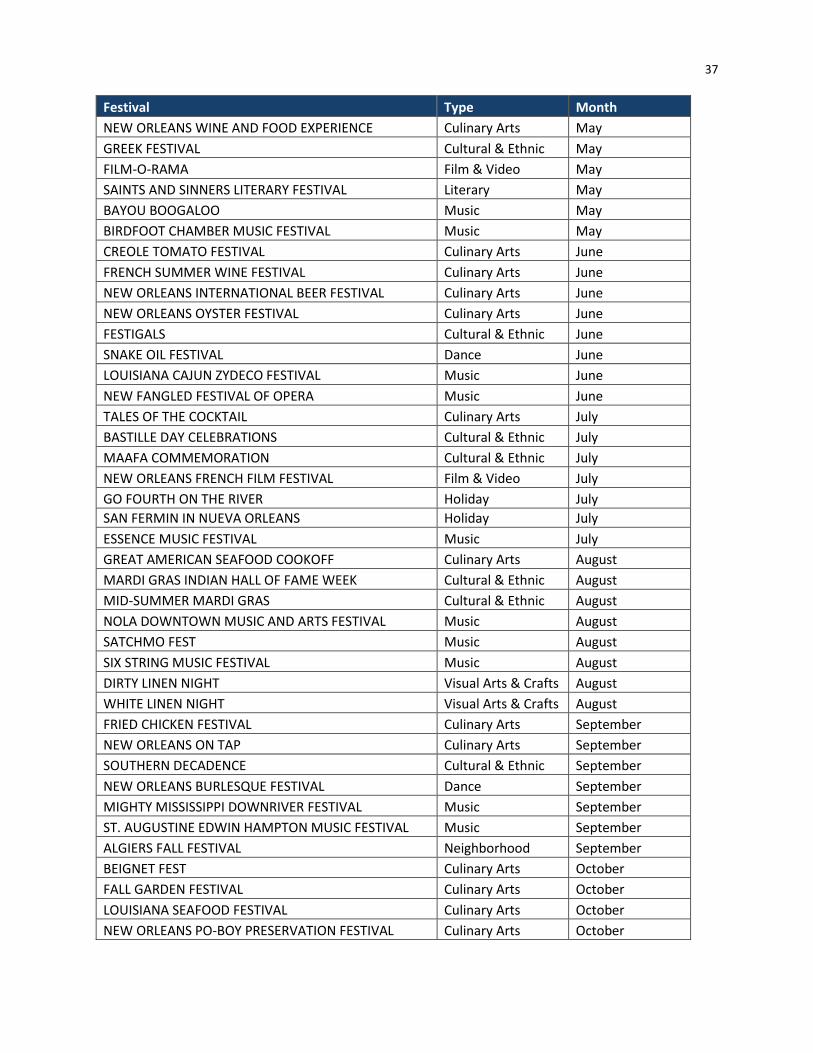
In New Orleans, festivals are a way of life. With 136 festivals, events, and outdoor markets, New Orleans has more festivals than weekend days in the year. While many of these events primarily feature a single part of our local cultural economy such as performing arts, food, or visual art, almost all festivals and even farmers and art markets include a combination of all three or more aspects of New Orleans cultural life. Harrison Avenue Marketplace features food, music, culinary demonstrations, art and more. Large music events such as the French Quarter Festival have both 20 stages for music and gourmet food stands from local restaurants. In fact, the food vendors and menu offerings are listed and dissected in local papers as much as the music. The Jazz and Heritage Festival also features an exclusive crafts and art market, selling local artists’, sculptors’, and jewelry designers’ wares. In recent years, other large music festivals such as Essence Music Festival and VooDoo Experience have also added art marketplaces to their events as well as local food vendors. Every event in New Orleans is unique, from an annual neighborhood festival such as the Freret Street Festival to the citywide celebration of Mardi Gras. This chapter will provide an overview and listing of many of the annual festivals here in New Orleans, starting with the types of festivals that took place in 2016 and an estimate of attendance for all 136 festivals included in this year’s Snapshot. Using commissioned economic impact studies, we will then examine major events and their economic and tourism impacts.
FESTIVAL OVERVIEW BY CULTURAL ECONOMY SEGMENT
Of the festivals and recurring markets surveyed here16 Entertainment festivals are the most common; 23% of the 136 festivals were categorized as Entertainment festivals. Again, it is important to remember that most of these events feature more than one category, the most common combination being food and art. Visual Arts also are often featured at events through art markets. Events were categorized by their dominant characteristic. So although Jazz Fest features food and visual art in addition to music, its primary purpose is music. The New Orleans Po-Boy Festival on Oak Street has music and visual art vendors, but its focus is the multitude of food vendors serving New Orleans’ most famous sandwich and is thus categorized as a Culinary festival. Culinary (20%), Cultural and Ethnic (15%), and Holiday (12%) are the next most common types of festivals. Cultural and Ethnic festivals include the many events celebrating New Orleans’ African, Native American, Caribbean, French, Spanish, Latin American, Italian, Cajun, and Irish heritage and current culture and populations.
16 Festival data was acquired through primary internet research, using existing material from the 2010-2014 Snapshots, and using search engines. New festivals were included to the extent possible. Some festivals that are small in size or are not recurring festivals may not be included.

34
OVERALL ATTENDANCE ESTIMATE
The City has several larger festivals and events, most notably Mardi Gras. The total attendance for Mardi Gras, French Quarter Festival and Essence in 2016 was 2.6 million. For the remaining events, we can roughly estimate the number of attendees if we use average sizes for small (500 attendees), neighborhood (1,500), mid-size (4,000), large (10,000-15,000), and Downtown/French Quarter events (20,000-25,000).
Of course, this estimate is not only rough, but probably also undercounting some events and over- counting others. However, using this estimate, New Orleans’ festivals enjoyed the patronage of 4.4 million people in 2016, a 15% increase since 2015. Festivals are increasingly popular in recent years, and many, such as the French Quarter Festival, Tales of the Cocktail, and the Po-Boy Preservation Festival have grown impressively over the past 3-4 years. Finally, many people, especially locals, attend more than one festival, so there is overlap among this number.
Music23%
Culinary20%
Cultural and Ethnic15%
Holiday12%
Visual Arts12%
Film, Theatre and Dance10%
Neighborhood4%
Literary4%
Festivals and Events by Type, 2016
3,200,000
4,100,000
3,844,550
4,406,550
2,600,000
2,800,000
3,000,000
3,200,000
3,400,000
3,600,000
3,800,000
4,000,000
4,200,000
4,400,000
4,600,000
2010 2011 2012 2013 2014 2015 2016
Total Estimated Event Attendance, 2010-2016
35
MAJOR EVENT ECONOMIC IMPACT
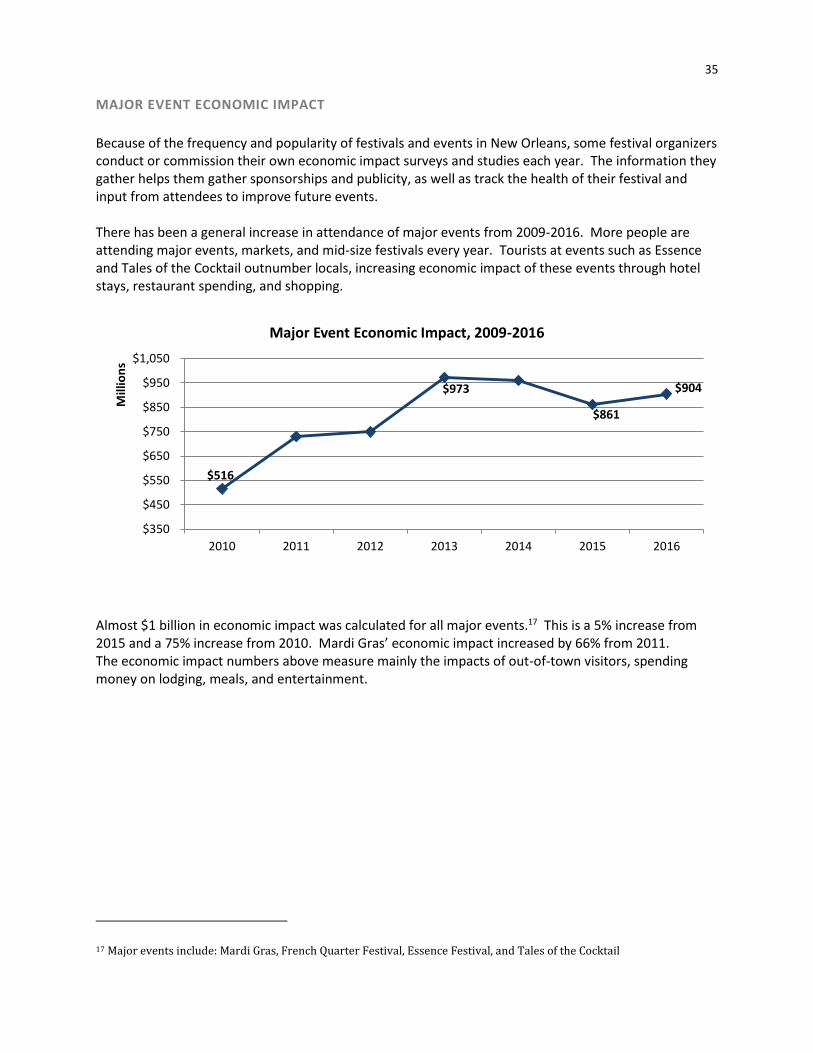
Because of the frequency and popularity of festivals and events in New Orleans, some festival organizers conduct or commission their own economic impact surveys and studies each year. The information they gather helps them gather sponsorships and publicity, as well as track the health of their festival and input from attendees to improve future events. There has been a general increase in attendance of major events from 2009-2016. More people are attending major events, markets, and mid-size festivals every year. Tourists at events such as Essence and Tales of the Cocktail outnumber locals, increasing economic impact of these events through hotel stays, restaurant spending, and shopping.
Almost $1 billion in economic impact was calculated for all major events.17 This is a 5% increase from 2015 and a 75% increase from 2010. Mardi Gras’ economic impact increased by 66% from 2011. The economic impact numbers above measure mainly the impacts of out-of-town visitors, spending money on lodging, meals, and entertainment.
17 Major events include: Mardi Gras, French Quarter Festival, Essence Festival, and Tales of the Cocktail
$516
$973
$861
$904
$350
$450
$550
$650
$750
$850
$950
$1,050
2010 2011 2012 2013 2014 2015 2016
Mill
ion
s
Major Event Economic Impact, 2009-2016
36
Festival Type Month
KING CAKE FESTIVAL Culinary Arts January
TET LUNAR NEW YEAR Holiday January-February
REDD LINEN NIGHT Visual Arts & Crafts February
MARDI GRAS Holiday February-March
FOOD REVUE Culinary Arts March
FOODFEST: AMERICA'S HOMETOWN EATS Culinary Arts March
HOGS FOR THE CAUSE Culinary Arts March
FETE FRANCAISE Cultural & Ethnic March
INDIA FEST Cultural & Ethnic March
SUPER SUNDAY DOWNTOWN Cultural & Ethnic March
SUPER SUNDAY UPTOWN Cultural & Ethnic March
SUPER SUNDAY WESTBANK Cultural & Ethnic March
NEW ORLEANS CHILDREN'S FILM FESTIVAL Film & Video March
PATOIS FILM FEST Film & Video March
EARTH FEST Holiday March
PARASOL'S ST. PATRICK'S DAY BLOCK PARTY Holiday March
TENNESSEE WILLIAMS LITERARY FESTIVAL Literary March
BACH AROUND THE CLOCK Music March
BUKU FEST Music March
CONGO SQUARE RHYTHMS FESTIVAL Music March
SACRED MUSIC FESTIVAL Music March
SOUL FEST Music March
ART IN BLOOM Visual Arts & Crafts March
FASHION WEEK Visual Arts & Crafts March
NEW ORLEANS SPRING FIESTA Holiday March-April
CRAWFEST Culinary Arts April
NOLA CRAWFISH FESTIVAL Culinary Arts April
TASTE AT THE LAKE Culinary Arts April
ASIAN HERITAGE FESTIVAL Cultural & Ethnic April
NOLA PYRATE WEEK Cultural & Ethnic April
UMOJA CELEBRATION OF THE AFRICAN CHILD Cultural & Ethnic April
FLEUR DE LINDY SWING HOP DANCE FESTIVAL Dance April
FF 3 Film & Video April
NEW ORLEANS EARTH DAY FESTIVAL Holiday April
CHAZ FEST Music April
FRENCH QUARTER FESTIVAL Music April
FRERET STREET FESTIVAL Neighborhood April
NEW ORLEANS GIANT PUPPET FESTIVAL Theatre April
NEW ORLEANS JAZZ AND HERITAGE FESTIVAL Music April-May
CRAWFISH MAMBO Culinary Arts May
37
Festival Type Month
NEW ORLEANS WINE AND FOOD EXPERIENCE Culinary Arts May
GREEK FESTIVAL Cultural & Ethnic May
FILM-O-RAMA Film & Video May
SAINTS AND SINNERS LITERARY FESTIVAL Literary May
BAYOU BOOGALOO Music May
BIRDFOOT CHAMBER MUSIC FESTIVAL Music May
CREOLE TOMATO FESTIVAL Culinary Arts June
FRENCH SUMMER WINE FESTIVAL Culinary Arts June
NEW ORLEANS INTERNATIONAL BEER FESTIVAL Culinary Arts June
NEW ORLEANS OYSTER FESTIVAL Culinary Arts June
FESTIGALS Cultural & Ethnic June
SNAKE OIL FESTIVAL Dance June
LOUISIANA CAJUN ZYDECO FESTIVAL Music June
NEW FANGLED FESTIVAL OF OPERA Music June
TALES OF THE COCKTAIL Culinary Arts July
BASTILLE DAY CELEBRATIONS Cultural & Ethnic July
MAAFA COMMEMORATION Cultural & Ethnic July
NEW ORLEANS FRENCH FILM FESTIVAL Film & Video July
GO FOURTH ON THE RIVER Holiday July
SAN FERMIN IN NUEVA ORLEANS Holiday July
ESSENCE MUSIC FESTIVAL Music July
GREAT AMERICAN SEAFOOD COOKOFF Culinary Arts August
MARDI GRAS INDIAN HALL OF FAME WEEK Cultural & Ethnic August
MID-SUMMER MARDI GRAS Cultural & Ethnic August
NOLA DOWNTOWN MUSIC AND ARTS FESTIVAL Music August
SATCHMO FEST Music August
SIX STRING MUSIC FESTIVAL Music August
DIRTY LINEN NIGHT Visual Arts & Crafts August
WHITE LINEN NIGHT Visual Arts & Crafts August
FRIED CHICKEN FESTIVAL Culinary Arts September
NEW ORLEANS ON TAP Culinary Arts September
SOUTHERN DECADENCE Cultural & Ethnic September
NEW ORLEANS BURLESQUE FESTIVAL Dance September
MIGHTY MISSISSIPPI DOWNRIVER FESTIVAL Music September
ST. AUGUSTINE EDWIN HAMPTON MUSIC FESTIVAL Music September
ALGIERS FALL FESTIVAL Neighborhood September
BEIGNET FEST Culinary Arts October
FALL GARDEN FESTIVAL Culinary Arts October
LOUISIANA SEAFOOD FESTIVAL Culinary Arts October
NEW ORLEANS PO-BOY PRESERVATION FESTIVAL Culinary Arts October

38
Festival Type Month
CELEBRACION LATINA Cultural & Ethnic October
JAPAN FEST Cultural & Ethnic October
NICKEL-A-DANCE Dance October
NEW ORLEANS FILM FESTIVAL Film & Video October
BOO AT THE ZOO Holiday October
BOO CARRE HALLOWEEN AND HARVEST FESTIVAL Holiday October
GHOSTS IN THE OAKS Holiday October
CARNAVAL LATINO Music October
CRESCENT CITY BLUES AND BBQ FESTIVAL Music October
PONDEROSA STOMP Music October
PRAISE FEST Music October
TREME FALL FEST Music October
VOODOO EXPERIENCE Music October
FETE MARIGNY Neighborhood October
GENTILLY FESTIVAL Neighborhood October
MIRLITON FESTIVAL Neighborhood October
HELL YES FEST Theatre October
ART FOR ART'S SAKE Visual Arts & Crafts October
FORESTIVAL Visual Arts & Crafts October
BEAUJOLAIS FESTIVAL Culinary Arts November
TREME CREOLE GUMBO FESTIVAL Culinary Arts November
BAYOU BACCHANAL Cultural & Ethnic November
FOLK MAGIC FESTIVAL Cultural & Ethnic November
SCANDINAVIAN FESTIVAL Cultural & Ethnic November
NEW ORLEANS BOOK FESTIVAL Literary November
NEW ORLEANS COMICS AND ZINES FEST Literary November
WORDS AND MUSIC Literary November
CENTRAL CITY FESTIVAL Music November
COPS 2 BLUES FEST Music November
LADYFEST Music November
FAUX REAL NEW ORLEANS Theatre November
ALGIERS FOLK ART FESTIVAL Visual Arts & Crafts November
TALES OF THE TODDY Culinary Arts December
MARCHE D'HIVER Cultural & Ethnic December
BIG EASY INTERNATIONAL FILM FESTIVAL Film & Video December
ALGIERS CHRISTMAS BONFIRE Holiday December
CELEBRATION IN THE OAKS Holiday December
CHRISTMAS NEW ORLEANS STYLE Holiday December
HOLIDAY ON THE BOULEVARD Holiday December
NOLA CHRISTMASFEST Holiday December

39
Festival Type Month
LUNA FETE Visual Arts & Crafts December
PHOTONOLA Visual Arts & Crafts December
JAZZ IN THE PARK Music Fall to Spring
WEDNESDAYS AT THE SQUARE Music Spring to Summer
WEDNESDAYS AT THE POINT Music Spring to Summer
THURSDAYS AT TWILIGHT Music Winter to Fall
CRESCENT CITY FARMERS MARKET (4 LOCATIONS) Culinary Arts Year-round
HOLLYGROVE MARKET AND FARM Culinary Arts Year-round
OLD ALGIERS HARVEST FRESH MARKET Culinary Arts Year-round
FRERET STREET MARKET Neighborhood Year-round
FRIDAY NIGHTS AT NOMA Visual Arts & Crafts Year-round
HARRISON AVENUE MARKETPLACE Visual Arts & Crafts Year-round
OCH ART MARKET Visual Arts & Crafts Year-round
OGDEN AFTER HOURS Visual Arts & Crafts Year-round
PALMER PARK ARTS MARKET Visual Arts & Crafts Year-round
PIETY STREET MARKET Visual Arts & Crafts Year-round

40
CULTURAL CAREER PATHS SURVEY
The Cultural Career Paths Survey is a Research Art Works grant project funded by the National Endowment for the Arts and the City of New Orleans. Its goal was to survey cultural workers, their work history, their wage history, impact of life events, and input on cultural economic development policy. In the United States, few studies have statistically analyzed career and educational data of individual cultural workers with the goal of crafting policy towards their needs. Although this research will focus on one city, New Orleans, the methodology will serve as a roadmap for similar regional, state or nationwide studies of how to approach the experience of the individual cultural worker and to translate that into possible policy. This research examines the career and educational paths of cultural workers in New Orleans in order to identify gaps and ultimately policy solutions relating to public, educational, and economic infrastructure supportive of the cultural economy. At the same time, this data will be paired with more traditional quantitative data such as job numbers and economic activity. While much of economic development research and policy analysis focuses on the needs of industries and businesses, however, in a sector dominated by freelancers, portfolio workers, micro-businesses, and the self-employed this approach makes little practical sense. From the concept of a “creative class” in Richard Florida’s Rise of the Creative Class, the idea of the cultural worker or creative worker has evolved throughout the world. Many studies define cultural or creative workers differently, ranging in everything from visual artists to lawyers. In this research, a cultural worker is defined by employment or work in one or more of the following sectors:
Culinary Arts: Food-related cultural products including food processing, specialty food products and locally-owned, full service restaurants (does not include franchise/non-local chain restaurants);
Design: Individual designers and firms involved in the communication arts such as graphic design, printing, and advertising;
Entertainment: The performing arts (music, theater, and dance), individual performers, and the film industries;
Literary Arts and Humanities: Individual writers and editors and book, periodical, and newspaper publishing;
Preservation: Economic activities focused on the restoration and redevelopment of the built environment including architecture, landscape architecture and a percentage of construction activity focused on preservation and renovation; and
Visual Arts and Crafts: Individual artists and craftspeople as well as the galleries and museums that present cultural products.
Although traditional economic development policies are shaped by the needs of industries and employers, this research asserts that in a cultural sector characterized by high self-employment, freelance and portfolio work and multiple jobs within and without the cultural sector, focusing on the composition and needs of the cultural workers makes more sense. Cultural workers often have precarious work, meaning that they are often not full employees of companies, but usually contractors, freelancers, or temporary workers that can be let go at any time. The research team conducted 25 interviews and 280 surveys of New Orleans’ cultural workers. The survey was looking for information on job holding, income, education, and the impact of major life

41
events. Finally, the survey covered what types of assistance cultural workers would find helpful. The majority of respondents were White (63%), Female (68%), Visual Artists (49%), and held a Masters degree (41%). These results are partly explained by the survey being mostly available online, and outreach through the Arts Council, whose registered artists skew towards these characteristics. However, the research team did in-person outreach and paper surveys to reach other portions of the cultural worker population to represent workers more fully.
What do cultural careers look like?
Full-time employment with a regular salary 33.21%
Part-time employment with a regular salary 6.79%
Full-time self-employment or freelancing (working on individual contracts, sales, or gigs)
21.43%
Part-time self-employment or freelancing (working on individual contracts, sales or gigs)
22.50%
A business that you own in which you have other employees
10.00%
While we received 280 total survey responses, cultural worker respondents were allowed to select more than one cultural “segment” in answering the question “Which cultural segment do you work in or earn income from?” We received 413 total responses to this question, indicating that many respondents work in more than one cultural segment. This multi-faceted view of cultural careers extended into the interviews as well – ten of our 25 interviewees indicated that they view themselves as participants in multiple cultural segments, and six identified as working in three or more segments. Cultural career paths are also flexible – many workers balance cultural work with work in other industries, work on a contract / gig / self-employment basis, and move between cultural work and non-cultural work over time. Over one-third of survey respondents earn other income from non-cultural work, and a plurality (43%) are self-employed. This is very similar to many major surveys done outside the United States and matches our self-employment data from the Economic Data Findings above. African-American cultural workers are far more likely to work in non-cultural industries in addition to doing cultural work, and far less likely to have a full-time job in a cultural industry. Young cultural workers ages 18-24 are also far more likely to work part-time in the cultural economy. The most popular reasons for cultural workers to also do non-cultural work are to generate additional income or generate a more stable, predictable income for themselves and their families. These reasons are particularly true for African-American cultural workers. The median individual income category in 2015 for survey respondents was $30,000-$39,999; when looking at cultural work alone, survey respondents received a median individual income of $20,000-$29,999 directly from cultural work in 2015. The median household income for survey respondents was $50,000-$59,999 in 2015. While these numbers are fairly comparable to the Greater New Orleans Area Median Income, given rising costs of living in New Orleans, cultural workers remain income-constrained.
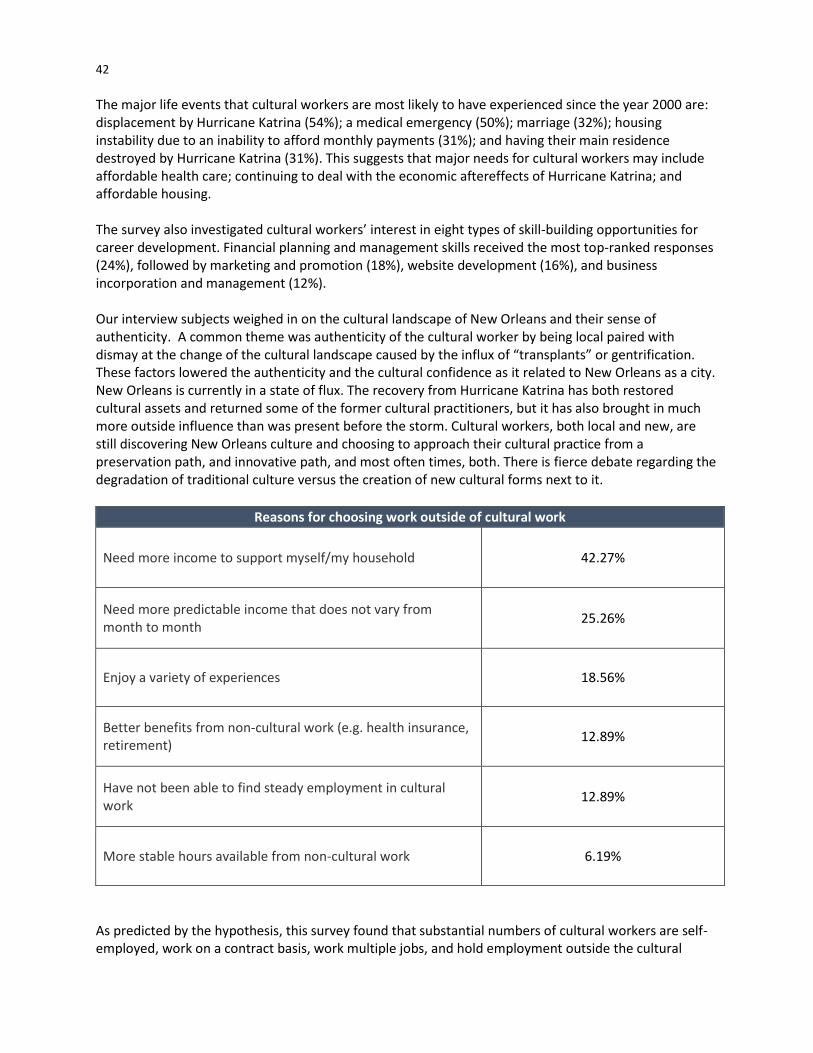
42
The major life events that cultural workers are most likely to have experienced since the year 2000 are: displacement by Hurricane Katrina (54%); a medical emergency (50%); marriage (32%); housing instability due to an inability to afford monthly payments (31%); and having their main residence destroyed by Hurricane Katrina (31%). This suggests that major needs for cultural workers may include affordable health care; continuing to deal with the economic aftereffects of Hurricane Katrina; and affordable housing. The survey also investigated cultural workers’ interest in eight types of skill-building opportunities for career development. Financial planning and management skills received the most top-ranked responses (24%), followed by marketing and promotion (18%), website development (16%), and business incorporation and management (12%). Our interview subjects weighed in on the cultural landscape of New Orleans and their sense of authenticity. A common theme was authenticity of the cultural worker by being local paired with dismay at the change of the cultural landscape caused by the influx of “transplants” or gentrification. These factors lowered the authenticity and the cultural confidence as it related to New Orleans as a city. New Orleans is currently in a state of flux. The recovery from Hurricane Katrina has both restored cultural assets and returned some of the former cultural practitioners, but it has also brought in much more outside influence than was present before the storm. Cultural workers, both local and new, are still discovering New Orleans culture and choosing to approach their cultural practice from a preservation path, and innovative path, and most often times, both. There is fierce debate regarding the degradation of traditional culture versus the creation of new cultural forms next to it.
Reasons for choosing work outside of cultural work
Need more income to support myself/my household 42.27%
Need more predictable income that does not vary from month to month
25.26%
Enjoy a variety of experiences 18.56%
Better benefits from non-cultural work (e.g. health insurance, retirement)
12.89%
Have not been able to find steady employment in cultural work
12.89%
More stable hours available from non-cultural work 6.19%
As predicted by the hypothesis, this survey found that substantial numbers of cultural workers are self-employed, work on a contract basis, work multiple jobs, and hold employment outside the cultural

43
industries. The self-made and pieced-together natures of their careers and career paths show a complexity that industry-based training policies most likely will not address. Indeed, many of our interviewees felt that there were programs the City or others could create that would address their unique needs and that these programs did not yet exist. The City and cultural non-profits should consider several types of assistance for cultural workers based on the results of this survey. The City should continue its current focus on affordable housing and the percentages of affordable units in new developments. Affordable housing was the highest ranked form of assistance in the survey. Other creative solutions to housing, such as artist-specific housing, have been executed in the City with varying degrees of success, but supply is far lower than demand. New Orleans is hardly alone in its struggle to lower rents and improve neighborhoods without displacing current residents. Government and community solutions will be needed to properly address this issue. In interviews and in the survey, one training element mentioned by almost everyone was training in business skills, specifically Financial Planning and Management. Other entrepreneurial skills were also in demand. A city like New Orleans is attractive to tourists and the local population largely because of its culture. Cultural workers are one part of the cultural landscape that needs to function to create a vibrant sector and city as a whole. Cultural institutions, businesses, non-profits, culture bearers, art education programs, and much more work together to preserve and grow local culture. This survey has introduced some issues and realities of cultural workers and will help shape economic development policies moving forward. We want to strongly encourage other cities to explore their cultural landscape holistically, and create an array of policies and tools for cultural workers and businesses, not just for an industry sector or for employers.
What skills would be most helpful?
Financial planning and management 24.02%
Marketing and promotion 18.14%
Business incorporation and management 12.25%
Website development 16.17%
Email usage 10.29%
Social media training (Facebook, Twitter, etc.) 9.31%
Computer and software programs specific to your industry 4.41%
Business development tools and programs specific to your industry
5.39%
44
METHODOLOGY & SOURCES
METHODOLOGY
DEFINITION
The definition of the “cultural economy” used for this report is based on the one used in the 2014 update, which was an adaptation of the definition used in the 2005 Mt. Auburn Associates’ report, Louisiana: Where Culture Means Business. Mt. Auburn developed six broad segments to describe the cultural economy in New Orleans: Culinary Arts, Entertainment, Preservation and heritage, Literary Arts, Design, and Visual Arts. In 2014, Mt. Auburn updated the cultural industries data definition to be compatible with 2012 NAICS codes, which EMSI switched to in the third quarter of 2014.18 Employment statistics in this update for the period 2002 to 2016 may vary from the statistics presented in previous updates because of the changes listed above and because EMSI revises its figures as more up-to-date data sets become available and as its algorithms change. For these reasons, the figures in this update should not be directly compared to those in previous updates.
EMPLOYMENT DATA SOURCES
The employment statistics and figures in this update are based on data from EMSI’s 4th Quarter 2016 release. EMSI’s dataset includes regular employment (wage and salary workers) as well as the self-employed. Self-employed workers include the self-employed proprietors counted in official census data as well as extended proprietorships—“workers who are counted as proprietors, but classify the income as peripheral to their primary employment.” In the cultural economy, extended proprietorships are generally people with “day jobs” who also do freelance work in a creative field. Unless otherwise noted, the statistics in this report include both self-employed workers and wage and salary employees. It is important to note that all of the job figures in this report represent direct employment within a given cultural industry or occupation—there are no spending multipliers or other measures of indirect impact being included. Also, this report presents data on workers in cultural occupations who work for employers outside the cultural industries. Most economic studies of the creative sector look only at industry employment, so they miss out on all the cultural workers who work in other sectors. In the following cases, Mt. Auburn made adjustments to the raw EMSI data in order to reach better estimates of cultural employment in cases where a category was too general:
1. Including just 30 % of the jobs in the construction-related industry and occupation codes that are part of the Preservation and heritage segment in order to exclude work unrelated to historic Preservation (a conservative estimate according to past interviews);
18 Because some of the data sources used by EMSI have a significant lag, their updates can have a major effect on its employment figures as far as three years back.

45
2. Counting only 80 % of the employment in “cafeterias, buffets, and grill buffets” and “full-service restaurants” in order to eliminate jobs at non-local chain restaurants from the Culinary segment (an estimate based on past survey information);
3. Including just 70 % of drinking establishment employment as part of the Entertainment segment
(based on past inventories of establishments that hosted regular music or Entertainment);
4. Adding employment in the librarian, library technician, and library assistant occupations to the job count for cultural industries since nearly all library employment is counted as part of very broad government and education NAICS codes; and
5. Breaking out the large, catchall “independent artists, writers, and performers” industry into the
segments using EMSI’s staffing patterns data, which provide estimates of the distribution of occupations within an industry. All of the self-employment jobs were divided among the Design, Visual Arts, Entertainment, and Literary Arts segments in proportion to the number of jobs there were in the occupations associated with each segment. The very small number of wage and salary jobs in the industry were counted in the Entertainment sector since there is evidence to suggest that most of the businesses in this category are associated with the film and media industries.

46
CULTURAL INDUSTRIES: DATA DEFINITION
NAICS Industry Description
(* indicates industry not included in "core cultural industries")
Alteration
CULINARY ARTS
311230 Breakfast Cereal Manufacturing* N/A
311340 Nonchocolate Confectionery Manufacturing* N/A
311351 Chocolate and Confectionery Manufacturing from Cacao Beans* N/A
311352 Confectionery Manufacturing from Purchased Chocolate* N/A
311411 Frozen Fruit, Juice, and Vegetable Manufacturing* N/A
311412 Frozen Specialty Food Manufacturing* N/A
311421 Fruit and Vegetable Canning* N/A
311422 Specialty Canning* N/A
311423 Dried and Dehydrated Food Manufacturing* N/A
311512 Creamery Butter Manufacturing* N/A
311513 Cheese Manufacturing* N/A
311514 Dry, Condensed, and Evaporated Dairy Product Manufacturing* N/A
311520 Ice Cream and Frozen Dessert Manufacturing* N/A
311612 Meat Processed from Carcasses* N/A
311613 Rendering and Meat Byproduct Processing* N/A
311615 Poultry Processing* N/A
311710 Seafood Product Preparation and Packaging* N/A
311811 Retail Bakeries* N/A
311812 Commercial Bakeries* N/A
311813 Frozen Cakes, Pies, and Other Pastries Manufacturing* N/A
311821 Cookie and Cracker Manufacturing* N/A
311824 Dry Pasta, Dough, and Flour Mixes Manufacturing from Purchased
Flour*
N/A
311830 Tortilla Manufacturing* N/A
311911 Roasted Nuts and Peanut Butter Manufacturing* N/A
311919 Other Snack Food Manufacturing* N/A
311920 Coffee and Tea Manufacturing* N/A
311930 Flavoring Syrup and Concentrate Manufacturing* N/A
311941 Mayonnaise, Dressing, and Other Prepared Sauce Manufacturing* N/A
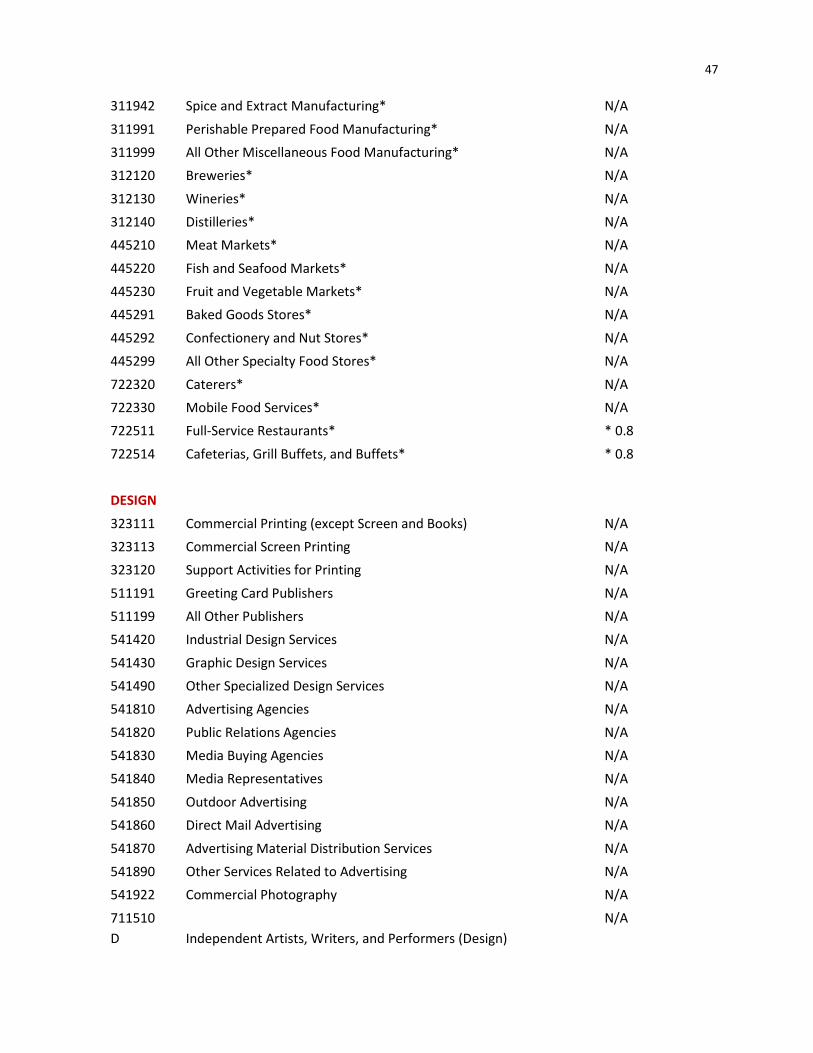
47
311942 Spice and Extract Manufacturing* N/A
311991 Perishable Prepared Food Manufacturing* N/A
311999 All Other Miscellaneous Food Manufacturing* N/A
312120 Breweries* N/A
312130 Wineries* N/A
312140 Distilleries* N/A
445210 Meat Markets* N/A
445220 Fish and Seafood Markets* N/A
445230 Fruit and Vegetable Markets* N/A
445291 Baked Goods Stores* N/A
445292 Confectionery and Nut Stores* N/A
445299 All Other Specialty Food Stores* N/A
722320 Caterers* N/A
722330 Mobile Food Services* N/A
722511 Full-Service Restaurants* * 0.8
722514 Cafeterias, Grill Buffets, and Buffets* * 0.8
DESIGN
323111 Commercial Printing (except Screen and Books) N/A
323113 Commercial Screen Printing N/A
323120 Support Activities for Printing N/A
511191 Greeting Card Publishers N/A
511199 All Other Publishers N/A
541420 Industrial Design Services N/A
541430 Graphic Design Services N/A
541490 Other Specialized Design Services N/A
541810 Advertising Agencies N/A
541820 Public Relations Agencies N/A
541830 Media Buying Agencies N/A
541840 Media Representatives N/A
541850 Outdoor Advertising N/A
541860 Direct Mail Advertising N/A
541870 Advertising Material Distribution Services N/A
541890 Other Services Related to Advertising N/A
541922 Commercial Photography N/A
711510
D Independent Artists, Writers, and Performers (Design)
N/A
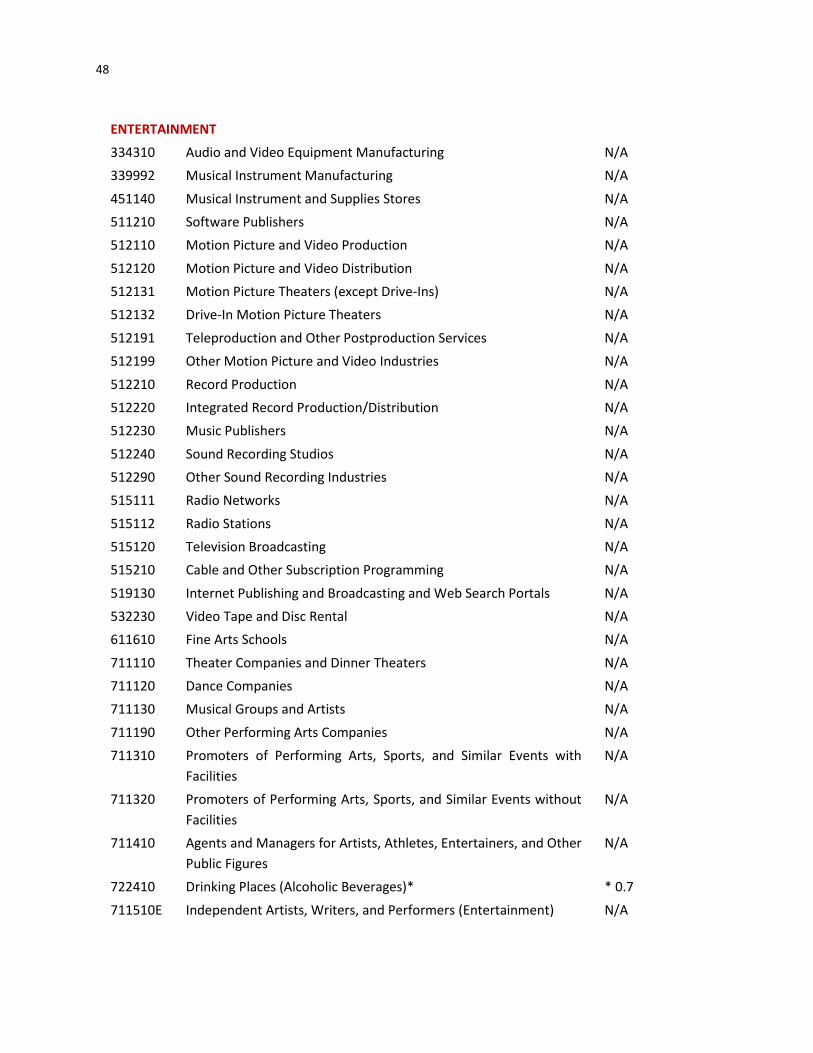
48
ENTERTAINMENT
334310 Audio and Video Equipment Manufacturing N/A
339992 Musical Instrument Manufacturing N/A
451140 Musical Instrument and Supplies Stores N/A
511210 Software Publishers N/A
512110 Motion Picture and Video Production N/A
512120 Motion Picture and Video Distribution N/A
512131 Motion Picture Theaters (except Drive-Ins) N/A
512132 Drive-In Motion Picture Theaters N/A
512191 Teleproduction and Other Postproduction Services N/A
512199 Other Motion Picture and Video Industries N/A
512210 Record Production N/A
512220 Integrated Record Production/Distribution N/A
512230 Music Publishers N/A
512240 Sound Recording Studios N/A
512290 Other Sound Recording Industries N/A
515111 Radio Networks N/A
515112 Radio Stations N/A
515120 Television Broadcasting N/A
515210 Cable and Other Subscription Programming N/A
519130 Internet Publishing and Broadcasting and Web Search Portals N/A
532230 Video Tape and Disc Rental N/A
611610 Fine Arts Schools N/A
711110 Theater Companies and Dinner Theaters N/A
711120 Dance Companies N/A
711130 Musical Groups and Artists N/A
711190 Other Performing Arts Companies N/A
711310 Promoters of Performing Arts, Sports, and Similar Events with
Facilities
N/A
711320 Promoters of Performing Arts, Sports, and Similar Events without
Facilities
N/A
711410 Agents and Managers for Artists, Athletes, Entertainers, and Other
Public Figures
N/A
722410 Drinking Places (Alcoholic Beverages)* * 0.7
711510E Independent Artists, Writers, and Performers (Entertainment) N/A
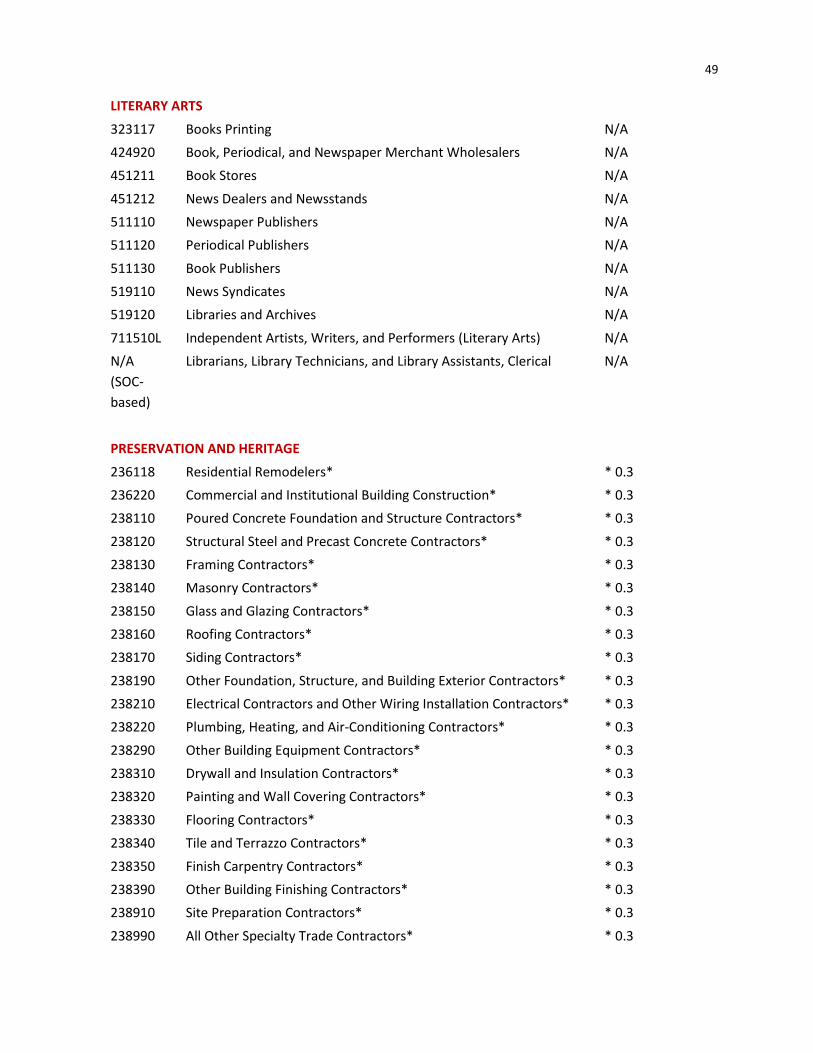
49
LITERARY ARTS
323117 Books Printing N/A
424920 Book, Periodical, and Newspaper Merchant Wholesalers N/A
451211 Book Stores N/A
451212 News Dealers and Newsstands N/A
511110 Newspaper Publishers N/A
511120 Periodical Publishers N/A
511130 Book Publishers N/A
519110 News Syndicates N/A
519120 Libraries and Archives N/A
711510L Independent Artists, Writers, and Performers (Literary Arts) N/A
N/A
(SOC-
based)
Librarians, Library Technicians, and Library Assistants, Clerical N/A
PRESERVATION AND HERITAGE
236118 Residential Remodelers* * 0.3
236220 Commercial and Institutional Building Construction* * 0.3
238110 Poured Concrete Foundation and Structure Contractors* * 0.3
238120 Structural Steel and Precast Concrete Contractors* * 0.3
238130 Framing Contractors* * 0.3
238140 Masonry Contractors* * 0.3
238150 Glass and Glazing Contractors* * 0.3
238160 Roofing Contractors* * 0.3
238170 Siding Contractors* * 0.3
238190 Other Foundation, Structure, and Building Exterior Contractors* * 0.3
238210 Electrical Contractors and Other Wiring Installation Contractors* * 0.3
238220 Plumbing, Heating, and Air-Conditioning Contractors* * 0.3
238290 Other Building Equipment Contractors* * 0.3
238310 Drywall and Insulation Contractors* * 0.3
238320 Painting and Wall Covering Contractors* * 0.3
238330 Flooring Contractors* * 0.3
238340 Tile and Terrazzo Contractors* * 0.3
238350 Finish Carpentry Contractors* * 0.3
238390 Other Building Finishing Contractors* * 0.3
238910 Site Preparation Contractors* * 0.3
238990 All Other Specialty Trade Contractors* * 0.3
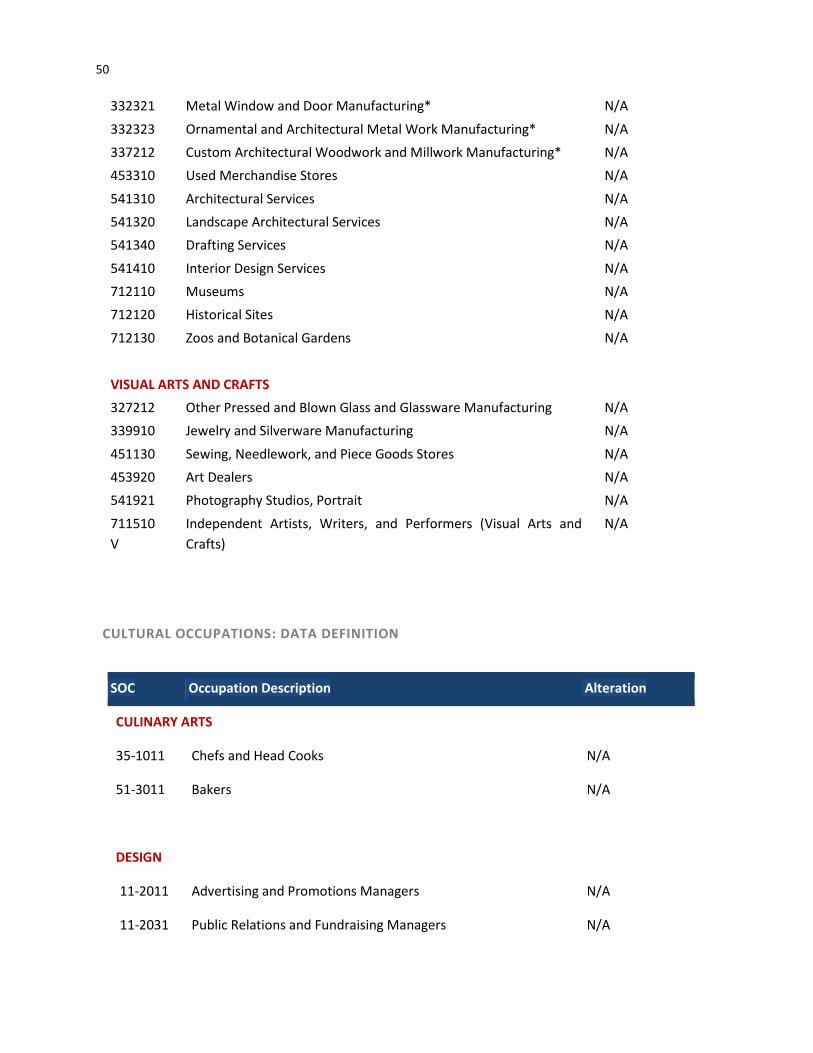
50
332321 Metal Window and Door Manufacturing* N/A
332323 Ornamental and Architectural Metal Work Manufacturing* N/A
337212 Custom Architectural Woodwork and Millwork Manufacturing* N/A
453310 Used Merchandise Stores N/A
541310 Architectural Services N/A
541320 Landscape Architectural Services N/A
541340 Drafting Services N/A
541410 Interior Design Services N/A
712110 Museums N/A
712120 Historical Sites N/A
712130 Zoos and Botanical Gardens N/A
VISUAL ARTS AND CRAFTS
327212 Other Pressed and Blown Glass and Glassware Manufacturing N/A
339910 Jewelry and Silverware Manufacturing N/A
451130 Sewing, Needlework, and Piece Goods Stores N/A
453920 Art Dealers N/A
541921 Photography Studios, Portrait N/A
711510
V
Independent Artists, Writers, and Performers (Visual Arts and
Crafts)
N/A
CULTURAL OCCUPATIONS: DATA DEFINITION
SOC Occupation Description Alteration
CULINARY ARTS
35-1011 Chefs and Head Cooks N/A
51-3011 Bakers N/A
DESIGN
11-2011 Advertising and Promotions Managers N/A
11-2031 Public Relations and Fundraising Managers N/A
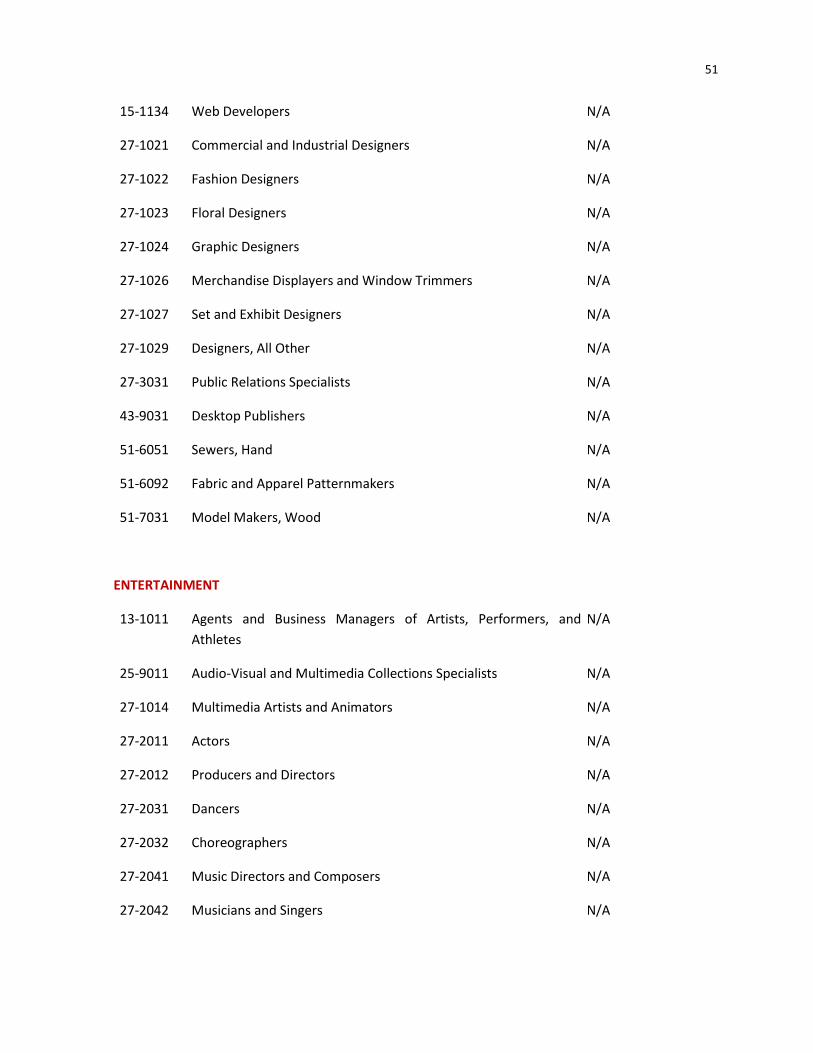
51
15-1134 Web Developers N/A
27-1021 Commercial and Industrial Designers N/A
27-1022 Fashion Designers N/A
27-1023 Floral Designers N/A
27-1024 Graphic Designers N/A
27-1026 Merchandise Displayers and Window Trimmers N/A
27-1027 Set and Exhibit Designers N/A
27-1029 Designers, All Other N/A
27-3031 Public Relations Specialists N/A
43-9031 Desktop Publishers N/A
51-6051 Sewers, Hand N/A
51-6092 Fabric and Apparel Patternmakers N/A
51-7031 Model Makers, Wood N/A
ENTERTAINMENT
13-1011 Agents and Business Managers of Artists, Performers, and
Athletes
N/A
25-9011 Audio-Visual and Multimedia Collections Specialists N/A
27-1014 Multimedia Artists and Animators N/A
27-2011 Actors N/A
27-2012 Producers and Directors N/A
27-2031 Dancers N/A
27-2032 Choreographers N/A
27-2041 Music Directors and Composers N/A
27-2042 Musicians and Singers N/A

52
27-2099 Entertainers and Performers, Sports and Related Workers, All
Other
N/A
27-3011 Radio and Television Announcers N/A
27-3021 Broadcast News Analysts N/A
27-3022 Reporters and Correspondents N/A
27-3099 Media and Communication Workers, All Other N/A
27-4011 Audio and Video Equipment Technicians N/A
27-4012 Broadcast Technicians N/A
27-4014 Sound Engineering Technicians N/A
27-4031 Camera Operators, Television, Video, and Motion Picture N/A
27-4032 Film and Video Editors N/A
27-4099 Media and Communication Equipment Workers, All Other N/A
39-3092 Costume Attendants N/A
39-5091 Makeup Artists, Theatrical and Performance N/A
41-9012 Models N/A
49-9063 Musical Instrument Repairers and Tuners N/A
LITERARY ARTS
25-4021 Librarians N/A
25-4031 Library Technicians N/A
27-3041 Editors N/A
27-3043 Writers and Authors N/A
PRESERVATION AND HERITAGE
17-1011 Architects, Except Landscape and Naval N/A
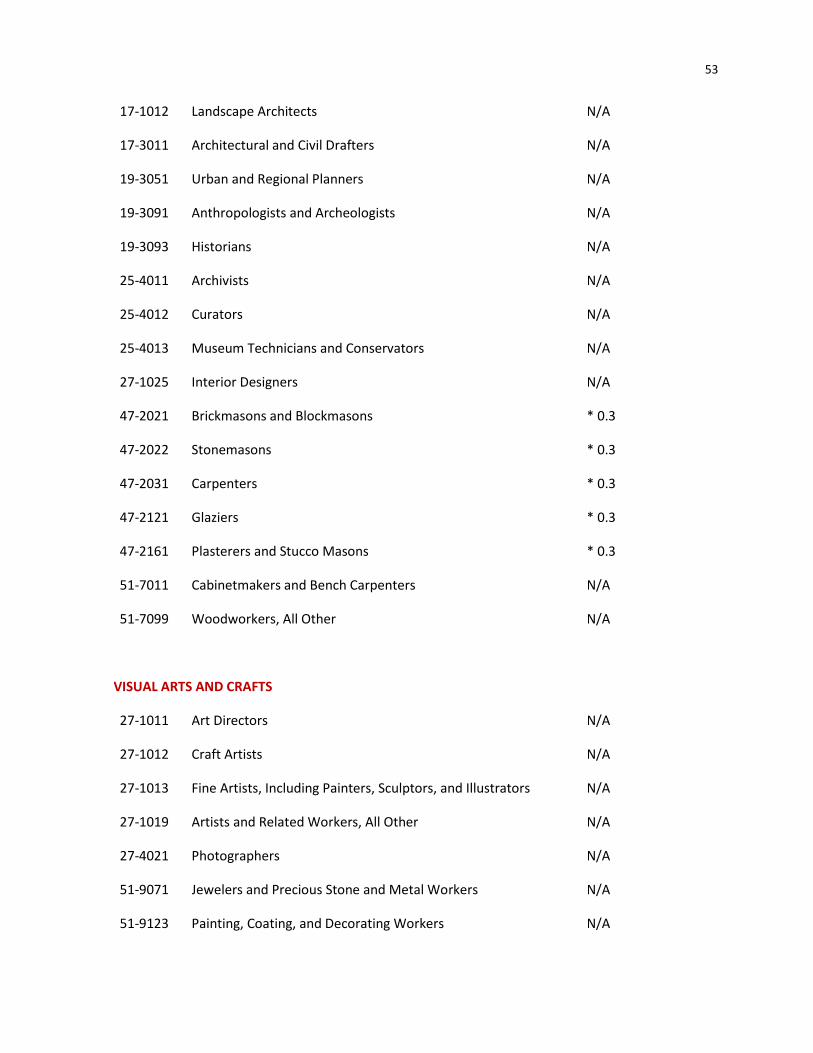
53
17-1012 Landscape Architects N/A
17-3011 Architectural and Civil Drafters N/A
19-3051 Urban and Regional Planners N/A
19-3091 Anthropologists and Archeologists N/A
19-3093 Historians N/A
25-4011 Archivists N/A
25-4012 Curators N/A
25-4013 Museum Technicians and Conservators N/A
27-1025 Interior Designers N/A
47-2021 Brickmasons and Blockmasons * 0.3
47-2022 Stonemasons * 0.3
47-2031 Carpenters * 0.3
47-2121 Glaziers * 0.3
47-2161 Plasterers and Stucco Masons * 0.3
51-7011 Cabinetmakers and Bench Carpenters N/A
51-7099 Woodworkers, All Other N/A
VISUAL ARTS AND CRAFTS
27-1011 Art Directors N/A
27-1012 Craft Artists N/A
27-1013 Fine Artists, Including Painters, Sculptors, and Illustrators N/A
27-1019 Artists and Related Workers, All Other N/A
27-4021 Photographers N/A
51-9071 Jewelers and Precious Stone and Metal Workers N/A
51-9123 Painting, Coating, and Decorating Workers N/A

54
51-9195 Molders, Shapers, and Casters, Except Metal and Plastic N/A
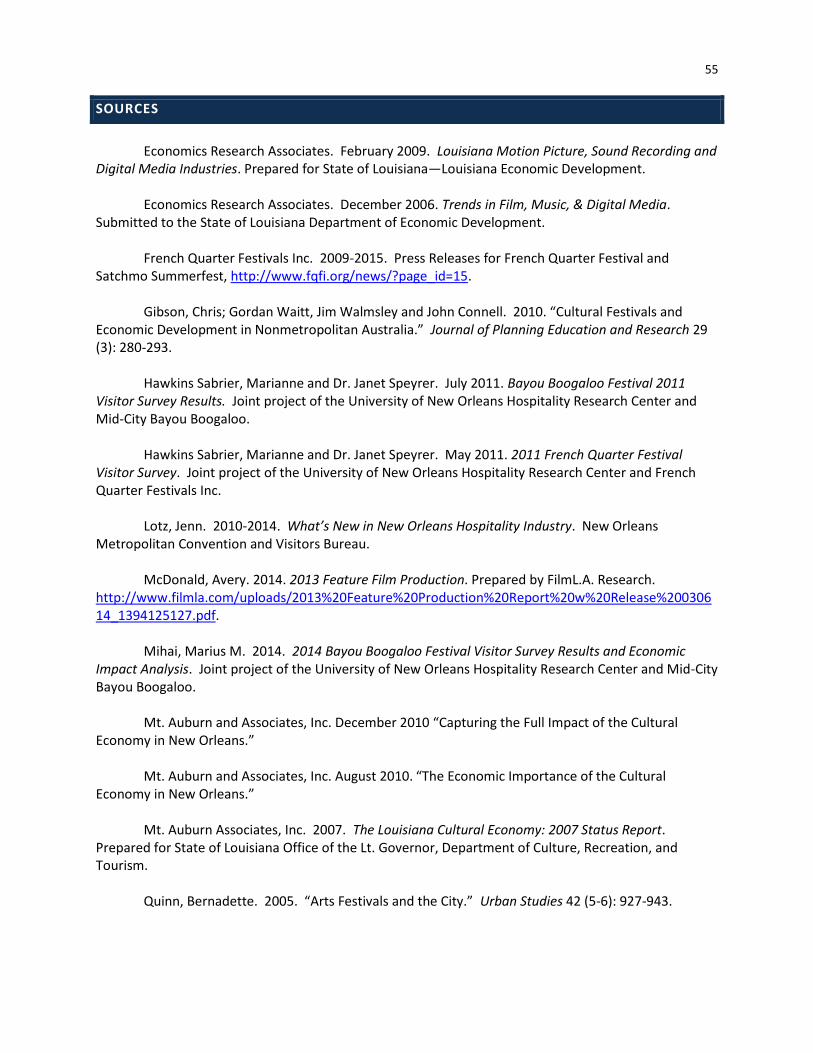
55
SOURCES
Economics Research Associates. February 2009. Louisiana Motion Picture, Sound Recording and
Digital Media Industries. Prepared for State of Louisiana—Louisiana Economic Development.
Economics Research Associates. December 2006. Trends in Film, Music, & Digital Media. Submitted to the State of Louisiana Department of Economic Development.
French Quarter Festivals Inc. 2009-2015. Press Releases for French Quarter Festival and Satchmo Summerfest, http://www.fqfi.org/news/?page_id=15.
Gibson, Chris; Gordan Waitt, Jim Walmsley and John Connell. 2010. “Cultural Festivals and Economic Development in Nonmetropolitan Australia.” Journal of Planning Education and Research 29 (3): 280-293.
Hawkins Sabrier, Marianne and Dr. Janet Speyrer. July 2011. Bayou Boogaloo Festival 2011
Visitor Survey Results. Joint project of the University of New Orleans Hospitality Research Center and Mid-City Bayou Boogaloo.
Hawkins Sabrier, Marianne and Dr. Janet Speyrer. May 2011. 2011 French Quarter Festival
Visitor Survey. Joint project of the University of New Orleans Hospitality Research Center and French Quarter Festivals Inc.
Lotz, Jenn. 2010-2014. What’s New in New Orleans Hospitality Industry. New Orleans
Metropolitan Convention and Visitors Bureau.
McDonald, Avery. 2014. 2013 Feature Film Production. Prepared by FilmL.A. Research. http://www.filmla.com/uploads/2013%20Feature%20Production%20Report%20w%20Release%20030614_1394125127.pdf.
Mihai, Marius M. 2014. 2014 Bayou Boogaloo Festival Visitor Survey Results and Economic
Impact Analysis. Joint project of the University of New Orleans Hospitality Research Center and Mid-City Bayou Boogaloo.
Mt. Auburn and Associates, Inc. December 2010 “Capturing the Full Impact of the Cultural Economy in New Orleans.”
Mt. Auburn and Associates, Inc. August 2010. “The Economic Importance of the Cultural
Economy in New Orleans.” Mt. Auburn Associates, Inc. 2007. The Louisiana Cultural Economy: 2007 Status Report. Prepared for State of Louisiana Office of the Lt. Governor, Department of Culture, Recreation, and Tourism.
Quinn, Bernadette. 2005. “Arts Festivals and the City.” Urban Studies 42 (5-6): 927-943.

56
Ray, S. 2010 Essence Music Festival Economic Impact Analysis Summary. Produced by Scott Ray & Associates, Inc. Distributed by Essence Festival Productions, LLC.
Ray, S. 2011 Essence Music Festival Economic Impact Analysis Summary. Produced by Scott Ray
& Associates, Inc. Distributed by Essence Festival Productions, LLC.
Ray, S. 2012 Essence Music Festival Economic Impact Analysis Summary. Produced by Scott Ray & Associates, Inc. Distributed by Essence Festival Productions, LLC.
Ray, S. 2013 Essence Music Festival Economic Impact Analysis Summary. Produced by Scott Ray
& Associates, Inc. Distributed by Essence Festival Productions, LLC. Ray, S. 2014 Essence Music Festival Economic Impact Analysis Summary. Produced by Scott Ray
& Associates, Inc. Distributed by Essence Festival Productions, LLC.
Seals, Chris. March 2010. Creative Class Market Research. RDA Global Inc., Prepared for New Orleans Downtown Development District.
Sidhu, Nancy, Kimberly Ritter, and Ferdinando Guerra. 2010. Otis Report on the Creative
Economy of the Los Angeles Region. Los Angeles County Economic Development Corporation. Prepared for Otis College of Art and Design.
Siegel, Beth, Michael Kane, and Beate Becker. July 2005. Louisiana: Where Cultural Means
Business. Mt Auburn Associates, Inc. Prepared for State of Louisiana Office of the Lt. Governor, Department of Culture, Recreation, and Tourism.
Spindt, Paul and Toni Weiss. 2009. The Economic Impact of the Mardi Gras Season on the New Orleans Economy and the Net Fiscal Benefit of Staging Mardi Gras for the City of New Orleans. Tulane University, Prepared for the Carnival Krewe Civic Fund.
Stern, Mark and Susan Seifert. January 2008. “From Creative Economy to Creative Society,” Creativity & Change. The Rockefeller Foundation. Tuennerman, Ann. 2009-2014. “Tales of the Cocktail New Orleans Fact Sheet,” Press Release from Tales of the Cocktail, http://www.talesofthecocktail.com/.
United Nations Conference on Trade and Development. 2009. “Chapter 3: Analyzing the Creative Economy,” Creative Economy Report 2008. University of New Orleans Hospitality Research Center. 2011. 2010 French Quarter Festival Visitor Survey. Requested by French Quarter Festivals, Inc. Released February 9, 2011 by Marci Schramm, Executive Director French Quarter Festival.
Weiss, Toni and the Freeman Consulting Group. 2015. The Economic Impact of the Mardi Gras Season on the New Orleans Economy and the Net Fiscal Benefit of Staging Mardi Gras for the City of New Orleans. Tulane University, Prepared for the Carnival Krewe Civic Foundation Inc.