2016 consolidated management report - repsol.com · other ways of creating value ... in particular,...
TRANSCRIPT

Translation of a report originally issued in Spanish.
In the event of a discrepancy, the Spanish language version prevails
REPSOL, S.A. and Investees comprising the Repsol Group
CONSOLIDATED MANAGEMENT REPORT 2016

Translation of a report originally issued in Spanish. In the event of a discrepancy, the Spanish language version prevails
2
INDEX 1. MAIN EVENTS OF THE PERIOD....................................................................................................................................... 3 2. OUR COMPANY .................................................................................................................................................................... 6
2.1. BUSINESS MODEL ................................................................................................................................. 6
2.2. CORPORATE STRUCTURE ................................................................................................................... 7
2.3. CORPORATE GOVERNANCE ............................................................................................................. 10
2.4. ETHICS AND COMPLIANCE .............................................................................................................. 12 3. MACROECONOMIC ENVIRONMENT ........................................................................................................................... 13 4. RESULTS, FINANCIAL OVERVIEW AND SHAREHOLDER REMUNERATION .................................................... 17
4.1. RESULTS ............................................................................................................................................... 17
4.2. FINANCIAL OVERVIEW ..................................................................................................................... 23
4.3. SHAREHOLDER REMUNERATION ................................................................................................... 25 5. PERFORMANCE BY BUSINESS AREAS ........................................................................................................................ 28
5.1. UPSTREAM ........................................................................................................................................... 28
5.2. DOWNSTREAM .................................................................................................................................... 41
5.3. CORPORATION AND OTHERS .......................................................................................................... 51 6. OTHER WAYS OF CREATING VALUE .......................................................................................................................... 53
6.1. PEOPLE .................................................................................................................................................. 53
6.2. SAFETY AND ENVIRONMENT .......................................................................................................... 60
6.3. TAXES .................................................................................................................................................... 66
6.4. RESEARCH, DEVELOPMENT AND INNOVATION (R+D+i) .......................................................... 70
6.5. SHAREHOLDERS AND INVESTORS ................................................................................................. 72
6.6. COMMUNICATION .............................................................................................................................. 72 7. OUTLOOK ............................................................................................................................................................................ 74
7.1 GENERAL OUTLOOK .......................................................................................................................... 74
7.2 OUTLOOK FOR BUSINESS ................................................................................................................. 76 8. RISKS .................................................................................................................................................................................... 78
8.1. RISK FACTORS ..................................................................................................................................... 78
8.2. RISK MANAGEMENT .......................................................................................................................... 86 APPENDIX I: ALTERNATIVE PERFORMANCE MEASURES ............................................................................................... 89 APPENDIX II: CONVERSION TABLE AND ABBREVIATIONS ............................................................................................. 98 APPENDIX III: ANNUAL CORPORATE GOVERNANCE REPORT ...................................................................................... 99

Translation of a report originally issued in Spanish. In the event of a discrepancy, the Spanish language version prevails
3
1. SUMMARY OF THE MAIN EVENTS
In 2016, Repsol1 continued the process of transformation begun with the acquisition of Talisman2 and the approval of the 2016-2020 Strategic Plan3. This process has produced gains in efficiency and savings in operating costs and investments, along with synergies in integration of the businesses, and allowed for flexible management of the portfolio to order to divest from non-core assets.
These steps, coupled with the advantages of the company's integrated model, have highlighted Repsol's resilience and its ability to achieve quite healthy results even in the current environment of low crude oil and gas prices: net income of the year amounted to 1,736 million euros and the cash flow allowed for reducing the Group's net debt by 3,790 million euros from 2015.
RESULTS FOR THE PERIOD 4 Million euros 2016 2015 5 Variation
Upstream 52 (925) 977 Downstream 1,883 2,150 (267) Corporation and others (13) 627 (640)
Adjusted net income 1,922 1,852 70 Inventory effect 133 (459) 592 Special items (319) (2,791) 2,472 Net income 1,736 (1,398) 3,134 Upstream results show a significant improvement, with a return to profit despite the difficult price environment. This improvement was, in particular, driven by the increase in total average production (690 Mboe on 23% more than in 2015, mainly as a result of the contribution of ROGCI assets and the increases in Venezuela, Norway, Peru and Brazil) and increased operating efficiency and the reduction in exploration expenses, which far offset the adverse impact of the drop in crude oil and gas realization prices (14% in both cases).
In Downstream, the competitive advantages of our integrated business model and of the quality of our refining assets, the strong performance of Chemicals and the better results in commercial businesses helped mitigate the adverse impact of the worsening of the international environment of Refining and Gas & Power in North America.
The lower results in Corporation and others6 are mainly due to the absence of the exceptional financial gain in the Company’s dollar positions in 2015 arising from receipt of compensation for the expropriation of YPF.
Consequently, adjusted net income amounted to 1,922 million euros, 4% higher than in 2015.
The inventory effect, which reflects the impact of price changes on inventories7, was positive as a result of the gradual recovery in crude oil prices. 1 Henceforth, the names "Repsol," "Repsol Group" or "the company" are used interchangeably to refer to the company group consisting of
Repsol, S.A. and its subsidiaries, associates and joint ventures.
2 Acquisition of Talisman Energy Inc., now called Repsol Oil & Gas Canada Inc. (hereinafter “ROGCI”). 3 The 2016-2020 Strategic Plan was published in October 2015 (see section 7.2). 4 All the information presented throughout this section, unless expressly stated to the contrary, was prepared in accordance with the Group’s
reporting model, which is described in Note 2.3 “Segment reporting" in the financial statements for 2016. Some of the financial indicators used in this document are classified as alternative performance measures (APM) in accordance with the Guidelines of the European Securities Markets Authority (ESMA). See Appendix I, "Alternative Performance Measures," which includes the reconciliation between the adjusted figures and those corresponding to IFRS-EU financial information.
5 The 2015 figures include the necessary modifications due to changes in accounting policy in relation to capitalization of geology and geophysics costs (see note 2.1 "Comparative information" of the 2016 consolidated financial statements).
6 The segment Corporation and others includes the expenses of corporate centers in Madrid and Calgary, the company's financial result, results from the stake in Gas Natural Fenosa and others of lesser importance (consolidation adjustments, etc.).
7 See Appendix I on the definition of Alternative Performance Measures (APM).

Translation of a report originally issued in Spanish. In the event of a discrepancy, the Spanish language version prevails
4
The special items of the period mainly include the gains from divestments in non-core assets (737 million euros, especially the proceeds from the sale of 10% of Gas Natural Fenosa and the piped LPG in Spain), workforce restructuring costs (-393 million euros; notably the provision for the collective dismissal in Spain), devaluations and provisions for asset impairments.
In sum, the Group's 2016 net income amounted to a profit of 1,736 million euros, compared to -1,398 million euros in 2015.
The EBITDA for the period, 5,226 million euros, reflects savings generated by efficiency programs, and made it possible to significantly improve cash flow from operations which, together with the cash generated from the divestments and the reduction in investments within the framework of the Strategic Plan, enabled the company to meet debt service payments, maintain attractive return for its shareholders and reduce financial debt to 8,144 million euros, 32% less than that at the end of 2015.
OTHER EVENTS DURING THE PERIOD
Repsol provided remuneration to its shareholders under its "Repsol Flexible Dividend" program, which allows shareholders to choose to receive their compensation, in total or in part, in either new shares or cash. In 2016, it involved remuneration of €0.76 per share1.
At 2016 year-end, the Repsol share rose 33%, which is in line with the average 30% increase of its European peers, but significantly above the 2% drop in the Ibex-35 index.
In 2016 the company continued to take the steps necessary to carry out the workforce reduction of approximately 1,500 employees announced in the 2016-2020 Strategic Plan. In order to clear the way for the workforce adjustment in Spain and to fulfill the commitment to carry out the resizing in a responsible and agreed-upon manner, an agreement was reached in June with the workers’ representatives to implement a collective dismissal process.
Repsol has maintained its commitment to safety and the environment. With regard to employee accidents, both the Frequency Rate (FR) and the Total Frequency Rate (TFR) decreased compared to 2015. With regard to the environment, improvement actions were carried out in 2016 at our facilities which, in addition to reducing energy consumption, reduced CO2 emissions by 312 metric kilotons in equivalent operating conditions (386 metric kilotons of CO2 in 2015).
1 The figure includes the amount committed by Repsol's for the purchase of bonus shares in the two bonus issues of January and July 2016 (€0.466 and 0.292 gross per share, respectively).

Translation of a report originally issued in Spanish. In the event of a discrepancy, the Spanish language version prevails
5
MAIN FIGURES AND INDICATORS1 Results, financial overview and shareholder remuneration (1) 2016 2015
Macroeconomic environment 2016 2015
Results Brent ($/bbl) average 43.7 52.4 EBITDA 5,226 4,416 WTI ($/bbl) average 43.5 48.8 Adjusted net income 1,922 1,852 Henry Hub ($/MBtu) average 2.5 2.7 Net income 1,736 (1,398) Algonquin ($/MBtu) average 3.1 4.8 Earnings per share (€/share) 1.16 (0.96) Exchange rate ($/€) average 1.11 1.11 Capital employed (2) 39,255 40,697 ROACE (%) 5.8 3.0 Our business performance (1) 2016 2015 Financial overview Upstream Free cash flow (3) 4,323 1,371 Proven reserves (MMboe) 2,382 2,373 Net debt (ND) 8,144 11,934 Proven reserve-replacement ratio (%) 103 509 ND / EBITDA (x times) 1.6 2.7 Net daily liquids production (kbbl/d) 243 207 ND / Capital employed (%) 20.7 29.3 Net daily gas production (Mboe/d) 447 352 Debt interest / EBITDA (%) 8.2 10.0 Net daily hydrocarbon production (Mboe/d) 690 559 Shareholder remuneration Average crude oil price ($/bbl) 39.0 45.2 Shareholder remuneration (€/share) 0.76 0.96 Average gas price ($/kscf) 2.4 2.8 EBITDA 2,072 1,611 Main stock market indicators 2016 2015 Adjusted net income 52 (925) Share price at year-end (€/share) 13.42 10.12 Net investments (10) 1,889 11,370 Average share price (€/share) 11.29 14.77 Downstream Market capitalization at year-end (€ million) 19,669 14,172 Refining capacity (kbbl/d) 1,013 998 Conversion ratio in Spain (%) 63 63 Other ways of creating value 2016 2015 Refining margin indicator in Spain ($/Bbl) 6.3 8.5 People Service stations (no.) (11) 4,715 4,716 Total employees (4) 26,877 29,494 Oil product sales (kt) 48,048 47,605 New employees (5) 2,445 6,159 Petrochemical product sales (kt) 2,892 2,822 Employee turnover rate (%) 13 7 LPG sales (12) (kt) 1,747 2,260 Hours of training per employee 41 45 Gas sales in North America (TBtu) 414 299 Tax paid (million euros)(6) 11,764 11,989 EBITDA 3,367 3,092 Safety Adjusted net income 1,883 2,150 Frequency Rate of accidents (7) 0.69 0.92 Net investments (10) (496) 493 Total Frequency Rate of accidents (8) 1.46 2.25 Environment Direct CO2 emissions (Mt) 19.69 17.89 Annual CO2 emissions reduction (Mt) (9) 0.312 0.386 No. of spills 11 21
(1) Where applicable, figure shown in million euros. (2) Capital employed from continuing operations. (3) In 2015 this did not include the acquisition price of ROGCI, net of the cash acquired. (4) Includes managed and non-managed workforce. (5) Only fixed or temporary employees with no prior working relationship with the company are considered to be new hires. The % of permanent
new hires in 2016 and 2015 amounts to 43% and 62%, respectively.
(6) This includes taxes paid which represents a cash expense for the company, thus reducing its earnings, as well as those withheld or passed on to the end taxpayer. Does not include amounts accrued payable at a future date or collected in previous periods. For further information, see section 6.3 of this document.
(7) Frequency Rate (FR) with sick leave: number of accidents leading to lost time and fatal accidents accumulated during the year, for every million hours worked.
(8) Total Frequency Rate (TFR): number of accidents without lost time, with lost time, and fatal accidents accumulated during the year, for every hour worked.
(9) CO2 emissions reduction achieved through the implementation of greenhouse gas reduction actions, compared to the 2010 baseline. (10) Net investments in operating asset divestments. (11) The number of service stations includes those controlled and licensed. (12) On April 20, 2016, an agreement was reached with the South American international operator, Abastible, for the sale of the LPG business in
Peru and Ecuador. The sale of the LPG business in Peru was finalized on June 1 and the LPG business in Ecuador was sold on October 1.
1 All the information presented throughout this section, unless expressly stated to the contrary, was prepared in accordance with the Group’s
reporting model, which is described in Note 2.3 "Segment reporting" in the financial statements corresponding to December 31, 2016. See definitions, composition and reconciliation of figures in Appendix I, "Alternative Performance Measures". On the calculation of figures for people, see section 6.1, and on that for safety and the environment, see 6.2.

Translation of a report originally issued in Spanish. In the event of a discrepancy, the Spanish language version prevails
6
2. OUR COMPANY
2.1. BUSINESS MODEL
Repsol is an integrated energy company with extensive experience in the industry, carrying out its activities on a global scale in two business areas:
Translation of a report originally issued in Spanish. In the event of a discrepancy, the Spanish language version prevails
7
Our vision is to be a global company that seeks individual welfare and believes in the building of a better future through the development of intelligent energy to offer better energy solutions. This vision is embodied in the company's core values:
Integrity: We care for the welfare of people, the company and the environment in which we operate, acting in accordance with the commitments we undertake.
Responsibility: We achieve our goals while considering the overall impact of our decisions and actions on people, the environment and the planet we inhabit.
Flexibility: Actively listening enables us to meet our goals in a fair and sustainable manner.
Transparency: We work under the maxim that all our actions should be reported truthfully, clearly and demonstrably, based on the premise that information is a company asset that generates value by being shared.
Innovation: We believe that the key to our competitiveness and progress lies in our ability to generate ideas and implement them in an environment of collective collaboration and continuous learning.
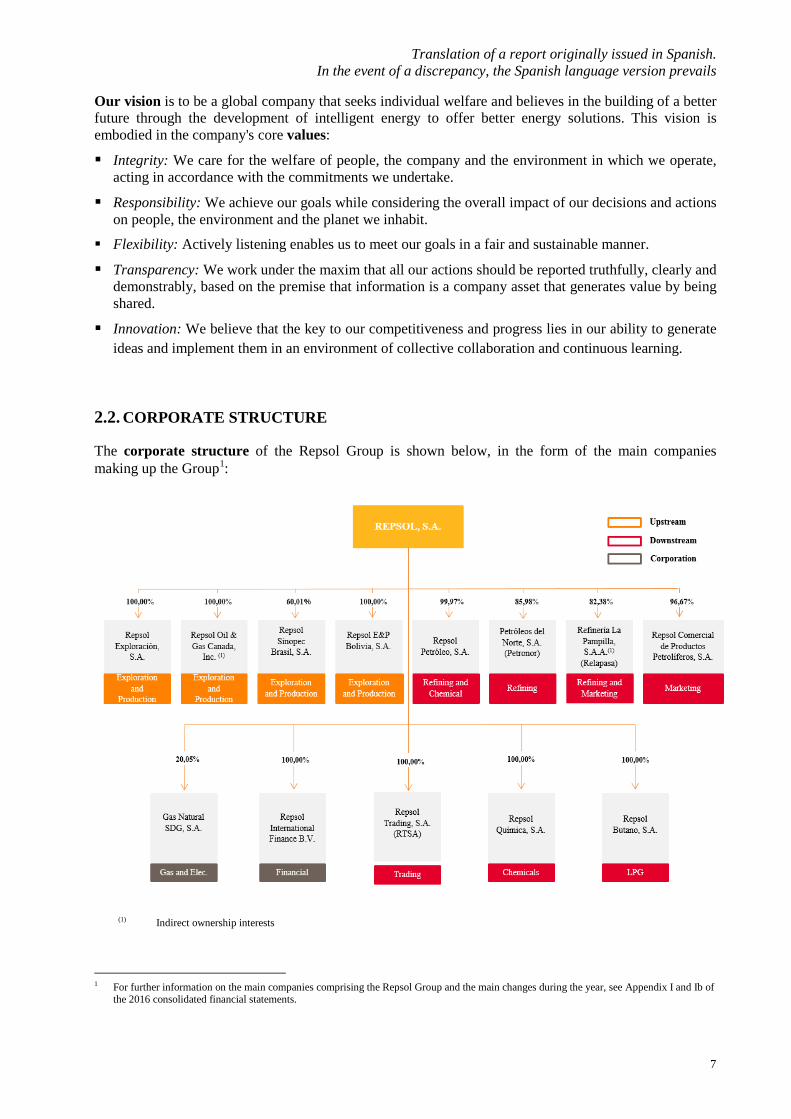
2.2. CORPORATE STRUCTURE
The corporate structure of the Repsol Group is shown below, in the form of the main companies making up the Group1:
(1) Indirect ownership interests
1 For further information on the main companies comprising the Repsol Group and the main changes during the year, see Appendix I and Ib of
the 2016 consolidated financial statements.
Translation of a report originally issued in Spanish. In the event of a discrepancy, the Spanish language version prevails
8
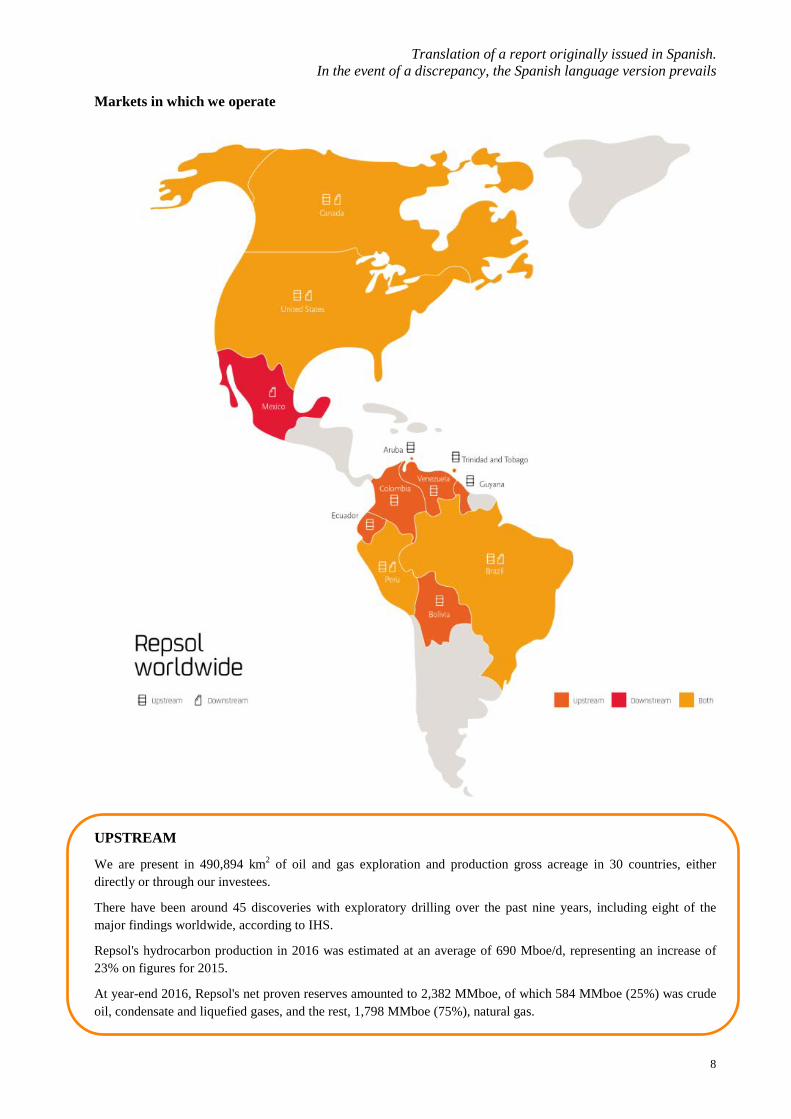
Markets in which we operate
UPSTREAM
We are present in 490,894 km2 of oil and gas exploration and production gross acreage in 30 countries, either directly or through our investees. There have been around 45 discoveries with exploratory drilling over the past nine years, including eight of the major findings worldwide, according to IHS. Repsol's hydrocarbon production in 2016 was estimated at an average of 690 Mboe/d, representing an increase of 23% on figures for 2015.
At year-end 2016, Repsol's net proven reserves amounted to 2,382 MMboe, of which 584 MMboe (25%) was crude oil, condensate and liquefied gases, and the rest, 1,798 MMboe (75%), natural gas.

Translation of a report originally issued in Spanish. In the event of a discrepancy, the Spanish language version prevails
9
Ventas (M iles de Tn) 2016 2015
48.048 47.605
GLP 1.747 2.260
DOWNSTREAM
Sales (Thousand Tn) 2016 2015
Oil products 48,048 47,605 Petrochemical products 2,892 2,822 LPG 1,747 2,260
Refining capacity
Primary distillation
(kbbl/d) Converison index (%)
Cartagena 220 76 A Coruña 120 66 Puertollano 150 66 Tarragona 186 44 Bilbao 220 63 La Pampilla (Perú) 117 24
Service stations (no.) 2016
Spain 3,501 Portugal 453 Peru 440 Italy 321
Petrochemical capacity (Thousand Tn)
Basic 2,603
Derivative 2,235

Translation of a report originally issued in Spanish. In the event of a discrepancy, the Spanish language version prevails
10
2.3. CORPORATE GOVERNANCE Repsol’s system of corporate governance, which was established in accordance with best national and international practice and standards, guides the structure, organization, and operation of its corporate bodies in the interests of the Company and of its shareholders, and is based on the principles of transparency, independence, and responsibility. For the internal regulations of the Repsol Group regarding corporate governance, see the website www.repsol.com.
The governance structure at Repsol adequately differentiates the Company’s governance and management functions from its oversight, control, and strategy functions.
(1) Chaired by the Chief Executive Officer (CEO). Includes Corporate Executive Directors, Business Executive Directors, and Corporate
Directors which report to the CEO. The Corporate Executive Committee oversees global strategies, company policies, and any other company-wide decisions.
(2) Chaired by the Chief Executive Officer (CEO), and comprising the Executive Director of E&P, Executive Directors that report directly to the Executive Director of E&P, and Corporate Executive Directors and Corporate Directors that report directly to the CEO and the Corporate Economic and Tax Director. The E&P Executive Committee is responsible for high-level Upstream business decisions.
(3) Chaired by the Chief Executive Officer (CEO), and comprising the Executive Director of Downstream, Executive Directors, and Executive
Directors that report directly to the Downstream Executive Director, Corporate Executive Directors, and Corporate Directors reporting directly to the CEO and the Corporate Economic and Tax Director. The Downstream E&P Executive Committee is responsible for high-level Downstream business decisions.
The General Shareholders’ Meeting is the sovereign corporate body through which shareholders intervene in the taking of essential decisions of the Company, with the Board of Directors, either directly or through its various Committees, responsible for the formulation of general policies, the strategy of the Company, and basic management directives, as well as general oversight and consideration of matters of special importance that are not reserved to General Shareholders’ Meeting.
The composition of the Board of Directors and its committees at the date of approval of this document is on the following page. On September 21, 2016 Isidro Fainé Casas tendered his resignation as a member of the Board of Directors; on September 28, the Board of Directors resolved, proposed by CaixaBank, S.A., to appoint by cooptation Antonio Massanell Lavilla as an external proprietary director of the Company to fill the vacancy caused by the resignation of Mr. Fainé, and to appoint Gonzalo Gortázar Rotaeche as First Vice Chairman of the Board of Directors.
With respect to the company's management structure, over which the CEO presides, there are three management bodies with full responsibilities over their respective areas: the Corporate Executive Committee, the E&P Executive Committee and the Downstream Executive Committee.

Translation of a report originally issued in Spanish. In the event of a discrepancy, the Spanish language version prevails
11
Composition of the Board of Directors and its Committees:
Note: See the Annual Corporate Governance Report for more information on the General Meeting, the Board of Directors and its committees. Updated information related to the profile of each member of the Board of Directors members can be found at www.repsol.es/es_es/corporacion/accionistas-inversores/gobierno-corporativo/. For further information on the Director’s remuneration, see "Remuneration Policy for the Directors", "Annual Report on the remuneration of Directors” and Note 27 "Remuneration of the Members of the Board of Directors and Executives" of the 2016 consolidated financial statements. (1) Chairman of the Delegate Committee. (2) Member of the Delegate Committee. (3) Executive Director. (4) Independent Non-Executive Director. (5) External Proprietary Director proposed by Caixabank, S.A. (6) External Proprietary Director proposed by Sacyr, S.A. (7) External Proprietary Director proposed by Temasek. (8) Chairman of the Audit and Control Committee. (9) Member of the Audit and Control Committee. (10) Chairman of the Nomination Committee and of the Remuneration Committee. (11) Member of the Nomination Committee. (12) Member of the Remuneration Committee. (13) Chairwoman of the Sustainability Committee. (14) Member of the Sustainability Committee. (15) Coordinating Director. (16) Percentage of share capital according to the latest information available at the date of this document. Information provided by Compañía
de Gestión de los Sistemas de Registro, Compensación y Liquidación de Valores, S.A.U. (Iberclear), and the information submitted by the shareholders of the Company and to the National Securities Market Commission (CNMV for its abbreviation in Spanish).
9.84%
8.20%
4.49%
77.47%Free float
Antonio Brufau Niubó(Chairman)(1) 07/23/96 04/30/15
Javier Echenique Landiríbar (Member)(4)(8)(14)06/16/0603/28/14
Antonio Massanell Lavilla (Member)(5)(11)(14) 09/28/16
Henri Philippe Reichstul (Member) (2)(4)12/29/0503/28/14
Mª Isabel Gabarró Miquel (Member)(4)(11)(12)(13)05/14/0905/31/13
Luis Carlos Croissier Batista (Member)(4)(9)(14)05/09/0704/30/15
Artur Carulla Font (Member)(2)(4)(10)(15)06/16/0603/28/14
Rene Dahan (Member)(2)(7) 05/31/13
Manuel Manrique Cecilia (Second Vice-chairman)(2)(6)04/25/1305/31/13
Date of the first appointment as Member of the Board of Directors.Date of the last appointment as Member of the Board of Directors.
Ángel Durández Adeva (Member)(4)(9)05/09//0704/30/15
Gonzalo Gortázar Rotaeche (Vicepresidente 1º)(2)(5)(12)04/30/1505/20/16
Mario Fernández Pelaz (Member)(4)(9)(11)(12)04/15/1104/30/15
J. Robinson West (Member) (2)(4)01/28/1504/30/15
Josu Jon Imaz (CEO)(2)(3)04/30/1404/30/15
José Manuel LouredaMantiñán (Member)(6)(11)(12)(14)01/31/0704/30/15
(16)
Luis Suárez de Lezo Mantilla (Director and General Counsel) (2)(3)02/02/0505/31/13

Translation of a report originally issued in Spanish. In the event of a discrepancy, the Spanish language version prevails
12
2.4. ETHICS AND COMPLIANCE The following events in ethics and compliance were significant in 2016: New Code of Ethics and Business Conduct On September 15, the new Code of Ethics and Business Conduct, approved by the Board of Directors, entered into force.
It is a global Code that applies to all Repsol directors, executive personnel and employees, regardless of the type of contract governing their professional or employment relationship. The Code aims to establish a framework of reference to understand and put into practice the behavior and expectations the company places in each employee in their day-to-day work, under the guidance of the values of the Group (integrity, responsibility, transparency, flexibility and innovation).
The Ethics Code is available on the corporate website, which is accessible at the following link: repsol.com/es_es/corporacion/responsabilidad-corporativa/nuestros-compromisos/etica-transparencia/codigo-etica-conducta/default.aspx.
New Repsol Ethics and Compliance Channel
The new Ethics and Compliance Channel was also launched on September 15. The channel allows employees or any third party to report, with absolute confidentiality, queries and possible breaches of the Code of Ethics and Business Conduct or the Crime Prevention Model.
The channel is accessible both by telephone and online in every country in which Repsol is present, in the local language, 24 hours a day, seven days a week, and it is managed by an external supplier (NAVEX Global).
The Ethics and Compliance Channel is accessible via: ethicscompliancechannel.repsol.com.
The availability of this channel to employees and third parties, aimed at facilitating as much as possible the reporting of concerns related to the Code of Ethics and Business Conduct, is a further illustration of the company's total commitment to fostering integrity and ethical conduct in all its activities.
Strengthening of Compliance Function Repsol has procedures and a global framework in place to ensure the appropriateness and observance of all its obligations, whether internal or external, in every regulatory area. Nevertheless, the Company sought to strengthen the compliance function by appointing a Chief Compliance Officer and creating a new Compliance Process Division, the purpose of which centers on overseeing compliance risks, fostering a preventive approach to compliance, disseminating a broader compliance culture and reinforcing management of ethics and conduct risks.
Crime Prevention Model As a Spanish company, and in accordance with Spanish regulation on the criminal liability of legal persons, the Group has designated the Ethics and Compliance Committee as a Crime Prevention Body. The Company has a Crime Prevention Model and an internal investigations procedure through which the crime prevention model and response mechanisms for potentially unlawful conduct is structured, related to, inter alia, ethical matters attributable to a legal person, with the aim of preventing and, at least, minimizing the risk of occurrence of such conduct.

Translation of a report originally issued in Spanish. In the event of a discrepancy, the Spanish language version prevails
13
3. MACROECONOMIC ENVIRONMENT RECENT ECONOMIC DEVELOPMENTS In 2016, the world economy experienced moderate growth of 3.1%, according to the latest estimates, which is 0.1 percentage points (p.p.) below the 3.2% growth of 2015. However, greater dynamism has been seen in recent months.
The improvement was driven by the emerging economies, which have benefited from a stabilization of the economy of China, a certain degree of recovery in commodity prices and the return of capital inflows. Further, in the advanced economies, a trend can be seen towards a more expansive fiscal policy, which may help open the way to an upturn in activity.
GDP
Source: International Monetary Fund (IMF, WEO Update January 2017) and Repsol Economic Research Department.
In the United States, growth in the first half of 2016 was disappointing, as the sluggishness of industrial activity put a brake on rising investment, which was also hit by the adjustment of the energy sector. However, activity significantly picked up from the third quarter, when it grew by 3.5% on the back of strong private consumption. In this context, after the Federal Reserve began in December 2015 a process of interest rate normalization, following years of near-zero rates, a further hike was postponed, although an interest rate increase ultimately occurred in December 2016, prompted by the recent rise in dynamism.
The Eurozone continued on the path towards recovery, with modest but stable growth for another year, at about 1.7% in 2016. Growth has been underpinned by lower energy prices, better financial conditions, a weaker euro driving exports, and the shift towards a more neutral fiscal stance. The strength of private consumption is now commensurate with the labor market recovery, and external demand is now making a positive contribution to growth. The absence of inflationary pressures led the European Central Bank (ECB) to extend, in early 2016, its stimulus measures by lowering to -0.4% the marginal deposit facility and extending its purchase program to corporate bonds. In its last meeting of the year, the ECB decided to extend the asset purchasing program until December 2017, while reducing the volume of purchases to a maximum of 60,000 million euros per month.
The Spanish economy continues to grow at a quicker pace than the Eurozone as a whole (in 3Q of 2016, it grew by 3.2% yoy). The improvements in the labor market and confidence are responsible for this growth differential. Although a certain exhaustion of some of the positive factors can be observed, which will lead to a gradual moderation, the outlook remains favorable. Economic growth in Spain shows a robust composition, with expansion not only in domestic consumption, but also in exports. In recent years, total volumes of exports of goods and services are showing growth above international trade levels.

Translation of a report originally issued in Spanish. In the event of a discrepancy, the Spanish language version prevails
14
DEVELOPMENTS IN ENERGY SECTOR
Crude oil - Brent In 2016, the average Brent crude oil price decreased 16% in comparison with 2015 average of $52.4 per barrel ($/bbl) to $43.7/bbl. The main cause of the fall in prices was the oversupply in the market, which caused by the actions of OPEC.
Brent and WTI prices
Source: Bloomberg and Repsol Economic Research Department.
On the demand side, 2016 saw healthy growth of 1.4%. Significant demand growth was seen in emerging countries like India, while there was also an upturn in demand in developed countries. On the supply side, one of the key factors was the substantial fall in non-OPEC oil output, which decreased by nearly a million barrels in the year to date. As a result, there is a significant difference between the pace of inventory buildup in 1Q of 2016 (more than a million bbl/d) and later in the year (200-500 thousand bbl/d). In fact, there may not have been a build-up in inventories in the third quarter of 2016. However, the increase in OPEC production in the year – with Iran alone adding nearly a million barrels a day (aggregate of crude and natural gas liquids) in October compared to the previous year, along with the recovery in production in Libya and Nigeria starting in September, meant that an additional 200,000 barrels a day being added to the market in the third quarter. OPEC's decision on November 30, 2016 to abandon the policy of defending market share and to cut production in order to support prices provided a stimulus to rebalance the market and reduce inventories throughout 2017. The following factors will also be important in the short and medium term: i) the response of US unconventional shale to the expected increase of prices, and ii) the effect of the drop in investment since 2015 on both OPEC and non-OPEC production.

Translation of a report originally issued in Spanish. In the event of a discrepancy, the Spanish language version prevails
15
Main milestones marking the price of Brent crude oil in 2016
Source: Bloomberg and Repsol Economic Research Department.
Natural Gas - Henry Hub In 2016, US Henry Hub (HH) gas averaged $2.5/MMBtu, 7% lower than in 2015. Generally, gas market fundamentals were weak in the first quarter of the year, leading HH in March to hit levels of $1.49/MMBtu, which has not been seen since December 1998. This easing of fundamentals was characterized by an oversupply situation that became evident in the high level of inventories: At the end of March, inventories were nearly 70% above the 2015 level, and more than 50% above the average level of the past five years. However, prices began to recover in the second quarter due to a gradual adjustment in the supply-demand equilibrium driven by the falling dry gas production in a context of healthy consumption, above all with respect to electricity demand. Hence, the US Energy Information Administration (EIA) estimates that 2016 was the first year in which gas-fired power generation exceeded coal-fired generation, thus accounting for 33% of total US generation compared to 30% for coal. The price recovery, which was affected by temperature forecasts, led HH to post a yearly high of $3.75/MMBtu on December 9, 2016.
Henry Hub prices
Source: Bloomberg and Repsol Economic Research Department

Translation of a report originally issued in Spanish. In the event of a discrepancy, the Spanish language version prevails
16
The equilibrium adjustment was also reflected in the level of inventories. A significant correction in inventories occurred in 2016: starting the year at 25% above the 2015 level, it ended up at 12% below the 2015 level in December. Injection volumes in 2016 were lower than the average of the past five years in the majority of weeks of the injection season. The injection season began in March (brought forward from its usual start in April) and lasted until November (it usually ends in October). The third withdrawal from storage during injection season since 2006 occurred on August 5. For 2017, the two aspects that may have the greatest effect on the price recovery are as follows: first, the evolution of domestic production; and, second, demand growth, both temperature-related and non-temperature related (industrial demand and exports). EXCHANGE RATE At the start of 2016, the euro reversed the slide against the dollar that had begun in the second half of 2014, shaped by the divergent monetary policy stances of the Federal Reserve and the European Central Bank. The backdrop of a slowdown in the US economy in the early part of the year and global uncertainty, which was greater at the start of the year, set back expectations of new rate hikes in the US. From the second quarter, the euro remained relatively stable, hovering at around 1.12. At the same time, the depreciation of emerging currencies, which was significant in 2015 in a context of lower export prices and doubts about China, bottomed out at the start of 2016. From the second quarter, most currencies tended to appreciate, driven by a return of capital inflows and better perspectives.
EUR/USD exchange rate (monthly average)
Source: Bloomberg and Repsol Economic Research Department
The trend towards an appreciation of the dollar returned in late 2016. Following Donald Trump's victory in the US elections, a larger fiscal stimulus has been priced in. This could lead to higher inflation, as the US is already in a mature cyclical position, and it has a labor market with nearly full employment. Hence, the new economic environment could be characterized by a return to monetary divergence between the leading central banks.

Translation of a report originally issued in Spanish. In the event of a discrepancy, the Spanish language version prevails
17
4. RESULTS, FINANCIAL OVERVIEW AND SHAREHOLDER REMUNERATION1
4.1. RESULTS Million euros 2016 2015 2 Variation
Upstream 52 (925) 977 Downstream 1,883 2,150 (267) Corporation and others (13) 627 (640)
Adjusted net income 1,922 1,852 70 Inventory effect 133 (459) 592 Special items (319) (2,791) 2,472 Net income 1,736 (1,398) 3,134 In spite of the significant recovery in 2016 of crude oil and gas prices from the lowest part of the cycle, the yearly results, compared to those of the previous year, are occurring in an environment featuring low crude and gas prices, tighter refining margins and adverse trends in the American Gas & Power domestic market. Against this backdrop, the Company, relying on the resilience of its integrated model, has continued to pursue its projects aimed at the enhancement of operating efficiency, realization of synergies, reduction of investment and active management of the portfolio, all within the scope of its 2016-2020 Strategic Plan. The net adjusted income of 2016 amounted to 1,922 million euros, 4% higher than in the same period of 2015. Highlights include the better income in Upstream which, in spite of the challenging price environment, continues on the recovery path (due to rising production and falling costs) which are partially offset by the lower income in Downstream and in Corporation.
Adjusted Net Income Variation 2016 vs. 2015
1 All the information presented throughout this section, unless expressly stated to the contrary, was prepared in accordance with the Group’s
reporting model, which is described in Note 2.3 “Segment reporting" in the financial statements corresponding to December 31, 2016. See definitions, composition and reconciliation of figures in Appendix I, "Alternative Performance Measures".
2 The comparative figures of 2015 presented throughout this section include the necessary modifications due to changes in the accounting policy in relation to capitalization of geology and geophysics costs (see Note 2.1 "Comparative information" of the 2016 consolidated financial statements).

Translation of a report originally issued in Spanish. In the event of a discrepancy, the Spanish language version prevails
18
EBITDA amounted to 5,226 million euros, compared to 4,416 million euros in the previous year, which represents a 18% increase, mainly driven by the contribution of assets from ROGCI (Upstream) and by the healthy performance of industrial businesses (Downstream). In 2016, optimization of investments continued, as did the divestment in non-core assets (approximately 3,650 million euros), thus generating value without foregoing opportunities for future growth.
Return on average capital employed (ROACE) amounted to 5.8%, which is 93% higher than in 2015, mainly due to the better results of the period.
Upstream
Total average output increased by 23%, up to an average in the year of 690 Mboe/d, mainly due to the contribution of ROGCI assets (113.4 Mboe/d up to May 8, 2016), the start of production of Cardon IV in Venezuela in the third quarter of 2015, the new wells in Sapinhoá Norte in Brazil, the addition of Gudrun, Norway, and the larger deliveries of gas in block 57 in Peru. These production gains, offset the lower output in the following countries: Trinidad and Tobago, due to maintenance stoppages and operational incidences in the fields; the United States resulting from the December 2015 sale of 26% of the stake in Eagle Ford and the natural decline of the fields, and in Colombia due to the lower demand for gas in Equion and the closure between March and October of the Akacias field because of low crude oil prices.
In the period, drilling was completed for 13 exploration wells and six appraisal wells. Of these, three had a positive results (all appraisal wells), 11 negative results (nine exploratory wells and two appraisal wells) and five remain under evaluation (four exploratory wells and one appraisal wells). In addition, one exploratory well in Rumania was under suspension and an appraisal well in Bolivia was in progress.
Crude oil and gas realization prices both decreased by 14%, respectively, as a result of the depressed international price environment.
The adjusted net income in Upstream in 2016 was 52 million euros, compared to -925 million euros in the same period of 2015. The positive effect of larger volumes sold, significant reductions in exploration expenses (due to fewer failed wells) and in operating costs (due to improved efficiency of operations) have offset the adverse impact of less income caused by low crude oil and gas prices. Amortization charges were also lower due mainly to the impairments recognized in the previous year. In comparing the results of 2016 and 2015, it must be noted that, ROGCI’s businesses have been consolidated since its acquisition May 8, 2015.
Upstream Adjusted Net Income Variation 2016 vs. 2015
(1) Mainly includes income tax expense and the effect of the exchange rate.

Translation of a report originally issued in Spanish. In the event of a discrepancy, the Spanish language version prevails
19
EBITDA amounted to 2,072 million euros, 29% higher than in 2015. Net investment (including assets from ROGCI) decreased by 83% from 2015, which mainly included the acquisition of ROGCI.
Gross investment was 80% lower than in 2015, which included the acquisition of ROGCI, mainly due to lower investment in assets under development in Latin America and North America, and in exploration in North America and Angola. Investment in development in 2016 was concentrated in Trinidad and Tobago, North America, Brazil, Algeria, the UK and Canada, and, in exploration, mainly in North America, Indonesia, Malaysia, Colombia, Bulgaria and Papua New Guinea.
Downstream
The adjusted net income in Downstream in 2016 was 1,883 million euros, 12% lower than in 2015. In spite of this decrease, which was as a result of the more adverse international environment of the Refining and Gas & Power businesses, note should be taken of the strong performance of Downstream businesses which, supported by the quality of our assets, have driven operating improvements and better active management of business opportunities. These results have kept Repsol in leadership positions among its European competitors in terms of margins of industrial and commercial businesses.
Downstream Adjusted Net Income Variation 2016 vs. 2015
Change in result due mainly to:
In refining, lower income arising from a reduction of the production margin (due to weaknesses of the spreads of mid distillates and the tightening of the spreads of heavy crude oils) and lower distillation volumes were partially offset by lower energy costs and a tax reduction in Spain.
Better income from higher commercial margins and growth in sales volumes in the chemicals business, driven by a favorable international environment, have been buoyed by lower stoppage-related costs and the reduction of Spanish taxes.
The lower income from the Trading business and the adverse trend in the US Gas & Power business in spite of the higher volume marketed, due to the mark-to-market valuation of products and derivatives, affected by low gas prices.
Better income in Commercial businesses, due to the lower costs in marketing, with sales volumes in service stations in Spain that are in line with those of the previous period, and due to the wider margins and an increase in volumes sold in Portugal. In addition, highlights included LPG revenue from indemnities for losses arising from the application of maximum commercial prices for regulated LPG containers in Spain.

Translation of a report originally issued in Spanish. In the event of a discrepancy, the Spanish language version prevails
20
EBITDA amounted to 3,367 million euros, which is 9% higher than in 2015. Net investment amounted to -496 million euros, including 587 million euros of divestment from piped gas assets in Spain, the LPG business of Peru and Ecuador, and the offshore wind power business in the United Kingdom. Investment decreased by 21% from 2015 (mainly in Chemicals and commercial businesses), with the principal investments made in the Cartagena and Petronor refineries in Spain, and in the La Pampilla refinery in Peru for adaptation to new specifications arising from the commencement of operation of the diesel block (project RLP21). Corporation and others In 2016, net adjusted income amounted to -13 million euros, which represents a decrease from the 627 million euros in the same period of 2015. This change is due mainly to lower finance income, which in 2015 included extraordinary income from the exchange rate effect on dollar positions as a result of receipt of compensation for the expropriation of YPF. The operating costs of the Corporation decreased from 2015 as a result of efficiency gains and synergies with ROGCI realized during the period, in spite of the addition of ROGCI’s operating costs in Calgary. Net income The effects of the following must be added to the adjusted net income (1,922 million euros):
Inventory effect: 133 million euros, compared to -459 in the previous year, as a result of the increase in crude oil prices.
Special items: -319 million euros after tax, mainly:
(i) Divestments (737 million euros): with results that were significantly better than those of the previous year, mainly due to the proceeds from the sale of piped gas assets in Spain (347 million euros), of 10% of Gas Natural Fenosa (226 million euros), of the offshore wind power business in the United Kingdom (101 million euros) and of the LPG business in Peru and Ecuador (81 million euros);
(ii) Workforce restructuring (-393 million euros): costs from workforce reduction as part of efficiency projects, including adjustments in the executive team;
(iii) Asset impairments and write-downs (-434 million euros): far lower than in 2015, when significant provisions were made to adjust assets' book value to the new low-price scenarios and that mainly affect assets in Venezuela (-192 million euros), Gas & Power North America (-112 million euros) and unconventional assets in North America (-90 million euros); and
(iv) Provisions and other (-229 million euros): mainly from the impacts of devaluation in Venezuela (-268 million euros), provisions for onerous contracts for the use of platforms and other E&P assets (-103 million euros), which were partially offset by the net changes in tax provisions (183 million euros).
Translation of a report originally issued in Spanish. In the event of a discrepancy, the Spanish language version prevails
21
Details of special items by item and segment are presented below:
As a result of the foregoing, net income in 2016 amounted to 1,736 million euros. Divestments Active management of the portfolio generated greater gains and significant cash flow from divestments:
In Upstream:
- The company Repsol E&P T&T Limited was sold to the Perenco group for 122 million euros, generating income before tax of 17 million euros, and
- The 3.06% stake in the integrated LNG project in West Papua, called Tangguh LNG, was sold to BP for 286 million euros, thus generating income before tax of 21 million euros.
In Downstream:
- Sale of the piped gas business to Gas Natural Distribución and to Redexis Gas (as part of agreements reached in 2015) and to the EDP Group, Gas Extremadura and Madrileña Red de Gas, for a total amount in the year of 737 million euros, generating an income before tax of 464 million euros.
- The offshore wind power business in the United Kingdom was sold to the Chinese group SDIC Power for 265 million euros, generating an income before tax of 101 million euros, and
- The LPG business in Ecuador and Peru was sold to the international South American operator Abastible for 269 million euros, generating an income before tax gain of 129 million euros
In Corporation and others, noteworthy was the sale of 10% of Gas Natural SDG, S.A. for 1,901 million euros to GIP III Canary 1 S.À.R.L, generating a pre-tax gain of 233 million euros.
Performance indicators
PERFORMANCE INDICATORS 2016 2015 Return on average capital employed (ROACE) (%) 5.8 3.0 Earnings per share (€/share) 1.16 (0.96)
As of December 31
Upstream Downstream Corporation and others TOTAL
Million euros 2016 2015 2016 2015 2016 2015 2016 2015 Divestments (26) 41 595 343 168 (20) 737 364 Workforce restructuring charges (68) (15) (156) (4) (169) (30) (393) (49)
Impairment (280) (2,762) (154) (312) - (45) (434) (3,119) Provisions and other (639) (90) (24) (8) 434 111 (229) 13 TOTAL (1,013) (2,826) 261 19 433 16 (319) (2,791)

Translation of a report originally issued in Spanish. In the event of a discrepancy, the Spanish language version prevails
22
Cash flow
Cash flows during the period are detailed below. The figures demonstrate the businesses' capacity to generate free cash flow in the today's complex environment, due to the quality of the company's assets and the reductions in costs and investments.
2016 2015 EBITDA 5,226 4,416 Changes in working capital (777) 1,486 Dividends received (1) 383 279 Income tax receipts/(payments) (283) (246) Other receipts/(payments) from operating activities (717) (422)
I. CASH FLOW FROM OPERATING ACTIVITIES 3,832 5,513
Payments on investments (3,157) (12,264) Proceeds from divestments 3,648 733
II. CASH FLOW FROM INVESTMENTS (2) 491 (11,531)
FREE CASH FLOW (I+II) 4,323 (6,018)
Dividend payments and remuneration from other equity instruments (420) (488) Net interest and leasing (657) (716)
CASH GENERATED DURING THE PERIOD 3,246 (7,222)
(1) Mainly includes receipt of dividends from Gas Natural Fenosa. (2) In 2016, it includes cash flow generated by the divestments described in this section. In 2015, it includes the investment in ROGCI of 8,005
million euros.
The operating cash flow, supported by a 18% increase of EBITDA resulting from the better operating result of Upstream, amounted to 3,832 million euros. The decrease from 2015 (-30%) is due mainly to the increase in working capital resulting from the increase in the prices of crude oil and products, and the increase in accounts receivable for sales of crude oil and gas in Venezuela. The cash flow from investment activities is positive (491 million euros), as a result of the significant savings in Upstream investment (2,343 million euros in 2016, compared to 11,175 million euros in 2015) and proceeds from divestments (3,648 million euros). It should be recalled that investment cash flow in 2015 included the payout for the purchase of Talisman (now ROGCI) of 8,005 million euros. As a result, free cash flow amounted to 4,323 million euros, which represents a very strong improvement (10,341 million euros) on 2015. Following payment of finance costs (-657 million euros) and shareholder remuneration and similar (-420 million euros), the company generated cash flow of 3,246 million euros. The increase in the cash generated by the businesses during the period, discipline in investments and liquidity obtained from divestments in the period enabled the Group to cover its net investment needs, make interest and dividend payments and reduce its net debt.
Translation of a report originally issued in Spanish. In the event of a discrepancy, the Spanish language version prevails
23
4.2. FINANCIAL OVERVIEW In 2016, in line with the Group's commitment to strengthening its financial position following the acquisition of ROGCI, various measures were implemented that enabled the Group to maintain its previous credit rating and to reduce its net debt by 32%. In line with its policy of financial prudence and its commitment to maintaining a high degree of liquidity, the funds held in cash by the Group at the end of the year and available credit lines amply exceed the maturity dates of its short-term debt.
Leverage
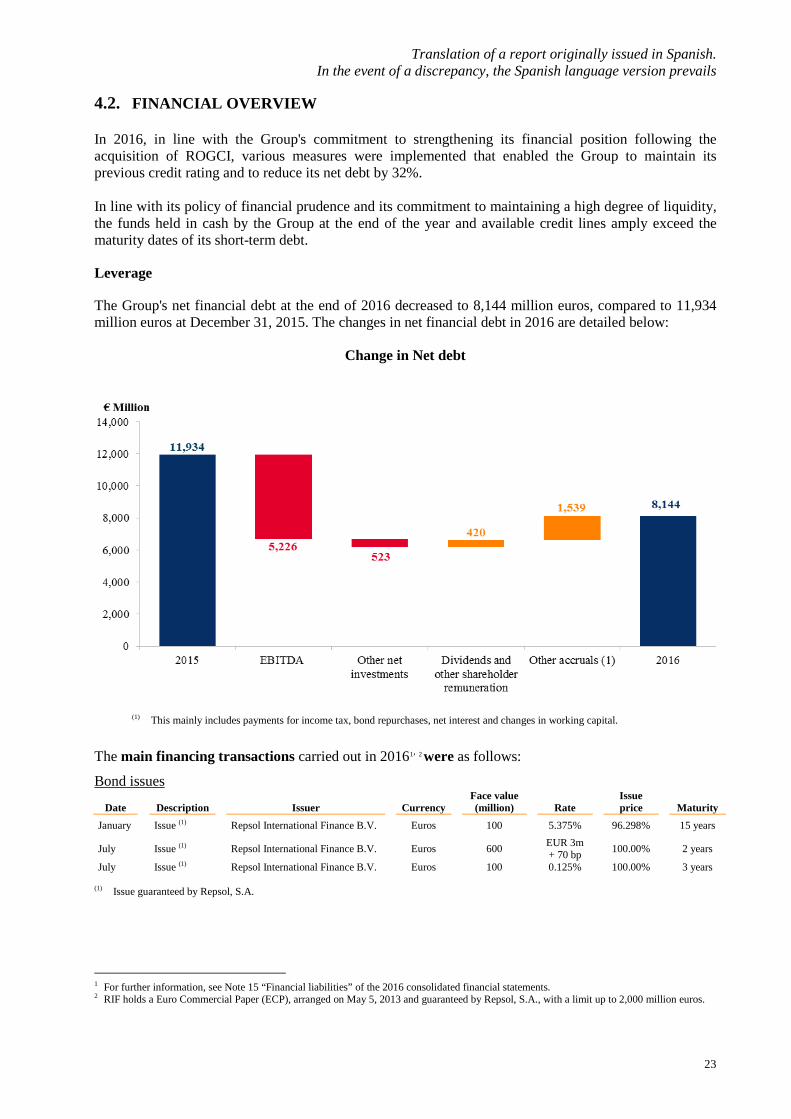
The Group's net financial debt at the end of 2016 decreased to 8,144 million euros, compared to 11,934 million euros at December 31, 2015. The changes in net financial debt in 2016 are detailed below:
Change in Net debt
(1) This mainly includes payments for income tax, bond repurchases, net interest and changes in working capital.
The main financing transactions carried out in 20161, 2 were as follows:
Bond issues
Date
Description
Issuer
Currency
Face value (million)
Rate
Issue price
Maturity
January Issue (1) Repsol International Finance B.V. Euros 100 5.375% 96.298% 15 years
July Issue (1) Repsol International Finance B.V. Euros 600 EUR 3m + 70 bp 100.00% 2 years
July Issue (1) Repsol International Finance B.V. Euros 100 0.125% 100.00% 3 years
(1) Issue guaranteed by Repsol, S.A.
1 For further information, see Note 15 “Financial liabilities” of the 2016 consolidated financial statements. 2 RIF holds a Euro Commercial Paper (ECP), arranged on May 5, 2013 and guaranteed by Repsol, S.A., with a limit up to 2,000 million euros.
Translation of a report originally issued in Spanish. In the event of a discrepancy, the Spanish language version prevails
24
Redemptions or bond repurchases (2)
Date
Description
Issuer
Currency
Nominal amount redeemed / Nominal amount repurchased
(million)
Rate
February
Redemption
Repsol International Finance, B.V.
Euros
850
5.13% March Redemption ROGCI Dollars 150 8.5%
(1)
Repurchase
ROGCI
Dollars
631
(1)
(1) In 2016 ROGCI carried out several bond repurchases for issues maturing in 2019, 2021, 2027, 2035, 2037, 2038 and 2042. (2) On February 16, 2017 a bond issued by RIF in February 2007 in the amount of 886 million euros, carrying a fixed annual coupon of 4.75%,
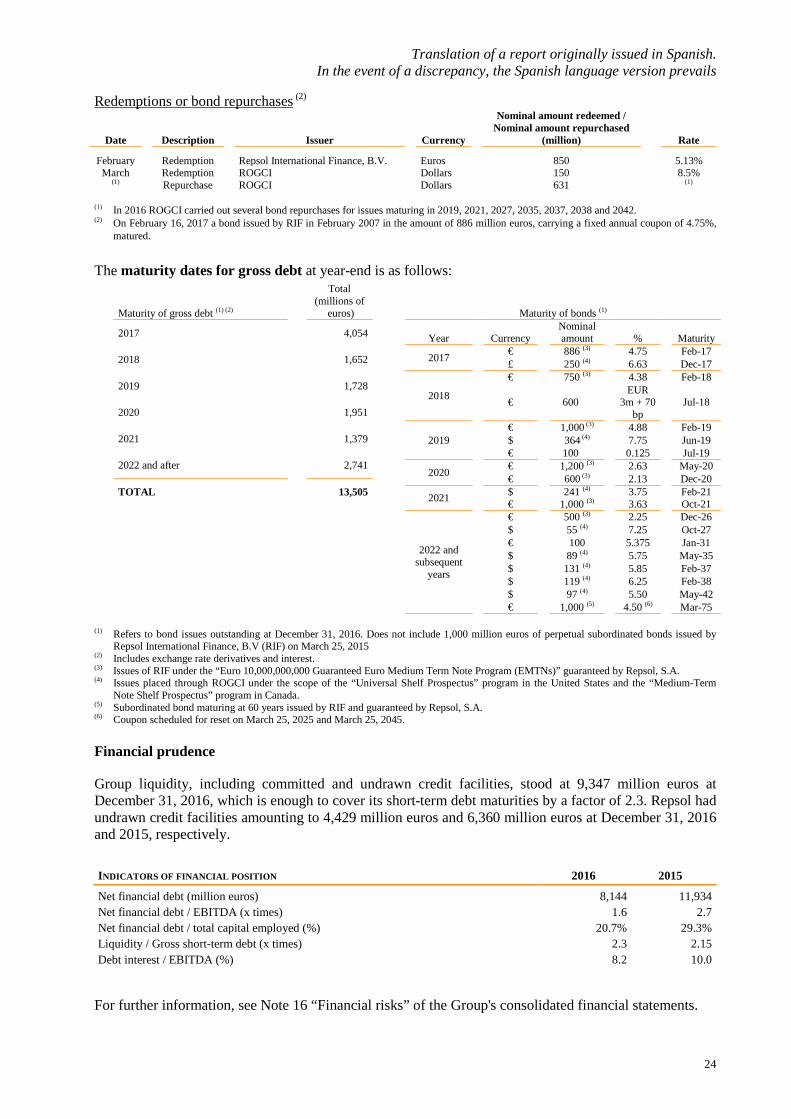
matured. The maturity dates for gross debt at year-end is as follows:
(1) Refers to bond issues outstanding at December 31, 2016. Does not include 1,000 million euros of perpetual subordinated bonds issued by
Repsol International Finance, B.V (RIF) on March 25, 2015 (2) Includes exchange rate derivatives and interest. (3) Issues of RIF under the “Euro 10,000,000,000 Guaranteed Euro Medium Term Note Program (EMTNs)” guaranteed by Repsol, S.A. (4) Issues placed through ROGCI under the scope of the “Universal Shelf Prospectus” program in the United States and the “Medium-Term
Note Shelf Prospectus” program in Canada. (5) Subordinated bond maturing at 60 years issued by RIF and guaranteed by Repsol, S.A. (6) Coupon scheduled for reset on March 25, 2025 and March 25, 2045.
Financial prudence
Group liquidity, including committed and undrawn credit facilities, stood at 9,347 million euros at December 31, 2016, which is enough to cover its short-term debt maturities by a factor of 2.3. Repsol had undrawn credit facilities amounting to 4,429 million euros and 6,360 million euros at December 31, 2016 and 2015, respectively. INDICATORS OF FINANCIAL POSITION 2016 2015
Net financial debt (million euros) 8,144 11,934 Net financial debt / EBITDA (x times) 1.6 2.7 Net financial debt / total capital employed (%) 20.7% 29.3% Liquidity / Gross short-term debt (x times) 2.3 2.15 Debt interest / EBITDA (%) 8.2 10.0
For further information, see Note 16 “Financial risks” of the Group's consolidated financial statements.
Maturity of bonds (1)
Year
Currency
Nominal amount
%
Maturity
2017 € 886 (3) 4.75 Feb-17
£ 250 (4) 6.63 Dec-17
2018 € 750 (3) 4.38 Feb-18
€ 600
EUR 3m + 70
bp Jul-18
2019 € 1,000 (3) 4.88 Feb-19
$ 364 (4) 7.75 Jun-19 € 100 0.125 Jul-19
2020 € 1,200 (3) 2.63 May-20
€ 600 (3) 2.13 Dec-20
2021 $ 241 (4) 3.75 Feb-21 € 1,000 (3) 3.63 Oct-21
2022 and subsequent
years
€ 500 (3) 2.25 Dec-26
$ 55 (4) 7.25 Oct-27 € 100 5.375 Jan-31
$ 89 (4) 5.75 May-35
$ 131 (4) 5.85 Feb-37
$ 119 (4) 6.25 Feb-38
$ 97 (4) 5.50 May-42
€ 1,000 (5) 4.50 (6) Mar-75
Maturity of gross debt (1) (2)
Total (millions of
euros)
2017
4,054
2018
1,652
2019
1,728
2020
1,951
2021
1,379
2022 and after
2,741
TOTAL
13,505

Translation of a report originally issued in Spanish. In the event of a discrepancy, the Spanish language version prevails
25
Credit rating At the date of preparation of this document, the credit ratings assigned to Repsol, S.A. by ratings agencies are as follows: STANDARD & POOR’S
MOODY’S
FITCH RATINGS
TERM Repsol, S.A. ROGCI
Repsol, S.A. ROGCI
Repsol, S.A. ROGCI
Long-term BBB- BBB- Baa2 Baa3 BBB BBB-
Short-term A-3 A-3 P-2 P-3 F-3 F-3
Outlook Negative Negative Negative Negative Negative Negative Last date of change 03/21/2016 03/21/2016 03/21/2016 03/21/2016 03/23/2016 03/23/2016
Treasury shares and own equity investments In 2016 no significant transactions involving treasury shares or own equity investments were performed:
No. of shares Million euros % capital
December 31, 2015
18,047,406 1,25%
Market purchases
21,693,728 254 1.45% Market sales
(39,740,591) (501) 2.66%
Other transactions
842,809 8 0.06%
December 31, 2016
94,185 0.01% For further information, see Note 13 “Equity” of the 2016 consolidated financial statements. Average payment period to suppliers The average payment period to suppliers for the Group's Spanish companies was 27 days in 2016, which is far below the maximum 60-day limit stipulated by Law 15/2010, of July 5 (amended by final provision two of Law 31/2014), which establishes measures to combat late payment in commercial transactions. For further information, see Note 19 “Trade and other payables” of the 2016 consolidated financial statements.
4.3. SHAREHOLDER REMUNERATION Repsol is committed to maintaining attractive returns for its shareholders, although it does not have a formal dividend distribution policy. Nonetheless, any shareholder remuneration to be distributed by Repsol, S.A. will depend on various factors, including the performance of its businesses and its operating results.
Translation of a report originally issued in Spanish. In the event of a discrepancy, the Spanish language version prevails
26
The remuneration received by shareholders in 2016 and 2015 under the “Repsol Flexible Dividend” program1 is as follows: Remuneration of €0.96/share for 2015. This includes the amount of the irrevocable commitment to
purchase free-of-charge allocation rights assumed by Repsol in the two capital increases concluded in January and July 2015 (€0.472 and €0.484 gross per right, respectively). In 2015, Repsol paid out a gross total of 488 million euros to shareholders and distributed 50,088,670 new shares, worth 814 million euros, to those shareholders opting to take their dividend in the form of new Company shares.
Remuneration of €0.76/share for 2016. This includes the amount of the irrevocable commitment to
purchase free-of-charge allocation rights assumed by Repsol in the two capital increases concluded in January and July 2016 (€0.466 and €0.292 gross per right, respectively). In 2016, Repsol paid out a gross total of 377 million euros to shareholders and distributed 65,283,041 new shares, worth 697 million euros, to those shareholders opting to take their dividend in the form of new Company shares.
In addition, in January 2017, under the “Repsol Flexible Dividend” program, replacing what would have been the interim dividend from 2016 profits, Repsol paid out 99 million euros in cash (0.335 euros gross per right) to those shareholders opting to sell their free-of-charge allocation rights back to the Company and delivered 30,760,751 shares, worth 392 million euros, to those opting to take their dividend in the form of new Company shares. At the date of the approval of these consolidated financial statements, it is expected that the Company's Board of Directors submit a proposal to the next Annual General Meeting to continue the “Repsol Flexible Dividend” program, through the implementation of a capital increase with full charge to reserves from retained earnings, on the same dates as those on which the Company has traditionally paid the final dividend. Our share price
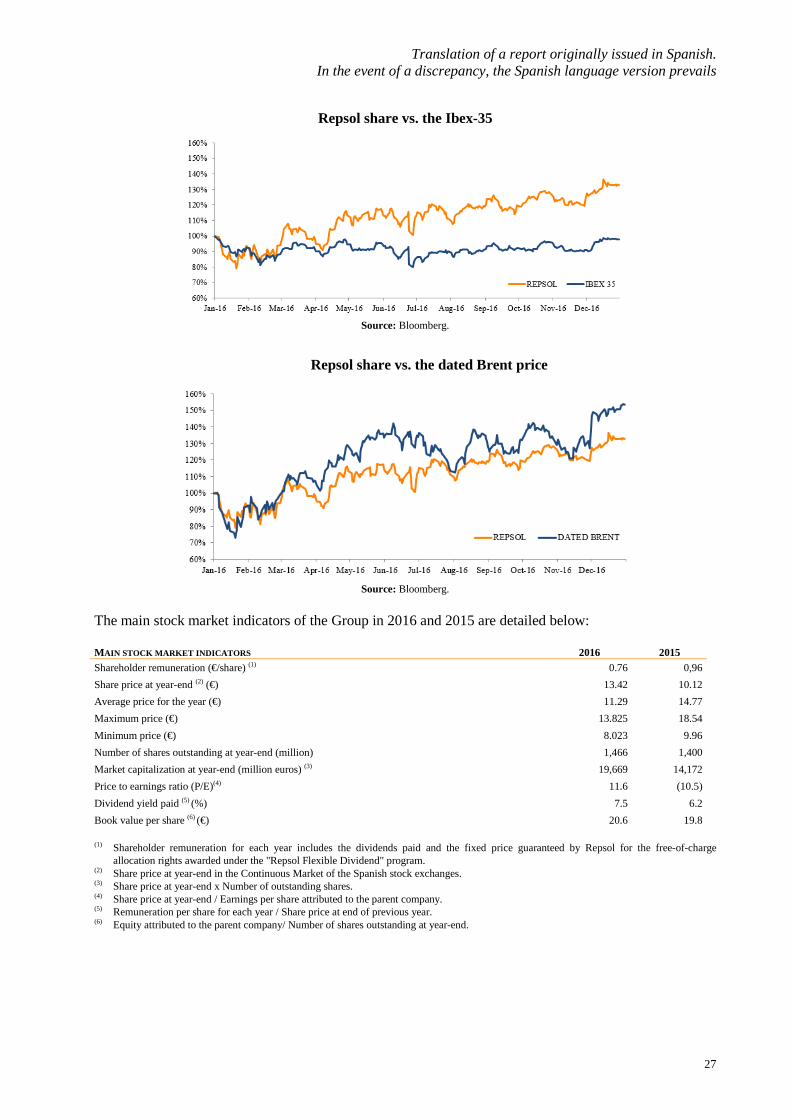
The Repsol share price rose by 33% in 2016, which is significantly above the 2% decline in the Ibex-35 index and higher than the average increase of 30% of its European peers. Although European markets were buoyed by the implementation of the European Central Bank's debt repurchase program (quantitative easing), macroeconomic factors mainly arising from the United Kingdom's referendum vote to leave the European Union reversed this trend toward the end of the first half of the year. The second half of the year was characterized, however, by a recovery in the main European indexes, which were positively influenced by the recovery in hydrocarbon prices following the preliminary agreement reached by OPEC in its Algiers meeting in late September. Despite the relative underperformance of the Ibex-35 compared to other European indexes, the Repsol share achieved the second-best performance for companies in the sector and closed the year 3% above the average attained by integrated European oil & gas companies. The recovery of crude oil prices, together with the progress made toward the targets of the Strategic Plan (in particular with regard to efficiency measures, the implementation of synergies and the divestment program) contributed to Repsol's positive stock market performance in 2016.
1 In 2012, Repsol launched, for the first time, the shareholder remuneration program called "Repsol Flexible Dividend". The program is
implemented through capital increases against voluntary reserves derived from retained earnings, with the irrevocable undertaking of Repsol, S.A. to purchase the resulting free share allotment rights at a guaranteed fixed price. This program allows shareholders the opportunity to receive their remuneration, in whole or in part, in new paid-up shares issued by the company or in cash by selling their free-of-charge share allotment rights, either on the market at the share trading price or to the company. For additional information on the total remuneration received by shareholders and the aforementioned capital increases issued under the “Repsol Flexible Dividend” program, see sections 13.1 “Share capital” and 13.4 “Dividends and shareholder remuneration” of Note 13 “Equity” of the 2016 consolidated financial statements.
Translation of a report originally issued in Spanish. In the event of a discrepancy, the Spanish language version prevails
27
Repsol share vs. the Ibex-35
Source: Bloomberg.
Repsol share vs. the dated Brent price
Source: Bloomberg.
The main stock market indicators of the Group in 2016 and 2015 are detailed below: MAIN STOCK MARKET INDICATORS 2016 2015 Shareholder remuneration (€/share) (1) 0.76 0,96 Share price at year-end (2) (€) 13.42 10.12
Average price for the year (€) 11.29 14.77 Maximum price (€) 13.825 18.54 Minimum price (€) 8.023 9.96 Number of shares outstanding at year-end (million) 1,466 1,400 Market capitalization at year-end (million euros) (3) 19,669 14,172 Price to earnings ratio (P/E)(4) 11.6 (10.5) Dividend yield paid (5) (%) 7.5 6.2 Book value per share (6) (€) 20.6 19.8
(1) Shareholder remuneration for each year includes the dividends paid and the fixed price guaranteed by Repsol for the free-of-charge
allocation rights awarded under the "Repsol Flexible Dividend" program. (2) Share price at year-end in the Continuous Market of the Spanish stock exchanges. (3) Share price at year-end x Number of outstanding shares. (4) Share price at year-end / Earnings per share attributed to the parent company. (5) Remuneration per share for each year / Share price at end of previous year. (6) Equity attributed to the parent company/ Number of shares outstanding at year-end.
Translation of a report originally issued in Spanish. In the event of a discrepancy, the Spanish language version prevails
28
5. PERFORMANCE BY BUSINESS AREAS
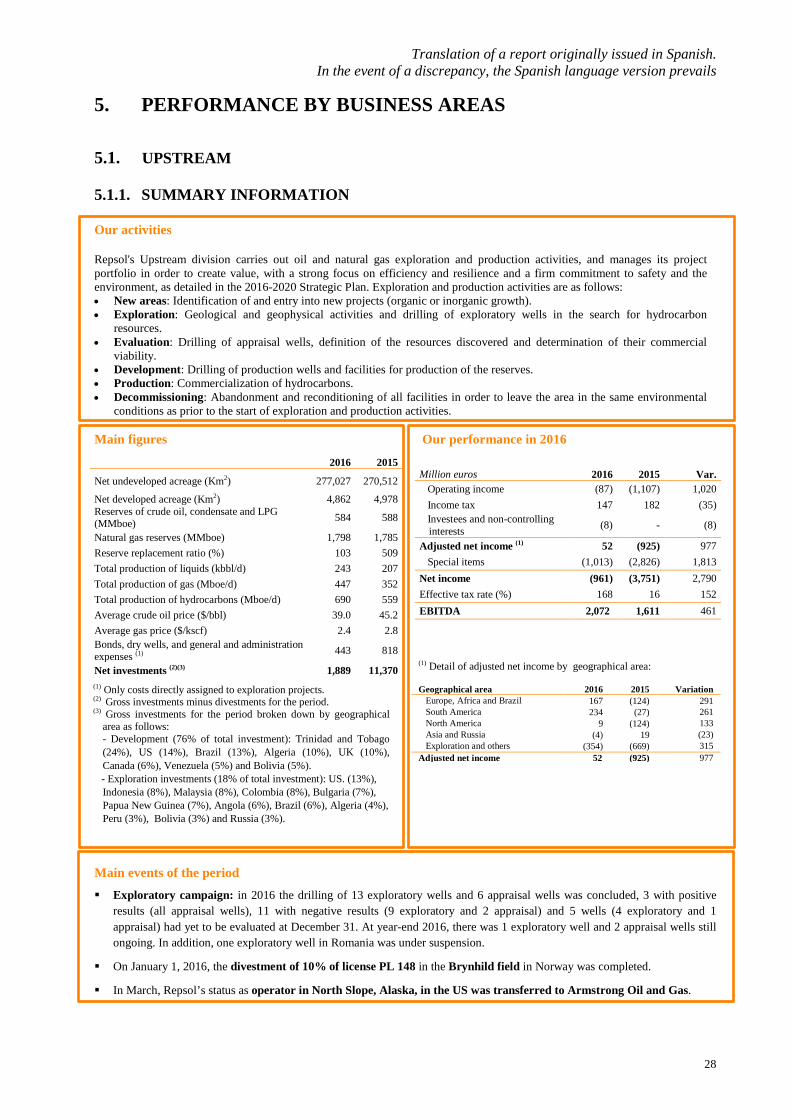
5.1. UPSTREAM 5.1.1. SUMMARY INFORMATION Our activities Repsol's Upstream division carries out oil and natural gas exploration and production activities, and manages its project portfolio in order to create value, with a strong focus on efficiency and resilience and a firm commitment to safety and the environment, as detailed in the 2016-2020 Strategic Plan. Exploration and production activities are as follows: • New areas: Identification of and entry into new projects (organic or inorganic growth). • Exploration: Geological and geophysical activities and drilling of exploratory wells in the search for hydrocarbon
resources. • Evaluation: Drilling of appraisal wells, definition of the resources discovered and determination of their commercial
viability. • Development: Drilling of production wells and facilities for production of the reserves. • Production: Commercialization of hydrocarbons. • Decommissioning: Abandonment and reconditioning of all facilities in order to leave the area in the same environmental
conditions as prior to the start of exploration and production activities. Main figures Our performance in 2016
Main events of the period Exploratory campaign: in 2016 the drilling of 13 exploratory wells and 6 appraisal wells was concluded, 3 with positive
results (all appraisal wells), 11 with negative results (9 exploratory and 2 appraisal) and 5 wells (4 exploratory and 1 appraisal) had yet to be evaluated at December 31. At year-end 2016, there was 1 exploratory well and 2 appraisal wells still ongoing. In addition, one exploratory well in Romania was under suspension.
On January 1, 2016, the divestment of 10% of license PL 148 in the Brynhild field in Norway was completed.
In March, Repsol’s status as operator in North Slope, Alaska, in the US was transferred to Armstrong Oil and Gas.
Million euros 2016 2015 Var. Operating income (87) (1,107) 1,020 Income tax 147 182 (35) Investees and non-controlling
interests (8) - (8)
Adjusted net income (1) 52 (925) 977 Special items (1,013) (2,826) 1,813 Net income (961) (3,751) 2,790 Effective tax rate (%) 168 16 152 EBITDA 2,072 1,611 461
2016 2015
Net undeveloped acreage (Km2) 277,027 270,512
Net developed acreage (Km2) 4,862 4,978 Reserves of crude oil, condensate and LPG (MMboe) 584 588
Natural gas reserves (MMboe) 1,798 1,785 Reserve replacement ratio (%) 103 509 Total production of liquids (kbbl/d) 243 207 Total production of gas (Mboe/d) 447 352 Total production of hydrocarbons (Mboe/d) 690 559 Average crude oil price ($/bbl) 39.0 45.2 Average gas price ($/kscf) 2.4 2.8 Bonds, dry wells, and general and administration expenses (1) 443 818
Net investments (2)(3) 1,889 11,370
(1) Only costs directly assigned to exploration projects. (2) Gross investments minus divestments for the period. (3) Gross investments for the period broken down by geographical
area as follows: - Development (76% of total investment): Trinidad and Tobago
(24%), US (14%), Brazil (13%), Algeria (10%), UK (10%), Canada (6%), Venezuela (5%) and Bolivia (5%).
- Exploration investments (18% of total investment): US. (13%), Indonesia (8%), Malaysia (8%), Colombia (8%), Bulgaria (7%), Papua New Guinea (7%), Angola (6%), Brazil (6%), Algeria (4%), Peru (3%), Bolivia (3%) and Russia (3%).
(1) Detail of adjusted net income by geographical area: Geographical area
2016
2015
Variation
Europe, Africa and Brazil 167 (124) 291 South America 234 (27) 261 North America 9 (124) 133 Asia and Russia (4) 19 (23) Exploration and others (354) (669) 315 Adjusted net income
52 (925) 977

Translation of a report originally issued in Spanish. In the event of a discrepancy, the Spanish language version prevails
29
In March. the MGR-7ST well began production in the Margarita-Huacaya field in Bolivia, which enabled it to reach production of 20 million cubic meters per day (Mm3/d) of gas, a volume which set a new production record for the asset.
In March the TIHS-2 appraisal drilling in the Sud-Est Illizi block in Algeria was completed with positive results.
The Colombian authorities (ANH) approved the temporary suspension of production at the CPO-9 (Akacias) field in Colombia for 6 months as a result of crude oil prices.
In the first quarter, two exploratory wells (Zoisit-1 and Baiduri-1) in Malaysia were completed, both with negative results.
On April 6, Repsol signed an agreement for a 10-year extension of production block PM3 CAA in Malaysia. The contract was therefore extended until 2027.
In April 14, it was announced that the Perla 9 offshore well, located in the Perla field in the Cardón IV block in Venezuela, began production. The Cardón IV block is 50% owned by Repsol and Eni.
On April 18, an important discovery was made in Brazil with the Gavea A1 appraisal well, in offshore block BM-C-33 in the Campos basin in Brazil.
In April, after the transport capacity of the TGP gas pipeline was expanded, the gas delivered from block 57 to block 56 would now increase from 85 Mscfd to 160 Mscfd in Peru.
In April operations in the western area of the Eagle Ford production asset in the US were transferred to Statoil, whereby this company is the operator of the entire asset as of that date.
In April the drilling of the P-7 appraisal well in Russia was completed, with positive results in the Karabasky field.
In May, the Cidade de Caraguatatuba FPSO (Floating Production Storage and Offloading) arrived in Brazil to begin production of the Lapa field in block BM-S-9 which was produced on December 19, 2016.
On June 1, operations in the Varg field in Norway were terminated.
In June, the Strickland-2 exploratory well in Papua New Guinea was completed with negative results and in December the Strickland-1 exploratory well was also completed with negative results.
In the second quarter, the drilling and completion work on the Perla 10 production well in the Cardón IV block was concluded. The Perla 10 well has a production capacity of more than 100 Mscfd.
In the second quarter, the Sagari 8D development well was completed and in the second half of the year the Sagari 7D well was completed as part of the development work to begin production of the Sagari discovery in block 57 (Peru).
In the second quarter, the WI-7 well in Shenzi was completed in the deepwaters of the US Gulf of Mexico for the purpose of increasing production levels in the southern area of the field.
In the second quarter, Repsol notified the US authorities that it would be withdrawing from all exploratory blocks in the Chuckchi Sea in which it held interests in Alaska.
In Canada, as part of the project to develop the Duvernay asset, four new development wells were drilled in the first half of the year.
On August 22, the production platform was successfully removed from the Yme field in Norwegian waters.
In August 2016 the P14N well entered into production in the northern area of Sapinhoá in Brazil.
On October 3, production resumed at the production area of the CPO-9 (Akacias) field in Colombia.
On October 27, it was announced that the President of Bolivia and Repsol signed an agreement to extend operations in Caipipendi for an additional 15 years, until 2046.
In October, an agreement was reached for the sale of the Teak, Samaan, and Poui (TSP) offshore assets in Trinidad and Tobago. The transaction was concluded with Perenco in December.
In October and November, the exploratory drilling at Andalusit-1 (Malaysia) and at Payero-1 (Colombia) was completed, respectively, with negative results.
In Indonesia, effective December 2, Repsol sold its ownership interest in the Wiriagar block to BP, including the 3.06% holding in the Tangguh LNG project.
In the last half of December, production resumed in Libya in several fields of block NC-115. On January 4, 2017, production was also resumed at the I/R field (Blocks NC-186 and NC-115).
Translation of a report originally issued in Spanish. In the event of a discrepancy, the Spanish language version prevails
30
5.1.2. UPSTREAM ACTIVITIES1
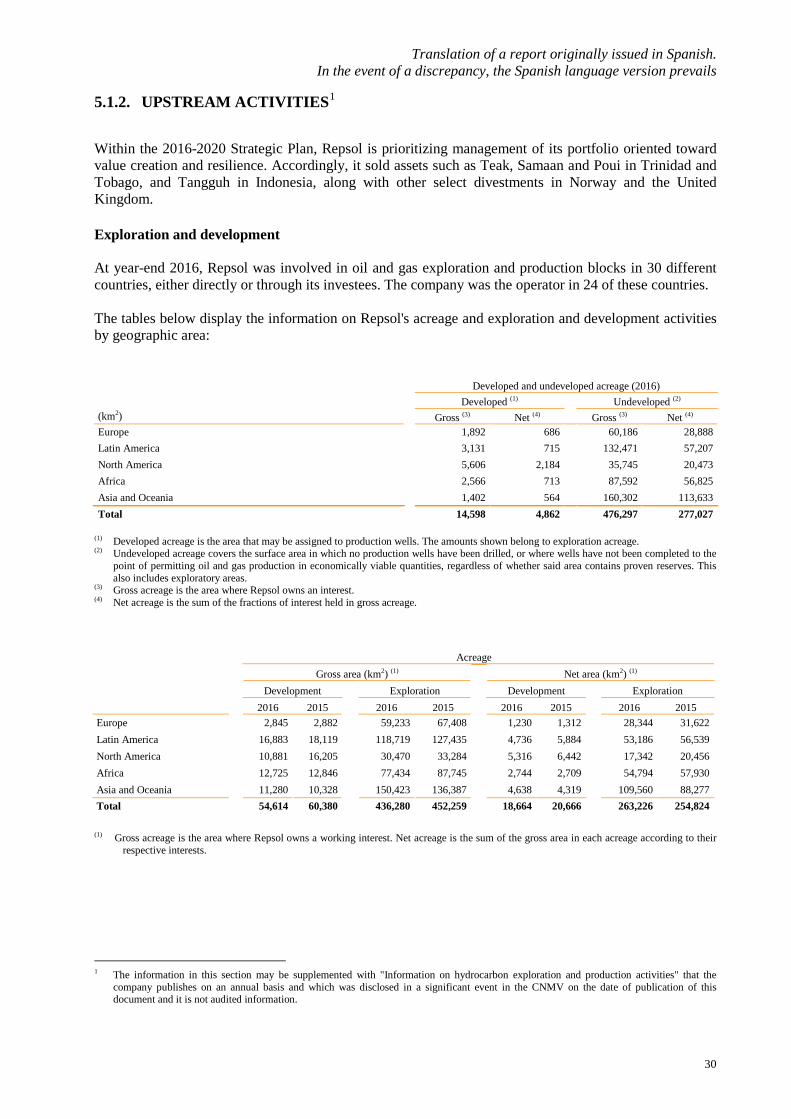
Within the 2016-2020 Strategic Plan, Repsol is prioritizing management of its portfolio oriented toward value creation and resilience. Accordingly, it sold assets such as Teak, Samaan and Poui in Trinidad and Tobago, and Tangguh in Indonesia, along with other select divestments in Norway and the United Kingdom. Exploration and development At year-end 2016, Repsol was involved in oil and gas exploration and production blocks in 30 different countries, either directly or through its investees. The company was the operator in 24 of these countries. The tables below display the information on Repsol's acreage and exploration and development activities by geographic area:
Developed and undeveloped acreage (2016)
Developed (1)
Undeveloped (2)
(km2)
Gross (3) Net (4)
Gross (3) Net (4) Europe
1,892 686 60,186 28,888
Latin America
3,131 715 132,471 57,207 North America
5,606 2,184 35,745 20,473
Africa
2,566 713 87,592 56,825 Asia and Oceania
1,402 564 160,302 113,633
Total
14,598 4,862 476,297 277,027 (1) Developed acreage is the area that may be assigned to production wells. The amounts shown belong to exploration acreage. (2) Undeveloped acreage covers the surface area in which no production wells have been drilled, or where wells have not been completed to the
point of permitting oil and gas production in economically viable quantities, regardless of whether said area contains proven reserves. This also includes exploratory areas.
(3) Gross acreage is the area where Repsol owns an interest. (4) Net acreage is the sum of the fractions of interest held in gross acreage.
(1) Gross acreage is the area where Repsol owns a working interest. Net acreage is the sum of the gross area in each acreage according to their
respective interests.
1 The information in this section may be supplemented with "Information on hydrocarbon exploration and production activities" that the
company publishes on an annual basis and which was disclosed in a significant event in the CNMV on the date of publication of this document and it is not audited information.
Acreage
Gross area (km2) (1)
Net area (km2) (1)
Development
Exploration
Development
Exploration
2016 2015
2016 2015
2016 2015
2016 2015
Europe
2,845 2,882
59,233 67,408
1,230 1,312 28,344 31,622
Latin America
16,883 18,119
118,719 127,435
4,736 5,884
53,186 56,539
North America
10,881 16,205 30,470 33,284
5,316 6,442
17,342 20,456
Africa
12,725 12,846 77,434 87,745
2,744 2,709
54,794 57,930
Asia and Oceania
11,280 10,328 150,423 136,387
4,638 4,319
109,560 88,277
Total
54,614 60,380 436,280 452,259
18,664 20,666
263,226 254,824

Translation of a report originally issued in Spanish. In the event of a discrepancy, the Spanish language version prevails
31
A representative figure is the number of wells finished in the year (13 in total) compared to the 19 carried out in the previous year. In 2014, prior to the buyout of ROGCI, 24 wells were made. That is, in 2016, 32% fewer wells were completed than in 2015, and 46% fewer than in 2014, when the blocks incorporated through the purchase of ROGCI had not yet become available.
(1) This does not include appraisal wells: in 2016, six appraisal wells were completed, three with a positive result, two negative and one under
evaluation, and two appraisal wells were ongoing. The Mashira 6X was declared negative although it was under way at 12.31.2016.
Finished development wells
Positive
Negative
Under evaluation
Total 2016 2015
2016 2015
2016 2015
2016 2015
Europe 3 4 - - - - 3 4 Latin America 52 62 2 3 7 5 61 70 North America 150 282 - 1 - 16 150 299 Africa 8 2 1 1 1 - 10 3 Asia and Oceania 46 43 - 3 - - 46 46 Total 259 393 3 8 8 21 270 422
Finished and ongoing exploratory wells (1)
Positive
Negative Under evaluation
Total
Ongoing
2016 2015
2016 2015 2016 2015
2016 2015
2016 2015
Europe
- -
- 6 1 - 1 6
1 1
Latin America
- -
2 2 - 1 2 3
1 1
North America
- 1
- 2 - - - 3
- -
Africa
- 2
1 3 1 - 2 5
- -
Asia and Oceania
- 1
6 - 2 1 8 2
- 2
Total
- 4
9 13 4 2 13 19
2 4
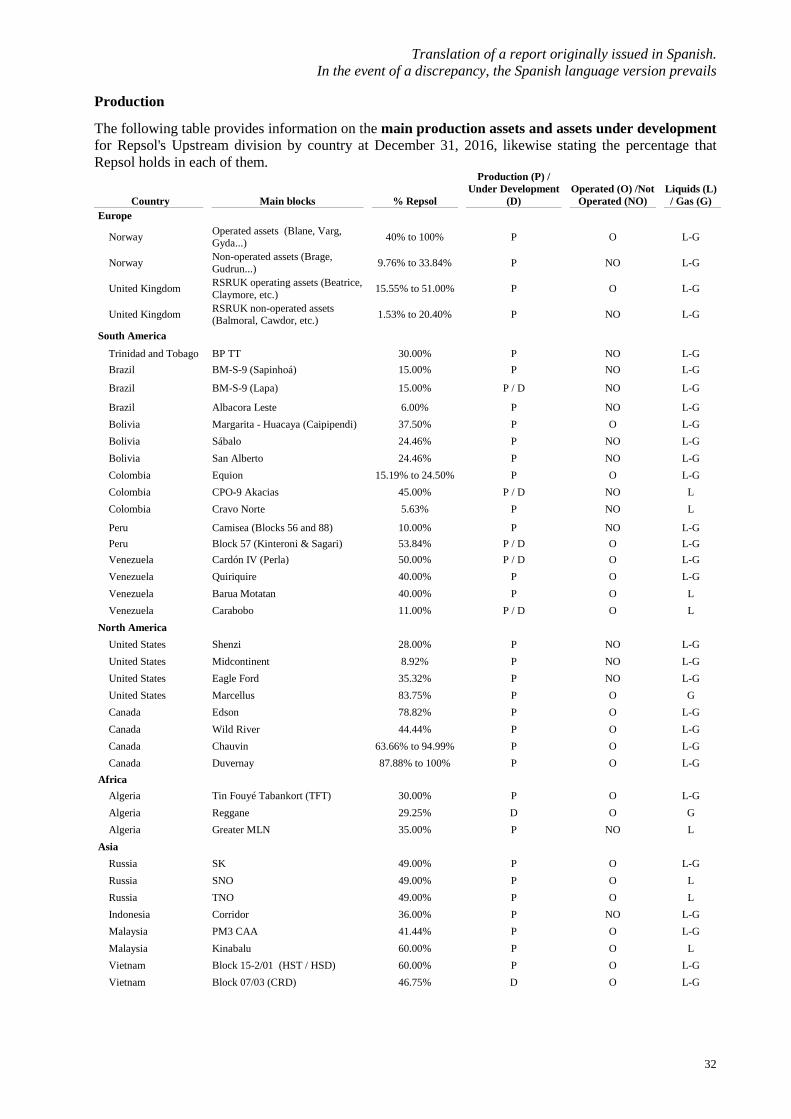
Translation of a report originally issued in Spanish. In the event of a discrepancy, the Spanish language version prevails
32
Production
The following table provides information on the main production assets and assets under development for Repsol's Upstream division by country at December 31, 2016, likewise stating the percentage that Repsol holds in each of them.
Country Main blocks % Repsol
Production (P) / Under Development
(D) Operated (O) /Not
Operated (NO) Liquids (L) / Gas (G)
Europe
Norway Operated assets (Blane, Varg, Gyda...) 40% to 100% P O L-G
Norway Non-operated assets (Brage, Gudrun...) 9.76% to 33.84% P NO L-G
United Kingdom RSRUK operating assets (Beatrice, Claymore, etc.) 15.55% to 51.00% P O L-G
United Kingdom RSRUK non-operated assets (Balmoral, Cawdor, etc.) 1.53% to 20.40% P NO L-G
South America
Trinidad and Tobago BP TT 30.00% P NO L-G Brazil BM-S-9 (Sapinhoá) 15.00% P NO L-G
Brazil BM-S-9 (Lapa) 15.00% P / D NO L-G
Brazil Albacora Leste 6.00% P NO L-G Bolivia Margarita - Huacaya (Caipipendi) 37.50% P O L-G Bolivia Sábalo 24.46% P NO L-G Bolivia San Alberto 24.46% P NO L-G Colombia Equion 15.19% to 24.50% P O L-G Colombia CPO-9 Akacias 45.00% P / D NO L Colombia Cravo Norte 5.63% P NO L
Peru Camisea (Blocks 56 and 88) 10.00% P NO L-G Peru Block 57 (Kinteroni & Sagari) 53.84% P / D O L-G Venezuela Cardón IV (Perla) 50.00% P / D O L-G Venezuela Quiriquire 40.00% P O L-G Venezuela Barua Motatan 40.00% P O L Venezuela Carabobo 11.00% P / D O L
North America United States Shenzi 28.00% P NO L-G United States Midcontinent 8.92% P NO L-G United States Eagle Ford 35.32% P NO L-G United States Marcellus 83.75% P O G Canada Edson 78.82% P O L-G Canada Wild River 44.44% P O L-G Canada Chauvin 63.66% to 94.99% P O L-G Canada Duvernay 87.88% to 100% P O L-G
Africa Algeria Tin Fouyé Tabankort (TFT) 30.00% P O L-G Algeria Reggane 29.25% D O G Algeria Greater MLN 35.00% P NO L
Asia Russia SK 49.00% P O L-G Russia SNO 49.00% P O L Russia TNO 49.00% P O L Indonesia Corridor 36.00% P NO L-G Malaysia PM3 CAA 41.44% P O L-G Malaysia Kinabalu 60.00% P O L Vietnam Block 15-2/01 (HST / HSD) 60.00% P O L-G Vietnam Block 07/03 (CRD) 46.75% D O L-G

Translation of a report originally issued in Spanish. In the event of a discrepancy, the Spanish language version prevails
33
Average net production was 23% higher than in 2015, up to 690 Mboe/d. The increase is mainly due to the contribution of assets incorporated in the purchase of ROGCI, whose production in 2015 was added from the effective date of purchase (May 8, 2015) and which in 2016 contributed the following throughout the year (the effect of the new assets acquired was an increase of total average production in year of 113.4 Mboe/d): the start of production of Cardon IV in Venezuela in the third quarter of 2015, the new wells in Sapinhoá Norte in Brazil, the addition of Gudrun, Norway, and the larger deliveries of gas in block 57 in Peru. These production gains offset the lower output of Trinidad and Tobago due to maintenance stoppages and operational incidences in the fields, of the United States due to the December 2015 sale of 26% of the stake in Eagle Ford and the natural decline of the fields, and of Colombia owing to the lower demand for gas in Equion and the closure between March and October of the Akacias field because of low crude oil prices.
Total production of liquids and natural gas by geographical area Production wells by geographical area
Liquids (MMb)
Natural gas (bcf) Total (MMboe) Oil
Gas
2016 2015
2016 2015 2016 2015 2016 2015
2016 2015
Europe 16 9 17 7 19 10 236 231
3 2
Norway 7 3 16 6 10 4 60 67
1 -
United Kingdom 8 5 1 1 8 5 166 154
1 1
Rest of Europe 1 1 - - 1 1 10 10
1 1
Latin America 39 35 486 419 125 110 953 1,130
216 233
Brazil 14 11 5 3 15 12 28 26
- -
Colombia 5 4 11 10 7 6 395 414
- 17
Peru 5 4 68 52 17 13 - -
27 27
Trinidad and Tobago 4 4 188 216 37 43 - 91
55 55
Venezuela 5 5 129 69 28 17 324 376
32 34
Rest of Latin America 6 7 85 69 21 19 206 223
102 100
North America 20 18 262 182 67 51 2,924 2,852
2,610 2,664
Canada 8 5 82 48 23 14 1,126 1,151
1,574 1,593
United States 12 13 180 134 44 37 1,798 1,701
1,036 1,071
Africa 3 3 16 16 6 5 128 86
79 78
Asia and Oceania 11 10 137 98 36 28 621 619
91 99
Indonesia 1 1 94 63 18 12 55 89
45 55
Malaysia 4 3 28 19 9 6 90 87
38 36
Russia 4 4 14 15 7 7 448 403
8 8
Rest of Asia and Oceania 2 2 1 1 2 3 28 40
- -
Total 89 75 918 722 253 204 4,862 4,918
2,999 3,076
The average crude oil and gas realization prices by geographic area are as follows:
2016
2015 Average crude oil price Average gas price
Average crude oil price Average gas price
($/Bbl) ($/Boe)
($/Bbl) ($/Boe) Europe 44.93 27.17 50.92 34.36 Latin America 37.12 10.99 44.02 14.53 North America 36.47 11.38 44.28 11.74 Africa 41.80 - 52.51 - Asia and Oceania 39.35 25.08 42.99 27.50 Total 39.01 13.56 45.16 15.75
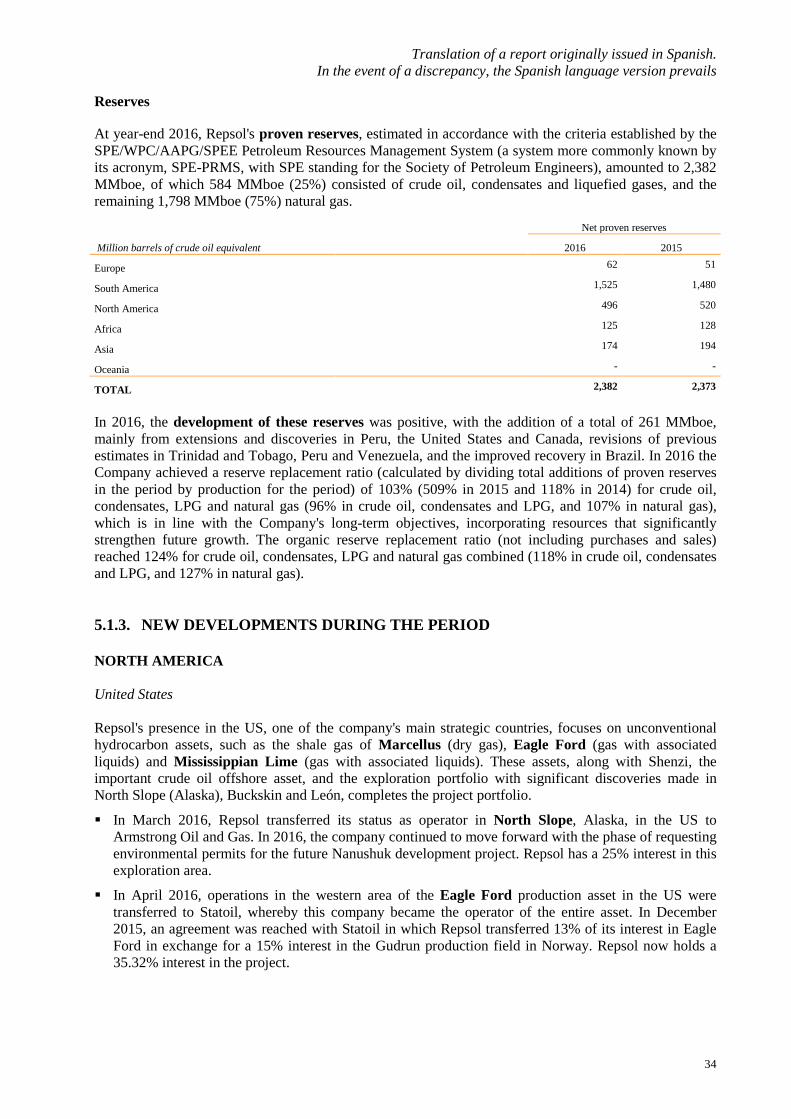
Translation of a report originally issued in Spanish. In the event of a discrepancy, the Spanish language version prevails
34
Reserves
At year-end 2016, Repsol's proven reserves, estimated in accordance with the criteria established by the SPE/WPC/AAPG/SPEE Petroleum Resources Management System (a system more commonly known by its acronym, SPE-PRMS, with SPE standing for the Society of Petroleum Engineers), amounted to 2,382 MMboe, of which 584 MMboe (25%) consisted of crude oil, condensates and liquefied gases, and the remaining 1,798 MMboe (75%) natural gas.
In 2016, the development of these reserves was positive, with the addition of a total of 261 MMboe, mainly from extensions and discoveries in Peru, the United States and Canada, revisions of previous estimates in Trinidad and Tobago, Peru and Venezuela, and the improved recovery in Brazil. In 2016 the Company achieved a reserve replacement ratio (calculated by dividing total additions of proven reserves in the period by production for the period) of 103% (509% in 2015 and 118% in 2014) for crude oil, condensates, LPG and natural gas (96% in crude oil, condensates and LPG, and 107% in natural gas), which is in line with the Company's long-term objectives, incorporating resources that significantly strengthen future growth. The organic reserve replacement ratio (not including purchases and sales) reached 124% for crude oil, condensates, LPG and natural gas combined (118% in crude oil, condensates and LPG, and 127% in natural gas). 5.1.3. NEW DEVELOPMENTS DURING THE PERIOD
NORTH AMERICA United States Repsol's presence in the US, one of the company's main strategic countries, focuses on unconventional hydrocarbon assets, such as the shale gas of Marcellus (dry gas), Eagle Ford (gas with associated liquids) and Mississippian Lime (gas with associated liquids). These assets, along with Shenzi, the important crude oil offshore asset, and the exploration portfolio with significant discoveries made in North Slope (Alaska), Buckskin and León, completes the project portfolio.
In March 2016, Repsol transferred its status as operator in North Slope, Alaska, in the US to Armstrong Oil and Gas. In 2016, the company continued to move forward with the phase of requesting environmental permits for the future Nanushuk development project. Repsol has a 25% interest in this exploration area.
In April 2016, operations in the western area of the Eagle Ford production asset in the US were transferred to Statoil, whereby this company became the operator of the entire asset. In December 2015, an agreement was reached with Statoil in which Repsol transferred 13% of its interest in Eagle Ford in exchange for a 15% interest in the Gudrun production field in Norway. Repsol now holds a 35.32% interest in the project.
Net proven reserves
Million barrels of crude oil equivalent 2016 2015
Europe 62 51
South America 1,525 1,480
North America 496 520
Africa 125 128
Asia 174 194
Oceania - -
TOTAL 2,382 2,373

Translation of a report originally issued in Spanish. In the event of a discrepancy, the Spanish language version prevails
35
The WI-7 well in the Shenzi field (Repsol 28%) in the deepwater Gulf of Mexico was completed in the second quarter of 2016. This is an injection well to increase production levels in the southern area of the oil field.
In the second quarter of 2016, Repsol delivered the necessary documentation to the US government in order to withdraw from all exploratory blocks in which it was invested in the Chuckchi Sea in Alaska.
With regard to the important exploratory discoveries made in recent years in the Gulf of Mexico, in 2016 the company continued to define the future development plan for Buckskin with the aim of making the Final Investment Decision (FID) in 2017. At the end of 2016, an agreement was reached with the company Llog, under which it would take a 55% interest in the project (Repsol has a 22.5% interest). The León-2 appraisal well was completed in 2016, and the results are being evaluated to confirm the extension of the important discovery made in 2014 with the León drilling.
In 2016 there was less development activity in the unconventional resource assets of Midcontinent / Mississippian Lime, as around 25 wells were drilled, which represents an 89% drop in activity compared to 2015.
Canada In this strategic country in North America, the company's presence focuses on the unconventional hydrocarbon assets of Greater Edson (crude oil and gas production that is concentrated in Edson -Alberta- with an average investment of 75% and which covers 6 areas: Edson, Sundance/MedLodge, Ansell and Minehead in the south and Wild River and Bigstone in the north) and Duvernay (an underdeveloped area that is in the initial stage of development and appraisal, producing crude oil and gas, which is located in central-western Alberta. In 2016, drilling continued in order to appraise the southern area). The heavy crude oil production asset of Chauvin, located in Alberta/Saskatchewan, is also worthy of mention.
LATIN AMERICA Brazil The company boasts a significant and well-diversified asset portfolio in Brazil, through Repsol Sinopec Brasil (a company 60% owned by Repsol and 40% owned by Sinopec), which includes the Sapinhoá and Albacora Leste production fields and major discoveries made over recent years in blocks BM-S-9 (Lapa, in production since December 2016) and BM-C-33.
On April 18, Repsol Sinopec Brasil announced that a hydrocarbon column of 175 meters had been found in the Gavea A1 appraisal well, drilled in the ultra-deepwater block BM-C-33 in the Campos basin in Brazil. Repsol Sinopec Brasil holds an interest in this project, in partnership with Statoil (operator) and Petrobras. The consortium also carried out drilling and tests in the Seat-2, PdA-A1 and PdA-A2 appraisal wells. The potential resources for the three discoveries are currently being appraised.
Within the framework of the development project of another major discovery in block BM-S-9, Lapa, the Cidade de Caraguatatuba FPSO (Floating Production Storage and Offloading) arrived in the country in May 2016. On December 19, production began in the Lapa field with the first production well. In April 2017, a second production well is expected to enter into production.
In August 2016, the P14N well entered into production in the northern area of Sapinhoá in block BM-S-9 in the deepwater of the pre-salt layer of the Santos basin, which enabled the company to reach the production plateau in this northern area in mid-September 2016 (150,000 Mboe/d 100%). Production began in the northern area of Sapinhoá through the use of the Cidade de Ilhabela FPSO in mid-November 2014. In the southern area of Sapinhoá, the production plateau of 120,000 barrels of crude oil was reached in 2014 through the Cidade de São Paulo FPSO.
In January 2017,Petrobras and Repsol withdrew from block BM-S-7- Piracucá in the Santos marine basin.

Translation of a report originally issued in Spanish. In the event of a discrepancy, the Spanish language version prevails
36
Bolivia
In the Margarita-Huacaya field, the MGR-7ST well began production of the H1B reservoir in March
2016, with the early commissioning of the collection pipeline. In March the field's production reached 20 million cubic meters per day (Mm3/d) of gas. Within the framework of the development plan to maintain the production plateau, in October 2016 drilling began on the Huacaya-2 development well, which is expected to begin production in the first half of 2017, once the production tests are carried out upon its completion and once construction of the service facilities is completed.
The project is operated by Repsol (with a stake of 37.5%), alongside partners Shell/BG (37.5%) and PAE E&P (25%).
On October 27, it was announced that the Chairman of Repsol, Antonio Brufau, and the President of Bolivia, Evo Morales, entered into an agreement to expand operations at Caipipendi (the location of the Margarita-Huacaya field) for an additional 15 years. The contract was therefore extended until 2046. The new plans include the execution of an exploration, development and production program in Boyuy and Boicobo Sur, to the south and north of Caipipendi.
Peru In April 2016, once the transmission capacity of the TGP gas pipeline was expanded from 1,230
million cubic feet per day (Mscfd) to 1,540 Mscfd, the gas delivered from block 57 to block 56 would be increased from 85 Mscfd to 160 Mscfd. The gas of block 57 is allocated in full to exportation along with the gas of block 56. Block 57 is located in the Ucayali-Madre de Dios basin, one of the most prolific gas areas of Peru, in which Repsol is the operator with a 53.84% interest.
In 2016, within the framework of the development program and the entry into production of the Sagari discovery in block 57, the Sagari 8D and the Sagari 7D development wells were completed. The campaign is expected to be completed in 2017 with the completion of the Sagari 4X well (the discovery well). In September 2016, the company was awarded a contract for the construction of surface facilities and evacuation pipelines.
The other major discovery in block 57, Kinteroni, entered into production in March 2014. The compression project of block 57 was approved in 2016.
The Mashira-6X well was declared negative following the results that became known to date, although it was technically under final drilling at December 31, 2016.
Venezuela
In April 2016, the Perla 9 offshore well, located in the Perla field in the Cardón IV block, began production. During the second quarter of the year, the drilling was completed on another production well, Perla 10, in order for the well to enter into production with a capacity of more than 100 Mscfd. As of today's date there are 6 production wells in the field. Average production in 2016 remained at around 500 Mscfd. In the next phase of development, it is estimated that production may reach around 800 Mscfd, with a possible intermediate phase of 600 Mscfd. The Cardón IV block is 50% owned by Repsol and Eni, and production began at this giant gas field in July 2015.

Translation of a report originally issued in Spanish. In the event of a discrepancy, the Spanish language version prevails
37
Trinidad and Tobago In October 2016, it was announced that an agreement had been reached with Perenco for the sale of
Repsol E&P T&T, which includes the Teak, Samaan, and Poui (TSP) offshore assets, where Repsol was the operator with a 70% interest. The sale was completed in December 2016 after obtaining all required authorizations (for more information on these transactions, see the Divestments heading of section 4.1).
In 2016, production at the BPTT offshore fields operated by BP (70% interest), in which Repsol held the remaining 30% interest, was partially affected by the shutdowns and maintenance work carried out at the fields envisaged in the annual work plans for the year.
In 2016, the work continued at BPTT to increase the production of the fields as of 2017 (Juniper project, Onshore compression, drilling campaign at Amherstia, Galeota expansion project).
Colombia Production in the early phase (begun in November 2010) of the CPO-9 field in Columbia resumed on
October 3, 2016. In the first half of 2016, the Colombian authorities (ANH) approved the temporary suspension of production for 6 months starting in March 2016 as a result of crude oil prices. The well drilling plan was moved to 2017. Repsol holds a 45% interest in block CPO-9 operated by Ecopetrol, which in 2014 announced the hydrocarbon discovery of the Nueva Esperanza-1 exploratory well, and where the important Akacias field is in the preliminary development phase. In 2016 work was carried out at the Akacias field in order to define the development plan for the purpose of making the final investment decision (FID) in 2017.
During the first quarter of 2016, the Bayonero-01 exploratory well in the Chipirón block was completed with negative results and in November the Payero-1 exploratory well also yielded negative results.
AFRICA Algeria In 2016, the work to develop the important Reggane Nord gas project continued with the construction
of surface facilities and the drilling of wells with three active drilling towers in 2016. The development work is expected to last for 36 months, and gas production is expected to begin at the end of 2017, with a 100% production target of 8 million m3 of gas per day.
This gas project in the Algerian Sahara includes the development of six fields (Reggane, Kahlouche, South Kahlouche, Sali, Tiouliline and Southeast Azrafil) in the Reggane Basin. Repsol holds a 29.25% stake in the consortium that is to develop the project, alongside the Algerian state-owned company Sonatrach (40%), Germany’s Dea AG (19.5%), and Edison of Italy (11.25%).
In the first half of 2016, the second exploratory drilling and appraisal campaign was completed at the Sud-Est Illizi exploratory block in Algeria with the TAOR-1 exploratory well (under assessment) and the TIHS-2 appraisal well (positive).
Repsol is the operator of the block with a 52.5% interest. In a future development and production phase, the Algerian state-owned company Sonatrach would have a 51% interest and the rest of the consortium would hold a 49% stake in the aforementioned proportions.
The successful exploratory activity carried out since 2012 in this block (5 exploratory discoveries between 2012 and 2016 and 4 appraisal wells) confirm the high potential of the Sud-Est Illizi block.

Translation of a report originally issued in Spanish. In the event of a discrepancy, the Spanish language version prevails
38
Libya Production was suspended in 2016 until it was resumed in mid-December. Production was resumed on
December 20 at field A of block NC-115, on December 21 at field M, on December 26 at field H and on December 28 in the north of field H. On January 4, 2017, production was also resumed at field I/R (blocks NC-186 and NC-115).
Angola The Ohanga-1 exploratory well at block 35 (operated by ENI) was completed in June 2016 with
negative results. After this result, Repsol withdrew from Blocks 35 and 37. All obligations of the initial exploratory phase have been met and the remaining potential is considered to involve a high level of risk. A 2-year extension was obtained for block 22, during which geological and geophysical work will be carried out in order to evaluate the possibility of drilling an exploratory well in the future.
EUROPE Spain In the first half of 2016, Repsol officially withdrew from the Canarias 1-9 blocks, in which it was the
operator with a 50% interest.
In 2016, production activities continued as usual in Spain in accordance with the most rigorous safety standards.
Norway In the first half of 2016, Repsol sold the 10% interest in license PL 148, the Brynhild field, operated
by Lundin, to CapeOmega, effective as of January 1, 2016.
On June 1, 2016, operations of the Varg field were terminated. In the second half of 2016, the FPSO operated by Teekay for Varg's production withdrew from the field. This work is carried out within the framework of the initial phase of the Varg dismantling project.
On August 22, the MOPU Yme (offshore production platform for the Yme field) was successfully removed from its location in Norwegian waters. A single lift of 13,500 tons of surface elements was carried out using, for the first time, the Pioneering Spirit, which is the world's largest heavy-lift vessel. In order to cut the platform's pillars, a series of tools specifically designed for this purpose were used, which were placed in the pillars and operated remotely from the ship. The removal work was completed without any incidents. Never before has a 13,500-ton structure been removed from the sea, with the unit safely lifted and transported to the coast for dismantling.
In 2016, the Gudrun field (where Repsol holds a 15% stake under the December 2015 agreement with Statoil, in exchange for a 13% stake in Eagle Ford in the United States) surpassed production forecasts, at levels around 50% of Repsol's total net production in the country (14.4 Mboe/d on average for the year of Gudrun vs. 28.1 Mboe/d of total Repsol production in Norway).
United Kingdom In 2016, within the framework of the project for redeveloping the MonArb production area, progress
was made in line with initial plans, with the aim of increasing current production in the second quarter of 2017. On October 20, 2016, current production of MonArb was resumed following the performance of scheduled maintenance work.

Translation of a report originally issued in Spanish. In the event of a discrepancy, the Spanish language version prevails
39
ASIA AND OCEANIA Indonesia Effective December 2, Repsol sold its ownership interest in the Wiriagar block to BP, which included
the 3.06% holding in the Tangguh LNG project (for further information, see the Divestments heading of section 4.1).
In August and October 2016, two exploratory wells in the Ogan Komering, in which Repsol has a 50% interest and that are operated by Pertamina, block were completed. The Jantung Baru-1X and North Meraksa-1X wells are still under evaluation.
In September the Kukulambar-2X exploratory well, in the Sakakemang block, was completed and, after the appraisal work was carried out, the results were determined to be negative in November.
Malaysia In January and February 2016, two exploratory wells (Zoisit-1 and Baiduri-1) in Malaysia in marine
block SB-310 were completed, both with negative results. In addition, in October the Andalusit-1 exploratory well in this same block SB-310 was also completed with negative results.
On April 6, Repsol entered into an agreement with Petroliam Nasional Berhad (Petronas) and with Vietnam Oil and Gas Group (PetroVietnam) for a 10-year extension of production block PM3 CAA PSC (Production Sharing Contract). After agreeing to the extension, Repsol and Petronas will hold a 35% interest each (Repsol’s interest was 41.44% at December 31, 2016) and PetroVietnam will hold the remaining 30%. Repsol will continue to operate block PM-3 CAA until the end of the extension agreement in 2027. The block, together with the related production facilities, is located in Malaysia and Vietnam.
Progress was made in 2016 in the sixth phase of development of block PM-3 CAA, the Bunga Pakma project, and production is expected to begin in 2017.
Russia In April the P-7 appraisal well was successfully completed in the Karabashsky 2 exploratory block,
located in the West Siberia basin, where Repsol is the operator through the wholly-owned company Eurotek-Yugra.
In the second half of 2016, the company withdrew from the Kumolsky exploratory block, given that it lies an extremely remote area with scant potential.
Vietnam In 2016 the company continued with the final phase of determining the details of the Development
Plan for the important exploratory discovery of Ca Rong Do (CRD) and the marketing of the gas to be produced. The CRD discovery is located in offshore block 07/03, in which Repsol has a 46.75% interest. The final investment decision (FID) regarding the development and entry into production of this important discovery is expected to be taken in the first half of 2017.
Region of Iraqi Kurdistan In 2016 the work continued in the phase of defining the project, and analyzing and evaluating viable
development alternatives in the Kurdamir and Topkhana development blocks, with a 40% and 80% interest, respectively.
In the first half of 2016, the company withdrew from the Piramagrun and QalaDze exploratory blocks operated by Repsol with a 50% interest.
Translation of a report originally issued in Spanish. In the event of a discrepancy, the Spanish language version prevails
40
Australia and Papua New Guinea
After obtaining the necessary official authorizations, the agreement reached in September 2015 with
the company West Side for the sale of Repsol's interest in the Laminaria and Corallina fields took effect in April 2016.
After production ended in December 2015 in the Kitan block, the company began the initial phase of abandonment by withdrawing from the field the FPSO that had been used for production in March 2016. The operator ENI estimates that the second and final phase of the withdrawal will take place in 2018.
In June 2016, the Strickland-2 exploratory well in Papua New Guinea was completed with negative results and in December the Strickland-1 exploratory well was also completed with negative results.
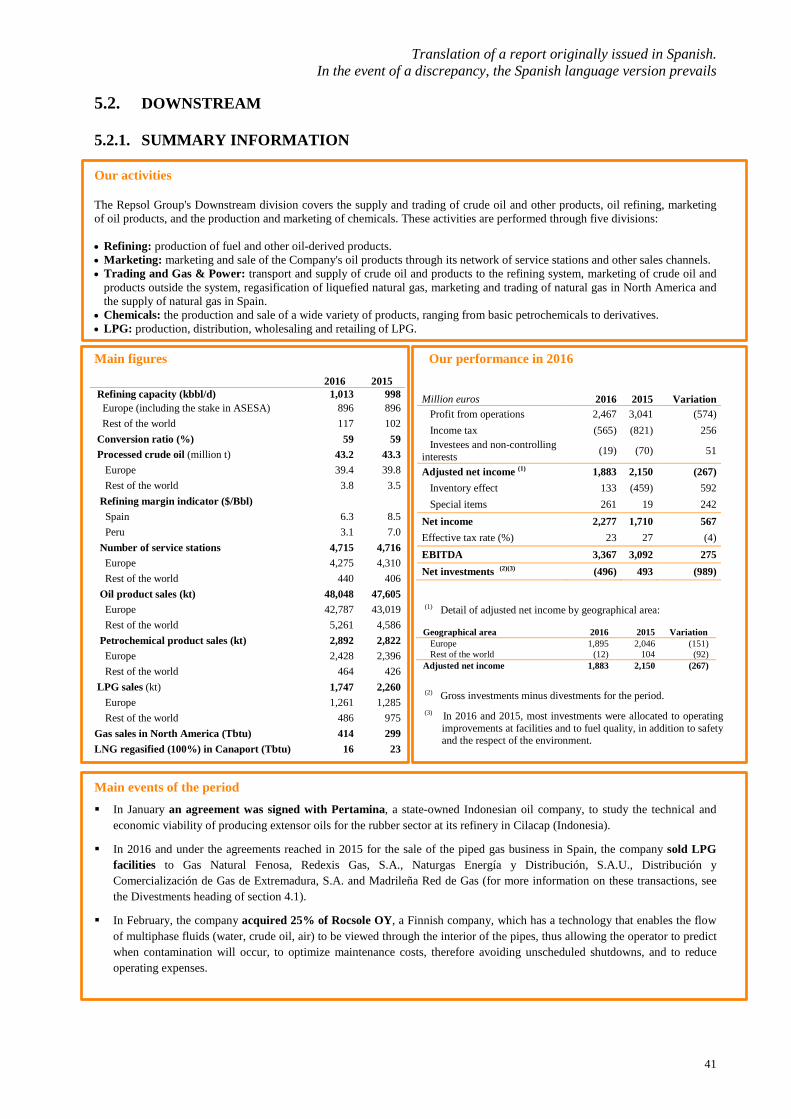
Translation of a report originally issued in Spanish. In the event of a discrepancy, the Spanish language version prevails
41
5.2. DOWNSTREAM 5.2.1. SUMMARY INFORMATION Our activities The Repsol Group's Downstream division covers the supply and trading of crude oil and other products, oil refining, marketing of oil products, and the production and marketing of chemicals. These activities are performed through five divisions: • Refining: production of fuel and other oil-derived products. • Marketing: marketing and sale of the Company's oil products through its network of service stations and other sales channels. • Trading and Gas & Power: transport and supply of crude oil and products to the refining system, marketing of crude oil and
products outside the system, regasification of liquefied natural gas, marketing and trading of natural gas in North America and the supply of natural gas in Spain.
• Chemicals: the production and sale of a wide variety of products, ranging from basic petrochemicals to derivatives. • LPG: production, distribution, wholesaling and retailing of LPG. Main figures Our performance in 2016
Main events of the period In January an agreement was signed with Pertamina, a state-owned Indonesian oil company, to study the technical and
economic viability of producing extensor oils for the rubber sector at its refinery in Cilacap (Indonesia).
In 2016 and under the agreements reached in 2015 for the sale of the piped gas business in Spain, the company sold LPG facilities to Gas Natural Fenosa, Redexis Gas, S.A., Naturgas Energía y Distribución, S.A.U., Distribución y Comercialización de Gas de Extremadura, S.A. and Madrileña Red de Gas (for more information on these transactions, see the Divestments heading of section 4.1).
In February, the company acquired 25% of Rocsole OY, a Finnish company, which has a technology that enables the flow of multiphase fluids (water, crude oil, air) to be viewed through the interior of the pipes, thus allowing the operator to predict when contamination will occur, to optimize maintenance costs, therefore avoiding unscheduled shutdowns, and to reduce operating expenses.
2016 2015 Refining capacity (kbbl/d) 1,013 998 Europe (including the stake in ASESA) 896 896 Rest of the world 117 102 Conversion ratio (%) 59 59 Processed crude oil (million t) 43.2 43.3 Europe 39.4 39.8 Rest of the world 3.8 3.5 Refining margin indicator ($/Bbl) Spain 6.3 8.5 Peru 3.1 7.0 Number of service stations 4,715 4,716 Europe 4,275 4,310 Rest of the world 440 406 Oil product sales (kt) 48,048 47,605 Europe 42,787 43,019 Rest of the world 5,261 4,586 Petrochemical product sales (kt) 2,892 2,822 Europe 2,428 2,396 Rest of the world 464 426 LPG sales (kt) 1,747 2,260 Europe 1,261 1,285 Rest of the world 486 975 Gas sales in North America (Tbtu) 414 299 LNG regasified (100%) in Canaport (Tbtu) 16 23
Million euros 2016 2015 Variation Profit from operations 2,467 3,041 (574) Income tax (565) (821) 256 Investees and non-controlling interests (19) (70) 51
Adjusted net income (1) 1,883 2,150 (267) Inventory effect 133 (459) 592 Special items 261 19 242 Net income 2,277 1,710 567 Effective tax rate (%) 23 27 (4) EBITDA 3,367 3,092 275 Net investments (2)(3) (496) 493 (989)
(1) Detail of adjusted net income by geographical area: Geographical area
2016
2015
Variation
Europe 1,895 2,046 (151) Rest of the world (12) 104 (92) Adjusted net income
1,883 2,150 (267)
(2) Gross investments minus divestments for the period.
(3) In 2016 and 2015, most investments were allocated to operating improvements at facilities and to fuel quality, in addition to safety and the respect of the environment.
Translation of a report originally issued in Spanish. In the event of a discrepancy, the Spanish language version prevails
42
In February, Repsol agreed to the sale of its wind power business in the United Kingdom to China's SDIC Power (for more information, see the Divestments heading of the section 4.1). The sale included the Inch Cape project, in which it had a 100% interest, and the interest in the Beatrice project.
In March, AENOR approved the certification under ISO-50001 standard of Repsol's energy management system, which will help the company to be more efficient and reduce energy consumption and CO2 emissions.
In April, Repsol launched a new range of lubricants, “Repsol Elite”, the purpose of which is to obtain maximum performance from engines and improved efficiency, all in line with the new environmental regulations.
In April, Repsol began to sell lubricants in India through GP Petroleums Ltd, a subsidiary of Gulf Petrochem FZC, after signing the strategic agreement last year for exclusive manufacturing rights.
On April 20, 2016, an agreement was reached with the South American international operator, Abastible, for the sale of the LPG business in Peru and Ecuador. The sale of the LPG business in Peru was finalized on June 1 and the LPG business in Ecuador was sold on October 1 (for more information, see the Divestments heading of section 4.1).
In May, an agreement was reached with Correos for the development of a package storage service at our service stations.
In May, Repsol began to produce a new range of metallocene polyethylene with Chevron Phillips technology. The new range will be sold under the trade name Repsol Resistex and offers great value to end products, thus confirming Repsol's focus on product differentiation.
In June, Repsol received the award for the best high density polyethylene producer in Europe and received the overall award for innovative polymers as a result of a customer survey carried out by European Plastics Converters (EuPC). In September, Repsol was also recognized as the best petrochemical company of the year by the prestigious journal Petroleum Economist.
In August, an agreement was reached for the sale of 100% of Viared, S.L. to Burger King España, which entailed the transfer of 11 premises to the restaurant chain, and entering into a collaboration agreement for the future development of new restaurants in our service station network in Spain.
In September, Repsol entered into a technology license agreement with the Chinese company Tianjin Bohua Chemical Development, through which Repsol will transfer the technology necessary for the construction of a plant in Tianjin with an annual production capacity of 200,000 tons of propylene oxide and 450,000 tons of styrene monomer.
In September, production commenced of Repsol lubricants in UAE through the company Speed House Trading. This local manufacturing agreement would cover the markets of the UAE, Saudi Arabia and Lebanon by combining the product imported from Spain with the product manufactured in Dubai.
In October, Repsol announced that its lubricants would be present in the 2017 Dakar Rally under a technical sponsorship agreement.
In October, LPG operators (including Repsol) and vehicle and component manufacturers created the first Spanish cluster for the purpose of promoting the use of Autogas as a fuel alternative
In November, production of Repsol lubricants commenced in Turkey, in association with the company Tures Petrolculuk Sanayi Ve Ticaret A.S which will cover the growing Turkish market.
In December, the Sines logistics terminal was inaugurated in order to receive, store and dispatch gasoil.
The work on the La Pampilla Refinery to meet the new fuel quality specifications in Peru continued in 2016. In October, the low sulfur diesel production unit was inaugurated, enabling a 15% increase in the capacity of the La Pampilla Refinery, up to 117,000 barrels/day.
In 2016, and taking advantage of the scheduled shutdowns at the Cartagena and Tarragona refineries, the following improvements were carried out:
In Cartagena, the ejectors and condensers of the vacuum column of the Vacuum 5 Unit were modified in order to improve operating conditions, avoid accelerated contamination in the condensation system and improve the cut point between vacuum gasoil and vacuum waste.
In Tarragona, the existing reactors of the Isomax Unit were replaced and a new hydrogen compressor was installed, which increases the conversion of heavy feed. In addition, new heat exchangers were installed in order to improve the energy consumption rate (savings of 720 t fuel gas/year) and to reduce emissions (1,910 t CO2/year).

Translation of a report originally issued in Spanish. In the event of a discrepancy, the Spanish language version prevails
43
5.2.2. REFINING Current situation The Refining margins in 2016 were higher than the average posted in the 2011-2015 period, thanks to the continued low energy costs associated with low international crude oil prices due to the increase in market supply. With regard to products, mid distillate margins began to drop at the end of 2015, but gradually began to recover throughout 2016, especially in the last quarter. The changes in these margins in the last quarter of 2015 reflect the trend in product supply in Europe, with a wide variation in the output of local refineries and the increase in imports as a result of new capacity in the Middle East; this was compounded by the changes in demand, associated with the temperatures recognized during various winter periods (unseasonably warm temperatures in the winter of 2015 and the normal temperatures in the winter 2016). With regard to gasoline consumption, the strong demand in the United States in 2015 was exceeded by that recorded in 2016. However, gasoline margins during the latter year decreased, returning to their previous levels as a result of the greater production of the refineries in the area during the first few months of the year. While the international price of crude oil continues to drop, the margins are also expected to remain at these levels in the short term for the reasons outlined above. An oil price recovery would impact energy costs, although it would also enable a higher discount on heavy crude oil, which would give a competitive advantage to the conversion schemes, which is the case for Repsol's refinery activities. Our activity The Repsol Group owns and operates five refineries in Spain (Cartagena, A Coruña, Bilbao, Puertollano and Tarragona), with a combined distillation capacity of 896 thousand barrels of oil per day (including, in the case of the Tarragona refinery, the share in Asfaltos Españoles, S.A.). In the case of the La Pampilla refinery in Peru, in which Repsol holds an 82.38% interest and is the operator, installed capacity rose from 102 thousand barrels of oil per day to 117 thousand barrels of oil per day after the inauguration of the low sulfur diesel production unit in 2016. In 2016, the Refining margin stood at US $6.3 per barrel in Spain, down on the 2015 figure ($8.5 per barrel). In Peru, the annual Refining margin came in at $3.1 per barrel, compared to the $7.0 per barrel seen in 2015. The following table shows the refining capacity of the facilities in which Repsol had an interest at December 31, 2016: Primary distillation
Conversion ratio (2)
Lubricants
Refining capacity (1) (Thousand barrels per
day)
(%)
(Thousand metric tons per year)
Spain Cartagena 220 76 155 A Coruña 120 66 - Puertollano 150 66 110 Tarragona 186 44 - Bilbao 220 63 - Total Repsol (Spain) 896 63 265 Peru La Pampilla 117 24 - Total Repsol 1,013 59 265
(1) Information disclosed in accordance with Repsol Group's reporting policy: all refineries cited are fully consolidated in the Group's financial statements. Reported capacity in Tarragona includes the stake in ASESA.
(2) Defined as the ratio between the equivalent capacity factor of Fluid Catalytic Cracking (FCC) and primary distillation capacity.

Translation of a report originally issued in Spanish. In the event of a discrepancy, the Spanish language version prevails
44
Against this backdrop, the Group's refineries processed 43.2 million tons of crude oil, which is in line with the amount processed in 2015. The average use of refining capacity was 88% in Spain, compared to the 88.9% recorded in the previous year. In Peru, refinery use was up on 2015, rising from 67.6% to 68.9% in 2016. The table below provides a breakdown of refinery production by main products:
America 42%
Europe20%
Occ. Africa10%
Middle East16%
North Africa12%
2016
Intermediate distillates
51%
Gasoline19%
Fuel oil9%
LPG 2%Asphalts 3%
Lubricants 1%
Others 15%
2016
America43%
Europe19%
Occ. Africa18%
Middle East12%
North Africa8%
2015
Intermediate distillates
53%
Gasoline18%
Fuel oil8%
LPG 2%
Asphalts 3%
Lubricants 1%
Others15%
2015
Source of processed crude
Refining production
Refinery intake (Thousand tons) 2016 2015
Crude oil 43,226 43,334
Other refinery intake 9,387 8,486
Total 52,613 51,820 Refining production (Thousand tons) 2016 2015
Intermediate distillates 24,882 25,388
Gasoline 9,354 8,880
Fuel oil 4,500 4,041
LPG 1,008 1,010
Asphalts (1) 1,499 1,465
Lubricants 284 221
Other (including petrochemicals) (2) 7,574 7,268
Total 49,101 48,273
(1) Includes 50% of the asphalt production of Asfaltos Españoles, S.A. (ASESA), a company 50% owned by Repsol and Cepsa. Repsol markets 50% of ASESA's products.
(2) Includes figures for petrochemical products (1,976 thousand tons in 2016 and 1,901 thousand tons in 2015).

Translation of a report originally issued in Spanish. In the event of a discrepancy, the Spanish language version prevails
45
OIL PRODUCT SALES
Europe
Rest of the world
Total
Thousand tons
2016 2015
2016 2015
2016 2015 Own marketing 20,468 21,124 2,238 2,073 22,706 23,197 Light products 17,114 17,326 2,072 1,917 19,186 19,243
Other products 3,354 3,798 166 156 3,520 3,954
Other sales (1) 8,083 7,771 1,341 1,221 9,424 8,992 Light products 7,867 7,508 1,106 1,049 8,973 8,557
Other products 216 263 235 172 451 435
Exports (2) 14,236 14,124 1,682 1,292 15,918 15,416 Light products 5,939 6,295 561 468 6,500 6,763
Other products 8,297 7,829 1,121 824 9,418 8,653
TOTAL SALES 42,787 43,019 5,261 4,586 48,048 47,605
(1) Includes sales to oil product operators and bunker sales. (2) From country of origin.
Refining business activities are framed within the 2016-2020 Strategic Plan, which includes greater integration between refining and marketing activities and a clear goal to reduce energy costs and CO2 emissions. Investments made in the Cartagena and Bilbao refineries, and the corresponding improvement in the overall margin of the refining system, have been key to placing Repsol at the head of the integrated European companies in terms of efficiency, creation of guaranteed value, and resilience against scenarios of low oil prices. In addition to a wide range of efficiency measures implemented, the business' competitiveness continues to improve through managing markets and market access logistics, and relating to the business environment. These initiatives are underpinned by appropriate human resources management and an active policy of safety, environmental protection and innovation. 5.2.3. CHEMICALS The Chemicals division produces and markets a wide variety of products, and its activities range from basic petrochemicals to derivatives. Its products are sold in over 90 countries, and it leads the market on the Iberian Peninsula. Production is concentrated at three petrochemical plants located in Puertollano and Tarragona (Spain) and Sines (Portugal), where there is a high level of integration between basic and derivative chemicals, and with refining activities at the Spanish facilities. Repsol also has a number of subsidiaries and affiliate companies through which it produces polypropylene compounds, synthetic rubber and chemical specialties. In particular, these chemical specialties are produced through Dynasol, a 50% partnership with the Mexican KUO group, with plants in Spain, Mexico and China, the latter of which work with local partners.

Translation of a report originally issued in Spanish. In the event of a discrepancy, the Spanish language version prevails
46
The following table provides a breakdown of production capacity in 2016 and 2015 of the Group's main petrochemical products: PRODUCTION CAPACITY (Thousand tons) 2016 2015 Basic petrochemicals 2,603 2,603
Ethylene 1,214 1,214
Propylene 864 864
Butadiene 185 185
Benzene 290 290
Methyl tert-butyl ether / Ethyl tert-butyl ether 50 50
Derivative petrochemicals 2,235 2,235 Polyolefins
Polyethylene (1) 793 793
Polypropylene 505 505
Intermediate products
Propylene oxide, polyols, glycols, and styrene monomer 937 937
(1) Includes ethylene vinyl acetate (EVA) and ethylene butyl acrylate (EBA) copolymers. Earnings posted by Repsol's chemical business in 2016 exceeded the already good results obtained in 2015, a year characterized by a more favorable international environment shaped by strong demand and higher margins. Important efficiency improvements were consolidated in 2016 and the company continued to implement new initiatives related to improving margins through greater flexibility in the supply of raw materials to crackers and through the commissioning of important investments in differentiation, which most notably includes the commencement of production in May of a new range of metallocene polyethylene with Chevron Phillips technology. This new range, which is sold under the trade name Repsol Resistex, offers great value to end products, thus confirming Repsol's focus on product differentiation. In September, Repsol's Chemicals division also entered into a license agreement whereby it provided the Chinese company Tianjin Bohua Chemical Development with a license for the propylene oxide and styrene monomer coproduction technology for the construction of a plant in Tianjin with an annual production capacity of 200,000 tons of propylene oxide and 450,000 tons of styrene monomer. Sales to third parties in 2016 amounted to 2.9 million tons, marking a 2.5% increase on the 2.8 million tons sold in 2015. This increase in sales was achieved thanks to the favorable market situation and the high operational reliability of the plants during a year in which record-high production values were reached by various units. With regard to the margin environment, the year was marked by record-high values that were slightly higher than those recorded in 2015.
Thousand tons 2016 2015 Variation
Sales by type of product
Basic petrochemicals 994 948 4.9%
Derivative petrochemicals 1,898 1,874 1.3%
TOTAL 2,892 2,822 2.5%
Sales by region Europe 2,428 2,396 1.3%
Rest of the world 464 426 9.1%
TOTAL 2,892 2,822 2.5%
Translation of a report originally issued in Spanish. In the event of a discrepancy, the Spanish language version prevails
47
As for investments, they were mainly earmarked to improve and optimize existing assets, enhance efficiency, reduce costs, differentiate products, and improve quality, safety, and environmental standards. The main expenses incurred in 2016 relate to the projects carried out to adapt the High Density Polyethylene Plant in Tarragona to produce metallocene grades, as well as other projects relating to improving flexibility in the supply of raw materials. In recognition of the significant improvement to its business in recent years, Repsol received the award for the best high density polyethylene producer in Europe and received the overall award for innovative polymers as a result of a customer survey carried out by European Plastics Converters (EuPC). In September, Repsol was also recognized as the best petrochemical company of the year by the prestigious journal Petroleum Economist. 5.2.4. MARKETING Repsol markets its products through an extensive network of service stations and commercial distributors. The company's marketing activities also include other sales channels that provide differentiated service to sectors such as the aviation sector, marine sector, other large industries and end consumers, as well as the marketing of a wide range of products such as coke, lubricants, asphalts, sulfur, oils, paraffin and derivatives. Management of marketing margins and credit risk succeeded in achieving positive results in both the service stations and the channel of direct sales to end consumers. At year-end 2016, Repsol had a network of 4,715 service stations. In Spain, the network comprised 3,501 points of sale, 29% of which were company operated. Service stations in other countries were spread throughout Portugal, Italy and Peru. The Downstream business had the following points of sale (service stations and supply units) as of December 31, 2016:
Country No. of points
of sale
Spain 3,501 Portugal 453 Peru 440 Italy 321 Total 4,715 In Spain, Law 11/2013, of July 26, introduced a number of measures aimed at ensuring fuel price stability and increasing competition in the sector. This law was supplemented by Law 8/2015 (for further information, see Appendix IV of the 2016 consolidated financial statements). In this new context, Repsol, as a market leader with extensive geographical reach, works to efficiently meet the new challenges posed by legislation. Creation of value and customer focus The company has continued its policy of forming strategic alliances with market leaders, such as El Corte Inglés, Nespresso, Disney or Correos. The development and implementation of the new Supercor Stop & Go stores at Repsol's service stations was consolidated with El Corte Inglés. An agreement was entered into with Correos for the development of a package storage service at Repsol's service stations. The strategic alliance has allowed Repsol to be more connected to the new technological trends related to electronic commerce.

Translation of a report originally issued in Spanish. In the event of a discrepancy, the Spanish language version prevails
48
In 2016, key projects launched in various segments in 2015 were strengthened, thus enhancing brand value and product quality through innovation, operational excellence and a committed team. Innovative projects that incorporated very high-quality products and efficiency, such as the Neotech fuels or the Bienergy heating oil, enabled our customers to get the best performance from their vehicles and next-generation boilers with minimum consumption. The consolidation of programs such as “Repsol Mas” and “Plan Cliente” enabled us to improve our relationship with our consumers. Repsol confirmed its position as a leader in Europe in the production and marketing of green fuel-grade coke. The company has also continued its policy of creating value, diversification and international expansion, whereby 50% of sales were to foreign markets and reached over 20 countries, mainly in Europe, North Africa and Asia. In line with this growth and consolidation plan, Servicios Logísticos de Combustibles de Aviación (SLCA), in which Repsol holds a 50% interest, carries out in-plane refueling operations at Spain's two main airports: Madrid-Barajas and Barcelona-El Prat. As a result, SLCA remains the largest operator in Spain by number of airports and business volume. By winning several supply contracts for Air Force operating bases, the company consolidated the presence in France that it gained in 2015. On December 19, the new Sines logistics terminal was inaugurated in order to receive, store and dispatch gasoil. This project enabled Repsol to reinforce its development and consolidation strategy in Portugal. Confirming the growth and consolidation strategy, over 50% of sales of lubricant, asphalt and specialized products are made in the international market through operations in over 90 countries and with 73 international lubricant distributors. True to its social commitments, in 2016 Repsol maintained its policy for the employment and integration of people with disabilities, in collaboration with ONCE and Fundosa, and made progress with its commitment to sustainability, respect for the environment and personal safety. The company also developed other environmentally-friendly products at the Repsol Technology Center, including Bio Repsol Telex 68 oil and green asphalts. 5.2.5. LIQUEFIED PETROLEUM GAS (LPG) Repsol is a leading retail distributor of LPG, ranking first in Spain and maintaining top positions in Portugal. LPG sales in 2016 totaled 1,747 thousand tons. Total sales in Spain decreased by 3.1% year-on-year, primarily due to the decrease in sales to the petrochemical industry, despite the slight increase in retail demand. Repsol distributes bottled, bulk, and piped LPG in Spain through the collective distribution and Autogas networks, with over 4 million active customers. Bottled LPG sales accounted for over 61.2% of total retail LPG sales in Spain, through a network of 210 distribution agencies.

Translation of a report originally issued in Spanish. In the event of a discrepancy, the Spanish language version prevails
49
LPG sales by geographical area (Thousand tons) 2016 2015 Europe 1,261 1,285
Spain 1,116 1,152 Portugal 145 133
Latin America (1) 486 975 Peru 188 570 Ecuador 298 405
Total 1,747 2,260 LPG sales by product 2016 2015 Bottled 1,049 1,286 Bulk, piped and other (2) 698 974
Total 1,747 2,260
(1) After selling the assets of the LPG business in Peru and Ecuador in June and October 2016, respectively, Repsol completed the divestment of its LPG business in Latin America (see the Divestment heading of section 4.1).
(2) Includes sales to the automotive market, LPG operators and others. In Spain, prices continue to be regulated for piped LPG and bottles between 8 kg and 20 kg, not including bottled mixtures for using LPG as fuel with a tare weight greater than 9 kg. For further information on the applicable legal framework in Spain, see Appendix IV of the 2016 consolidated financial statements. On September 30, 2015, the Board of Directors of Repsol approved the sale of part of the piped LPG business to Gas Natural Distribución and Redexis Gas. In addition, in 2016 the piped gas business in northern Spain and Extremadura was sold to the EDP Group and Gas Extremadura, and an agreement was entered into with Madrileña Red de Gas for the sale of the piped gas business in the Autonomous Community of Madrid. For further information on the impact of these transactions on profit, see the divestments heading of section 4.1. In Portugal, Repsol distributes bottled, piped and bulk LPG and Autogas to end customers, while also supplying other operators. Sales reached 145 thousand tons in 2016, making the company the third-largest operator and bringing the market share to over 19%. In Latin America, on April 20, 2016 Repsol reached an agreement with the South American international operator, Abastible, for the sale of the LPG business in Peru and Ecuador. The sale of the LPG business in Peru was finalized on June 1 and the LPG business in Ecuador was sold on October 1. After transferring these assets, Repsol completed the divestment of its LPG business in Latin America. Autogas (LPG for vehicles) is the most widely-used alternative fuel in the world, in over 26 million vehicles (more than 14 million in Europe). Although it has yet to make a meaningful impact on the Spanish market, sales growth exceeded 6% in 2016, confirming the increased demand for this affordable fuel that also helps improve urban air quality. Repsol, fully aware of the growing interest in this alternative fuel, had 745 supply points equipped with Autogas pumps in Spain and Portugal by the end of 2016, 369 of which are at service stations in Spain.

Translation of a report originally issued in Spanish. In the event of a discrepancy, the Spanish language version prevails
50
5.2.6. GAS & POWER Gas & Power activities include the transportation, marketing, trading and regasification of liquefied natural gas, as well as renewable energy projects. At December 31, 2016, the Group had both its regasification and transport assets in its marketing businesses in North America, including the Canaport regasification plant and the gas pipelines in Canada and the United States. The main operating highlights are as follows: Natural Gas in North America 2016 2015 Variation
LNG regasified (TBtu) in Canaport (100%) 16 23 (7)
Gas marketed in North America (TBtu) 414 299 115
The volume marketed in North America increased by 38%. This growth arises from the development of business and the search for gas trading opportunities on the west coast and the marketing of larger volumes of gas from Upstream. In the US northeast, where natural gas supplies tend to be more limited, cold temperature scenarios may cause significant peaks in benchmark prices in the region, such as Algonquin (the benchmark price for the Boston area). The company's activity in the northeast is focused on optimizing the margin obtained from the marketing of LNG in capitalizing on the flexibility offered by the Canaport plant. That is, flexibility in send out allows for concentrating gas sales in days of peak prices in winter. During the year, the absence of sustained low temperatures over time, and the fall in the price of gas substitutes (eg: fuel and other petroleum products) adversely affect the peak prices of the winter period, thus reducing our capacity to capture the plant’s commercial margin, which explains the decrease in regasified volume.
In 2016, the wind power business in the United Kingdom was sold to China's SDIC Power. For further information, see the Divestments heading of section 4.1.

Translation of a report originally issued in Spanish. In the event of a discrepancy, the Spanish language version prevails
51
5.3. CORPORATION AND OTHERS Main events of the period
In March and after their review, the credit rating agencies, Standard & Poor’s (S&P), Moody’s and Fitch, confirmed that they would maintain Repsol's long-term debt credit ratings at BBB-, Baa2 and BBB, respectively.
On September 21, Repsol, S.A. and Criteria Caixa, S.A.U. sold 20% of Gas Natural SDG, S.A. to GIP III Canary 1 S.À R.L. for a total amount of 3,803 million euros. Repsol sold 100,068,934 shares, representing 10% of the share capital of Gas Natural SDG, S.A., for 1,901 million euros, thus generating income before tax of 233 million euros.
In 2016, Repsol placed three bond issues (the first for 100 million euros with a fixed annual coupon of 5.375%, maturing in January 2031; the second for 600 million euros with a floating-rate quarterly coupon of 3-months Euribor plus 0.70%, maturing on July 6, 2018; and the third for 100 million euros with a fixed annual coupon of 0.125%, maturing on July 15, 2019) through private placements.
Repsol also repaid the debt issued by ROGCI amounting to approximately $631 million, thus reducing its finance costs.
For further information on the main financial transactions performed in the period, see section 4.2.
In 2016, within the framework of the 2016-2020 Strategic Plan, Repsol continued to make progress toward its goals and opportunities following the integration of ROGCI and the challenges presented in the sector, through an organizational workforce adjustment process, thus eliminating 871 positions in Spain, in addition to significant adjustments in the US and Canada. Management was affected by these changes, with executives numbering 278 at December 31, 2016.
In 2016, the company continued to make progress on the transformation program for the purpose of making an effort to achieve the objectives set out in the Strategic Plan and providing a greater level of ambition regarding the changes required, in order for them to be sustainable over time, thanks to the trend in the company's culture and its management model. Various efficiency and transformation projects were therefore rolled out in several E&P, Downstream and Corporation business lines.
EMERGING BUSINESSES
Corporation and others includes the activities of Emerging Businesses. Repsol promotes and manages new initiatives in emerging areas that may generate business opportunities and make it possible to further develop the company's strategy beyond its traditional business. To do this, it has three tools:
Corporate Venture Capital: its goal is to capture and capitalize on external innovation by investing in start-ups with high development potential, in traditional and emerging areas of the company. These stakes are held through Repsol Energy Ventures, S.A. a fully-owned subsidiary of the Repsol Group.
Emerging Business Generation: its goal is to generate long-term sustainable businesses that, in the future, will allow integration with other Repsol areas/businesses, thereby contributing to the overall vision and strategy of the company.
Technology Valuation: its goal is to market the intellectual property generated by the company,
whether developed internally or purchased, that may have market value, where such externalization should not involve a loss of know-how and or competitive edge for Repsol.
The projects managed by this area include HEADS. It is a system for the early detection of underwater hydrocarbons, developed jointly with Indra. Its installation is planned in all Repsol refineries with maritime terminals, and it is to be marketed with third parties. It is presently installed in the Tarragona and Pampilla refineries, and on the Casablanca platform. In December 2016, a licensing agreement was signed with Indra, who will be the exclusive marketer of the HEADS system at a worldwide level.

Translation of a report originally issued in Spanish. In the event of a discrepancy, the Spanish language version prevails
52
During the year, OGCI Climate Investments (OCGI-CI) was incorporated as a vehicle for channeling investment committed by the partners ($1,000 million over ten years) to develop and accelerate the commercial rollout of innovative technologies of low greenhouse gas emissions. The emerging businesses area will channel Repsol's investment in this vehicle.
In 2016, the investees in the portfolio managed by Emerging Businesses turned in a strong performance. In particular:
Principle Power, where Repsol holds a stake of 24.79%, is the first company in the world able to design, install and operate a floating semi-submerged structure for offshore wind generation. The first prototype at real scale, WindFloat, is equipped with a Vestas 2 MW turbine, and produced more than 17 GWh from its commissioning in late 2011 until its dismantling in July 2016.
Graphenea, in whose capital we have held a 5.2% stake since 2013, within the scope of the INNVIERTE1 program, is one of the main producers of graphene in Europe. It is a member of the Graphene Flagship, the largest research program ever launched by the European Union. In 2016, Graphenea surpassed a million euros in invoicing for the second consecutive year.
Graphenea received a subsidy from the European Commission as part of the H2020 – SME Instrument program to finance the pre-commercial plant of graphene oxide that was built in 2016 and which will boost production capacity.
IBIL, a company in which Repsol holds a 50% stake, is the vehicle through which Repsol carries on its activities in the area of supplying energy for electric mobility. It has about 859 operational recharge points, both public and private, and continues to consolidate its fast recharge network infrastructure at Repsol Group service stations. Due to the IBIL electric mobility program, through the CLIMA Projects of the Spanish Ministry of Agriculture, Food and Environment, Repsol was able to certify for the fourth consecutive year a reduction in emissions of CO2. Repsol's CLIMA Electric Car project has already managed to reduce emissions of CO2 by 518 tons.
Scutum Logistic, S.L, a company in which we acquired a 15.4% in 2014, under the INNVIERTE program, is dedicated to the design, production and sale of electrical platforms and battery extraction systems for electric motorbikes. Both “removable battery pack” system, patented in Europe, and the industrial design of the electrical platform, adaptable to customer needs, are its main competitive advantages.
In 2016, Scutum's business volume totaled 468 units of electric motorbikes. Some 67% of sales were in Spain, where it continues to lead the sector with a 38% market share, and where it has signed major contracts with large corporate clients. Scutum has continued its international expansion, signing distribution agreements in Benelux, Switzerland and the United Kingdom, which now account for 33% of sales in the year. The Scutum project received the award for technology innovation in the twelfth edition of the SME awards given by the business newspaper Expansión and by the Madrid trade fair organization (IFEMA) in 2016.
Rocsole, a Finnish company in which we acquired a 15.62% stake in January 2016, is developing technology based on Electrical Capacitance Tomography (ECT) to generate imagery of the flow of multiphase fluids (water, crude oil, air) inside piping and monitor the rates of deposition build-up, thus optimizing maintenance costs and preventing unscheduled stoppages.
1 The INNVIERTE Program is part of the 2013-2020 Spanish Science, Technology and Innovation Strategy approved by Resolution of the Council of Ministers on February 1, 2013.

Translation of a report originally issued in Spanish. In the event of a discrepancy, the Spanish language version prevails
53
6. OTHER WAYS OF CREATING VALUE At Repsol we believe that our activities and operations contribute to sustainable socio-economic development and to the generation of wealth in the areas in which we operate. Repsol generates value in several areas: job creation and training for its employees; promotion of safe and environmentally-responsible actions; contribution through the payment of taxes and fees; support for research, development and innovation; investments in new businesses and initiatives; and other areas of social responsibility. In addition, relying on its strategy and policies, Repsol publicly and voluntarily commits to carrying on its activities in order to be a sustainable and competitive company. This means being an ever more responsible company with its employees, the environment, human rights and the development of the places where it operates.
6.1. PEOPLE1
One of our main competitive advantages lays in the people within the Company, with which we have a relationship based on respect and mutual trust, something that we believe is intrinsic to our company and essential in order to obtain return and excellent results. Accordingly, people management is now one of the critical elements for achieving the integration and transformation of the company. To meet the objectives of value creation and resilience, a review of our processes and ways of working is under way, in a bid to strengthen flexibility so that Repsol will be a company that is best equipped to face future challenges: more efficient, agile and innovative, oriented toward performance and talent development, integrated and inclusive, a reflection of the society in which we live and a reference point of excellence in corporate governance. In 2016, we have acted on the basis of two major pillars: the organization and the management model. In the former, Repsol is advancing in the implementation of an integrated organizational model that is more simple and efficient, that strengthens collaboration between areas and optimizes governance and control. In the latter, all people management models are being aligned with a view to achieving global management of talent, by fostering a leadership style based on achieving results through cooperation, with leaders who are an example of desired values and conduct. Meritocracy is being strengthened as a way of recognizing the contribution made by the most committed, best performing and highest potential individuals with a results-oriented focus and ensuring that they are given opportunities for professional development. In order to evaluate the company’s degree of cultural advancement, use is made of an opinion survey of a representative sample of employees in different areas, countries and professional categories. The results help us speed up the decision-making process, and re-focus actions where necessary. WORKFORCE At December 31, 2016, a total of 24,532 employees formed part of the Repsol workforce, which is 2,634 people less than in 2015. This workforce reduction was done thanks to an organizational efficiency
1 All the data in this chapter, except otherwise specified, refers to managed workforce which includes those people who are part of the companies in which Repsol establishes policies and guidelines for people management. Workforce figures include all types of contracts (permanent, temporary, partial retirees, etc.) and are calculated on the basis of the employment percentage of each employee.

Translation of a report originally issued in Spanish. In the event of a discrepancy, the Spanish language version prevails
54
process and, inorganically, the sale of non-strategic businesses. Both measures are included in the 2016-2020 Strategic Plan.
The organizational efficiency process is being carried out in phases in several countries in which we operate, taking into account the specific organizational needs of each country or business. In order to implement this process, termination criteria have been applied in accordance with each country's legislation and various labor unions, with which important agreements were reached, participated in the process. The employee terminations in all countries were carried out in accordance with best market practices. In Spain, the process is being carried out through a collective redundancy procedure. The periods for consulting with employee representatives ended with agreements reached in the nine companies affected. The terminations began in August and will continue until December 31, 2018. A total of 1,047 employees are expected to be terminated, of which 838 relate to voluntary resignations. This level of voluntary resignations meant that we did not have to carry out mandatory appointments at any company, with the exception of Repsol Butano, S.A., which had several factories close as a result of its industrial plan.
(1) Only fixed or temporary employees with no prior working relationship with the company are considered to be new hires. The 43% of new employees in 2016 and 62% in 2015 had permanent contracts. The figures for 2016 relate mainly to new hires in Peru.
The organizational efficiency process has significantly increased the percentage of women in all groups and businesses, with the ratios forecast for 2018 achieved in 2016.
GENDER INDICATORS (1) 2016 2015 % women 35.7 33.4 % women in world leadership positions (2) % women in leadership positions in Spain (2)
26.7 32.0
23.9 28.6
% women in world management positions (3) 34.7 33.1 % women in management positions in Spain (3) 37.7 35.0
(1) Indicators calculated on the basis of the number of people (not on the basis of their employment percentage). (2) Includes the categories of Executives and Technical Managers excluded from the collective labor agreement. (3) Includes the categories of Executives, Technical Managers and managers excluded from the collective labor agreement.
WORKFORCE 2016 2015 Total workforce at December 31 26,877 29,494 Managed workforce 24,532 27,166 Non-managed workforce 2,345 2,328 Accumulated average managed workforce 26,444 27,887 No. of new employees in the year (1) 2,445 6,159
TOTAL MANAGED WORKFORCE 2016 2015 BY GEOGRAPHICAL AREA
Europe 17,833 18,774 Latin America 3,803 4,893 North America 1,589 2,013 Asia 1,095 1,249 Africa 148 160 Oceania 64 77
BY BUSINESS Corporation 2,402 2,945
Downstream 17,611 18,862 Upstream 4,519 5,359
73%
16%
6%4%
1% 0%
Europe
Latin America
Oceania
North AmericaAsia
Africa
Managed workforce by geographical area

Translation of a report originally issued in Spanish. In the event of a discrepancy, the Spanish language version prevails
55
The company has employees in 37 countries and has over 1,800 employees working outside their home country. The value contributed by this multicultural environment is increasingly apparent throughout the company.
The table below details the countries that have the greatest number of nationalities among their employees (excluding those of their own country):
DESTINATION COUNTRY 2016 2015 2016 2015 2016 2015 Spain 60 65 Malaysia 11 12 Trinidad and Tobago 7 12 United States 22 23 Vietnam 11 8 Venezuela 6 10 Canada 21 20 Norway 10 12 Bolivia 5 5 Algeria 17 16 Russia 8 11 The Netherlands 5 3 Portugal 15 15 Singapore 8 7 Colombia 4 5 Australia 13 11 Indonesia 7 7 Ecuador 4 7 Brazil 13 16 Peru 7 9 Angola 3 7 VALUE PROPOSAL Our objective is to sustainably harmonize the company’s talent requirements in the short, medium and long term with individuals’ opportunities for development.
We believe management of internal talent is key to attaining the company's objectives in the short terms and to ensure that the company will have the profiles necessary to carry out its strategy. We have dedicated and committed professionals that have a positive impact on the Company's results.
Repsol offers a distinctive Employee Value Proposal (EVP) that, in accordance with our culture and values, defines the value of working at Repsol and the reasons why employees seek to work for and commit to the organization. The PVEcomprises all aspects that make the company attractive to employees, such as opportunities for professional advancement, compensation according to merit, equal opportunities, promotion of work-life balance, etc. In 2016, we further developed our EVP and our people management processes in order to recruit, retain, commit and recognize our employees.
2016 2015 WORKFORCE BY CATEGORY Age Women Men % of women Women Men % of women
Executives 30-50 27 94 22% 27 112 19% >50 20 137 13% 22 164 12%
Technical managers
<30 1 5 17% 2 1 67% 30-50 471 987 32% 494 1,118 31% >50 172 686 20% 177 903 16%
Technicians
<30 826 720 53% 941 1,065 47% 30-50 3,218 5,008 39% 3,306 5,733 37% >50 437 1,796 20% 491 2,106 19%
Clerical staff
<30 39 28 58% 68 59 54% 30-50 553 254 69% 588 271 68% >50 187 80 70% 258 161 62%
Manual workers junior personnel
<30 334 602 36% 345 663 34% 30-50 1,996 4,035 33% 1,949 4,174 32% >50 340 1,480 19% 307 1,661 16%
TOTAL 8,620 15,912 35% 8,976 18,190 33%

Translation of a report originally issued in Spanish. In the event of a discrepancy, the Spanish language version prevails
56
RETAINING TALENT 2016 2015 Total turnover rate (1) 13% 7%
Voluntary turnover rate (2) 4% 3%
Total executive turnover rate (3) 22% 8%
(1) Corresponds to the total turnover rate of permanent employees out of the total number of employees at year-end. (2) Corresponds to the voluntary turnover rate of permanent employees out of the total number of employees at year-end. (3) Corresponds to the total turnover rate of executives out of the total number of executives at year-end.
The increase in the total turnover rate is due to the employee termination process, however, the voluntary employee turnover rate has remained stable over the last few years, at a rate that is less than the average in virtually all geographical areas.
We remain committed to the incorporation of young talent. We have adapted to the current environment our Masters programs and are receiving university students and occupational students on internships.
HIRING YOUNG TALENT (1) 2016 2015 (2) New professionals that completed the program 106 142
University internship agreements to consolidate training 423 455
Medium and higher level vocational training internships (3) 109 150
(1) Indicators calculated on the basis of the number of people (not on the basis of their employment percentage). (2) The figures for 2015 reflected in the table above correspond to the companies managed by the Repsol Group, not including ROGCI
companies. (3) These figures include students from medium and higher level vocational training cycles, with a high percentage of these joining Repsol's
workforce through various job vacancies. In 2016, Repsol continued the commitment it had assumed with the FP Dual program.
COMPENSATION AND PERFORMANCE EVALUATION The Company has assumed a commitment with its employees to provide them with complete compensation schemes that ensure external competitiveness and internal fairness, based on meritocracy, and that assess individual performance, cooperation and teamwork. In 2016 Repsol modified its complete compensation model, which includes fixed remuneration, benefits, and yearly and multi-year variable remuneration.
(1) Corresponds to staff costs (including social security and other expenses, except termination benefits, directors’ remuneration and travel
expenses) of the average accumulated workforce.
A single, meritocracy-focused, yearly variable remuneration model was implemented for employees excluded from the collective labor agreement. The model unifies criteria, consolidates methodologies, integrates best practices and separately evaluates the How (performance) the What (results) in achieving individual objectives.
Further, a new compensation framework has been designed for employees with international assignments that unifies previous arrangements. It is aligned with market and sector practices, and it can segments according to either duration or purpose criteria.
COMPENSATION 2016 2015
Average staff costs per employee (thousand of euros) (1) 76.0 80.2
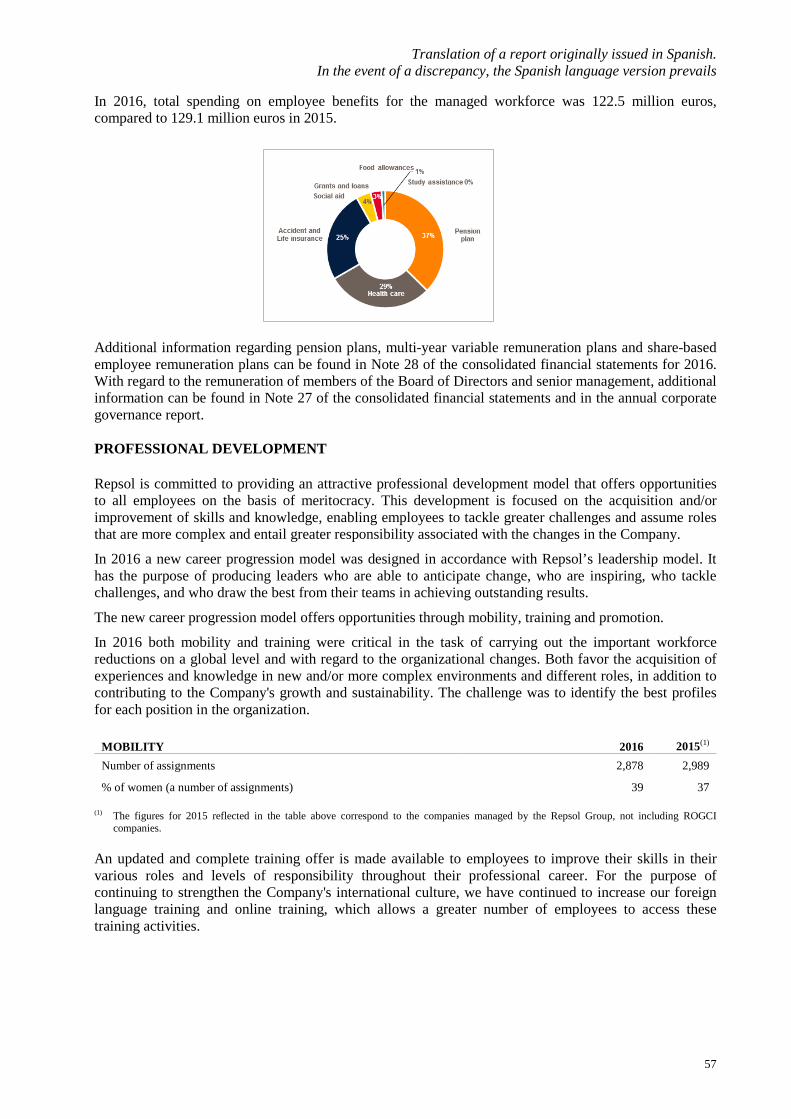
Translation of a report originally issued in Spanish. In the event of a discrepancy, the Spanish language version prevails
57
In 2016, total spending on employee benefits for the managed workforce was 122.5 million euros, compared to 129.1 million euros in 2015.
Additional information regarding pension plans, multi-year variable remuneration plans and share-based employee remuneration plans can be found in Note 28 of the consolidated financial statements for 2016. With regard to the remuneration of members of the Board of Directors and senior management, additional information can be found in Note 27 of the consolidated financial statements and in the annual corporate governance report. PROFESSIONAL DEVELOPMENT
Repsol is committed to providing an attractive professional development model that offers opportunities to all employees on the basis of meritocracy. This development is focused on the acquisition and/or improvement of skills and knowledge, enabling employees to tackle greater challenges and assume roles that are more complex and entail greater responsibility associated with the changes in the Company.
In 2016 a new career progression model was designed in accordance with Repsol’s leadership model. It has the purpose of producing leaders who are able to anticipate change, who are inspiring, who tackle challenges, and who draw the best from their teams in achieving outstanding results.
The new career progression model offers opportunities through mobility, training and promotion.
In 2016 both mobility and training were critical in the task of carrying out the important workforce reductions on a global level and with regard to the organizational changes. Both favor the acquisition of experiences and knowledge in new and/or more complex environments and different roles, in addition to contributing to the Company's growth and sustainability. The challenge was to identify the best profiles for each position in the organization.
MOBILITY 2016 2015(1) Number of assignments 2,878 2,989
% of women (a number of assignments) 39 37
(1) The figures for 2015 reflected in the table above correspond to the companies managed by the Repsol Group, not including ROGCI companies.
An updated and complete training offer is made available to employees to improve their skills in their various roles and levels of responsibility throughout their professional career. For the purpose of continuing to strengthen the Company's international culture, we have continued to increase our foreign language training and online training, which allows a greater number of employees to access these training activities.

Translation of a report originally issued in Spanish. In the event of a discrepancy, the Spanish language version prevails
58
Training type
(1) The figures for 2015 reflected in the table above correspond to the companies managed by the Repsol Group, not including ROGCI companies. (2) Corresponds to the % of annual working hours dedicated to training. It is calculated based on the accumulated average workforce. Promotion is another way of recognizing employees that can accompany career progression.
PROMOTIONS 2016 2015(1) No. of people 1,349 1,619 % of women 37% 39%
(1) The figures for 2015 reflected in the table above correspond to the companies managed by the Repsol Group, not including ROGCI companies. WORK-LIFE BALANCE, INCLUSION AND EQUALITY
Repsol is a company known for promoting new working methods, ensuring equal opportunities, and supporting and facilitating a balance between personal and professional life.
With regard to work-life balance, we are gradually moving toward a culture of value creation and contribution. Repsol employees have flexibility in carrying out their work in order to adapt their workday to their personal circumstances, as long as their work activity makes this possible, and in accordance with the uses, customs and restrictions established in each country and geographical area.
The teleworking program is one of the initiatives that is most appreciated and best rated by employees.
TELEWORKING INDICATORS 2016 2015(1) No. of teleworkers worldwide 1,811 1,716
No. of teleworkers in Spain 1,709 1,620
No. of teleworkers in the rest of the world 102 96
(1) The figures for 2015 reflected in the table above correspond to the companies managed by the Repsol Group, not including ROGCI companies.
In 2016, Repsol signed the national teleworking agreement promoted by the Peruvian government.
Repsol also has an integration plan for disabled persons, which covers all areas of the organization. At December 31, 2016, Repsol had 586 disabled employees, representing 2.4% of its workforce.
In Spain, we surpassed the requirements of the General Law on Disability (LGD) in 2016 with 2.7%: 499 employees hired directly and an additional 37 equivalent people hired under other systems.
TRAINING 2016 2015(1) Total investment in training (million euros) 12 18 Investment per employee (€) 490 741 Total hours of training/year 998,045 1,074,858 Average hours/year per employee 41 45 Dedication rate (2) 2.25% 2.64% % of employees receiving training 86.2% 96.4% No. of people receiving training 20,927 23,185 No. of training activities 12,399 12,207
OtherSafety and Environment
Skills
Management
ForeignLanguage
Technical

Translation of a report originally issued in Spanish. In the event of a discrepancy, the Spanish language version prevails
59
(1) The figures for 2015 reflected in the table above correspond to the companies managed by the Repsol Group, not including ROGCI companies.
We actively collaborate with several international networks such as the ILO, the Latin American Network of Inclusive Companies, allowing us to export our model and make it available to European and Latin American companies that seek to foster the inclusion of this social group. Especially significant in 2016 was the internal and external dissemination of the second edition of the Differently-Abled White Paper, called the Diverse Talent White Paper, the second edition of the Overcoming Barriers Guide and the second edition of the Accessible Service stations Guide. In Spain, Repsol, S.A. is a company that has received the "Equality at the Company" Seal of Distinction from the Spanish Ministry of Health, Social Services and Equality. The Company signed an agreement with the Ministry in January 2014 to strengthen its commitment to fostering balanced participation between men and women in top management positions, including Management Committees, up to 37% by 2017. This commitment was surpassed in 2016 (38%, see gender indicator table in the Workforce section). LABOR/MANAGEMENT RELATIONS
LABOR/MANAGEMENT RELATIONS 2016 2015 Absenteeism (1) 3.56% 3.72%
(1) The rate of absenteeism due to common illnesses among personnel covered by a collective agreement is calculated as a comparison between
the workday to be completed and the workday actually completed in the absence of reasons of common illnesses. In 2016, a number of collective bargaining processes were undertaken with the workers’ representatives, and agreements were reached, such as the Tenth Collective Agreement of Repsol Comercial, the Twenty-Fifth and Twenty-Sixth Collective Agreements of Repsol Butano, the Collective Agreement of RIPSA, the Collective Agreement of RITSA, the Eleventh Collective Agreement of Repsol Petróleo, the Thirteenth Collective Agreement of Repsol Química, the Fifth and Sixth Collective Agreements of Repsol, S.A., and the Collective Agreement of Repsol Exploración. Also signed were the Collective Agreement of Repsol Directo, and the Seventh Supplementary Agreement of Repsol Lubricantes y Especialidades, S.A. In addition, as measures for workforce adjustment, an agreement was reached to implement a collective dismissal procedure in nine Group companies: Repsol, S.A., Repsol Exploración, Repsol Butano, Repsol Comercial, Repsol Química, Repsol Lubricantes y Especialidades, RIPSA, Repsol Petróleo and CAMPSARED. Internationally, agreements were signed in Brazil, Peru and Portugal. The European Works Council met on November 22, 2016.
INTEGRATION 2016 2015(1) No. of employees with disabilities in Spain 499 546
No. of employees with disabilities in the rest of the world 87 117
Total no. of employees with disabilities 586 663
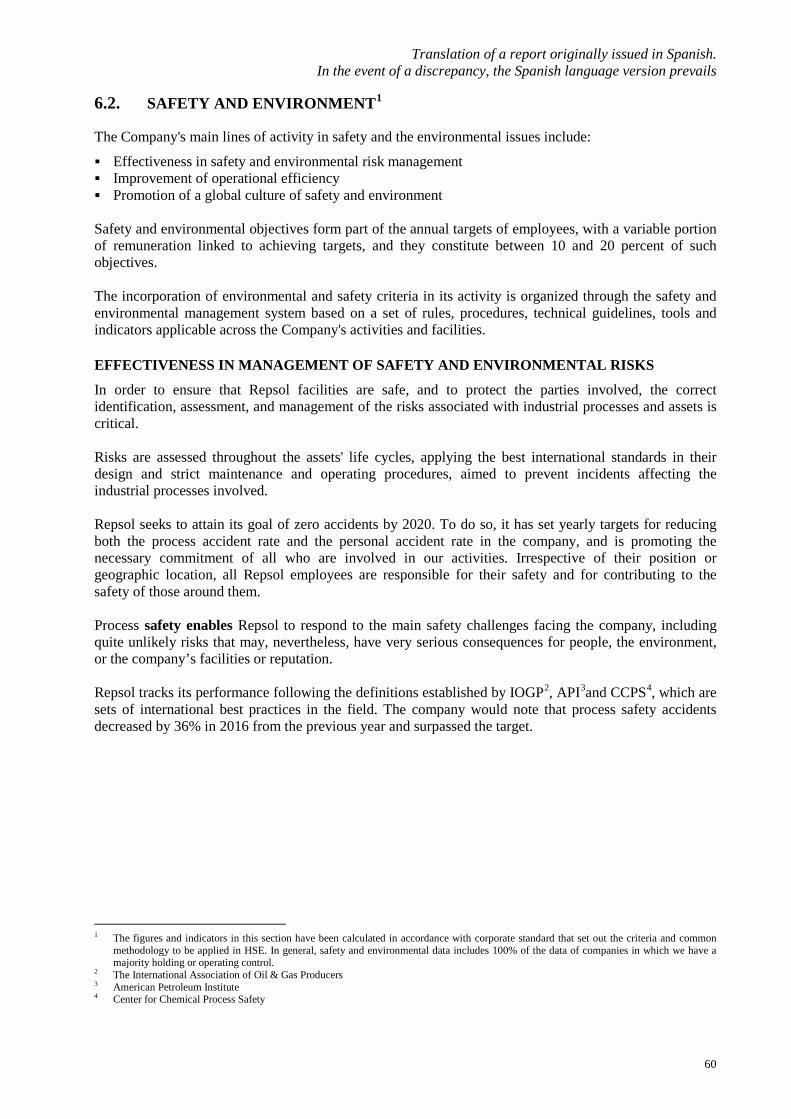
Translation of a report originally issued in Spanish. In the event of a discrepancy, the Spanish language version prevails
60
6.2. SAFETY AND ENVIRONMENT1
The Company's main lines of activity in safety and the environmental issues include:
Effectiveness in safety and environmental risk management Improvement of operational efficiency Promotion of a global culture of safety and environment
Safety and environmental objectives form part of the annual targets of employees, with a variable portion of remuneration linked to achieving targets, and they constitute between 10 and 20 percent of such objectives. The incorporation of environmental and safety criteria in its activity is organized through the safety and environmental management system based on a set of rules, procedures, technical guidelines, tools and indicators applicable across the Company's activities and facilities.
EFFECTIVENESS IN MANAGEMENT OF SAFETY AND ENVIRONMENTAL RISKS
In order to ensure that Repsol facilities are safe, and to protect the parties involved, the correct identification, assessment, and management of the risks associated with industrial processes and assets is critical. Risks are assessed throughout the assets' life cycles, applying the best international standards in their design and strict maintenance and operating procedures, aimed to prevent incidents affecting the industrial processes involved. Repsol seeks to attain its goal of zero accidents by 2020. To do so, it has set yearly targets for reducing both the process accident rate and the personal accident rate in the company, and is promoting the necessary commitment of all who are involved in our activities. Irrespective of their position or geographic location, all Repsol employees are responsible for their safety and for contributing to the safety of those around them. Process safety enables Repsol to respond to the main safety challenges facing the company, including quite unlikely risks that may, nevertheless, have very serious consequences for people, the environment, or the company’s facilities or reputation. Repsol tracks its performance following the definitions established by IOGP2, API3and CCPS4, which are sets of international best practices in the field. The company would note that process safety accidents decreased by 36% in 2016 from the previous year and surpassed the target.
1 The figures and indicators in this section have been calculated in accordance with corporate standard that set out the criteria and common
methodology to be applied in HSE. In general, safety and environmental data includes 100% of the data of companies in which we have a majority holding or operating control.
2 The International Association of Oil & Gas Producers
3 American Petroleum Institute 4 Center for Chemical Process Safety
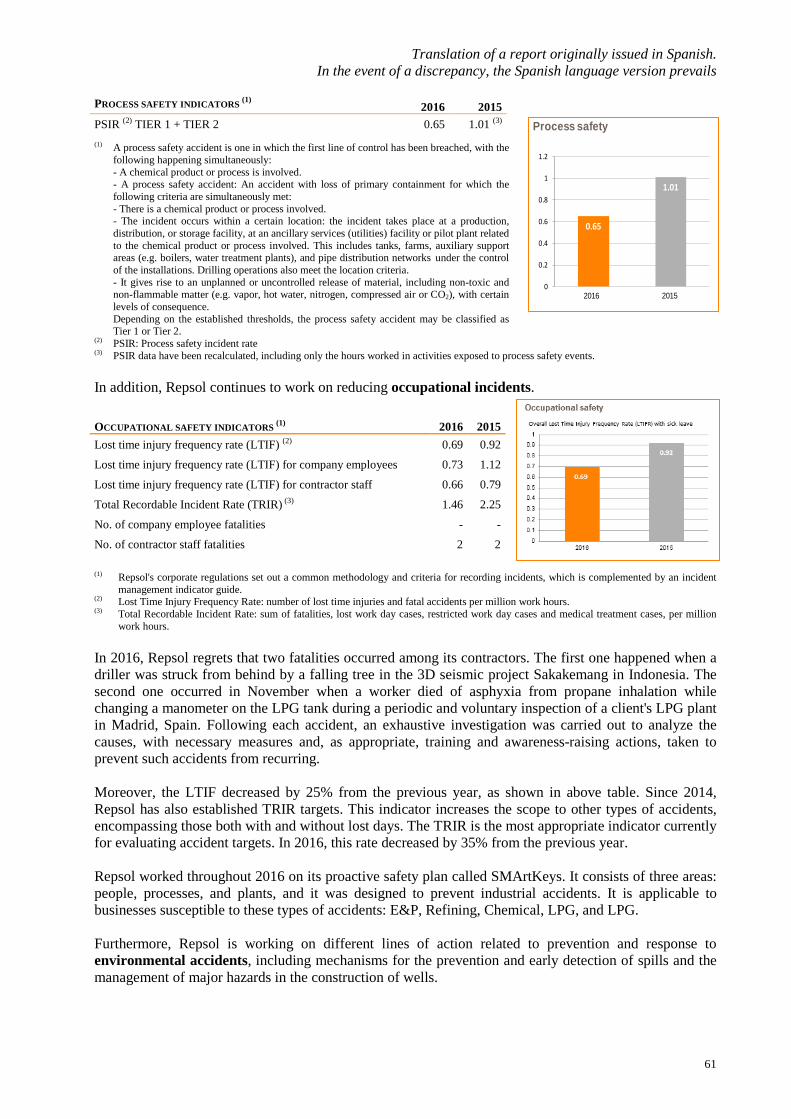
Translation of a report originally issued in Spanish. In the event of a discrepancy, the Spanish language version prevails
61
0.65
1.01
0
0.2
0.4
0.6
0.8
1
1.2
2016 2015
Process safety
(1) A process safety accident is one in which the first line of control has been breached, with the following happening simultaneously: - A chemical product or process is involved. - A process safety accident: An accident with loss of primary containment for which the following criteria are simultaneously met: - There is a chemical product or process involved. - The incident occurs within a certain location: the incident takes place at a production, distribution, or storage facility, at an ancillary services (utilities) facility or pilot plant related to the chemical product or process involved. This includes tanks, farms, auxiliary support areas (e.g. boilers, water treatment plants), and pipe distribution networks under the control of the installations. Drilling operations also meet the location criteria. - It gives rise to an unplanned or uncontrolled release of material, including non-toxic and non-flammable matter (e.g. vapor, hot water, nitrogen, compressed air or CO2), with certain levels of consequence. Depending on the established thresholds, the process safety accident may be classified as Tier 1 or Tier 2.
(2) PSIR: Process safety incident rate (3) PSIR data have been recalculated, including only the hours worked in activities exposed to process safety events. In addition, Repsol continues to work on reducing occupational incidents.
(1) Repsol's corporate regulations set out a common methodology and criteria for recording incidents, which is complemented by an incident
management indicator guide. (2) Lost Time Injury Frequency Rate: number of lost time injuries and fatal accidents per million work hours. (3) Total Recordable Incident Rate: sum of fatalities, lost work day cases, restricted work day cases and medical treatment cases, per million
work hours. In 2016, Repsol regrets that two fatalities occurred among its contractors. The first one happened when a driller was struck from behind by a falling tree in the 3D seismic project Sakakemang in Indonesia. The second one occurred in November when a worker died of asphyxia from propane inhalation while changing a manometer on the LPG tank during a periodic and voluntary inspection of a client's LPG plant in Madrid, Spain. Following each accident, an exhaustive investigation was carried out to analyze the causes, with necessary measures and, as appropriate, training and awareness-raising actions, taken to prevent such accidents from recurring. Moreover, the LTIF decreased by 25% from the previous year, as shown in above table. Since 2014, Repsol has also established TRIR targets. This indicator increases the scope to other types of accidents, encompassing those both with and without lost days. The TRIR is the most appropriate indicator currently for evaluating accident targets. In 2016, this rate decreased by 35% from the previous year. Repsol worked throughout 2016 on its proactive safety plan called SMArtKeys. It consists of three areas: people, processes, and plants, and it was designed to prevent industrial accidents. It is applicable to businesses susceptible to these types of accidents: E&P, Refining, Chemical, LPG, and LPG. Furthermore, Repsol is working on different lines of action related to prevention and response to environmental accidents, including mechanisms for the prevention and early detection of spills and the management of major hazards in the construction of wells.
PROCESS SAFETY INDICATORS (1) 2016 2015 PSIR (2) TIER 1 + TIER 2 0.65 1.01 (3)
OCCUPATIONAL SAFETY INDICATORS (1) 2016 2015 Lost time injury frequency rate (LTIF) (2) 0.69 0.92
Lost time injury frequency rate (LTIF) for company employees 0.73 1.12
Lost time injury frequency rate (LTIF) for contractor staff 0.66 0.79
Total Recordable Incident Rate (TRIR) (3) 1.46 2.25
No. of company employee fatalities - -
No. of contractor staff fatalities 2 2
Translation of a report originally issued in Spanish. In the event of a discrepancy, the Spanish language version prevails
62
(1) Figure for oil spills of more than one barrel
In 2016, Repsol had a significant fuel spill1 in marketing Peru in the road transport of an oil tank. When a spill occurs, the company activates its emergency response mechanisms and subsequently implements new preventive actions to prevent recurrence. IMPROVEMENT OF OPERATIONAL EFFICIENCY
Repsol continuously seeks to minimize the environmental impact of its activities by promoting a low-emissions strategy, optimizing and improving water and waste management, treating biodiversity as a key element and improving waste management. Reducing energy and carbon intensity in our value chain
Repsol shares society’s concerns regarding the effect human activity is having on the climate. The company recognizes that the current trend of greenhouse gas emissions is higher than required to limit the rise of the average global temperature to no more than 2ºC above pre-industrial levels. Repsol is working to make the company part of the solution to climate change. Repsol's commitment is articulated through its carbon strategy and the target of reducing CO2 by 1.9 million tons for the 2014-2020 period. In 2016, Repsol is continuously improving and taking actions that have, so far reduced by 3122kt of CO2 equivalent, which means that since 2014, a reduction of nearly 65% of the target set for the entire period was achieved. Repsol is committed to greater energy efficiency in its operations by contributing to increasing the presence of gas in its energy mix and by boosting the development of the capture, use and storage of CO2. It is also committed to continuously improving the use of energy resources in its facilities and activities throughout their life cycle by optimizing the technology and design of processes, the operation of facilities and supporting the purchase of energy-efficient products and services. The company considers natural gas to be the most efficient solution for fostering a structured transition to a low-emissions future in the generation of electrical energy. Emissions of CO2 per energy unit account for approximately half of those related to coal, not including the performance gap between the technologies associated with these fuels in electricity generation. In this regard, Repsol is well positioned vis-à-vis its competitors: its Upstream portfolio is evolving towards a higher percentage of gas: about 65% in production and 75% of reserves are gas. The capture, use and storage of CO2 is a factor to be considered in the policy of reducing emissions of CO2 in the company's value chain, and its activity will focus on projects that are economically viable, while also socially and reputationally acceptable.
1 A spill is considered to be significant (based on the spillage volume and the sensitivity of the area) when it reaches the environment and
meets any of the following conditions: it is greater than 100 bbl, it is greater than 10 bbl and occurs in a sensitive area, or any spill of a non-hydrocarbon substance, which is over 10 bbl and that has environmental significance due to its high salinity, acidity, toxicity or lack of biodegradability.
2 Data under process of regulatory verification pursuant to ISO 14064. Once verification is complete, data will be available on the Repsol website.
SPILLS 2016 2015 Number of oil spills > 1 barrel that reach the environment 11 21
Volume of oil spills that reach the environment (metric tons) (1) 40 23

Translation of a report originally issued in Spanish. In the event of a discrepancy, the Spanish language version prevails
63
In addition, the company also continuously monitors trends and the latest technologies being developed in renewable energy, investing in sustainable mobility and contribution to emissions reductions through production of and research into biofuels. Repsol is part of the Oil and Gas Climate Initiative (OGCI)1 in coalition with nine oil & gas sector companies. This is a voluntary initiative designed to share best practices and technology solutions between members, to thereby coordinate actions and intensify our investments in the battle against climate change. The initiative created a fund, the OGCI Climate Investment Fund, which will invest $1 billion over 10 years to finance businesses and projects that help reduce greenhouse gas emissions. Also, in June, Repsol signed on to the Climate and Clean Air Coalition (CCAC) - Oil & Gas Methane Partnership of the United Nations Environmental Program (UN Environment) and the Zero Routing Flaring by 2030 initiative of the World Bank. CCAC seeks to strengthen the oil & gas sector's commitment to reducing methane emissions. Methan is roughly 25 times more powerful than carbon dioxide as a heat trapping gas. The latter initiative obliges Repsol to seek out technically and economically viable solutions for minimizing the routine use of gas flaring. The two initiatives boost our emission reduction plans and will contribute to the company’s sustainability. Moreover, Repsol supports the setting of carbon prices as a political instrument that will aim to define a roadmap for investing in low-emission technology to support the quest for future that is compatible with scenarios below 2ºC. In its assets subject to legislation under carbon instruments, Repsol takes into account the price in all its new projects and investments and in the modifications it makes in existing operations, which serves as an incentive to increase energy efficiency and reduce emissions of CO2. In countries that have no carbon regulation, studies of sensitivity to projects and to its portfolio are conducted under different carbon price scenarios. It must be noted that in 2016, Repsol attained a leading position in the Climate Disclosure Project (CDP)2 due to its climate change strategy, with an A- grade. Standing in this range means that the company is outstanding in management of its carbon footprint, meeting its reduction targets and implementing programs to reduce emissions throughout its value chain, while adopting best practices in the field of environmental management. Toward a strategic vision of water
Water is a strategic resource for Repsol, with a key economic, social, and economic value. For the oil & gas sector, water is essential for producing energy, just as energy is necessary for extracting, transporting, and treating water. The search for a balance in the energy-water relationship is a key challenge in our activity.
The Repsol Water Tool3 (RWT) enabled the creation of a water risk map for the Company. For each facility, specific 2015-2020 Action Plans were created to minimize the main risks identified. At a general level, the following are the main lines of activity on which these Plans are focused:
- Improving inventory quality. In 2016, Repsol worked on standardizing and improving water balances, the identification and reporting of water-related costs and the description of the features of different water currents.
1 http://www.oilandgasclimateinitiative.com 2 More information on Repsol's strategy, results and management of risks and opportunities related to climate change at http://www.cdp.net/en 3 A tool designed by Repsol incorporating aspects of the Global Water Tool and Local Water Tool, the two main technologies developed and
adapted to the oil and gas industry for identifying and evaluating water’s impacts and threats.

Translation of a report originally issued in Spanish. In the event of a discrepancy, the Spanish language version prevails
64
- Preparation for new regulatory requirements. In 2016, Repsol continued work in Downstream industrial plants to be prepared to comply with new legislative requirements related to BREF1 and, in exploration and production assets, the spotlight is on the adequacy of the quality of all effluents as set out in company standards.
- Reduction of competition for water. In the year, Repsol continued working to attain excellence in operation throughout the life cycle of water, reducing captures of fresh water, optimizing the efficiency of water use in operation and increasing the use of recirculated water prior to discharge.
For 2016, the Company had set a target of completing more than 85% of the lines of work in the plans. This objective was surpassed, with about 95% progress achieved.
Repsol also worked on adapting the RWT in order to identify and assess the main risks related to management of water in unconventional activities and in assets acquired in the purchase of ROGCI. The objective of the company for 2017 is to implement the Action Plan defined for these new assets.
Protection and conservation of biodiversity and ecosystem services2
Repsol is committed to mitigating potential impacts on biodiversity and the resources it provides (ecosystem services) in its planning and execution of projects and operations. The company is inspired by the following principles for sustainable development in carrying on its activities:
- Preventing, minimizing and restoring the environmental impact in all its operations, and especially in sensitive, protected or biologically diverse natural spaces.
- Integrating biodiversity and protection of ecosystem services in the company's management systems and decision-making processes by including environmental and social assessments.
- Taking part in projects of research, conservation, education and awareness-raising.
- Reporting on biodiversity and collaborating with communities and other stakeholders.
Improve waste management and reduction
Repsol is working to improve waste management throughout the lifecycle of our processes. The company's commitment is reflected in the reduction target of 50,000 tons of waste for the 2015-2020 period. The annual target set was surpassed, with a reduction of 15,508 tons achieved in 2016 which, combined with the 9,000 tons reduction in 2015, meaning that the company has managed to attain nearly 50% its total reduction target for the period in only two years. In addition to this quantitative target, qualitative measures have been established to improve waste management. Repsol has set improvement targets for the Exploration and Production business through the implementation of company Environmental Performance Practices (EPP) in management of mud and drill cuttings. These guidelines are a set of standards applicable to all geographical areas in which the company operates and regardless each country's specific legislation. In 2016, 100 of the planned EPPS were implemented. 1 Reference document of best practices. 2 For more information on specific action related to safety and environment measures, see the Sustainability Report for 2016, and the website www.repsol.com.

Translation of a report originally issued in Spanish. In the event of a discrepancy, the Spanish language version prevails
65
20162015
Direct emissions of greenhouse gasesCO2 (Million Tn)
17.8919.69
(1) Figures at December 31, 2016 corresponding to energy and carbon management indicators are subject to an independent verification process
that is completed after the preparation of this report. Definitive figures will published on the Repsol website. (2) The calculation of energy consumption includes all fuels burned at the facility in order to generate the energy required by processes (both
external fuel, usually natural gas, and internal fuel generated at the facility), as well as the net balance of imports and exports of electricity and steam. Data for 2015 have been modified with respect to the 2015 Management Report due to the update of the conversion factors used for the assets of ROGCI.
(3) The increase in 2016 on the previous year is due to the inclusion of the assets of ROGCI from the month of January (2015 figures include ROGCI from its acquisition in May).
(4) The 2015 figures have been modified with respect to the 2015 Management Report as a result of verification carried out subsequent to the issue of that report.
(5) The global warming potentials used for the conversion to tons of equivalent CO2 have been updated, based on the information published in the fourth report of the Intergovernmental Panel on Climate Change (IPCC) to align with the most common use reference in the sector.
(6) CO2 emissions reduction achieved through the implementation of greenhouse gas reduction actions, compared to the 2010 baseline. (7) Additionally, waste related to drilling muds should be considered, amounting to 169,372 tons and 243,609 tons in 2016 and 2015,
respectively. The increase in the year is mainly a result of the incorporation of the muds of ROGCI. (8) The increase observed in 2016 over the previous year is due to an increase in land management activities
PROMOTION OF A GLOBAL CULTURE OF SAFETY AND ENVIRONMENT
Repsol understands that developing a safety and environmental culture shared by the entire company is crucial for achieving our goals.
In recent years, we have been working on defining a model of culture attributes, developing a diagnostic methodology that will enable us to ascertain safety and environmental culture and its degree of maturity in each facility, so as to establish improvement plans adapted to each context. This methodology is based on our own model of safety and environmental culture, which consists of 7 basic pillars upon which work in upcoming years will be based: safety and environmental leadership, fair recognition, trust in reporting, shared information, an organization that learns, sensation of vulnerability, and capacity to adapt. Diagnostics have already been carried out in LPG Spain, in the Bolivia business unit, in the area of Chemicals in Sines, Portugal, and in the Cartagena refinery. We have also conducted workshops in Norway, Canada and the US to share the model, and impressions were shared on the state of each unit with respect to the model, in order to detect the main areas for work to improve in safety culture.
OPERATIONAL EFFICIENCY INDICATORS
2016
2015
ENERGY AND CARBON MANAGEMENT(1) Energy consumption (106 GJ) (2) (3) 256 251 Direct emission of CO2 (million tons) (3)(4) 19.69 17.89 Direct emission of CH4 (million tons) (3) (4) 0.200 0.138 Direct emission of N2O (thousand tons) 0.799 0.883 Direct emission of CO2 eq (million tons) (3) (4) (5) 24.92 21.61 CO2 emissions reduced (million tons) (4) (6) 0.312 0.381 WATER MANAGEMENT Fresh water withdrawn (kilotons) 52,022 57,303 Recycled water (kilotons) 10,292 8,964 Water discharged (kilotons) 42,250 49,859 Hydrocarbons in discharged in water (tons) 245 384 WASTE MANAGEMENT (7) (8)
Hazardous waste (metric tons) 56,920 49,097 Non-hazardous waste (metric tons) 217,552 94,453 OTHER ATMOSPHERIC EMISSIONS
SO2 (tons) 29,214 28,304 NOX (tons) 34,498 40,268 COVNM (tons) (3) 54,874 51,993
56,920
49,097
2016 201544,000
46,000
48,000
50,000
52,000
54,000
56,000
58,000
metric tons
Hazardous waste

Translation of a report originally issued in Spanish. In the event of a discrepancy, the Spanish language version prevails
66
6.3. TAXES
REPSOL TAX STRATEGY AND POLICY Repsol is aware of its responsibility toward the economic development of the societies in which it operates and of the importance of paying taxes for these purposes.
Taxes paid by the Repsol Group have considerable economic importance and involve a major effort for compliance and collaboration with the authorities, and it entails significant obligations.
The Group's tax strategy and policy, approved by the Board of Directors of Repsol, S.A., is aligned with the company's mission and values, and with its long-term business strategy, and can be summarized as follows
“The Repsol Group is committed to managing its tax affairs by applying best tax practices and acting transparently, paying taxes in a responsible and efficient manner, and promoting cooperative relations with governments and avoiding significant risks and unnecessary disputes."
Repsol strives to align itself with the best practices available with respect to tax transparency. Hence, it has a specific section on the corporate website with its tax policy and performance, which may be accessed at the following link: https://www.repsol.com. IMPACT OF TAXATION ON COMPANY INCOME
Taxes have a significant impact on the Group's results.
Repsol is subject to various types of income tax in the countries where it operates. Each tax has its own structure and withholding rate. The tax rates applicable to profits on production of hydrocarbon (Upstream activities) are usually higher than general rates. In some cases, profits are not only taxed in the country where they are earned but also in the country where the companies that own the operations or their parent companies are domiciled (double taxation).
Additionally, Repsol is subject to other taxes that reduce its profits and, particularly, its operating results. This is the case of taxes on hydrocarbon production (royalties and similar), local taxes and fees, employment taxes and social security contributions, etc.
In 2016, the impact on net income was as follows: 2016 2015 Description
Amount Rate Amount Rate
Income tax 238 14.4%(1) (909) (33.2%) Total tax burden (2) 1,066 43.1%(3) (76) (2.9%)
(1) Income tax: Income tax/net income before tax, excluding Gas Natural Fenosa (2) Total tax burden includes: Income Tax + taxes and contributions that are deducted from the operating result. (3) Total tax burden/net income before tax, excluding Gas Natural Fenosa Sign convention: (+) tax expense; (-) tax income

Translation of a report originally issued in Spanish. In the event of a discrepancy, the Spanish language version prevails
67
TAX CONTRIBUTION BY COUNTRY In 2016, Repsol paid more than 11,764 million euros in taxes and similar public charges1, and filed more than 53,000 tax returns.
In order to enable monitoring and analysis of the Group’s tax contribution, taxes paid are segmented into those that involve an actual expense for the company, reducing its results (for example, corporate income tax, tax on production, social insurance payable by the company) and those that do not reduce results because they are withheld or passed on to the final taxpayer (such as value-added tax, tax on the sale of hydrocarbons, withholding taxes, etc.). The former are called “Tax burden” and the latter “Taxes collected.” Taxes effectively paid in 2016, by country
Million euros
Tax burden Taxes collected
Corporate income tax
Total 2016 taxes paid
Total 2015 taxes paid Other Total VAT TH 1 Other Total
Spain 783 419 1,202 2,489 4,929 342 7,760 8,962 8,762 Portugal 30 11 41 279 787 19 1,085 1,126 1,140 Italy - 3 3 30 136 2 168 171 206 The Netherlands 89 - 89 - - -1 -1 90 58 Norway - 3 3 17 - 24 41 44 15 Other 3 11 14 -39 - 32 -7 7 10 Europe 905 447 1,352 2,776 5,852 420 9,048 10,400 10,191 Peru 18 61 79 276 143 22 441 520 564 T&T 4 30 34 -40 - 5 -35 -1 176 Brazil 1 82 83 - - 20 20 103 137 Bolivia 40 6 46 28 - 5 33 79 125 Colombia 23 1 24 -4 - 19 15 39 56 Venezuela 6 5 11 12 - 2 14 25 81 Ecuador 6 7 13 1 - 5 6 19 43 Other - - - - - - - - 46 Latam & Caribbean 98 192 290 273 143 78 494 784 1,228
Indonesia 128 0 128 2 - 6 8 136 130 Malaysia 0 142 142 -18 - 17 -1 141 121 Russia 5 52 57 6 - 2 8 65 66 Vietnam 13 15 28 -2 - 2 0 28 28 Other - 2 2 4 - 15 19 21 16 Asia and Oceania 146 211 357 -8 - 42 34 391 361 United States -3 48 45 2 - 42 44 89 80 Canada 2 20 22 -5 - 47 42 64 74 North America -1 68 67 -3 - 89 86 153 154 Algeria 20 3 23 - - 5 5 28 27 Other - 1 1 - 1 6 7 8 28 Africa 20 4 24 0 1 11 12 36 55
TOTAL 1,168 922 2,090 3,038 5,996 640 9,674 11,764 11,989
1 Tax on hydrocarbons. Includes amounts paid by logistics operators when the company is ultimately responsible for payment.
1 Only taxes actually paid during the year are counted: hence taxes accrued during the period but that will be paid in the future are not included.
Refunds from previous years are not included.
Translation of a report originally issued in Spanish. In the event of a discrepancy, the Spanish language version prevails
68
TAX HAVENS
In accordance with its tax policy, Repsol refrains from the use of opaque or artificial structures that aim to conceal or reduce the transparency of its activities. Repsol is committed to not having a presence in tax havens, unless it is for legitimate business reasons.
If it has a presence in a tax haven, the following is guaranteed: (i) authorization by Board of Directors of the incorporation or acquisition of a company, along with periodic reporting on activity; (ii) strict compliance with regulations governing its business activities; (iii) application of the general standards and procedures for administration and control of Group business procedures; and (iv) full transparency and cooperation with relevant authorities in supplying any information requested on the Group’s business activities.
The company is actively working to reduce its already limited presence in territories classified as tax havens or that are regarded as non-cooperative by tax authorities. For these purposes, the official lists of tax havens approved by the OECD and the Spanish government are used as a reference.
In recent years, Repsol has significantly reduced its presence in these territories from more than 40 companies to a negligible level, as described below.
Repsol has no presence in territories included in the OECD's list of uncooperative tax havens of 2012, which are classified as “lacking information transparency.”
With respect to the Spanish list of tax havens, as of December 31, 2016, Repsol has no active controlled company with its registered address and tax residence in such territories. Nevertheless, the following must be noted:
a) The Group holds two controlled entities domiciled in a tax haven that are inactive and/or in the process of liquidation: Greenstone Assurance Ltd., (Bermuda): an insurance company whose current purpose is
limited to liquidating risks assumed in the past (a run off situation, in insurance jargon), and
Permanent establishment in Liberia of Repsol Exploración Liberia BV (The Netherlands): it previously previously conducted hydrocarbon exploration and production activities, but it has ceased its activity and is currently in the process of de-registration.
b) The Group holds minority, non-controlling interests in four companies located in tax havens:
Oil Insurance, Ltd. (5.68%; Bermuda) and Oil Casualty Insurance, Ltd. (1.83%; Bermuda): mutual insurance companies in the oil & gas sector, covering Group risks from Bermuda, where insurance companies dealing with the international risks of E&P oil activity are typically located;
Oleoducto de Crudos Pesados, Ltd. (29.66%, Cayman Islands): a company that includes an international association agreement (joint venture) that channels the investment in an Ecuadoran operating company that manages oil activity infrastructures (Oleoducto de Crudos Pesados);
Transasia Pipeline Company (15%, Mauritius): a joint venture that channels the investment in an Indonesian operating company that manages gas infrastructures (PT Perusahaan Transportasi Gas Indonesia).
Translation of a report originally issued in Spanish. In the event of a discrepancy, the Spanish language version prevails
69
c) There are three Group companies which were originally incorporated in tax havens but that have moved their tax residence either to European Union countries or to other participant countries in G-20 initiatives which are not classified as tax havens:
Fortuna Resources (Sunda), Ltd: a company that had exploration assets in Indonesia and
which is currently inactive and whose liquidation is pending the conclusion of several legal proceedings. The company was originally incorporated in the British Virgin Islands, but it moved its tax residence to the United Kingdom.
Foreland Oil Limited: a company with exploration assets in Papua New Guinea, although they are in the process of being transferred to other Group companies as a step towards the company's liquidation. The company was originally incorporated in the British Virgin Islands, but it moved its tax residence to the United Kingdom.
Santiago Oil Company, Ltd: non-controlled company (49%) that holds acreage in Colombia. The company was originally incorporated in the Cayman Islands, but it moved its tax residence to Colombia.
Lastly, Repsol has no companies domiciled in countries or territories classified by Spanish law as nil-tax jurisdictions other than the aforementioned tax havens.
Repsol's presence in these territories is not an attempt to reduce the transparency of its activities or engage in undesirable – much less illegal – practices, but is related to appropriate purposes that are in line with conventional sector standards.
COOPERATIVE RELATIONS The Group is committed to strengthening a relationship with the tax authorities inspired by the principles of trust, good faith, professionalism, collaboration, loyalty and a search for mutual understanding on a basis of reciprocity, all for the purpose of ensuring application of the tax system, increasing legal certainty and reducing litigation. Repsol in Spain has followed the Code of Best Tax Practices since 2010, an initiative that fosters a cooperative relationship between the Spanish tax agency (AEAT) and companies. As an expression of the commitment to stronger transparency undertaken under the CBPT, Repsol has voluntarily submitted to the AEAT its "2015 Tax Transparency Report," which includes significant information on the Group's economic activity and its tax-related actions and decisions. In Portugal, Repsol is a founding member of the Large Enterprise Forum, which was created in 2014. The Repsol Group also participates in similar initiatives in Singapore, the United Kingdom and Netherlands. Lastly, Repsol is also part of the Extractive Industry Transparency Initiative (EITI). It also shares and supports the principles outlined in the BIAC Statement of Tax Principles for International Business and the OECD Guidelines for Multinational Enterprises. MANAGEMENT OF TAX RISK Tax affairs are handled in an orderly and expert fashion to guarantee proper compliance with tax obligations and management of risks of a tax nature. Efficient procedures, systems, and internal controls are in place to ensure correct execution of tax-related processes. The Group has an appropriate organization for ensuring application of its tax policies. The organizational principles provide assurance that tax matters are handled by expert teams in a manner that is professional, integrated (according to a single criteria), and global, as responsibility encompasses all the Group's tax matters in every area of activity.

Translation of a report originally issued in Spanish. In the event of a discrepancy, the Spanish language version prevails
70
The Board of Directors is informed periodically, and at least once a year, of the policies and strategies followed during the year, and of the most relevant aspects pertaining to the management of tax affairs and tax risks. Likewise, any transaction which may entail a special tax risk is submitted to the Board of Directors for approval. Accordingly, investment and divestment proposals and significant company operations include an analysis of tax implications prior to decision making, thus allowing the Group to identify investments or transactions that may involve a special tax risk. The management of tax risks is embedded in the Group's overall policy of Integrated Risk Management. It is embodied in the existence of internal processes, systems and controls for the management of tax risks. The Group keeps an updated risk map in which tax-related risks are specifically identified, whether they arise from (i) tax policies applied, (ii) possible non-compliance, (iii) or controversies regarding the interpretation and application of laws, or the instability of the tax, legal or contractual framework. Similarly, the Repsol Group actively manages its tax risks so as to mitigate or eliminate them and, if it must assume such risks – because an understanding with the tax authorities cannot be reached – it undertakes the best possible defense of the Group’s legitimate rights.
6.4. RESEARCH, DEVELOPMENT AND INNOVATION (R+D+i)
The world is in the midst of a process of change and transformation in which the development of new technologies, their transfer and implementation are a guarantee that Repsol can offer quality products and services in the present, and also prepare for the future. Pursuit of R+D projects, the creation of basic knowledge and its scaling to new technologies being implemented and work in a collaborative network are some of the keys in Repsol's innovation strategy. In 2016, further advances were made in the development of pioneering technologies in hydrocarbon exploration and production and mainly in the implementation phase of technologies in company projects. As examples of new technology achievements, the Sherlock project completed installation of all capacities in digital petrophysics for the description of storage, and Pegasus has now produced its first prototype of cognitive technology for acquisition of assets and optimization of development plans. Among other achievements, the Horus Project successfully completed its concept test with nano-sensors embedded in drilling cement capable of communicating with one another at the bottom of a well and generate energy within their own casing, for the purpose of monitoring wells’ integrity. In our refinery technology, processes have been designed in laboratories and pilot plants of the Repsol Technology Center that have been successfully implemented in our industrial plants to improve their efficiency. Noteworthy is the knowledge developed to exploit the processing of opportunity crude oil, allowing for adjusting processes to the supply of such crude, while products are adapted to market demand. Also, prototypes have been developed that allow for offering products with a high technology load, such as smart asphalt, or lubricants designed to save fuel in state-of-the-art engines. The SPAIN 2017 project, which is an initiative for research in mobility, aims to develop a demonstration vehicle that combines a fuel combustion engine with electric propulsion and the recovery of thermal and kinetic energy. The project, undertaken in a consortium with other companies, has advanced according to plan and now has yielded a set of experimental developments that are ready for testing to demonstrate the viability of a propulsion system focused on improving efficiency and reducing local emissions in urban environments.
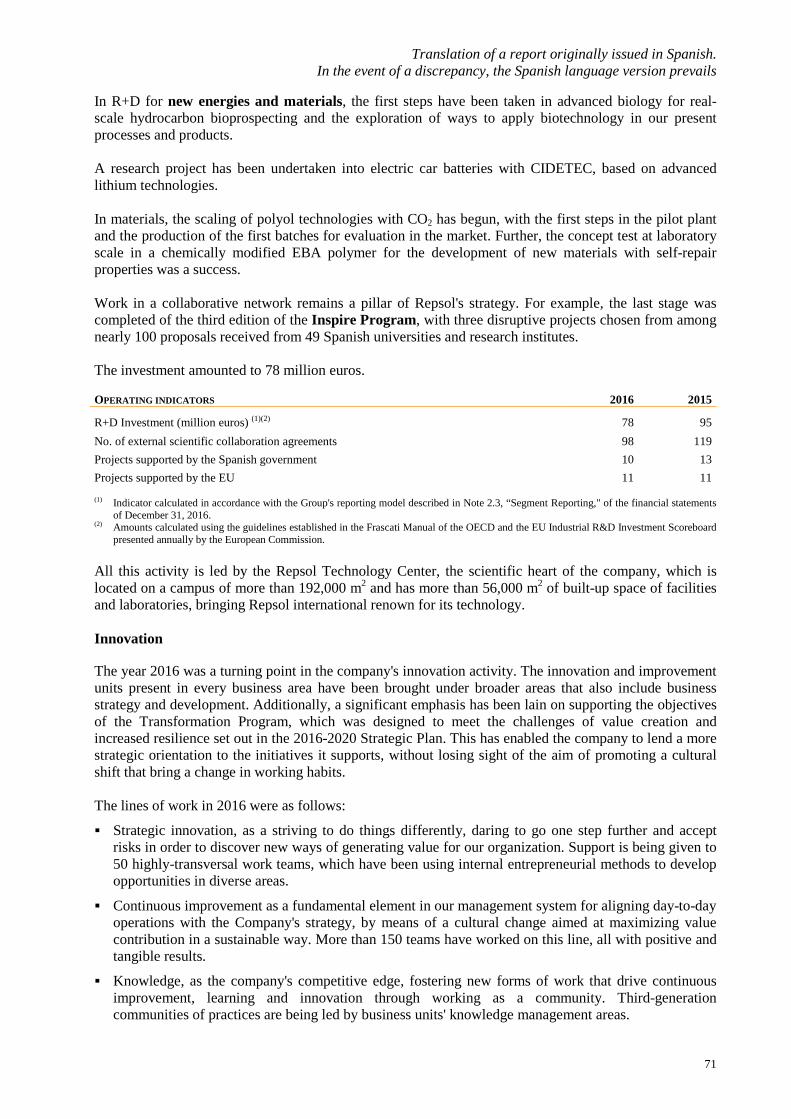
Translation of a report originally issued in Spanish. In the event of a discrepancy, the Spanish language version prevails
71
In R+D for new energies and materials, the first steps have been taken in advanced biology for real-scale hydrocarbon bioprospecting and the exploration of ways to apply biotechnology in our present processes and products. A research project has been undertaken into electric car batteries with CIDETEC, based on advanced lithium technologies. In materials, the scaling of polyol technologies with CO2 has begun, with the first steps in the pilot plant and the production of the first batches for evaluation in the market. Further, the concept test at laboratory scale in a chemically modified EBA polymer for the development of new materials with self-repair properties was a success. Work in a collaborative network remains a pillar of Repsol's strategy. For example, the last stage was completed of the third edition of the Inspire Program, with three disruptive projects chosen from among nearly 100 proposals received from 49 Spanish universities and research institutes. The investment amounted to 78 million euros. OPERATING INDICATORS 2016 2015
R+D Investment (million euros) (1)(2) 78 95 No. of external scientific collaboration agreements 98 119 Projects supported by the Spanish government 10 13 Projects supported by the EU 11 11 (1) Indicator calculated in accordance with the Group's reporting model described in Note 2.3, “Segment Reporting," of the financial statements
of December 31, 2016. (2) Amounts calculated using the guidelines established in the Frascati Manual of the OECD and the EU Industrial R&D Investment Scoreboard
presented annually by the European Commission. All this activity is led by the Repsol Technology Center, the scientific heart of the company, which is located on a campus of more than 192,000 m2 and has more than 56,000 m2 of built-up space of facilities and laboratories, bringing Repsol international renown for its technology.
Innovation
The year 2016 was a turning point in the company's innovation activity. The innovation and improvement units present in every business area have been brought under broader areas that also include business strategy and development. Additionally, a significant emphasis has been lain on supporting the objectives of the Transformation Program, which was designed to meet the challenges of value creation and increased resilience set out in the 2016-2020 Strategic Plan. This has enabled the company to lend a more strategic orientation to the initiatives it supports, without losing sight of the aim of promoting a cultural shift that bring a change in working habits. The lines of work in 2016 were as follows:
Strategic innovation, as a striving to do things differently, daring to go one step further and accept risks in order to discover new ways of generating value for our organization. Support is being given to 50 highly-transversal work teams, which have been using internal entrepreneurial methods to develop opportunities in diverse areas.
Continuous improvement as a fundamental element in our management system for aligning day-to-day operations with the Company's strategy, by means of a cultural change aimed at maximizing value contribution in a sustainable way. More than 150 teams have worked on this line, all with positive and tangible results.
Knowledge, as the company's competitive edge, fostering new forms of work that drive continuous improvement, learning and innovation through working as a community. Third-generation communities of practices are being led by business units' knowledge management areas.

Translation of a report originally issued in Spanish. In the event of a discrepancy, the Spanish language version prevails
72
6.5. SHAREHOLDERS AND INVESTORS
Repsol has an Investor Relations area that addresses the information needs of institutional investors as well as minority shareholders, including communication with fixed-income investors and financial analysts.
The primary indicators of its activity are as follows:
INFORMATION FOR SHAREHOLDERS AND INVESTORS 2016 2015 Calls answered by the Shareholder Information Office (SIO) (1) 30,000 27,000
Visits to investor section of Repsol website (2) 473,243 380,215
Roadshows and meetings with institutional investors (3) 29 49
Roadshows and meetings with socially responsible investors (3) 11 8
Roadshows with minority shareholders (3) 12 14
Members of the “Repsol en Acción” community 56,100 46,400
Events for minority shareholders 98 79
(1) The SIO deals with both current and potential minority shareholders. Includes calls answered by the Call Center. (2) Total visits to Shareholders and Investors section (Spanish and English versions). (3) Roadshows are visits to different cities to meet institutional investors or minority shareholders. The company publishes on its website the communication policy, which sets out the principles and criteria that govern communication and contact activities with shareholders, institutional investors and proxy advisers, thereby complying with the recommendations of the Spanish National Securities Market Commission (CNMV) in its Good Governance Code of Listed Companies.
Within its general lines of action in 2016, Repsol continued to strengthen its service model for socially responsible investors (Environmental, Social and Governance investors), whose weight among Repsol shareholders has remained stable at approximately 11%. With respect to services for minority shareholders, the loyalty program “Repsol en Acción,” through which benefits to such shareholders are coordinated, had about 56,000 members at year-end 2016. Additionally, half the members of the Shareholders' Advisory Committee were renewed, in accordance with its internal regulation. The members elected to the Committee participated in meetings in April, June, September and December. In 2016, the specialized Extel survey, which includes the vote of more than 20,000 investment professionals in Europe, recognized Repsol’s Chief Executive Officer, the Chief Financial Officer and Investor Relations team for their work in communication with the investment community.
6.6. COMMUNICATION
Repsol’s Communications policy aims to respond to the growing demands of its stakeholders by offering relevant and truthful information. In this manner, the Company reaffirms its commitment to transparency and responsibility, two emblems of its corporate identity.
In its communication activities, Repsol aims to convey its values proactively, and to share all business-related information with shareholders and investors, clients, suppliers, communities, and employees.
To materialize this commitment to transparency, Repsol uses all available channels and technologies: its corporate website guiarepsol.com, digital newsletters, social networks, advertising campaigns, meetings with the media or press releases, among others.
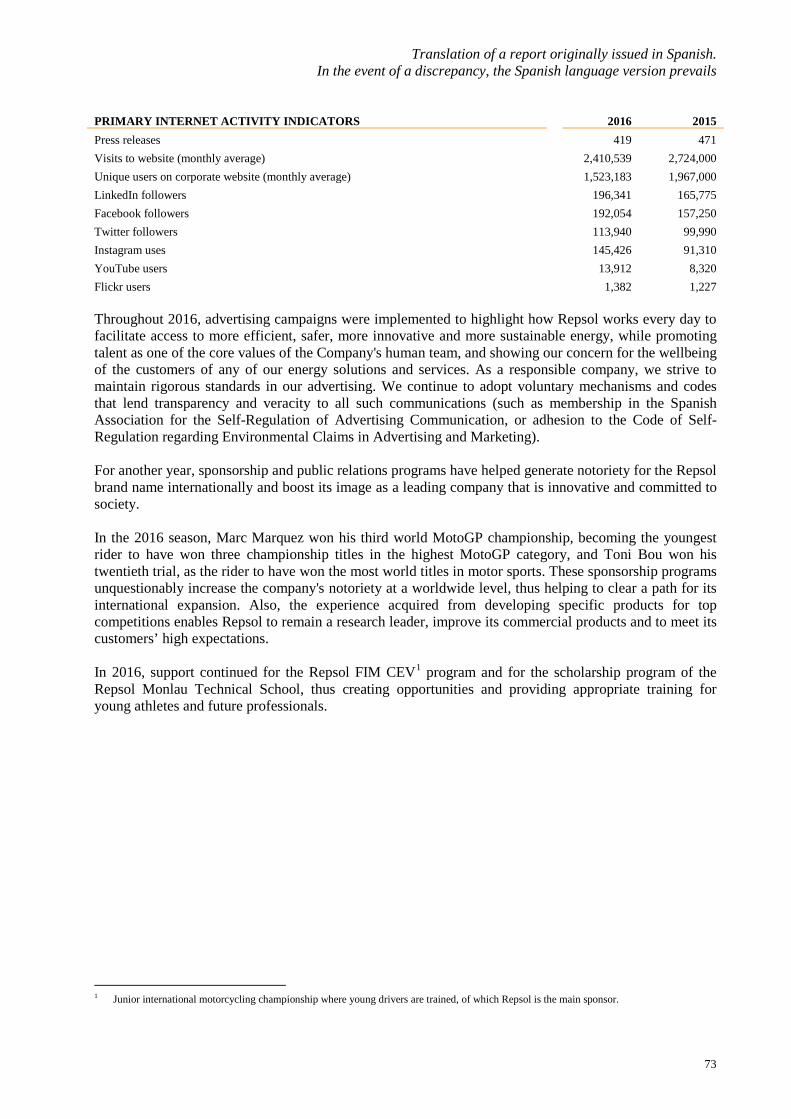
Translation of a report originally issued in Spanish. In the event of a discrepancy, the Spanish language version prevails
73
PRIMARY INTERNET ACTIVITY INDICATORS 2016 2015 Press releases 419 471 Visits to website (monthly average) 2,410,539 2,724,000 Unique users on corporate website (monthly average) 1,523,183 1,967,000 LinkedIn followers 196,341 165,775 Facebook followers 192,054 157,250 Twitter followers 113,940 99,990 Instagram uses 145,426 91,310 YouTube users 13,912 8,320 Flickr users 1,382 1,227 Throughout 2016, advertising campaigns were implemented to highlight how Repsol works every day to facilitate access to more efficient, safer, more innovative and more sustainable energy, while promoting talent as one of the core values of the Company's human team, and showing our concern for the wellbeing of the customers of any of our energy solutions and services. As a responsible company, we strive to maintain rigorous standards in our advertising. We continue to adopt voluntary mechanisms and codes that lend transparency and veracity to all such communications (such as membership in the Spanish Association for the Self-Regulation of Advertising Communication, or adhesion to the Code of Self-Regulation regarding Environmental Claims in Advertising and Marketing). For another year, sponsorship and public relations programs have helped generate notoriety for the Repsol brand name internationally and boost its image as a leading company that is innovative and committed to society. In the 2016 season, Marc Marquez won his third world MotoGP championship, becoming the youngest rider to have won three championship titles in the highest MotoGP category, and Toni Bou won his twentieth trial, as the rider to have won the most world titles in motor sports. These sponsorship programs unquestionably increase the company's notoriety at a worldwide level, thus helping to clear a path for its international expansion. Also, the experience acquired from developing specific products for top competitions enables Repsol to remain a research leader, improve its commercial products and to meet its customers’ high expectations. In 2016, support continued for the Repsol FIM CEV1 program and for the scholarship program of the Repsol Monlau Technical School, thus creating opportunities and providing appropriate training for young athletes and future professionals.
1 Junior international motorcycling championship where young drivers are trained, of which Repsol is the main sponsor.

Translation of a report originally issued in Spanish. In the event of a discrepancy, the Spanish language version prevails
74
7. OUTLOOK 7.1 GENERAL OUTLOOK MACROECONOMIC OUTLOOK World economic growth continues to be moderate. But following a start to 2016 with high instability, activity rebounded throughout the year. The latest forecasts of the International Monetary Fund (IMF WEO Update, January 2017), estimate 2016 global growth at 3.1%, which is slightly lower than the 3.2% of 2015, but they expect an increase to 3.4% in 2017.
The growth outlook has improved for emerging economies which, after five years of slowdown, grew by 4.1% in 2016, the same rate as in 2015, and they should attain 4.5% growth in 2017. This rebound has been assisted by several factors: (i) the stabilization of the Chinese economy and perspectives for an exit from the crisis in Brazil and Russia; (ii) a certain recovery in commodity prices and (iii) the return of capital inflows, which was initially supported by a context of very low interest rates in the advanced economies, a situation that has recently begun to reverse.
Meanwhile, the advanced economies are expected to maintain a modest pace of recovery, with growth forecast at 1.9% in 2017, three tenths higher than projected in 2016. The US should accelerate its growth to 2.3%, assisted by the fact that the contribution of inventory accumulation will cease to be negative (in 2016, it eroded growth). In addition, a larger fiscal stimulus is expected in the country, although it would mainly take place from 2018. The Eurozone meanwhile, should steady its growth at about its potential (1.6%), but this forecast is subject to considerable uncertainty due to the effects of the following: (i) the British exit from the EU, of which insufficient details are known in order to be able to assess its impact; (ii) doubts that continue to arise about the health of a part of the European banking system; (iii) the upcoming electoral calendar, where the common denominator is the risk of results that call into question European institutions.
The Spanish economy continues to grow at robust rates (3.2% in the third quarter of 2016). The European Commission and the IMF forecast a moderate slowdown of economic growth in Spain for 2017, to about 2.3%, to the extent that some of the tailwinds – such as low crude oil prices – should begin to weaken. However, rising exports and the recent robustness shown by the economy mean that the favorable momentum may continue, with possible upside surprises.
Macroeconomic forecasts, key figures
GDP (%)
Average inflation (%)
2016
2017
2016
2017
World economy
3.1
3.4
3.31
3.4 Advanced countries
1.6
1.9
0.7
1.7
Spain
3.2
2.3
-0.3
1.0
Emerging countries
4.1
4.5
4.5
4.5 Source: IMF (World Economic Outlook Update January 2017) and Repsol Economic Research Department.
Overall, downside risks to world growth have decreased recently. Nevertheless, elevated uncertainty persists and new risks are seen in the medium term. For example, Donald Trump's victory in the US brings to the fore a trend towards questioning the benefits of globalization and trade liberalization policies. An increase in protectionism would harm world trade, and exert downward pressures on activity, especially in emerging countries that are more dependent on external demand.
1 Data from IMF (World Economic Outlook October 2016)

Translation of a report originally issued in Spanish. In the event of a discrepancy, the Spanish language version prevails
75
ENERGY SECTOR OUTLOOK Short term energy sector outlook In the short term, according to the International Energy Agency (IEA), the balance between supply and demand for oil will be determined mainly by an agreed reduction in OPEC production and some non-OPEC countries. The International Energy Agency (IEA) is expecting a mild recovery in production for 2017 of about 220 thousand barrels a day, nearly all of which would be supplied by Brazil, Canada and the countries of the former Soviet Union. On the OPEC side, the market is keenly watching for fulfillment of the commitments to a production cutback, which would have a direct effect on crude oil prices.
The increase in demand would again be driven by non-OECD countries, with expected growth for 2017 off 1.34 million barrels a day; while in OECD countries, the change will be virtually zero. This scenario means an increase by 0.9 million barrels a day in needs for OPEC oil and inventory changes for 2017 of up to 33.6 million barrels a day. Hence, the agreement reached by the petroleum-exporting countries in November 2016 to reduce output assumes a deficit market in 2017, which would help reduce high inventory levels accumulated in the two previous years.
Short-term outlook of the global balance between supply and demand
Source: AIE and Repsol Economic Research Department.
With regard to the movement of crude oil prices in the short term, the analyst consensus points to an average Brent crude price for 2017 and 2018 that rebounds by about $10/bbl every year, up to $57 and 65/bbl, respectively.
With regard to the movement of gas prices in the short term, the adjustment of the balance begun in 2016 is expected to continue into 2017. Thus, two key questions will be how production performs and the pace at which non- temperature related demand begins to consolidate exports (liquefied natural gas (LNG) and Mexico) and industry new petro-chemical plants, fertilizer plants and methanol plants, mainly).
Accordingly, the following trends are expected to continue: (i) reduction in production growth due to the cutback in investment in upstream companies; (ii) new structural demand not related to temperature (industrial projects and exports).
In demand, exports of United States LNG from Cheniere Energy's Sabine Pass plant in Louisiana began in February 2016. At present, three other liquefaction projects are now under construction: Cameron, Freeport and Cove Point. Another three projects (Corpus Christi, Elba Island and Lake Charles) are now
OECD46.58
non-OECD51.04
non-OPEC56.98
OPEC needs & var.
inv.33.63
Demand Supply
2017 = 97.62 millon bbl/d
OPEC LGN 7.00

Translation of a report originally issued in Spanish. In the event of a discrepancy, the Spanish language version prevails
76
under 20-year contracts even though a final investment decision has not yet been made. Moreover, infrastructures continue to be built to boost the export of gas via pipeline to Mexico. Also, more than 400 intensive industrial projects in gas consumption are planned between now and the year 2020 (fertilizers, methanol and petrochemicals).
The following factors may have the greatest short-term effect on the balance between supply and demand: (i) higher-than-expected growth in the production of dry gas (due to a significant increase in productivity gains and/or greater volume of oil-related gas in a scenario of higher crude prices); (ii) lower-than-expected LNG exports, which may occur in a scenario of low crude prices); (iii) lower industrial demand, which would influence economic growth (industrial production); the dollar exchange rate (a stronger dollar makes US exports less competitive); and movements in the prices of liquids from natural gas (mainly ethane and liquefied natural gas) which are the raw materials for industrial projects planned in petrochemicals, fertilizers and methanol plants.
Long-term energy sector outlook On a global scale, hydrocarbons contribute more than half of the primary energy consumed. Specifically, 31% of global primary energy consumption is derived from oil, which is the most commonly used energy source.
No major changes are expected in the coming years. According to the 2015 World Energy Outlook report, published by the International Energy Agency (IEA), in its base scenario, crude oil's share of the 2040 energy matrix will decline by 5 percentage points compared to 2014, while natural gas will reach a 24% share of global energy demand, which is estimated at 17,934 million oil equivalent tons.
Long-term outlook of world primary energy matrix
Source: AIE and Repsol Economic Research Departrment.
7.2 OUTLOOK FOR BUSINESS In October 2015, Repsol presented its Strategic Plan for the 2016-2020 period, in which the company undertook to capitalize on the growth achieved through its fulfillment of the objects set out in the previous Strategic Plan.
In order to meet the challenges of creating value and boosting resiliency set forth in SP 2016-2020, in 2017 the Company will focus, among other aspects, on the design and deployment of the Transformation Program rolled out in 2016, as well as the implementation of key efficiencies and synergies in all business areas and countries.
Oil31%
Natural Gas21%
Coal29%
Biomass10%
Other renewables1%
Nuclear5%
Hydroelectric3%
Global2014 = 13,684 Mtep
Oil27%
Natural Gas24%
Coal23%
Biomass10%
Other renewable6%
Nuclear7%
Hydroelectric3%
Global2040 = 17,865 Mtep

Translation of a report originally issued in Spanish. In the event of a discrepancy, the Spanish language version prevails
77
The Efficiency Program announced with the Strategic Plan and applicable to the entire Company, has incorporated capex and opex savings which, along with the Talisman integration synergies, contributed more than 1,600 million euros in 2016. This enables Repsol to take on significant challenges as it looks forward to the year 2017 period. The plan is expected to grow in 2017, and generate 2,100 million euros in savings, thus beating expectations and anticipating the objective for 2018.
In addition, a substantial portion of the planned divestments of the first two years of the Strategic Plan materialized in 2016, thus surpassing the established target of 3,100 million euros. Consequently, and following the streamlining of our portfolio, the year 2017 should be a year of business consolidation and of focus on the efficiency of current assets.
In 2017, exploration and production will remain focused on our three core regions: North America, Latin America and Southeast Asia, regions with high organic development potential, with production volumes in 2017 that will remain at levels similar to those attained in 2016, even after the aforementioned divestments.
Planned investments in this region for the 2016-2017 period will amount to approximately 5,500 million dollars, a figure that represents a reduction of more than 30% in year-on-year and like-for-like terms, compared to 2015. This is due, inter alia, to the optimization process and Efficiency Program. Investment in 2017 will focus on high value-added projects and will mainly concentrate on development and construction of facilities in Trinidad, United States, Brazil, Venezuela, Canada, the UK, Peru, Bolivia, Indonesia, Malaysia and Vietnam, and the drilling of exploration wells.
This will continue to enable this business area to lower the price above which crude oil generates a positive cash flow and to increase the return on average capital employed (ROACE).
The greater degree of efficiency in exploration and production will be supplemented by the strengths shown downstream, which has reaffirmed the benefits Repsol has gained as an integrated company.
Investments made in the Cartagena and Petronor refineries, and the corresponding improvement in the margin of the refining system, have been key to placing Repsol at the head of the integrated European companies in terms of efficiency, which guarantees value creation and resilience against scenarios of low oil prices. The targets set for 2017 are:
- In Refining and Chemical facilities, increased plant reliability and orientation, via the Efficiency Program, toward the reduction of energy costs and CO2 emissions, which will lead to continuous improvement of margins;
- Maximize business value of marketing and consolidate competitive position in the new legal framework, while streamlining operations.
- Efficiency improvement policy, with strict cost containment, while adapting to the particular situation of growth businesses.
In the expected price environment, and owing to the integration of our businesses, among other factors, Repsol expects to be able to generate sufficient cash to fund its investment needs, remunerate its shareholders and reduce its debt.
Translation of a report originally issued in Spanish. In the event of a discrepancy, the Spanish language version prevails
78
8. RISKS
8.1. RISK FACTORS Repsol's operations and earnings are subject to risks as a result of changes in competitive, economic, political, legal, regulatory, social, industrial, business and financial conditions, such as those listed below. STRATEGIC AND OPERATIONAL RISKS Uncertainty in the current economic landscape
Although global economic growth has stabilized and perspectives are better, uncertainty and risk remain elevated. In this regard, geopolitical risk has assumed special significance. The result of the US elections and the vote in favor of the UK's exit from the European Union have brought to the fore a greater polarization in society, and the fact that the status quo of the last 30 years – that is, liberalization of trade and low levels of intervention – are being called into question. In Europe, important elections are being held in the coming months, in which support for European institutions will be put to the test. The impact of these events on world growth and, accordingly, the performance of markets is as yet uncertain, but not necessarily adverse, although it may shift the distribution of world growth. If the one- trillion euro fiscal stimulus envisaged in Donald Trump's program takes shape, it would trigger greater growth in the US, but if it is accompanied by protectionist measures, it would weaken the growth of emerging countries. Further, from a financial perspective, another risk for the world economy is the potential wider divergence in economic policy between the leading central banks. Although the European Central Bank and the Bank of Japan will pursue an expansive monetary policy, if Donald Trump's policies cause an uptick in inflation, the Federal Reserve may have to hike interest rates more quickly than expected, which would strengthen the dollar. A stronger dollar would tighten financial conditions in the emerging countries and endanger the solvency of governments and enterprises with dollar-denominated debt. Nor can a risk event in China be discounted, as activity has been driven by sharp growth in depth, which is now equal to 250% of GDP and is highly concentrated in the corporate sector. Following the recent OPEC meeting of November 30, 2016, which decided to set aside two years of a policy of defending market share, and to cut back production in order to backstop prices, the future of the market appears to be more promising. However, there are factors that may add uncertainty to the market; but given the scale of OPEC's output cut of 1.2 million bl/d, and the more than likely adhesion of non-OPEC countries with an additional cut of 0.6 million, the adverse impact will tend to be low. These factors include: i) lower-than-expected demand from emerging countries; ii) a quicker-than expected response to non-convention US shale to the expected price rise; iii) an increase in the output of Libya and Nigeria, OPEC countries that were left out of the cutbacks decided in the November 30 meeting, and iv) a very low level of fulfillment by OPEC countries of their individual commitments to production cutbacks. Climate change
Repsol is exposed to possible changes in the regulatory framework for greenhouse gas emissions arising from either our industrial operations or the use of our products. Also, following the Paris Agreement, country’s commitments under their respective National Determined Contributions (NDC) will have a significant impact on climate policies. The agreement is undoubtedly another step toward a low-emissions economy in which a more sustainable model of company will be crucial.
Translation of a report originally issued in Spanish. In the event of a discrepancy, the Spanish language version prevails
79
Repsol's assets are subject to risks arising from physical changes caused by climate change, and risks deriving from the rising level of the sea, changes in precipitation patterns, changes in extreme temperatures or droughts, or even more frequent occurrence of extreme meteorological phenomena (cyclones, hurricanes, etc.). Repsol is present in areas that are liable to suffering these effects. Further, a change in consumers’ behavior as they seek out less carbon-intensive products could also affect Repsol's competitiveness if it fails to adapt to these changes. Repsol, and the oil and gas industry, are exposed to adverse trends of opinion that may affect the share price. Initiatives that promote disinvestment in fossil fuel extraction companies to reduce the impact of their products on climate change may affect the shareholding base of the company. Repsol cannot predict the exact impact that the described risks may have on its activities, the income from its operations or the financial position of the Repsol Group, or its competitiveness. Fluctuations in international prices of crude and reference products and in demand owing to factors beyond Repsol's control World oil prices have fluctuated widely in recent years, and are driven by international supply and demand factors over which Repsol has no control. The international prices of products are influenced by the price of crude oil and by demand for such products. Also, international prices of crude oil and of products impact the refining margin. International oil prices and demand for crude oil may also fluctuate significantly during economic cycles. Reductions in oil prices adversely affect Repsol’s profitability, the value of its assets and its plans for investment, which may be altered as a result of delays. Similarly, a significant drop in capital investment could negatively affect Repsol’s ability to replace its crude oil reserves. Regulatory and tax framework of Repsol's operations The oil industry is subject to extensive regulation and intervention by governments in Upstream activities such as the award of exploration and production permits, the imposition of specific drilling and exploration obligations, restrictions on production, price controls, divestments of assets, foreign currency controls, and the nationalization, expropriation or cancellation of contractual rights. Likewise, in Downstream, oil refining and petrochemical activities, in general, are subject to extensive government regulation and intervention in matters such as safety and environmental controls. Also, the energy sector, particularly the oil industry, is subject to a unique tax framework. In Upstream activities there are often energy taxes on profit and production, while in Downstream activities, taxes on consumption products are common. Repsol cannot foresee the exact scope of changes to such laws or their interpretation, or the implementation of certain policies, which could adversely affect its business, results and financial position. Repsol is subject to extensive environmental and safety legislation and risks Repsol is subject to a wide variety of environmental and safety legislation and regulations in every country where it operates. These regulations govern, among other matters, Repsol’s operations, environmental quality standards for products, air emissions and climate change, energy efficiency, extractive technologies, water discharges, remediation of soil and groundwater and the generation, storage, transport, treatment and final disposal of waste materials and safety thereof.

Translation of a report originally issued in Spanish. In the event of a discrepancy, the Spanish language version prevails
80
Lastly, following the acquisition of ROGCI, the company increased its activity in non-convention hydrocarbons. From an environmental standpoint, concern over the environmental impact of exploring for and producing this type of resources could prompt governments and authorities to approve new regulations or impose new requirements on their development. If they do, it could have an adverse impact on the Company.
Repsol cannot predict the exact scope of the changes in environmental and safety regulations, or how they will be interpreted or if certain policies will be implemented. Any regulatory change could cause an adverse impact on the Repsol Group's operations, the income from its operations and financial position.
Operating risks of Repsol's activities Hydrocarbon exploration and production (Upstream): reliance on the cost-effective acquisition or discovery of, and, thereafter, development of, new oil and gas reserves. Oil and gas exploration and production activities are subject to particular risks, many of which are beyond the control of Repsol. These activities are exposed to production, equipment and transportation risks, errors or inefficiencies in operations' management and purchasing processes, natural hazards and other uncertainties relating to the physical characteristics of oil and natural gas fields and their dismantling. Furthermore, exploration projects are complex in terms of their scale and are susceptible to delays in execution and cost overruns with respect to initially-approved budgets. In addition, some of the development projects are located in deep waters, mature areas and other difficult environments, such as the Gulf of Mexico, Alaska, the North Sea, Brazil and the Amazon rainforest, or in complex oilfields that could aggravate these risks further. It should also be noted that any form of transport of oil products always has inherent risks: by road, rail or sea transport, or by pipeline, oil or another hazardous substances could leak; this poses a significant risk due to the potential impact a spill could have on the environment and on people, especially considering the high volume of products that can be carried at any one time. Should these risks materialize, Repsol may suffer major losses, interruptions to its operations and harm to its reputation. Moreover, Repsol must replace depleted oil and gas reserves with new proven reserves in a cost-effective manner for subsequent production to be economically viable. Repsol's ability to acquire or discover new reserves is, however, subject to a number of risks. For example, drilling may involve negative results, not only with respect to dry wells, but also with respect to wells that are productive but do not produce sufficient net revenues to return a profit after drilling, operating and other costs are taken into account. In addition, Repsol generally faces intense competition in bidding for exploratory blocks, in particular those blocks offering the most attractive potential reserves. Such competition may result in Repsol failing to obtain desirable production blocks, or otherwise acquiring them at a higher price, which could render subsequent production economically unviable. If Repsol fails to acquire or discover, and, thereafter, develop new oil and gas reserves in a cost-effective manner, or if any of the aforementioned risks materializes, its business, results of operations and financial situation could be significantly and adversely affected. Industrial businesses and marketing of oil products (Downstream) Refining, Chemical, Trading, production, and distribution activities related to oil derivative products and LPG are exposed to the risk inherent to their activities, and are related to the products’ specific characteristics (flammability and toxicity), their use (including that of clients), emissions resulting from the production process (such as greenhouse gas effects), as well as the materials and waste used (dangerous waste, as well as water and energy management), which might impact health, safety, and the environment. Repsol’s industrial assets (refineries, regasification plants, warehouses, ports, ducts, sea vessels, cistern trucks, service stations, etc.) are exposed to accidents such as fire, explosions, leaks of toxic products, as well as large-scale contaminating environmental incidents. Such accidents may cause

Translation of a report originally issued in Spanish. In the event of a discrepancy, the Spanish language version prevails
81
death and injury to employees, contractors, residents in surrounding areas, as well as damage to the assets and property owned by Repsol as well as third parties. Downstream activities take place in a highly competitive environment. Refining and commercialization margins may be affected by a number of factors, such as low demand arising from a deterioration of the economic situation in the countries where it operates, the high price of crude oil and other raw materials, trends in production-related energy costs and other commodities, excess refining capacity in Europe, and the growing competition from refineries in areas such as Russia, the Middle East, East Asia, and the US, where production costs are lower. Commercial businesses compete with international hydrocarbons industry operators as well as with other non-oil operators (supermarket chains as well as other commercial operators) to acquire or open service stations. Repsol service stations mainly compete based on price, service, and the availability of non-oil products. If any of the above risks materialize, the Repsol's business, results of operations and financial position could be significantly and adversely affected. Location of reserves Part of Repsol's oil and gas reserves are located in countries that are or could be economically or politically unstable. Reserves in these areas as well as related production operations may be exposed to risks, including increases in taxes and royalties, the establishment of limits on production and export volumes, the compulsory renegotiation or cancellation of contracts, the nationalization or denationalization of assets, changes in local government regimes and policies, changes in business customs and practices, payment delays, currency exchange restrictions and losses and impairment of operations due to the attacks of armed groups. In addition, political changes may lead to changes in the business environment. Economic downturns, political instability or civil disturbances may disrupt the supply chain or limit sales in the markets affected by such events and affect the safety of employees and contractors. If any of the above risks materializes, the Group's business, results of operations and financial situation could be significantly and adversely affected. Estimations of oil and gas reserves To estimate proved and unproved reserves and oil and gas resources, Repsol uses the criteria established by the SPE/WPC/AAPG/SPEE Petroleum Resources Management System, commonly referred to by its acronym SPE-PRMS (SPE standing for Society of Petroleum Engineers). The accuracy of these estimates depends on a number of different factors, including: development activities and operations, including drilling, production testing and studies. After the date of the estimate, the results of activities may entail substantial upward or downward corrections based on the quality of available geological, technical and economic data used – including changes in hydrocarbon prices – and their interpretation and evaluation. Moreover, the production performance of reservoirs and recovery rates depend significantly on available technologies as well as Repsol’s ability to implement them. Therefore, measurements of reserves are not precise and are subject to revision. The estimate of proven and unproven reserves of oil and gas will also be subject to correction due to errors in the application of published standards and changes in such standards. Any downward revision in estimated quantities of proven reserves could adversely impact company results, and would lead to increased depreciation, depletion and amortization charges and/or impairment charges, thus reducing earnings or shareholders’ equity.

Translation of a report originally issued in Spanish. In the event of a discrepancy, the Spanish language version prevails
82
Projects and operations in joint ventures and partnerships Many of the Repsol Group's projects and operations are conducted through joint ventures and partnerships. Where Repsol does not act as the operator, its ability to control and influence the performance and management of the operations, and to identify and manage risks is limited. Additionally, any of Repsol's partners or another member in a joint venture or associated company may fail to comply with its financial obligations, or they may commit another breach that could affect a project's viability. Acquisitions, investments and disposals As part of Repsol’s strategy, the company may engage in acquisitions, investments and disposals of ownership interests. There can be no assurance that Repsol will identify suitable acquisition opportunities, obtain the financing necessary to complete and support such acquisitions or investments, acquire businesses on satisfactory terms, or that any acquired business will prove to be profitable. In addition, acquisitions and investments involve a number of risks, including possible adverse effects on Repsol’s operating income, risks associated with unanticipated events or liabilities relating to the acquired assets or businesses which may not have been disclosed during due diligence investigations, difficulties in the assimilation of the acquired operations, technologies, systems, services and products, and risks arising from provisions in contracts that are triggered by a change of control of an acquired company. Any failure to successfully integrate such acquisitions could have a material adverse effect upon Repsol's business, results of operations or financial position. Any disposal of an ownership interest may also adversely affect Repsol’s financial position, if such disposal results in a loss. On May 8, 2015, Repsol completed the acquisition of Talisman, a Canadian group devoted to oil and gas exploration and production activities. As in any business combination, Repsol's ability to reap the strategic benefits expected from the acquisition will depend on its ability to integrate equipment, processes and procedures and maintain existing relationships with its customers and partners. If any of these risks were to materialize following the takeover of ROGCI, they could have an adverse impact on the Repsol Group's operations, financial performance or financial position. Repsol’s current insurance coverage may not be sufficient for all operational risks Repsol holds insurance coverage against certain risks inherent to the oil and gas industry, in line with industry practice. Insurance coverage is subject to deductibles and limits that, in certain cases, may be significantly lower than its losses and/or liabilities. In addition, Repsol’s insurance policies contain exclusions that could leave the Group with limited coverage in certain circumstances, or indemnities may not be totally or partially collectible in case of insolvency of the insurers. Furthermore, Repsol may not be able to maintain adequate insurance at rates or on terms considered reasonable or acceptable, or be able to obtain insurance against certain risks that could materialize in the future. If the company experiences an incident against which it is not insured, or the costs of which materially exceed its coverage, it could have a material adverse effect on its business, financial position and results of operations. Repsol’s natural gas operations are subject to particular operational and market risks Natural gas prices tend to vary between the different regions in which Repsol operates as a result of significantly different supply, demand and regulatory conditions, and such prices may be lower than current prices in other regions of the world. In addition, excess supply conditions that exist in some regions cannot be utilized in other regions due to a lack of infrastructure and difficulties in transporting natural gas.

Translation of a report originally issued in Spanish. In the event of a discrepancy, the Spanish language version prevails
83
In addition, Repsol has entered into long-term contracts to purchase and supply natural gas in various parts of the world. These contracts have different price formulas, which could result in higher purchase prices than the price at which such gas could be sold in increasingly liberalized markets. Furthermore, gas availability could be subject to the risk of counterparty breach of contractual obligations. Thus, it might be necessary to look for other sources of natural gas in the event of non-delivery from any of these sources, which could require payment of higher prices than those envisaged under the breached contracts. Repsol also has long-term contracts to sell and deliver gas to customers, which present a different type of risk to the Group as they are pegged to existing proven reserves in these countries. Should such reserves in these countries prove insufficient, Repsol might not be able to satisfy its obligations under these contracts, some of which include penalty clauses for breach of contract. The above risks may adversely affect Repsol's business, results and financial position. Cyclical nature of petrochemical activity The petrochemicals industry is subject to wide fluctuations in supply and demand, reflecting the cyclical nature of the chemicals market on a regional and global scale. These fluctuations affect the prices and profitability of petrochemicals companies, including Repsol. Repsol’s petrochemicals business is also subject to extensive governmental regulation and intervention in such matters as safety and environmental controls. Any fluctuations and changes in regulations may have an adverse effect on the Repsol's business, financial position and results of operations. Repsol Group's strategy requires efficiency and innovation in a highly competitive market The oil, gas and petrochemical industry operates in the context of a highly competitive energy sector. This competition influences the conditions for accessing markets or following new business leads, the costs of licenses and the pricing and marketing of products. The implementation of the Group's strategy requires a significant ability to anticipate and adapt to the market and continuous investment in technological advances and innovation. The Repsol Group is subject to the effects of administrative, judicial and arbitration proceedings The Repsol Group is subject to the effects of administrative, judicial and arbitration proceedings arising in the ordinary course of business, in relation to which it is unable to predict the scope, subject-matter or outcome. Any present or future litigation involves a high degree of uncertainty and, therefore, the resolution of these disputes could affect the business, results or financial position of the Repsol Group. Information technology and its reliability and robustness are a key factor in maintaining our operations The reliability and security of the Group’s information technology (IT) systems are critical to maintaining the availability of its business processes and the confidentiality and integrity of the data owned by the company and by third parties. Given that cyber-attacks are constantly increasing, the Repsol Group cannot guarantee that it will not suffer economic or/and material losses in the future as a result of such attacks. Misconduct or violations of applicable legislation by our employees can damage the reputation of the Repsol Group
Repsol’s new Ethics and Conduct Code, which is mandatory for all Repsol directors, executives and employees, regardless of the type of contracting governing their professional or employment relationship, establishes the overall framework for understanding and putting into practice the conduct and
Translation of a report originally issued in Spanish. In the event of a discrepancy, the Spanish language version prevails
84
expectations the company places in each employee in their daily work, in line with the principles of loyalty to the company, good faith, integrity and respect for the law and the ethical values defined by the Group. The company's diverse compliance and control models include controls designed to detect and mitigate significant incidents of non-compliance. Management misconduct or breach of any applicable legislation could cause harm to the company's reputation, in addition to incurring sanctions and legal liability. Repsol is exposed to negative opinion trends which could have an adverse impact on its image and reputation, thereby affecting its business opportunities
The company carries on its operations in multiple environments with diverse stakeholders, which are mainly local communities in the areas influence of its operations, as well as local and national civil, political, labor, and consumer organizations, among others. Should the interests of the above groups be contrary to the Company’s activities, and attempts to reach agreements prove unsuccessful, Repsol may be affected by the publication of biased or manipulated information that generates opinion contrary to the company’s activities. This could result in an adverse impact on the social or media acceptance of Repsol's activities, leading to erosion of the Company's image as well as loss business opportunities in the area or country in question, with potential adverse effects on its business, financial position, and the result of its operations.
FINANCIAL RISKS
Repsol has a risk management structure and systems that enable it to identify, measure and control the financial risks to which the Group is exposed. Note 16 “Financial risk management” in the Group’s audited consolidated financial statements analyzes the exposure to those risks and measures and the impact they may have on those financial statements. The main financial risks are described below: Liquidity risk Liquidity risk is associated to the ability of the Group to finance its obligations at reasonable market prices, as well as to carry out its business plans with stable financing sources. In the case that Repsol were unable to meet its needs for liquidity in the future or had to incur increased costs to meet them, this could have an adverse effect on its business, financial position and results of operations. Credit risk
Credit risk is defined as the possibility of a third party not complying with his contractual obligations, thus creating losses for the Group.
The Group’s credit risk exposure mainly relates to trade accounts payable, which are measured and controlled by individual client or third party. To this end, the Group has its own systems, in line with best practices, for constantly monitoring the creditworthiness of all its debtors and for determining the risk limits of third parties.
As a general rule, the Group considers a bank guarantee issued by financial entities to be the most suitable instrument of protection from credit risk. In some cases, the Group has taken out credit insurance policies to partially transfer to third parties the credit risk related to the trade of some of its businesses.

Translation of a report originally issued in Spanish. In the event of a discrepancy, the Spanish language version prevails
85
The Group also has exposure to counterparty risk arising from non-trade contractual operations that may lead to defaults. In these cases, the Group also analyzes the solvency of counterparties with which it maintains or could maintain non-trade contractual relations. Any breach of payment obligations by Repsol’s customers and counterparties, in the agreed time frame and form, could have an adverse effect on Repsol’s business, results or financial position.
Credit rating risk Credit rating agencies regularly rate the Group, and their ratings are based on external factors, such as the conditions that affect the oil & gas sector, the general state of the economy and the performance of the financial markets.
Credit ratings affect the cost and other conditions under which the Repsol Group is able to obtain finance. Any downgrade in Repsol S.A.’s credit rating could restrict or limit the access of the Group to financial markets, increase the cost of any new finance, and have a negative effect on its liquidity.
See credit rating table in section 4 “Credit rating” in this document.
Market risks The Group is exposed to various types of market risk: exchange rate, commodity price, interest rate and credit rating, which are described below:
Exchange rate fluctuation risk: Fluctuations in exchange rates may adversely affect Repsol's operational result and the value of its equity. In general, this exposure to exchange rate risk stems from the existence in the Group companies of assets, liabilities and cash flows denominated in a currency other than the company's functional currency, with particular emphasis on the fact that: (i) Cash flows generated by oil, natural gas and refined product sales are generally denominated in United States dollars, (ii) A large portion of Repsol’s assets and investments are also denominated in United States dollars. In addition, it should be taken into consideration that: (i) Cash flows from transactions carried out in the countries in which Repsol conducts its activities are exposed to fluctuations in currency exchange rates of the respective local currencies against the major currencies in which the commodities used as reference for the fixing of prices in the local currency are traded, (ii) Repsol’s consolidated financial statements are expressed in euros and, consequently, the assets and liabilities of subsidiary investee companies with a different functional currency are translated into euros.
To mitigate exchange rate risks, and it deems appropriate, Repsol carries out investments or transactions in those currencies in which foreign exchange risk exposures have been identified and it can hedge the risk with derivative financial instruments in currencies where there is a liquid market and reasonable transaction costs.
Notes 16 “Financial risk management” and 17 “Derivative and other transactions” in the consolidated financial statements for 2016 include additional details on the financial risks described in this section and the hedging transactions performed. Commodity price risk: In the normal course of operations and trading activities, the earnings of the Repsol Group are exposed to volatility in the price of oil, natural gas, and related derivative products (see the risk factors titled “Fluctuations in crude oil and reference products' international prices and demand owing to factors beyond Repsol’s control” and “Repsol’s natural gas operations are subject to particular operational and market risks” above). Note 17 “Derivative and other transactions” in the consolidated financial statements for 2016 include additional details on the financial risks described in this section.

Translation of a report originally issued in Spanish. In the event of a discrepancy, the Spanish language version prevails
86
Interest rate risk: The market value of the Group’s net financing and net interest expenses could be affected as a consequence of changes in interest rates which could affect interest income and expenses of financial assets and liabilities tied to floating interest rates and the fair value of financial assets and liabilities tied to a fixed rate. Fluctuations in interest rates may also affect the value of assets and liabilities due to a change in the applicable cash flow discount rate, investments' profitability and the future cost of raising funds. To mitigate interest rate risks, and when it deems appropriate, Repsol can hedge the risk with derivative financial instruments where there is a liquid market and with reasonable transaction costs. Notes 16 “Financial risks” and 17 “Derivative and other transactions” in the consolidated financial statements for 2016 include additional details on the financial risks described in this section and the hedging transactions performed.
8.2. RISK MANAGEMENT The Repsol Group operates in many different countries, under multiple conditions and regulatory frameworks and in all parts of the energy value chain. Accordingly, it is exposed to different types of risk (strategic, operational and financial) that may affect the future performance of the organization, and these must be mitigated as effectively as possible.
For this reason, the Company has the organization, procedures and systems that allow it to reasonably manage the risks to which the group is exposed, as an integral part of the Group's decision-making processes in both corporate governance bodies and business management.
For years, Repsol has been working on an integrated risk management model to be able to anticipate, manage, and control risks from a global perspective. The Integrated Risk Management System (SGIR in Spanish) provides a comprehensive and reliable view of all risks that might affect the company, regardless of their nature.
Repsol's commitment to implement the SGIR is reflected in its Risk Management Policy and its principles are specified in the Integrated Risk Management Standard approved by the Company's Board of Directors. This management model is based on the ISO 31000 international standard and the Three Lines of Defense Model.
The main pillars of the SGIR are:
- Senior Management leads integrated risk management. - It is integrated with all the company's management processes and activities of the Company,
always with the overall approach provided by the Risk Division. - Businesses and corporate areas play a role in the implementation of the model as units with
different levels of responsibility and specialization (risk management units, supervisory units and audit units) as well as the Risk Division, which governs and coordinates system.
- Assurance that all risks are managed in accordance with a common process of identification, assessment and treatment.
- Promotion of continuous improvement to gain efficiency and responsiveness. Repsol's Senior Management sees the SGIR not only as a tool to define corporate strategy, but also to improve operations and approach critical situations with flexibility so as to strengthen the company.
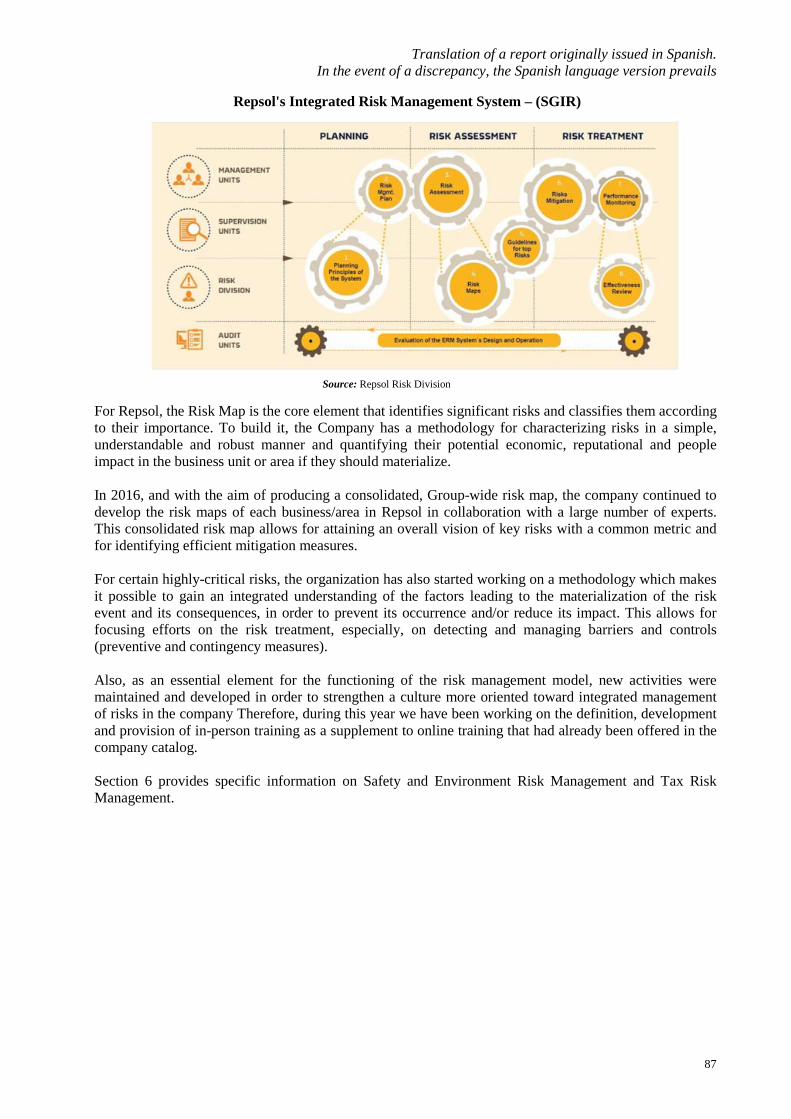
Translation of a report originally issued in Spanish. In the event of a discrepancy, the Spanish language version prevails
87
Repsol's Integrated Risk Management System – (SGIR)
Source: Repsol Risk Division
For Repsol, the Risk Map is the core element that identifies significant risks and classifies them according to their importance. To build it, the Company has a methodology for characterizing risks in a simple, understandable and robust manner and quantifying their potential economic, reputational and people impact in the business unit or area if they should materialize. In 2016, and with the aim of producing a consolidated, Group-wide risk map, the company continued to develop the risk maps of each business/area in Repsol in collaboration with a large number of experts. This consolidated risk map allows for attaining an overall vision of key risks with a common metric and for identifying efficient mitigation measures. For certain highly-critical risks, the organization has also started working on a methodology which makes it possible to gain an integrated understanding of the factors leading to the materialization of the risk event and its consequences, in order to prevent its occurrence and/or reduce its impact. This allows for focusing efforts on the risk treatment, especially, on detecting and managing barriers and controls (preventive and contingency measures). Also, as an essential element for the functioning of the risk management model, new activities were maintained and developed in order to strengthen a culture more oriented toward integrated management of risks in the company Therefore, during this year we have been working on the definition, development and provision of in-person training as a supplement to online training that had already been offered in the company catalog. Section 6 provides specific information on Safety and Environment Risk Management and Tax Risk Management.
Translation of a report originally issued in Spanish. In the event of a discrepancy, the Spanish language version prevails
88
ABOUT THIS REPORT
This report should be read together with the Repsol Group consolidated financial statements at December 31, 2016. Users of it should be aware that the forward-looking information contained in this document reflects the plans, forecasts or estimates of the Group's managers. These are based on assumptions that are considered reasonable, and that cannot be considered as a guarantee of the entity's future performance, in the sense that such plans, forecasts or estimates are subject to numerous risks and uncertainties, meaning that the future development of the Group will not necessarily coincide with what was initially planned. The main risks and uncertainties are described in section 8.1 “Risk Factors.” For the preparation of this report, consideration was given to the recommendations contained in the "Guidelines for the preparation of listed company Management Reports" of the National Security Markets Commission (Comisión Nacional del Mercado de Valores – CNMV), published in 2013.
Translation of a report originally issued in Spanish. In the event of a discrepancy, the Spanish language version prevails
89
APPENDIX I: ALTERNATIVE PERFORMANCE MEASURES
Repsol's financial information contains indicators and measures prepared in accordance with applicable financial information regulations, as well as other measures prepared in accordance with the Group’s Reporting Model1 defined as Alternative Performance Measures (APMs). APMs are measures which are “adjusted” compared to those presented under IFRS-EU or with Supplementary Information on Oil and Gas Exploration and Production Activities (hereinafter, “E&P Information”)2, and therefore should be considered by the reader in addition to, but not instead of, the GAAP information. APM are highly useful for users of financial information as they are the measures employed by Repsol’s Management to evaluate its financial performance, cash flows, or its financial position when making operational or strategic decisions for the Group. For further information, see https://www.repsol.com. 1. Financial performance measures Adjusted net income Adjusted net income is the key financial performance measure which Management (the Corporate Executive Committee, E&P Corporate Executive Committee, and Downstream Executive Committee) consults when making decisions in accordance with IFRS 8 “Operating segments”. Repsol presents its segment results, including joint ventures or other companies which are jointly managed3, in accordance with the Group’s investment percentage, considering its operational and economic indicators within the same perspective and degree of detail as those for companies consolidated under the full consolidation method. Thus, the Group considers that the nature of its businesses and the way in which results are analyzed for decision-making purposes is adequately reflected. Adjusted net income is calculated as the Result from continuing operations at Current Cost of Supply (Current Cost of Supply, or CCS4), net of taxes and the result from investments minority interests. It does not include certain income and losses (“Special items”) and the Inventory effect. Financial income corresponds to the “Corporation and others’ Adjusted net income. Adjusted net income is a useful APM for investors in order to be able to evaluate the performance of operating segments while permitting increased comparability with Oil & Gas sector companies using different inventory measurement methods (see the following section).
1 See Note 2.3 of the consolidated financial statements for the year 2016. 2 The hydrocarbon exploration and production information, which is compiled and disclosed by the Group annually, is prepared in accordance
with the principles generally accepted in the oil and gas industry and, specifically, is based on the disclosure criteria outlined in Topic 932 issued by the Financial Accounting Standards Board (FASB).
3 See Note 8 “Investments accounted for using the equity method” and Appendix I “Main companies comprising the Repsol Group at December 31, 2016”, where the Group´s main joint ventures are identified.
4 The Current Cost of Supply (CCS) is commonly used in this industry to present the results of downstream businesses which must work with huge inventories subject to continual price fluctuations. It is not a commonly-accepted European accounting regulation, yet does enable the comparability with other sector companies as well as monitoring businesses independently of the impact of price variations on their inventories. Due to the above, the adjusted net income does not include the Equity Effect.

Translation of a report originally issued in Spanish. In the event of a discrepancy, the Spanish language version prevails
90
Inventory effect
This is the difference between the Result from continuing operations at Current Cost of Supply (CCS) and the result calculated as the Average Weighted Cost (AWC, which is an inventory valuation method used by the Company to determine its results in accordance with European accounting regulations). It only affects the Downstream segment, in that for the Current Cost of Supply, the cost of volume sold during the period is determined in accordance with supply costs, and production during the year. Apart from the above effect, the Inventory effect includes other adjustments to the valuation of inventories (write-offs, economic hedges) and is presented net of taxes and minority interests. Repsol management considers that this measure is useful for investors, considering the significant variations arising in the prices of inventory between periods. The AWC is a generally-accepted European accounting method which measures inventories, in that it contemplates purchase prices and historic production costs, valuing inventory at the lower between said cost and its market value. Special items
Significant items of which separate presentation is considered convenient to easily monitor the ordinary management of business operation. It includes capital gains/losses arising from divestitures, restructuring costs, impairments, and provisions for risks and expenses. Special items are presented net of taxes and minority interests. Section 4.1 "Results" includes the specific cumulative results for 2015 and 2016. We present below the Specific results for the fourth quarter of 2015 and 2016.
Fourth Quarter
Upstream Downstream Corporation TOTAL
Million euros 4Q 2016 4Q 2015 4Q 2016 4Q 2015 4Q 2016 4Q 2015 4Q 2016 4Q 2015 Divestments (13) - 150 19 (33) (5) 104 14 Workforce restructuring charges (9) (5) (12) (1) (1) (1) (22) (7) Impairment (259) (2,525) (141) (28) - (39) (400) (2,592) Provisions and other (236) (75) (3) (18) 338 125 99 32 TOTAL (517) (2,605) (6) (28) 304 80 (219) (2,553)
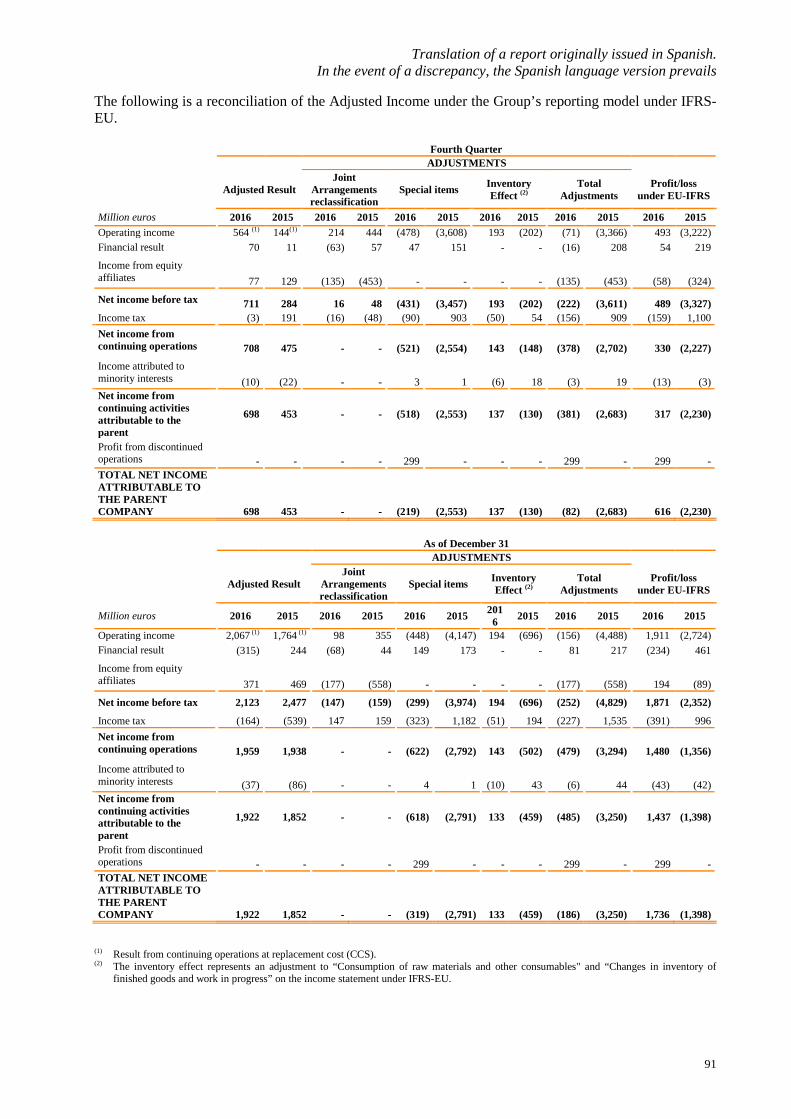
Translation of a report originally issued in Spanish. In the event of a discrepancy, the Spanish language version prevails
91
The following is a reconciliation of the Adjusted Income under the Group’s reporting model under IFRS-EU. Fourth Quarter ADJUSTMENTS
Adjusted Result
Joint Arrangements reclassification
Special items Inventory Effect (2)
Total Adjustments
Profit/loss under EU-IFRS
Million euros 2016 2015 2016 2015 2016 2015 2016 2015 2016 2015 2016 2015 Operating income 564 (1) 144(1) 214 444 (478) (3,608) 193 (202) (71) (3,366) 493 (3,222) Financial result 70 11 (63) 57 47 151 - - (16) 208 54 219
Income from equity affiliates 77 129 (135) (453) - - - - (135) (453) (58) (324)
Net income before tax 711 284 16 48 (431) (3,457) 193 (202) (222) (3,611) 489 (3,327) Income tax (3) 191 (16) (48) (90) 903 (50) 54 (156) 909 (159) 1,100 Net income from continuing operations 708 475 - - (521) (2,554) 143 (148) (378) (2,702) 330 (2,227)
Income attributed to minority interests (10) (22) - - 3 1 (6) 18 (3) 19 (13) (3) Net income from continuing activities attributable to the parent
698 453 - - (518) (2,553) 137 (130) (381) (2,683) 317 (2,230)
Profit from discontinued operations - - - - 299 - - - 299 - 299 - TOTAL NET INCOME ATTRIBUTABLE TO THE PARENT COMPANY 698 453 - - (219) (2,553) 137 (130) (82) (2,683) 616 (2,230)
As of December 31 ADJUSTMENTS
Adjusted Result
Joint Arrangements reclassification
Special items Inventory Effect (2)
Total Adjustments
Profit/loss under EU-IFRS
Million euros 2016 2015 2016 2015 2016 2015 2016 2015 2016 2015 2016 2015
Operating income 2,067 (1) 1,764 (1) 98 355 (448) (4,147) 194 (696) (156) (4,488) 1,911 (2,724) Financial result (315) 244 (68) 44 149 173 - - 81 217 (234) 461
Income from equity affiliates 371 469 (177) (558) - - - - (177) (558) 194 (89)
Net income before tax 2,123 2,477 (147) (159) (299) (3,974) 194 (696) (252) (4,829) 1,871 (2,352)
Income tax (164) (539) 147 159 (323) 1,182 (51) 194 (227) 1,535 (391) 996 Net income from continuing operations 1,959 1,938 - - (622) (2,792) 143 (502) (479) (3,294) 1,480 (1,356)
Income attributed to minority interests (37) (86) - - 4 1 (10) 43 (6) 44 (43) (42) Net income from continuing activities attributable to the parent
1,922 1,852 - - (618) (2,791) 133 (459) (485) (3,250) 1,437 (1,398)
Profit from discontinued operations - - - - 299 - - - 299 - 299 - TOTAL NET INCOME ATTRIBUTABLE TO THE PARENT COMPANY 1,922 1,852 - - (319) (2,791) 133 (459) (186) (3,250) 1,736 (1,398)
(1) Result from continuing operations at replacement cost (CCS). (2) The inventory effect represents an adjustment to “Consumption of raw materials and other consumables" and “Changes in inventory of
finished goods and work in progress” on the income statement under IFRS-EU.

Translation of a report originally issued in Spanish. In the event of a discrepancy, the Spanish language version prevails
92
EBITDA:
EBITDA is defined as "Earnings Before Interest, Taxes, Depreciation, and Amortization", and is a financial indicator which determines the operating margin of a company prior to deducting interest, taxes, impairments, restructuring costs, and amortization. Since it does not include financial and tax indicators or accounting expenses not involving cash outflow, it is used by Management to evaluate the company’s results over time, thereby making comparisons with other Oil &Gas sector companies a more straightforward exercise.
EBITDA is calculated as Operating Income + Amortization + Impairments + Restructuring costs as well as other items which do not represent cash entry or outflows from transactions (capital gains/losses from divestitures, provisions, etc.). Operating income corresponds to the result from continuing operations at average weighted costs (AWC). In cases in which the Result from continuing operations at Current Cost of Supply (CCS) is used, it is considered EBITDA CCS.
Fourth Quarter
Group Reporting
Model
Joint arrangements reclassification and
others Inventory effect Cash flow statement
IFRS-EU(1)
2016 2015 2016 2015 2016 2015 2016 2015 EBITDA 1,668 1,022 (253) (159) - - 1,415 863
EBITDA CCS 1,475 1,224 (253) (159) 193 (202) 1,415 863
As of December 31
Group Reporting
Model
Joint arrangements reclassification and
others Inventory effect Cash flow statement
IFRS-EU(1)
2016 2015 2016 2015 2016 2015 2016 2015 EBITDA 5,226 4,416 (808) (687) - - 4,418 3,729
EBITDA CCS 5,032 5,112 (808) (687) 194 (696) 4,418 3,729
(1) Corresponds to “Net income before tax” and “Adjustments to net income” on the consolidated Cash Flow Statement prepared under IFRS-EU.

Translation of a report originally issued in Spanish. In the event of a discrepancy, the Spanish language version prevails
93
ROACE:
This APM is used by Repsol Management to evaluate the capacity of its operating assets to generate profit, and therefore measures invested capital (equity and debt).
ROACE is calculated as: (operating results adjusted for joint ventures outcomes excluding “Special items” + Income taxes + Recurrent results from investees) / (Capital employed during the continuing operations period). Capital employed measures own and external capital invested in the company, and corresponds to Total Equity + Net debt. It includes that which corresponds to joint ventures or other companies whose operations are generated as such. NUMERATOR 2016 2015 Operating profit EU-IFRS 1,911 (2,724) Adjustment joint ventures (98) (355) Adjustment special items 448 4,147 Income tax (1) (340) (303) Share of profit (loss) of entities accounted for using the equity method - net of dividends 371 469 I. ROACE result at average weighted cost 2,292 1,234
DENOMINATOR Total equity 31,111 28,762 Net financial debt 8,144 11,934 Capital employed at year end 39,255 40,696
II. Average capital employed (2) 39,818 41,090
ROACE (I/II) 5.8 3.0
(1) Does not include income tax corresponding to financial results. (2) Corresponds to the average balance of capital employed at the beginning and end of the year. 2. Cash flow measures Free Cash Flow, Cash Generated and Liquidity:
The two main metrics used by Group management to measure cash generation in the period are Free cash flow and Cash generated.
Free Cash Flow measures cash flow generation from operating and investment activities, and is quite useful for evaluating the funds available for paying shareholder dividends, and debt service payments.
Cash generated is equal to free cash flow less dividend payments and remuneration of other equity instruments such as net interest and lease payments. This APM measures the funds generated by the Company prior to financial transactions (mainly debt issues and cancellations).
The following is a reconciliation of Free Cash Flow and Cash Generated with the consolidated statements of cash flow prepared under IFRS-EU.

Translation of a report originally issued in Spanish. In the event of a discrepancy, the Spanish language version prevails
94
Fourth Quarter
Adjusted Cash Flow Joint arrangements
reclassification and others Cash Flow Statement IFRS-EU
2016 2015 2016 2015 2016 2015 I. Cash flows from / (used in) operating activities 1,402 2,453 246 (246) 1,648 2,207
II. Cash flows from / (used in) investing activities 29 (1,015) (482) 896 (453) (119)
Free cash flow (I+II) 1,431 1,438 (236) 650 1,195 2,088
III. Cash flows from / (used in) financing activities and others (1) (85) (1,039) 190 (620) 105 (1,659)
Net increase / (decrease) in cash and cash equivalents 1,346 399 (46) 30 1,300 429
Cash and cash equivalents at the beginning of the period 3,572 2,370 (185) (351) 3,387 2,019
Cash and cash equivalents at the end of the period 4,918 2,769 (231) (321) 4,687 2,448
As of December 31
Adjusted Cash Flow Joint arrangements reclassification and others Cash Flow Statement IFRS-EU
2016 2015 2016 2015 2016 2015 I. Cash flows from / (used in) operating activities 3,832 5,513 58 (577) 3,890 4,936
II. Cash flows from / (used in) investing activities 491 (11,531) (100) 2,571 391 (8,960)
Free cash flow (I+II) 4,323 (6,018) (42) 1,994 4,281 (4,024)
Cash generated 3,246 (7,222) 9 (35) 3,255 (7,257)
III. Cash flows from / (used in) financing activities and others (1) (2,174) 3,760 132 (1,926) (2,042) 1,834
Net increase / (decrease) in cash and cash equivalents 2,149 (2,258) 90 68 2,239 (2,190)
Cash and cash equivalents at the beginning of the period 2,769 5,027 (321) (389) 2,448 4,638
Cash and cash equivalents at the end of the period 4,918 2,769 (231) (321) 4,687 2,448
(1) Includes payments for dividends and payments on other equity instruments, interest payments, other proceeds from/ (payments for) financing activities, proceeds from / (payments for) equity instruments , proceeds from / (payments for) financial liabilities and the exchange rate fluctuations effect.
The Group measures liquidity as the total of “Cash and cash equivalents” and undrawn committed lines of credit at year end which correspond to loans granted by financial institutions which may be drawn down by the company in installments, the amount, and the remaining terms of the agreement.
As of December 31
Group Reporting
Model Joint arrangements
reclassification and others IFRS-EU
2016 2015 2016 2015 2016 2015 Cash and Cash equivalents 4,918 2,771 (231) (323) 4,687 2,448 Undrawn credit lines 4,429 6,360 - 0 4,429 6,360 Liquidity 9,347 9,131 (231) (323) 9,116 8,808

Translation of a report originally issued in Spanish. In the event of a discrepancy, the Spanish language version prevails
95
Net Operating Investments:
Group management uses this APM to measure each period’s investing effort, as well as its assignment by businesses segment, and corresponds to net investments of divestments made by different Group businesses. It includes what corresponds to joint ventures or other companies whose operations are generated as such. Fourth Quarter
Net operating investments
Joint arrangements reclassification and others Cash flow statement IFRS-EU(1)
2016 2015 2016 2015 2016 2015 Upstream 164 918 (77) (361) 87 557 Downstream (42) 332 (163) (322) (205) 10 Corporation and others (15) 14 (5) (13) (20) 1 TOTAL 107 (2) 1,264 (245) (696) (138) 568
As of December 31
Net operating investments
Joint arrangements reclassification and others Cash flow statement IFRS-EU(1)
2016 2015 2016 2015 2016 2015 Upstream 1,889 11,370 (565) (1,233) 1,324 10,137 Downstream (496) 493 1 (9) (495) 484 Corporation and others (1,893) 97 6 1 (1,887) 98 TOTAL (500) (2) 11,960 (558) (1,241) (1,058) 10,719
(1) This corresponds to “Proceeds from divestments” and “Payments on investments” on the consolidated statement of cash flows prepared
under IFRS-EU, and does not include items corresponding to “Other financial assets.” (2) Gross capital expenditure amounted to 3,410 million euros in 2016 (915 million euros in Q4 2016).
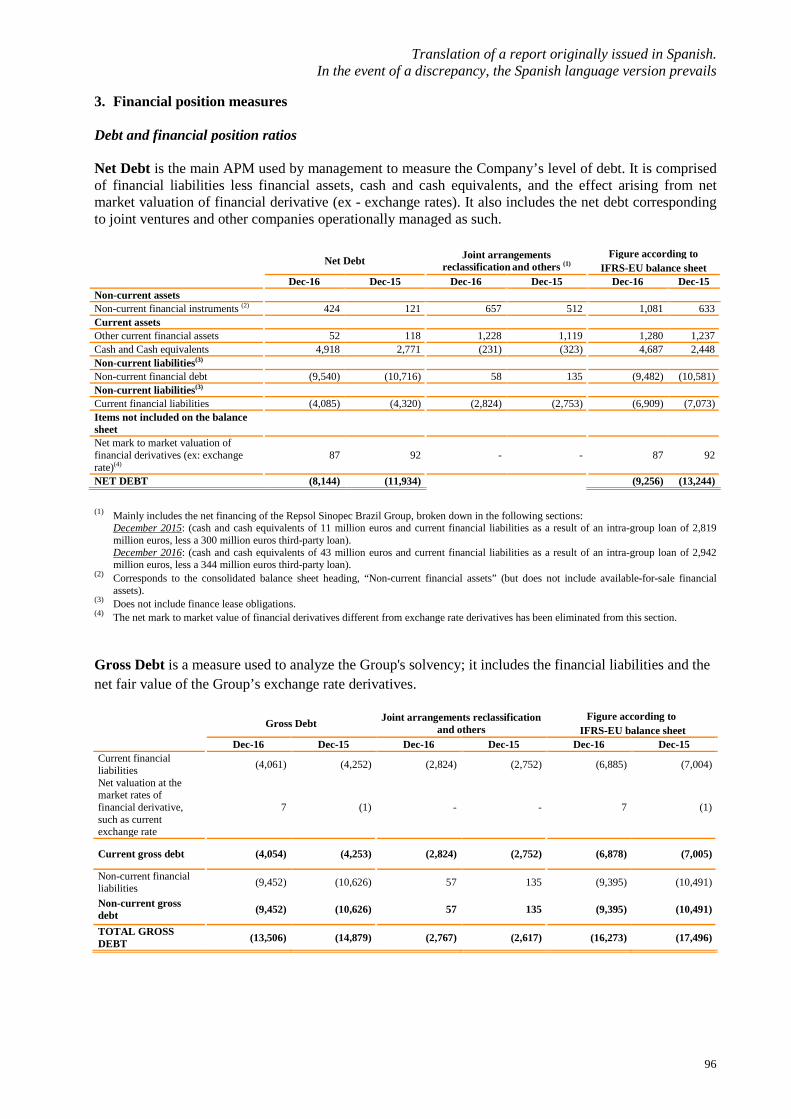
Translation of a report originally issued in Spanish. In the event of a discrepancy, the Spanish language version prevails
96
3. Financial position measures Debt and financial position ratios Net Debt is the main APM used by management to measure the Company’s level of debt. It is comprised of financial liabilities less financial assets, cash and cash equivalents, and the effect arising from net market valuation of financial derivative (ex - exchange rates). It also includes the net debt corresponding to joint ventures and other companies operationally managed as such. Net Debt Joint arrangements
reclassification and others (1) Figure according to
IFRS-EU balance sheet Dec-16 Dec-15 Dec-16 Dec-15 Dec-16 Dec-15 Non-current assets Non-current financial instruments (2) 424 121 657 512 1,081 633 Current assets Other current financial assets 52 118 1,228 1,119 1,280 1,237 Cash and Cash equivalents 4,918 2,771 (231) (323) 4,687 2,448 Non-current liabilities(3) Non-current financial debt (9,540) (10,716) 58 135 (9,482) (10,581) Non-current liabilities(3) Current financial liabilities (4,085) (4,320) (2,824) (2,753) (6,909) (7,073) Items not included on the balance sheet
Net mark to market valuation of financial derivatives (ex: exchange rate)(4)
87 92 - - 87 92
NET DEBT (8,144) (11,934) (9,256) (13,244)
(1) Mainly includes the net financing of the Repsol Sinopec Brazil Group, broken down in the following sections:
December 2015: (cash and cash equivalents of 11 million euros and current financial liabilities as a result of an intra-group loan of 2,819 million euros, less a 300 million euros third-party loan). December 2016: (cash and cash equivalents of 43 million euros and current financial liabilities as a result of an intra-group loan of 2,942 million euros, less a 344 million euros third-party loan).
(2) Corresponds to the consolidated balance sheet heading, “Non-current financial assets” (but does not include available-for-sale financial assets).
(3) Does not include finance lease obligations. (4) The net mark to market value of financial derivatives different from exchange rate derivatives has been eliminated from this section.
Gross Debt is a measure used to analyze the Group's solvency; it includes the financial liabilities and the net fair value of the Group’s exchange rate derivatives.
Gross Debt Joint arrangements reclassification and others
Figure according to IFRS-EU balance sheet
Dec-16 Dec-15 Dec-16 Dec-15 Dec-16 Dec-15 Current financial liabilities (4,061) (4,252) (2,824) (2,752) (6,885) (7,004)
Net valuation at the market rates of financial derivative, such as current exchange rate
7 (1) - - 7 (1)
Current gross debt (4,054) (4,253) (2,824) (2,752) (6,878) (7,005)
Non-current financial liabilities (9,452) (10,626) 57 135 (9,395) (10,491)
Non-current gross debt (9,452) (10,626) 57 135 (9,395) (10,491)
TOTAL GROSS DEBT (13,506) (14,879) (2,767) (2,617) (16,273) (17,496)
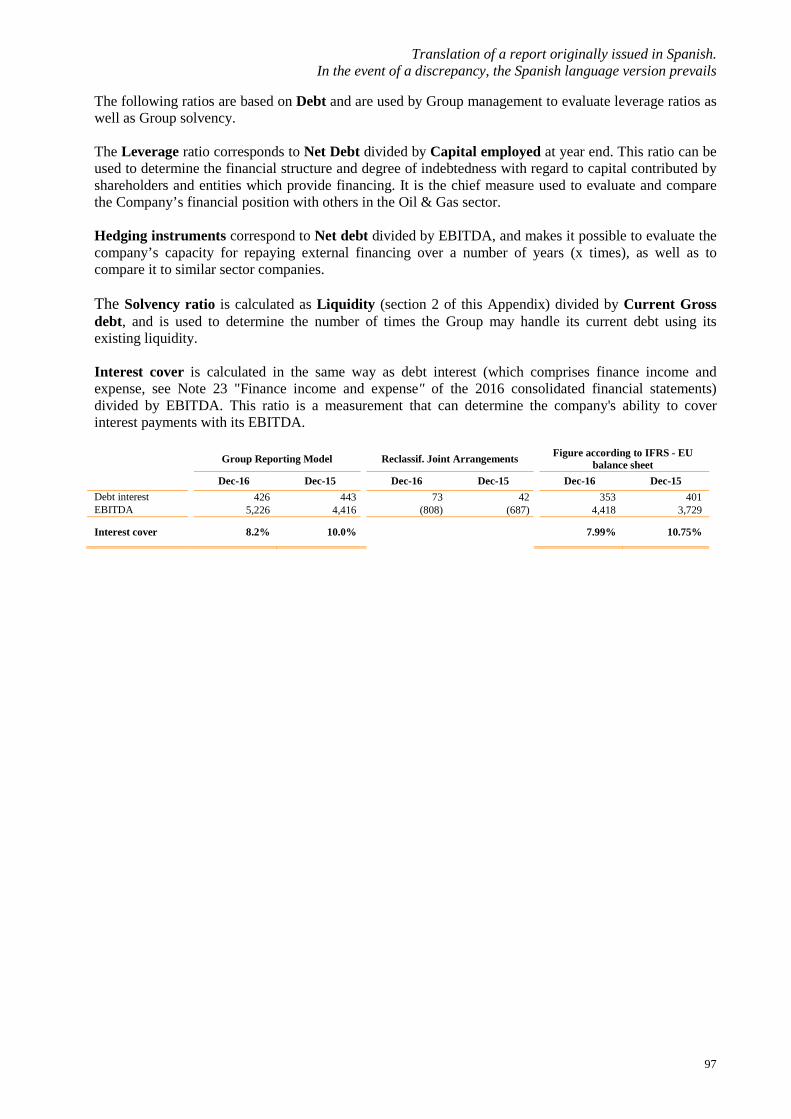
Translation of a report originally issued in Spanish. In the event of a discrepancy, the Spanish language version prevails
97
The following ratios are based on Debt and are used by Group management to evaluate leverage ratios as well as Group solvency. The Leverage ratio corresponds to Net Debt divided by Capital employed at year end. This ratio can be used to determine the financial structure and degree of indebtedness with regard to capital contributed by shareholders and entities which provide financing. It is the chief measure used to evaluate and compare the Company’s financial position with others in the Oil & Gas sector. Hedging instruments correspond to Net debt divided by EBITDA, and makes it possible to evaluate the company’s capacity for repaying external financing over a number of years (x times), as well as to compare it to similar sector companies. The Solvency ratio is calculated as Liquidity (section 2 of this Appendix) divided by Current Gross debt, and is used to determine the number of times the Group may handle its current debt using its existing liquidity. Interest cover is calculated in the same way as debt interest (which comprises finance income and expense, see Note 23 "Finance income and expense" of the 2016 consolidated financial statements) divided by EBITDA. This ratio is a measurement that can determine the company's ability to cover interest payments with its EBITDA.
Group Reporting Model Reclassif. Joint Arrangements Figure according to IFRS - EU balance sheet
Dec-16 Dec-15 Dec-16 Dec-15 Dec-16 Dec-15 Debt interest 426 443 73 42 353 401 EBITDA 5,226 4,416 (808) (687) 4,418 3,729
Interest cover 8.2% 10.0% 7.99% 10.75%

Translation of a report originally issued in Spanish. In the event of a discrepancy, the Spanish language version prevails
98
APPENDIX II: CONVERSION TABLE AND ABBREVIATIONS
(1) Benchmark average: 32.35° API and relative density of 0.8636.
OIL
GAS
ELECTRICITY
Liters Barrels
Cubic meters toe
Cubic meters Cubic feet
kWh
OIL 1 barrel (1) b 158.99 1 0.16 0.14 162.60 5.615 1.7x10⁶ 1 cubic meter (1) m3 1,000 6.29 1 0.86 1,033 36,481 10,691.5 1 ton of oil equivalent
(1) toe 1,160.49 7.30 1.16 1 1.187 41,911 12,407.4
GAS 1 cubic meter m3 0.98 0.01 0.001 0.001 1 35.32 10.35 1,000 cubic
feet=1.04x10⁶ Btu ft3 27.64 0.18 0.03 0.02 28.3 1.000 293.1
ELECTRICITY 1 megawatt hour MWh 93.53 0.59 0.10 0.08 96.62 3,412.14 1.000
Meter Inch Foot Yard
LENGTH Meter
m 1 39.37 3.281 1.093 Inch in 0.025 1 0.083 0.028 Foot ft 0.305 12 1 0.333 Yard yd 0.914 36 3 1
Kilogram Pound Ton
MASS Kilogram kg 1 2.2046 0.001 Pound lb 0,45 1 0.00045 Ton t 1,000 22,046 1
Cubic feet Barrel Liter
Cubic meter
VOLUME cubic foot
ft3 1 0,1781 28,32 0,0283 Barrel b 5.615 1 158,984 0,1590 Liter l 0.0353 0.0063 1 0.001 cubic meter m3 35.3147 6.2898 1,000 1
Term Description
Term Description
Term Description bbl / bbl/d Barrel/ Barrel per day Mb Thousand barrels of oil Mm3/d Million cubic meters per day bcf Bcf Billion cubic feet kbbl/d Thousand barrels per day Mscf/d Million standard cubic feet per day Bm3 Billion cubic meters Mboe Thousand barrels of oil equivalent kscf/d Thousand standard cubic feet per day
Boe Barrel of oil equivalent Mboe/d Thousand barrels of oil equivalent per day MMW Million watts
Btu/MBtu British thermal unit/ Btu/millions of Btu km2 Square kilometer MWh Megawatt hour
LPG Liquefied petroleum gas Kt/Mt Thousand tons/Million tons Tcf Trillion cubic feet LNG Liquid Natural Gas MMb Million barrels toe Tons of oil equivalent
GWh Gigawatts per hour MMboe Million barrels of oil equivalent USD / Dollar / $
US dollar
Translation of a report originally issued in Spanish. In the event of a discrepancy, the Spanish language version prevails
99
APPENDIX III: ANNUAL CORPORATE GOVERNANCE REPORT
Included as Appendix to this document, and as an integral part of the whole document, is the Annual Corporate Governance Report for 2016, as is required under Article 538 to the Spanish Companies Act (“Ley de Sociedades de Capital”).