2016 cord cutter & cord never study -...
TRANSCRIPT

2016 Cord Cutter & Cord Never Study

Our 2016 Cord Cutter & Cord Never Study builds on our 2014 Cord Cutter Study by providing a focused look at both US consumers who opted out of subscription-based paid-TV service in the last two years (i.e. Cord Cutters) as well as US consumers who have never subscribed to paid-TV service (i.e. Cord Nevers). The inclusion of Cord Nevers in this version is reflective of the growing trend, particularly among younger consumers, to opt for streaming services and avoid subscription-based paid-TV altogether.
In this study, we uncover the key reasons and frustrations that led Cord Cutters to terminate their paid-TV subscription and Cord Nevers to avoid this service altogether. Additionally, we also examine the types of services (paid and unpaid) that these consumers use to access content, the types of devices they use to consume it, and how much they typically spend on these services.
Methodology: + Online survey of 1,119 US consumers + 759 Cord Cutters (cut the cord in the last 2 years) + 360 Cord Nevers + Sample is representative of US market + Field dates: July 25 through August 1, 2016
Welcome to the 2016 Cord Cutter & Cord Never Study
22016 Cord Cutter & Cord Never Study
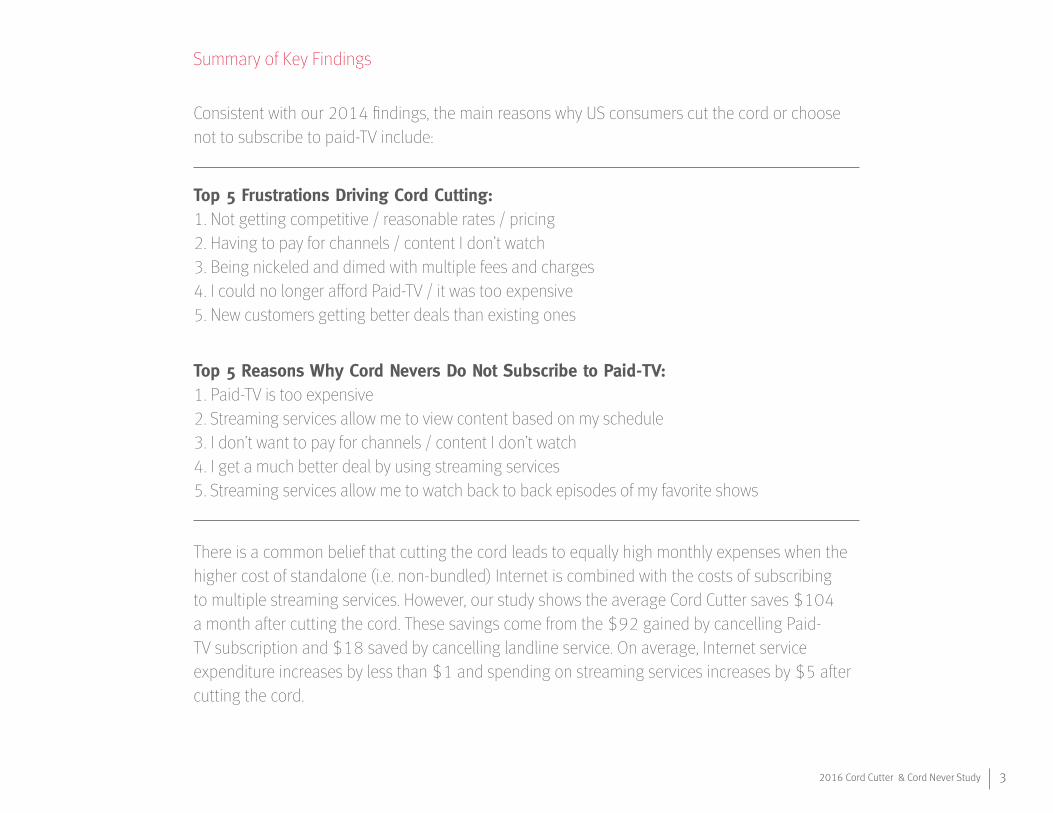
Consistent with our 2014 findings, the main reasons why US consumers cut the cord or choose not to subscribe to paid-TV include:
There is a common belief that cutting the cord leads to equally high monthly expenses when the higher cost of standalone (i.e. non-bundled) Internet is combined with the costs of subscribing to multiple streaming services. However, our study shows the average Cord Cutter saves $104 a month after cutting the cord. These savings come from the $92 gained by cancelling Paid-TV subscription and $18 saved by cancelling landline service. On average, Internet service expenditure increases by less than $1 and spending on streaming services increases by $5 after cutting the cord.
Summary of Key Findings
32016 Cord Cutter & Cord Never Study
Top 5 Frustrations Driving Cord Cutting: 1. Not getting competitive / reasonable rates / pricing 2. Having to pay for channels / content I don’t watch 3. Being nickeled and dimed with multiple fees and charges 4. I could no longer afford Paid-TV / it was too expensive 5. New customers getting better deals than existing ones
Top 5 Reasons Why Cord Nevers Do Not Subscribe to Paid-TV: 1. Paid-TV is too expensive 2. Streaming services allow me to view content based on my schedule 3. I don’t want to pay for channels / content I don’t watch 4. I get a much better deal by using streaming services 5. Streaming services allow me to watch back to back episodes of my favorite shows
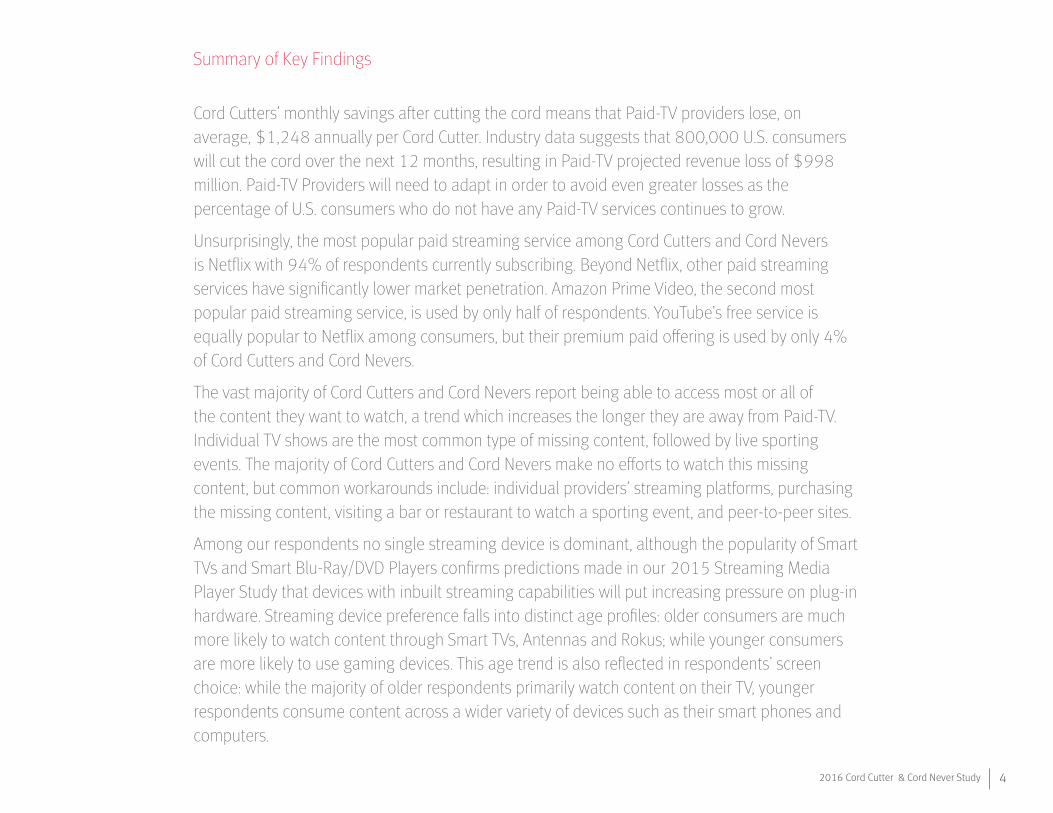
Cord Cutters’ monthly savings after cutting the cord means that Paid-TV providers lose, on average, $1,248 annually per Cord Cutter. Industry data suggests that 800,000 U.S. consumers will cut the cord over the next 12 months, resulting in Paid-TV projected revenue loss of $998 million. Paid-TV Providers will need to adapt in order to avoid even greater losses as the percentage of U.S. consumers who do not have any Paid-TV services continues to grow.
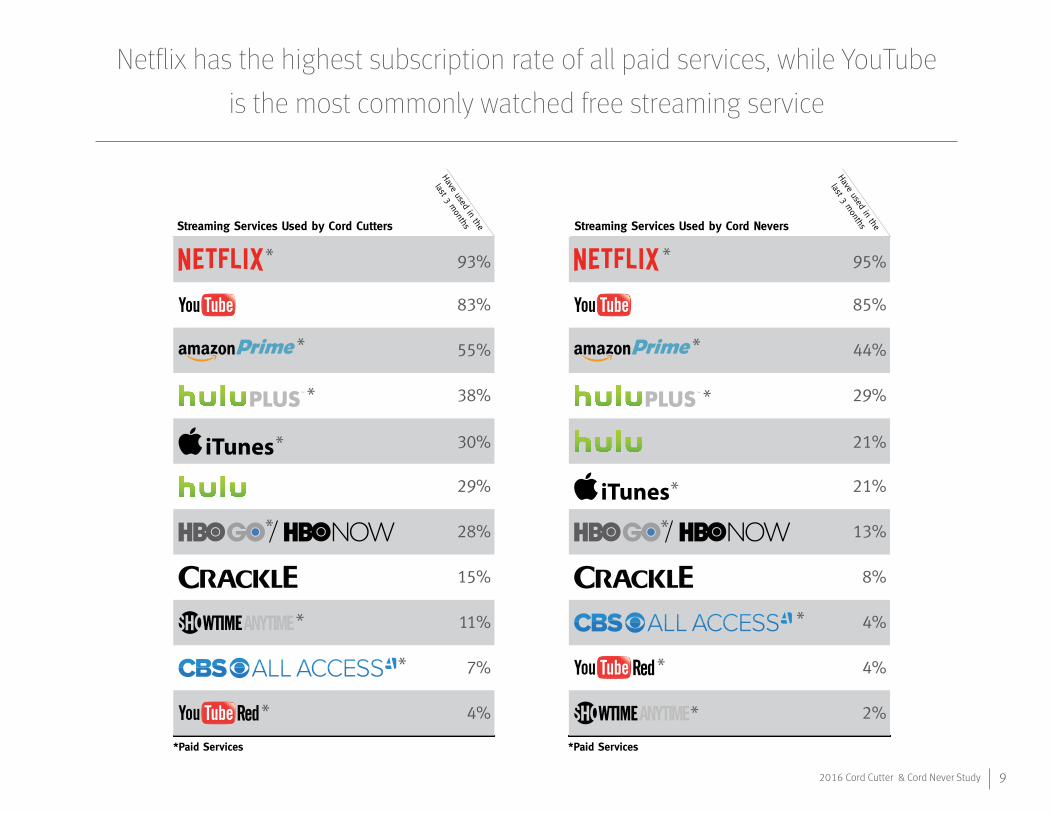
Unsurprisingly, the most popular paid streaming service among Cord Cutters and Cord Nevers is Netflix with 94% of respondents currently subscribing. Beyond Netflix, other paid streaming services have significantly lower market penetration. Amazon Prime Video, the second most popular paid streaming service, is used by only half of respondents. YouTube’s free service is equally popular to Netflix among consumers, but their premium paid offering is used by only 4% of Cord Cutters and Cord Nevers.
The vast majority of Cord Cutters and Cord Nevers report being able to access most or all of the content they want to watch, a trend which increases the longer they are away from Paid-TV. Individual TV shows are the most common type of missing content, followed by live sporting events. The majority of Cord Cutters and Cord Nevers make no efforts to watch this missing content, but common workarounds include: individual providers’ streaming platforms, purchasing the missing content, visiting a bar or restaurant to watch a sporting event, and peer-to-peer sites.
Among our respondents no single streaming device is dominant, although the popularity of Smart TVs and Smart Blu-Ray/DVD Players confirms predictions made in our 2015 Streaming Media Player Study that devices with inbuilt streaming capabilities will put increasing pressure on plug-in hardware. Streaming device preference falls into distinct age profiles: older consumers are much more likely to watch content through Smart TVs, Antennas and Rokus; while younger consumers are more likely to use gaming devices. This age trend is also reflected in respondents’ screen choice: while the majority of older respondents primarily watch content on their TV, younger respondents consume content across a wider variety of devices such as their smart phones and computers.
Summary of Key Findings
42016 Cord Cutter & Cord Never Study

Overall, 84% of Cord Cutters are happy with their decision to cut the cord and less than 2% plan on returning to Paid-TV in the next 12 months. Industry data suggests there are 5.5 million Cord Cutting households in the U.S., so only 110,000 ex-subscribers are likely to return to Paid-TV over the next year. Interestingly, consumers who cut the cord in the last month are more than twice as likely to regret their decision, with 4% indicating they plan to on returning to Paid-TV in the next 12 months; this represents an opportunity for Paid-TV providers to recapture these consumers by capitalizing on cutter’s remorse. Cord Nevers, on the other hand, report a slightly higher inclination to subscribe to Paid-TV than Cord Cutters with 6% stating they are very or extremely likely to subscribe in the next 12 months. As there are an estimated 16.9 million Cord Never households in the U.S., this creates a significant, 1 million household opportunity for Paid-TV providers to capture dissatisfied Cord Nevers, if they can offer Cord Nevers the control and flexibility they value.
Our study confirms the popular image of Cord Nevers as being younger than Cord Cutters: 31% of Cord Never respondents are between 18-24 years old, compared to 11% of Cord Cutters. Cord Nevers are also significantly more likely to earn less than $50,000 a year, supporting the finding that the cost of Paid-TV is a major disincentive to subscribing. As this younger generation ages and acquires increasing spending power, it will be interesting to see how their preference for flexibility, alternative viewing patterns and control over cost impacts the traditional Paid-TV model of couch-bound, multi-channel viewing.
Summary of Key Findings
52016 Cord Cutter & Cord Never Study

“I just wasn’t getting my money’s worth from my cable package. I was
able to spend less money overall by subscribing to Netflix, watching free stuff on Hulu and Crackle, and
purchasing the occasional paid cable show from iTunes.”
– Cord Cutter

72016 Cord Cutter & Cord Never Study
Cord Cutters are driven by frustrations around the cost of Paid-TV;
Cord Nevers are also driven by the desire to control what they watch.
Not getting competitive / reasonable rates / pricing
Having to pay for channels / content I don’t watch
Being nickeled and dimed with multiple fees and charges
I could no longer afford Paid-TV / it was too expensive
New customers getting better deals than existing ones
All my favorite content was available elsewhere
Having to be locked into a contract
Trying to be sold on services/options I don’t need or want
I did not value the content/service provided
Feeling like they don’t deliver on their promise / care about me as a customer
66%
63%
60%
52%
50%
33%
29%
29%
28%
28%
% Contributed
Significantly Top 10 Frustrations Driving Cord Cutting:
Paid-TV is too expensive
Streaming services allow me to view content based on my schedule
I don’t want to pay for channels / content I don’t watch
I get a much better deal by using streaming services
Streaming services allow me to watch back to back episodes of my favorite shows
Streaming services allow greater flexibility for where I want to view my content
I can control my expenses more easily by using streaming services
I want to avoid being locked-in to a cable contract
All my favorite content is available through streaming services
I don’t want to rent / buy a cable box
73%
71%
71%
69%
64%
63%
59%
57%
47%
38%
% Contributed
Significantly Top 10 Reasons Why Cord Nevers Do Not Subscribe to Paid-TV:

82016 Cord Cutter & Cord Never Study
Cord Cutters save an average of $104 (56%) per month by leaving Paid-TV,
but they still pay $12 more monthly than the average Cord Never.
Cable
Internet
Streaming
Home Phone
TOTAL
$92
$52
$15
$28
$187
Cable
Internet
Streaming
Home Phone
TOTAL
-
$53
$15
$10
$83
Cable
Internet
Streaming
Home Phone
TOTAL
-
$53
$18
-
$71
TOTAL BEFORE CUTTING CORD
CORD CUTTER MONTHLY SAVINGS CORD NEVER MONTHLY EXPENDITURE
TOTAL AFTER CUTTING CORD($104 SAVINGS)
TOTAL CORD NEVER SPENDING
$187 $83 $71
AVERAGE ANNUAL REVENUE LOSS PER CORD CUTTER
$1,248PROJECTED REVENUE LOSS
DUE TO CORD CUTTING OVER THE NEXT 12 MONTHS*
LEADING TO
$998M
56%
*Figure calculated using industry survey data which estimates 800,000 U.S. Consumers will cut the cord from August 2016-17.
92016 Cord Cutter & Cord Never Study
Netflix has the highest subscription rate of all paid services, while YouTube
is the most commonly watched free streaming service
Netflix
YouTube
Amazon Prime Video
Hulu Plus
iTunes / iTunes Store
Hulu
HBO GO / NOW
Crackle
CBS All Access
Showtime Anytime
YouTube Red
93%
83%
55%
38%
30%
29%
28%
15%
11%
7%
4%
Have used in the
last 3 months Streaming Services Used by Cord Cutters
Netflix
YouTube
Amazon Prime
Hulu Plus
Hulu
iTunes / ITunes Store
HBO GO / NOW
Crackle
CBS All Access
YouTube Red
Showtime Anytime
95%
85%
44%
29%
21%
21%
13%
8%
4%
4%
2%
Have used in the
last 3 months Streaming Services Used by Cord Nevers
95%
85%
44%
29%
21%
21%
13%
8%
4%
4%
2%
*Paid Services*Paid Services

“I can get most of my shows online. Paying for TV has never been worth it.”
– Cord Never

112016 Cord Cutter & Cord Never Study
Most Cord Cutters and Cord Nevers can access the content they want to watch
without Paid TV; TV shows, live sports, and live news are the most missed content
OF CORD CUTTERS CAN ACCESS MOST OR ALL OF THE CONTENT
THEY WANT TO WATCH
83%OF CORD NEVERS CAN ACCESS MOST OR ALL OF THE CONTENT
THEY WANT TO WATCH
87%
10
20
30
40
50
60
Individual Channels /
Content Providers
PurchasedMissing Content
Venues Outsidethe Home
Peer-to-PeerServices
No Attempts
22%
5% 5% 3%
61%
10
20
30
40
50
60
Individual Channels /
Content Providers
PurchasedMissing Content
Venues Outsidethe Home
Peer-to-PeerServices
No Attempts
13% 8% 5% 5%
66%
10
31%21%
13%4%
TV Shows Sports Live News,Local Info
Movies
20
30
40
TV Shows Sports Live News,Local Info
Movies
32%
13% 10% 8%10
20
30
40
WHAT CONTENT CONSUMERS THINK THEY CAN'T ACCESS
WHAT CONTENT CONSUMERS THINK THEY CAN'T ACCESS
CORD CUTTERS CORD NEVERS
WHAT EFFORTS CONSUMERS MAKE TO ACCESS MISSING CONTENT
WHAT EFFORTS CONSUMERS MAKE TO ACCESS MISSING CONTENT

122016 Cord Cutter & Cord Never Study
No one streaming device is dominant among Cord Cutters or Cord
Nevers, but ‘Smart’ devices are popular among both groups.
Smart TV
Smart Blu-Ray / DVD Player
Roku
Antenna
Playstation
Xbox
Amazon Fire
Google Chromecast
Apple TV
Other
37%
35%
33%
27%
23%
23%
23%
17%
16%
13%
% TotalStreaming Devices Owned by Cord Cutters
Smart Blu-Ray / DVD Player
Smart TV
Playstation
Xbox
Roku
Antenna
Google Chromecast
Amazon Fire
Apple TV
Other
34%
28%
22%
21%
19%
19%
13%
13%
11%
22%
% TotalStreaming Devices Owned by Cord Cutters
18 - 24
10
20
30
40
50
60
70
25 - 34 35 - 44 45 - 54 55 +
Cord Cutters Cord Nevers
PREFERRED DEVICES FALL INTO DISTINCT AGE VIEWING PROFILES
18 - 24
10
20
30
40
50
60
70
25 - 34 35 - 44 45 - 54 55 + 18 - 24
10
20
30
40
50
60
70
25 - 34 35 - 44 45 - 54 55 +
SMART DEVICES(Smart TV’s / Smart Blu-Ray / DVD PLAYER)
GAMING DEVICES PLUG-INS
45%50%
57%62%
51% 54%
64%67%
57% 55%
43%40%
43%38% 37%
23%
15%12%
49%43%
72%
51%
64%58%
73%
44%
67%
41%43%
52%

“Everything is too expensive. Too much is included that I don’t use. And everything is on my cell phone now.”
– Cord Cutter

142016 Cord Cutter & Cord Never Study
While most respondents still view streamed content through their TVs,
younger consumers are more likely to access streaming services on their
phones, tablets and computers.
Television
Smart Phone
Tablet
Computer
93%
43%
38%
36%
% TotalTypes of Screens Watched by Cord Cutters
DISTINCT AGE VIEWING PROFILES
Television
Computer
Smart Phone
Tablet
84%
45%
41%
25%
% TotalTypes of Screens Watched by Cord Nevers
TELEVISION
20
40
60
80
100
18 - 24 25 - 34 35 - 44 45 - 54 55 +
80% 81%
96% 94% 95%
74%
92%86%81%
91%
SMART PHONE
20
40
60
80
100
18 - 24 25 - 34 35 - 44 45 - 54 55 +
67%55% 50%
42%34%
21% 25%16%
49%41%
TABLET
20
40
60
80
100
18 - 24 25 - 34 35 - 44 45 - 54 55 +
2818%
38% 41% 41% 38% 33%27%
36%
21%
COMPUTER
20
40
60
80
100
18 - 24 25 - 34 35 - 44 45 - 54 55 +
51%58%
33% 36%30%
46%38% 35%32%
42%
Cord Cutters Cord Nevers

“No services have all the movies and shows that I want to see. Shows
that stream immediately after broadcast are also rare.”
– Cord Never

162016 Cord Cutter & Cord Never Study
There is an opportunity to recapture Cord Cutters experiencing cutter’s remorse.

172016 Cord Cutter & Cord Never Study
!About cg42 The biggest challenges require the boldest moves.
Since 2010, cg42 has helped some of the world’s most important companies address their biggest challenges.
+Howtoputthecustomerfirst?
+Howtobeonecompany?
+Howtocompeteonyourterms?
+Howtogrow?
Our clients all share one thing: they operate in mature, highly competitive, disruption-ready categories. We help them defineandexecutetheboldmovesrequiredtodriverapidmarketsharegain.
Wedothisbyaskingthequestionsothershaven’tthoughttoask,treatinginsightsasacompetitiveadvantage,anddetermining the bold moves that will align all parts of our clients’ organization to create positive change.
DON’T PANIC
www.cg42.com
©2016 cg42 All rights reserved. For reprint permission of this report or itsarticles,pleasecontactSteveBeck.
Contact UsSteveBeckManaging [email protected]
For Media InquiriesJordan MillerGroup [email protected]