2016 global application performance management price ... · application performance management...
TRANSCRIPT
2016 Global Application Performance Management
Price/Performance Value Leadership Award
2016
BEST PRACTICES RESEARCH
© Frost & Sullivan 2017 2 “We Accelerate Growth”
Contents
Background and Company Performance ........................................................................ 3
Industry Challenges .............................................................................................. 3
Price/Performance Attributes and Customer Impact .................................................. 4
Conclusion........................................................................................................... 6
Significance of Price/Performance Value Leadership ........................................................ 8
Understanding Price/Performance Value Leadership ........................................................ 8
Key Benchmarking Criteria .................................................................................... 9
Best Practice Award Analysis ....................................................................................... 9
Decision Support Scorecard ................................................................................... 9
Price/Performance Attributes ............................................................................... 10
Customer Impact ............................................................................................... 10
Decision Support Matrix ...................................................................................... 11
The Intersection between 360-Degree Research and Best Practices Awards ..................... 12
Research Methodology ........................................................................................ 12
Best Practices Recognition: 10 Steps to Researching, Identifying, and Recognizing Best Practices ................................................................................................................. 13
About Frost & Sullivan .............................................................................................. 14
BEST PRACTICES RESEARCH
© Frost & Sullivan 2017 3 “We Accelerate Growth”
Background and Company Performance
Industry Challenges
Current network complexity has given rise to a host of concerns that need to be addressed promptly
by service providers and enterprises to optimize network performance. With technological
advancements, the volume of data traffic is increasing exponentially. Frost & Sullivan points out
that network operators are unable to precisely monitor network performance - thus creating
massive errors and limiting network visibility for enterprise customers.
A more holistic software-oriented platform must be implemented to enable precision in monitoring
networks to improve the performance of business-critical applications. Using conventional
monitoring solutions available in the market merely amounts to higher end-user dissatisfaction due
to their meager capability to depict average data traffic and other related statistics, without
enabling customers to dig deeper into the real network problems.
Both private and public enterprises report to Frost & Sullivan that they are looking for a
comprehensive solution that will help eliminate the need for additional tools and overhead costs and
assist in simplifying the management of applications running over complex network infrastructures.
Many companies are purely focused on application performance management (APM) areas and not
on server monitoring, which further results in a huge loss for network operators due to the use of a
generic monitoring solution that does not assess the quality of the network infrastructure properly
and does not facilitate network performance optimization. The ability to obtain clear details of the
overall application’s performance from an end-user perspective is in demand.
In addition, in the face of the network becoming virtualized with increasing technological
complexity, enterprise customers are vying for a real-time monitoring solution that can effectively
map network performance in a granular manner. This need is a key business driver for companies
that can develop a holistic network analytics solution that identifies network problems in a detailed
manner and with ease from the huge amount of data traffic available. Thus, Frost & Sullivan
believes that companies that properly develop robust real-time analytics solutions that promptly
examine every single packet flowing through the network are positioned to ensure network
performance optimization.
Moving forward, companies need to gain control of the end-user experience to understand how
applications and the network affect service quality. Accordingly, solutions that unify the management
of applications, infrastructure, and networks will prevail and deliver even more value. In today’s highly
competitive market, separately analyzing the network and the applications is a clear mistake. In such
a scenario, companies that offer comprehensive, client-focused monitoring solutions (providing
visibility across all tiers of the application infrastructure, including Web servers, application servers,
networks, databases, and storage) enjoy a better position to sustain and grow in the APM market.
BEST PRACTICES RESEARCH
© Frost & Sullivan 2017 4 “We Accelerate Growth”
Price/Performance Attributes and Customer Impact of APM
Functionality
ManageEngine, an operational division of Zoho Corp, is an outright
leader in the global APM market due to its persistent drive to tap into
and analyze the untapped network data of its end users. Incredibly
strong in its technological abilities, ManageEngine has delivered huge
customer satisfaction by providing one of the most comprehensive
application management solutions that covers every aspect of
infrastructure management.
To ensure the highest levels of performance of the network infrastructure, ManageEngine has
introduced 4 solutions in 1: Web site monitoring, Web application performance monitoring, server
monitoring, and on-premise and cloud-based solutions. ManageEngine’s solution is quite unique in
managing and looking into transactions and understanding how they perform in the application. To
respond to the most demanding end-user requirements in the APM space, ManageEngine has
introduced 2 main products: Applications Manager and Site24x7.
Applications Manager is an on-premise solution for physical, virtual, and cloud environments. This
platform identifies slow transactions and the problem’s root cause, reducing troubleshooting time in
dynamic environments. ManageEngine clients have been able to reduce their help desk calls by at
least 30%. This solution offers a comprehensive value proposition to network operators, wherein they
can gain deeper visibility into the performance of business-critical applications with microsecond
precision. Applications Manager provides real end-user monitoring within the datacenter. The product
is downloaded directly from the company’s Web site, and the user configures the monitoring.
Applications Manager has expanded the capabilities of application components, application servers,
database monitoring, and server monitoring into virtualization.
Site24x7 is a cloud-based monitoring solution external to the datacenter monitoring the end-user
experience of Web applications from different geographical locations, including more than 50 locations
worldwide. Site24x7 is uniquely positioned to identify problems and monitor performance in various
locations -such as different branches. Installing or downloading the solution is not needed.
Both products have 4 major modules: automated application discovery and dependency mapping,
application and system performance monitoring, end-user experience monitoring, and mobile APM.
The 'mobile APM' feature is available only in Site24x7. The 'Automated application discovery and
dependency mapping' feature is available only in Applications Manager.
The automated application discovery and dependency mapping module provides detailed insights on
the relationships between applications and fundamental components. Users can generate a
dependency map between different applications and components that shows clear visibility and which
applications are related to specific databases and Web servers. Having a separate product to perform
the mapping and integrate it as part of the APM solution is not needed, as this is nicely embedded into
the product. With the application and system performance monitoring module, ManageEngine
expanded its portfolio into applications servers and databases. ManageEngine’s philosophy is to offer
the entire monitoring performance of the business infrastructure as part of a single product, without
users needing to install different point solutions. Frost & Sullivan notes that other solutions require
BEST PRACTICES RESEARCH
© Frost & Sullivan 2017 5 “We Accelerate Growth”
different databases, server streams, and virtualization as separate tools. ManageEngine combines all
of these into a single clever monitoring tool that provides performance insights into the IT
environment.
ManageEngine provides real end-user monitoring at the server side. With a holistic capability that
exceeds competing solutions with regards to end-user monitoring, ManageEngine’s APM platform
provides an agent-based instrumentation technology that monitors user transactions end-to-end
acrossthe application infrastructure in real time. The enriched functionalities of this platform allow
operators to monitor transactions end-to-end through code analysis and rapidly isolate performance
issues. ManageEngine’s unique solution has server-side monitoring and can recognize SQL queries
performed during transactions and find the poorest performing database queries. Moreover,
ManageEngine’s platform has the potential to offer considerable granularity into response time from a
network perspective (including resolution and connection time).
The capability of ManageEngine’s APM tools to retain data longer than the industry (data storage for
90 days) and the possibility for storing data even longer by changing the settings allow the company
to further strengthen its competitive position in the market through high growth potential.
Ease of Use
ManageEngine has demonstrated the unique capability to meet the
market needs with its best-in-class, easy-to-deploy solution. The
solution’s implementation process does not involve a steep
learning curve, and configuration of agents and resources is not
needed.
ManageEngine’s highly flexible platform provides extensive
visibility of the response time, time server, and application
performance over the browser level required by the operator. ManageEngine allows users to work
with end-to-end visibility of the application with anomaly detection and predictive analysis. The
company defines a baseline value for a particular application. A subsequent performance is then
compared to this net value, and anomalies are rapidly identified and adjusted.
Moreover, ManageEngine’s highly flexible platform allows for the customization of intuitive
dashboards. Users can create a dashboard for any attribute for a particular application or service.
Specialized views are customized into the product to track critical applications that need to run all
the time. In addition, customized report capabilities are available. Applications Manager and
Site24x7 have over 100 report modules. These reports can be dragged to the dashboard,
downloaded as a pdf file, and emailed to IT personnel. Frost & Sullivan research tracks how this
solution’s unique ease-of-use, simplicity, flexible configuration, and ability to adapt features for
customized reports have facilitated its penetration into different customers in North America and
worldwide.
ManageEngine has built a simple way of tracking background transactions. According to the
company, end users can easily identify slow internal queries and view the entire path in serving the
Web request in a tree format. From the map itself, users can drill down into the monitoring stage
and the particular details of the application and database and then proceed to the root cause
analysis. ManageEngine has made significant inroads in providing root cause analysis directly into
BEST PRACTICES RESEARCH
© Frost & Sullivan 2017 6 “We Accelerate Growth”
the compound application analysis and determine the performance problem. Users can easily
identify the SQL queries completed in the transaction and classify the poorest executing database
queries.
Frost & Sullivan applauds how ManageEngine’s APM platform truly outperforms legacy monitoring
solutions and provides consolidated visibility, prediction, and easy-to-use recorder tools.
ManageEngine APM solution’s comprehensive ability to capture user paths in an application, record
Web transactions, and replay the sequence in a browser is highly remarkable.
Product/Service Quality
ManageEngine has been quite successful in the APM market due to the
execution of its customer-centric strategies. With ManageEngine’s APM
solution, end users do not need to install agents on the product server or
product application.
ManageEngine is not focused on providing a classic monitoring solution.
The ability of ManageEngine’s APM platform to provide insights into real
end-user experience testifies to its potential to acquire an increasing
number of customers worldwide. ManageEngine’s ability to provide synthetic transaction monitoring
and gather application server metrics from the application side attracts increased customer
attention towards its APM platform. Users have comprehensive visibility with transaction-level
metrics by application, including response time, throughput, and detailed understanding of
slowdown causes and how much of the component is contributing to the response time. Users can
drill down to the core level transaction for any slowdown.
Perceived Value
ManangeEngine’s products offer high quality at an affordable starting
price in an annual subscription, which is clearly superior to many
offerings available in the APM market. The Applications Manager
Professional Edition starts at $795 for monitoring up to 25 applications.
The company’s strategy to offer the best price value at a fraction of the
current price of other APM companies provide has positioned it in a
leading market position, with strong double-digit yearly growth. ManageEngine is in a unique
position to support customers beyond Fortune 500 that are deploying the APM technology to grow
their business and need to optimize their infrastructure with a faster and more cost-effective
solution than available solutions.
Customer Purchase Experience
In the present network environment where operators are still lagging behind
and looking for a solution for ensuring best-in-class customer purchase
experience and service delivery, ManageEngine’s APM platform is a highly
differentiated offering, the result of high investments in R&D. Compared to
its other competitors, ManageEngine has adopted a deep focus on
development - with around 40% of its revenue allocated to R&D activities.
BEST PRACTICES RESEARCH
© Frost & Sullivan 2017 7 “We Accelerate Growth”
In the APM market, ManageEngine addresses customers’ unmet needs with acute efficiency.
Enterprise customers are seeking solutions that can promptly assist in troubleshooting and
identifying network areas requiring adjustments. Rightly identifying this challenge, ManageEngine
used its technological expertise to develop an intuitive APM platform with superior ease-of-use. In
complex environments, users can easily obtain actionable performance metrics in a few minutes of
operation.
In addition, ManageEngine has implemented the concept of the Apdex score formulated by the
Apdex Alliance to reflect the user experience and transaction level. The Apdex score (on a scale
from 0 to 1) converts into an index over a period of time and shows user satisfaction and perception
of the Web application based on the application responsiveness. The score has different categories
such as “satisfied,” “tolerating” and “frustrated.” With this platform, users can measure customer
satisfaction and identify if the user experience is optimal, offering customers a superior experience.
Conclusion
ManageEngine’s Applications Manager and Site24x7 provide customers with an end-to-end
application management solution that covers every aspect of infrastructure management at an
unbeatable price and performance in the APM market. Facing the imperative need to scale up
operations for transmitting huge data traffic loads, enterprises have chosen ManageEngine’s APM
platform; it accurately and smartly monitors at the browser level to determine the application
performance as perceived by end users.
With its strong overall price performance, ManageEngine has earned the 2016 Frost & Sullivan
Global Price/Performance Value Leadership Award.
BEST PRACTICES RESEARCH
© Frost & Sullivan 2017 8 “We Accelerate Growth”
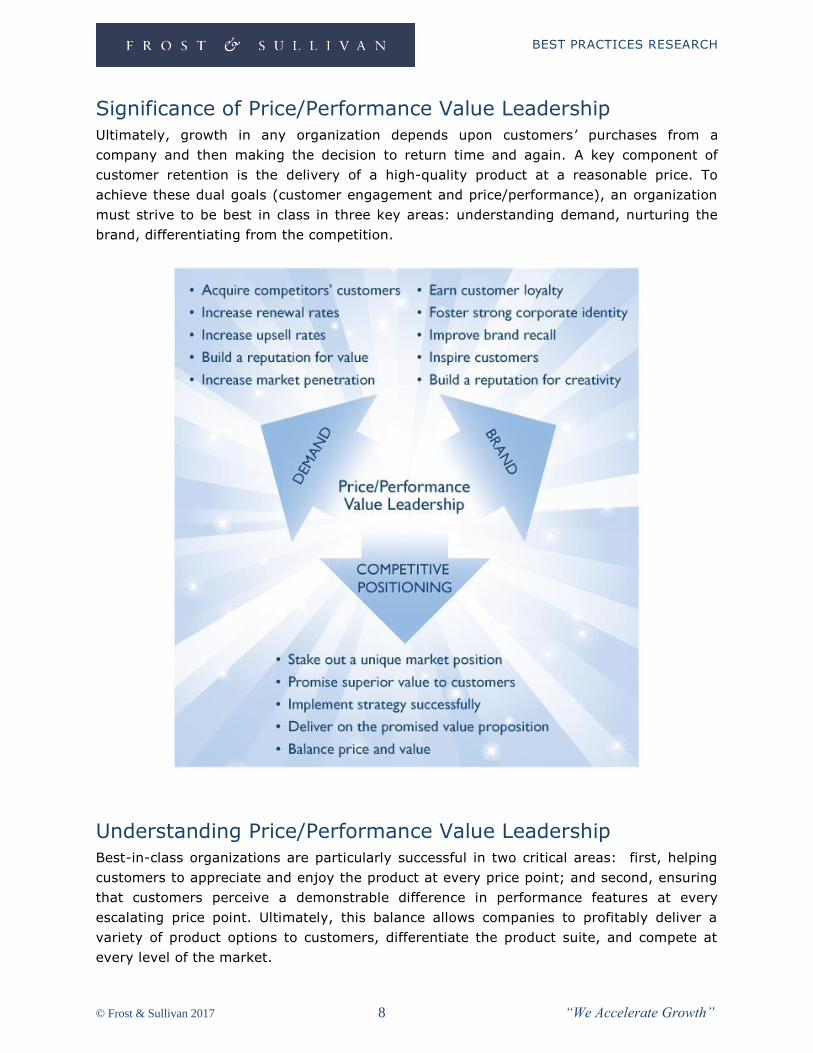
Significance of Price/Performance Value Leadership
Ultimately, growth in any organization depends upon customers’ purchases from a
company and then making the decision to return time and again. A key component of
customer retention is the delivery of a high-quality product at a reasonable price. To
achieve these dual goals (customer engagement and price/performance), an organization
must strive to be best in class in three key areas: understanding demand, nurturing the
brand, differentiating from the competition.
Understanding Price/Performance Value Leadership
Best-in-class organizations are particularly successful in two critical areas: first, helping
customers to appreciate and enjoy the product at every price point; and second, ensuring
that customers perceive a demonstrable difference in performance features at every
escalating price point. Ultimately, this balance allows companies to profitably deliver a
variety of product options to customers, differentiate the product suite, and compete at
every level of the market.
BEST PRACTICES RESEARCH
© Frost & Sullivan 2017 9 “We Accelerate Growth”
Key Benchmarking Criteria
For the Global Price/Performance Value Leadership Award, Frost & Sullivan analysts
independently evaluated two key factors—Price/Performance Attributes and Customer
Impact—according to the criteria identified below.
Price/Performance Attributes
Criterion 1: Functionality
Criterion 2: Ease of Use
Criterion 3: Product/Service Quality
Criterion 4: Performance Reliability
Criterion 5: Prioritization of Features
Customer Impact
Criterion 1: Perceived Value
Criterion 2: Customer Purchase Experience
Criterion 3: Customer Ownership Experience
Criterion 4: Customer Service Experience
Criterion 5: Brand Equity
Best Practice Award Analysis for ManageEngine
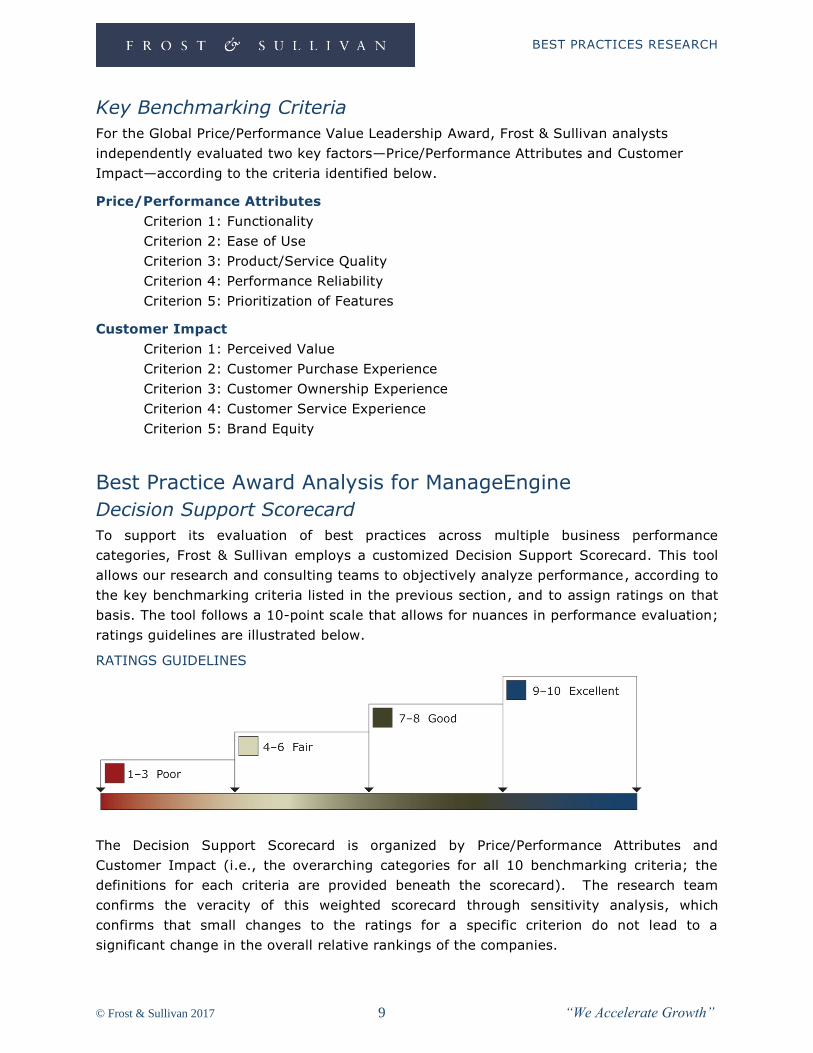
Decision Support Scorecard
To support its evaluation of best practices across multiple business performance
categories, Frost & Sullivan employs a customized Decision Support Scorecard. This tool
allows our research and consulting teams to objectively analyze performance, according to
the key benchmarking criteria listed in the previous section, and to assign ratings on that
basis. The tool follows a 10-point scale that allows for nuances in performance evaluation;
ratings guidelines are illustrated below.
RATINGS GUIDELINES
The Decision Support Scorecard is organized by Price/Performance Attributes and
Customer Impact (i.e., the overarching categories for all 10 benchmarking criteria; the
definitions for each criteria are provided beneath the scorecard). The research team
confirms the veracity of this weighted scorecard through sensitivity analysis, which
confirms that small changes to the ratings for a specific criterion do not lead to a
significant change in the overall relative rankings of the companies.
BEST PRACTICES RESEARCH
© Frost & Sullivan 2017 10 “We Accelerate Growth”
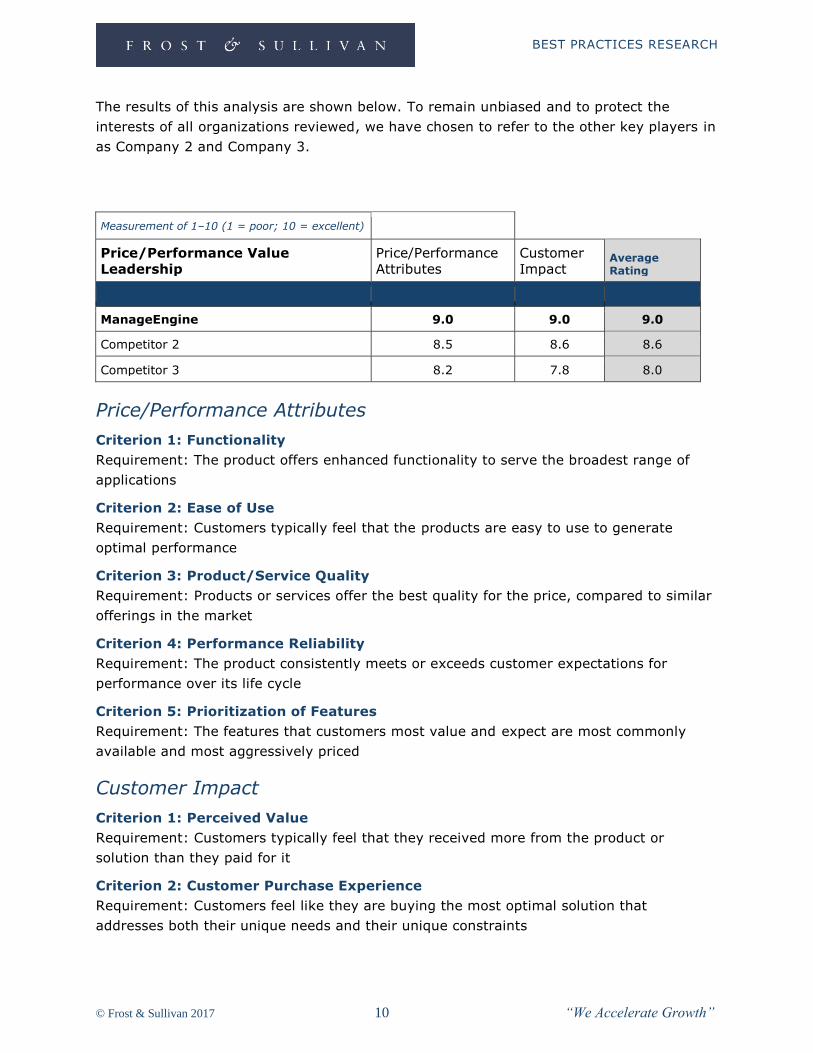
The results of this analysis are shown below. To remain unbiased and to protect the
interests of all organizations reviewed, we have chosen to refer to the other key players in
as Company 2 and Company 3.
Measurement of 1–10 (1 = poor; 10 = excellent)
Price/Performance Value
Leadership
Price/Performance
Attributes
Customer
Impact Average Rating
ManageEngine 9.0 9.0 9.0
Competitor 2 8.5 8.6 8.6
Competitor 3 8.2 7.8 8.0
Price/Performance Attributes
Criterion 1: Functionality
Requirement: The product offers enhanced functionality to serve the broadest range of
applications
Criterion 2: Ease of Use
Requirement: Customers typically feel that the products are easy to use to generate
optimal performance
Criterion 3: Product/Service Quality
Requirement: Products or services offer the best quality for the price, compared to similar
offerings in the market
Criterion 4: Performance Reliability
Requirement: The product consistently meets or exceeds customer expectations for
performance over its life cycle
Criterion 5: Prioritization of Features
Requirement: The features that customers most value and expect are most commonly
available and most aggressively priced
Customer Impact
Criterion 1: Perceived Value
Requirement: Customers typically feel that they received more from the product or
solution than they paid for it
Criterion 2: Customer Purchase Experience
Requirement: Customers feel like they are buying the most optimal solution that
addresses both their unique needs and their unique constraints
BEST PRACTICES RESEARCH
© Frost & Sullivan 2017 11 “We Accelerate Growth”
Criterion 3: Customer Ownership Experience
Requirement: Customers are proud to own the company’s product or service, and have a
positive experience throughout the life of the product or service
Criterion 4: Customer Service Experience
Requirement: Customer service is accessible, fast, stress-free, and of high quality
Criterion 5: Brand Equity
Requirement: Customers have a positive view of the brand and exhibit high brand loyalty
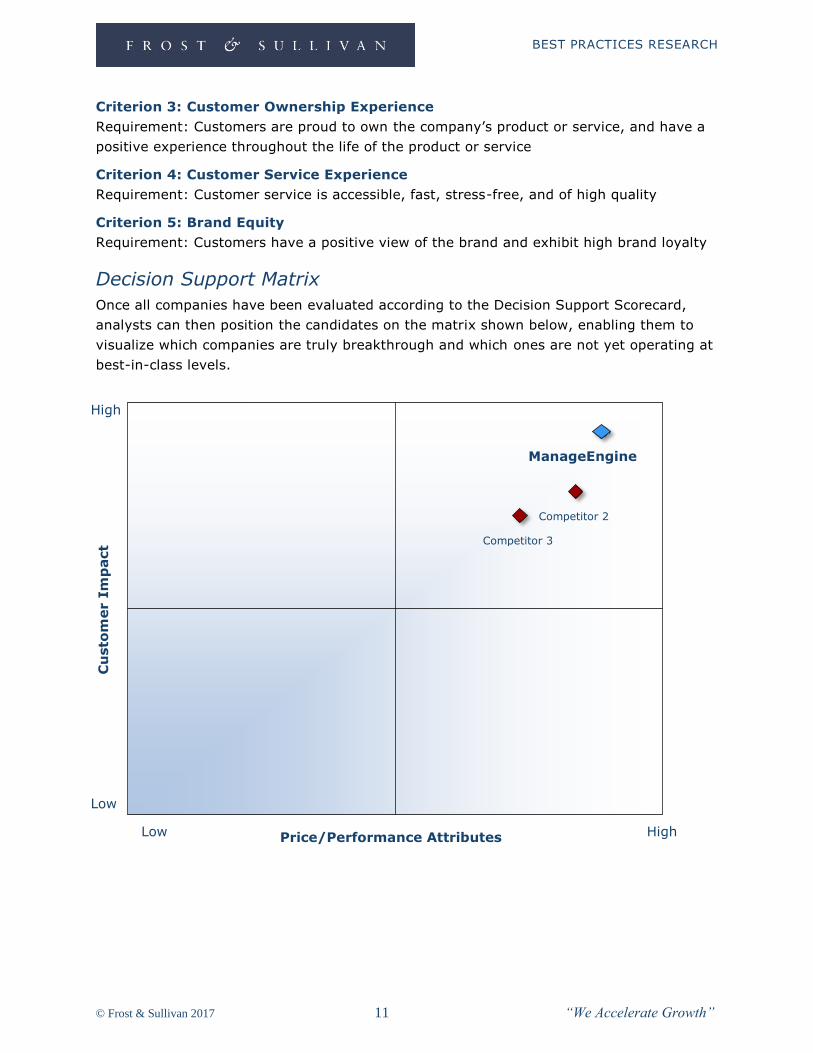
Decision Support Matrix
Once all companies have been evaluated according to the Decision Support Scorecard,
analysts can then position the candidates on the matrix shown below, enabling them to
visualize which companies are truly breakthrough and which ones are not yet operating at
best-in-class levels.
High
Low
Low High
Cu
sto
mer I
mp
act
Price/Performance Attributes
ManageEngine
Competitor 2
Competitor 3
BEST PRACTICES RESEARCH
© Frost & Sullivan 2017 12 “We Accelerate Growth”
The Intersection between 360-Degree Research and Best
Practices Awards
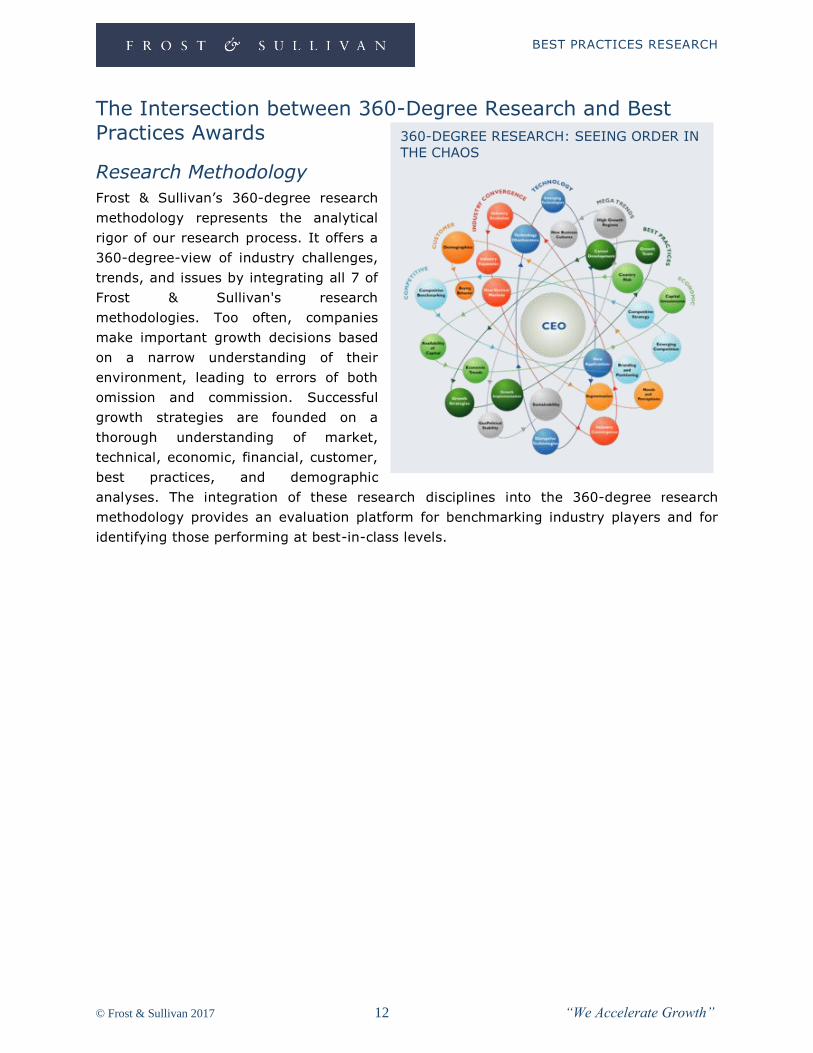
Research Methodology
Frost & Sullivan’s 360-degree research
methodology represents the analytical
rigor of our research process. It offers a
360-degree-view of industry challenges,
trends, and issues by integrating all 7 of
Frost & Sullivan's research
methodologies. Too often, companies
make important growth decisions based
on a narrow understanding of their
environment, leading to errors of both
omission and commission. Successful
growth strategies are founded on a
thorough understanding of market,
technical, economic, financial, customer,
best practices, and demographic
analyses. The integration of these research disciplines into the 360-degree research
methodology provides an evaluation platform for benchmarking industry players and for
identifying those performing at best-in-class levels.
360-DEGREE RESEARCH: SEEING ORDER IN
THE CHAOS
BEST PRACTICES RESEARCH
© Frost & Sullivan 2017 13 “We Accelerate Growth”
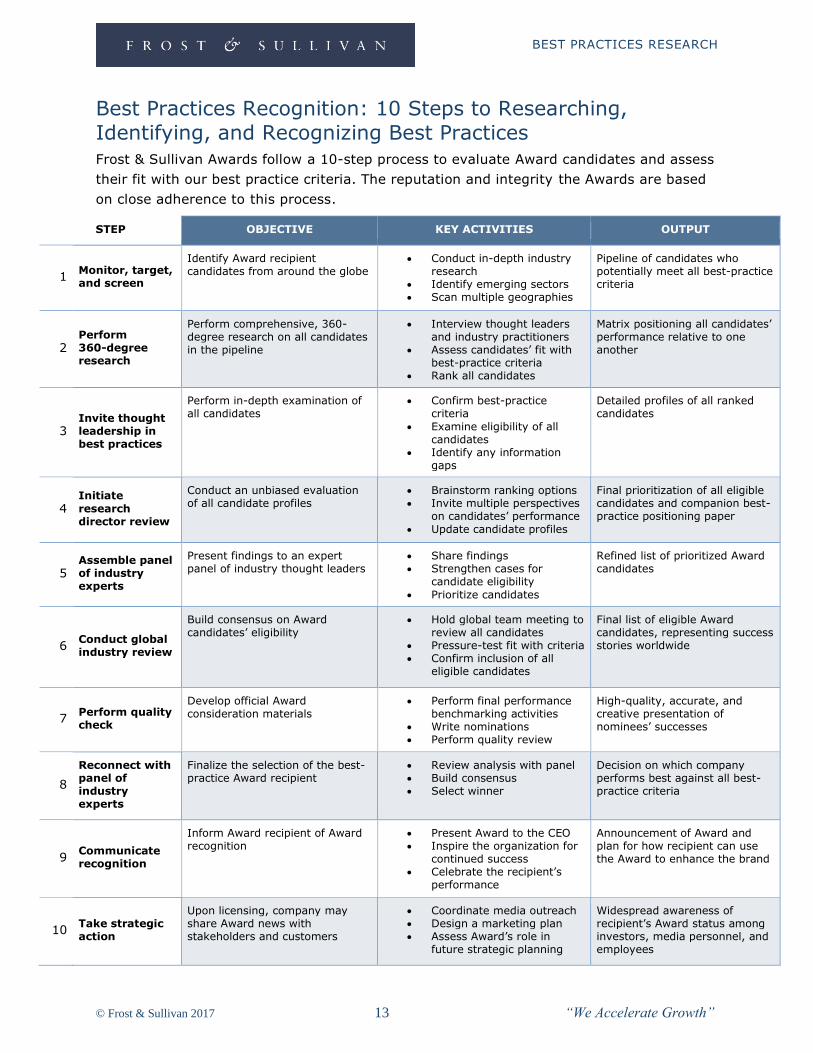
Best Practices Recognition: 10 Steps to Researching,
Identifying, and Recognizing Best Practices
Frost & Sullivan Awards follow a 10-step process to evaluate Award candidates and assess
their fit with our best practice criteria. The reputation and integrity the Awards are based
on close adherence to this process.
STEP OBJECTIVE KEY ACTIVITIES OUTPUT
1 Monitor, target, and screen
Identify Award recipient candidates from around the globe
Conduct in-depth industry research
Identify emerging sectors Scan multiple geographies
Pipeline of candidates who potentially meet all best-practice criteria
2 Perform 360-degree research
Perform comprehensive, 360-degree research on all candidates in the pipeline
Interview thought leaders and industry practitioners
Assess candidates’ fit with best-practice criteria
Rank all candidates
Matrix positioning all candidates’ performance relative to one another
3 Invite thought leadership in best practices
Perform in-depth examination of all candidates
Confirm best-practice criteria
Examine eligibility of all candidates
Identify any information gaps
Detailed profiles of all ranked candidates
4 Initiate
research director review
Conduct an unbiased evaluation of all candidate profiles
Brainstorm ranking options Invite multiple perspectives
on candidates’ performance
Update candidate profiles
Final prioritization of all eligible candidates and companion best-practice positioning paper
5 Assemble panel of industry experts
Present findings to an expert panel of industry thought leaders
Share findings Strengthen cases for
candidate eligibility
Prioritize candidates
Refined list of prioritized Award candidates
6 Conduct global industry review
Build consensus on Award candidates’ eligibility
Hold global team meeting to review all candidates
Pressure-test fit with criteria Confirm inclusion of all
eligible candidates
Final list of eligible Award candidates, representing success stories worldwide
7 Perform quality check
Develop official Award consideration materials
Perform final performance benchmarking activities
Write nominations Perform quality review
High-quality, accurate, and creative presentation of nominees’ successes
8
Reconnect with panel of industry experts
Finalize the selection of the best-practice Award recipient
Review analysis with panel Build consensus Select winner
Decision on which company performs best against all best-practice criteria
9 Communicate recognition
Inform Award recipient of Award recognition
Present Award to the CEO Inspire the organization for
continued success Celebrate the recipient’s
performance
Announcement of Award and plan for how recipient can use the Award to enhance the brand
10 Take strategic action
Upon licensing, company may share Award news with stakeholders and customers
Coordinate media outreach Design a marketing plan Assess Award’s role in
future strategic planning
Widespread awareness of recipient’s Award status among investors, media personnel, and employees
BEST PRACTICES RESEARCH
© Frost & Sullivan 2017 14 “We Accelerate Growth”
About Frost & Sullivan
Frost & Sullivan, the Growth Partnership Company, enables clients to accelerate growth
and achieve best in class positions in growth, innovation and leadership. The company's
Growth Partnership Service provides the CEO and the CEO's Growth Team with disciplined
research and best practice models to drive the generation, evaluation and implementation
of powerful growth strategies. Frost & Sullivan leverages almost 50 years of experience in
partnering with Global 1000 companies, emerging businesses and the investment
community from 31 offices on six continents. To join our Growth Partnership, please visit
http://www.frost.com.