2016 houston economic outlook
TRANSCRIPT

Houston
EconomicOutlook2016


HOUSTON MSA EMPLOYMENTJOBS GAINED
2015 15 ,2002014 104,7002013 89,900
HOUSTON UNEMPLOYMENTPERCENT (%)
07/2016 5.807/2015 5.007/2014 5.4
ENERGY: OIL & NATURAL GASWTI CRUDE OIL: PER BARREL
09/2016 $46.97 09/2015 $49.20 09/2014 $92.9209/2013 $108.67
NATURAL GAS: PER MMBtu
09/2016 $2.9709/2015 $2.6909/2014 $3.9309/2013 $3.64
IMPORT / EXPORT TRADEHAS AIR FREIGHT: IN THOUSANDS TONS
2015 441.62014 474.22013 439.72012 450.4
PHA TOTAL TONNAGE (short tons): IN MILLIONS TONS
2015 30.82014 30.32013 28.52012 29.1(Port stat ist ics exclude leased faci l i t ies)
HOUSTON MSA POPULATIONGROWTH (%)IN MILLIONS
2015 6.66 2.52014 6.50 2.72013 6.33 2.4
E X E C U T I V E S U M M A R Y
Houston ranked among the top-performing U.S. metros last year and has historically been a top 10 metro leading the nation in population and job growth. In March, Site Selection magazine ranked Houston 2nd, as a top metro for newand expanded corporate facilities. This ranking is a testiment to Houston’sstrong economic base and staying power even during an energy industry downturn. Since the dramatic fall of oil prices that occurred in late 2014, Houston’s economy has slowed signi�cantly and continues to grow at a lesser pace in 2016 than its’ average annual rate. Future growth forecasts have been revised downward, mostlydue to the impact of low oil prices. Fortunately, only one of three sectors of theenergy industry has been a�ected, con�ned to the “upstream” energy companieswho are focused on exploration and production. The “midstream” (transportation and storage) and “downstream” (re�ning and petro-chemical) sectors are not asnegatively impacted by low oil and gas prices and are projected to remain strong in the near term.As expected, a large majority of the jobs Houston lost over the last year are related to the energy sector; however, job growth in other industry sectors helped to balance the job losses in the manufacturing and mining sectors. In 2016, WalletHub ranked Houston as a top 10 metro for industry diversity and No. 8 large city for STEM professional jobs. With the world‘s largest medical center and top research facilities, the Houston healthcare industry is strong and is expected to remainso in the longterm.
Houston’s strategic location and core strengths, including an expanding healthcare sector, cutting-edge medical advancements, technological breakthroughs across industries, and strong import/export trade activity (No. 1 US port in foreigntonnage), uniquely position it to play a vital role in meeting national and globalmarket demands. Houston has and will continue to stand as a leader among U.S.metros and the world.
HOUSTON
HARRIS
WALLER
AUSTIN
CHAMBERS
LIBERTY
SANJACINTO
MONTGOMERY
FORT BEND
BRAZORIA
GALVESTON
HOUSTON, TEXASMETRO AREA DETAIL
HOUSTON’S PORT, NO.1 U.S. PORTIN FOREIGN TONNAGE
HOUSTONECONOMIC OUTLOOK 2016ECONOMIC OUTLOOK 2016

PAGE 4HOUSTON ECONOMIC OUTLOOK
Population Growth
2015 2 ,296,2242014 2 ,239,5582013 2 ,203,8062012 2 ,164,834
H O U S T O N P O P U L AT I O N
30 PHILLIPS 66 $87.257 SYSCO $48.790 CONOCO PHILLIPS $30.9104 ENTERPRISE PRODUCTS PARTNERS $27.0117 HALLIBURTON $23.6
H O U S T O N T O P 5 F O R T U N E 5 0 0
Houston ranks among the leading metropolitan areas in the U.S. and is the fourth largest city and the �fth largest Metropolitan Statistical Area (MSA) in the nation. Metro Houston area, which consists of 10 counties, grew by more than 159,000 people between July 2014 and July 2015, making it the fastest growing metropolitan region in the country last year. Despite the fall in oil prices, Metro Houston’s population gain remains solid.On a more long-term basis, demographers project strong population growth for the area over the next thirty years as domestic and international migration trends favor Houston’s geographical, cultural and economic strengths. According to the U.S. CensusBureau, Houston had a net gain of more than 55,666 new residents in 2015, compared to the 35,752 resident net gain in 2014. The median household income for the Houston-Sugar Land-Baytown metro area was $61,465 in 2015, up 2.2% from 2014.Houston’s 2015 median household income 10.4% higher than both the median Texas and U.S. household incomes.
Houston’s strong economic base continues to be a key factor driving both domestic and international migration trends, althoughHouston’s Fortune 500 rankings prove to be less impressive than last year, with three Houston companies falling o� the 2016 list. Houston still ranks 3rd among U.S. cities with the most Fortune 500 headquarters with twenty-four (24) companies on the 2016 list, following New York, with a total of sixty-eight (68) and Chicago with thirty-four (34). Phillips 66 ranked highest on the list again for Houston-based headquarters on the Fortune 500 list, however fell from its No.7 ranking with $149.4 billion in revenue to a No.30 ranking with $87.2 billion, a drastic 41.6% decrease in revenue. Statewide, Texas was the No. 2 ranking state with�fty-four (54) companies on the list, just one company less than New York with �fty-�ve (55). All but three of Houston’s twenty-four (24) companies on the Fortune 500 list are in the energy industry, and the weakened rankings of each company on the list go to show the negative e�ects of low oil prices on Houston energy companies. Houston area residents are well-educated, with the majority of the population over 25 years of age holding a high school diploma and residents with college/graduate educational studies outnumbering those with less than a high school education.This high level of educational achievement is not surprising given Houston’s numerous nationally recognized colleges and universities, as well as technical and trade schools, including Rice University, University of Houston, University of St. Thomas, Texas Southern University, Houston Baptist University, Baylor College of Medicine, San Jacinto College, Lone Star College, and Houston Community College. Rice University ranks in the No. 18 spot in U.S. News & World Reports National University Rankings 2016 guide to America’s best colleges, the only Texas college in the top 20.Bolstered by above-average demographic trends and a strong base of diverse industries, Houston is well-positioned to compete in today’s global markets. Long recognized as the energy capital of the world, with every major energy company represented locally, Houston now stands as a global example of economic diversity. The area is home to a thriving base of industries including medical/biomedical technology, global trade (particularly airborne and waterborne domestic/international cargo), aeronautics, plastics manufacturing, electronics, computers, software design and integrated power.
PAGE 2HOUSTON ECONOMIC OUTLOOK
REVENUECOMPANYNATIONAL RANK
AS OF JULY 1
in billions
Houston ranked 3rd among U.S. cities with the most Fortune 500 headquarters with twenty-four (24)companies on the 2016 list.
SOURCES: : U.S. Census Bureau, Greater Houston Partnership; Fortune Magazine

PAGE 5HOUSTON ECONOMIC OUTLOOK
Employment Sector
HOUSTON ECONOMIC OUTLOOK
Houston ranked 1st on Bankrate’s “Best Large Cities to Build Wealth”
and6th in CNBC’s “Metro 20: America’s
Best Places to Start a Business” (2016)
S E L E C T M A J O R A R E A
EMPLOYERS
SOURCES: U.S. Bureau of Labor Statistics
PAGE 3
EVENT: Oil prices fall beginning of Q4 2014
EVENT: Layoffs begin middle of Q1 2015
H O U S T O N M S A A N N U A L J O B G R O W T H
Houston’s employment sector is large and diverse, with over 2.9M non-farm payroll jobs reported in June 2016. In 2015, Houston only added 15,200 jobs, an annual growth of 0.5% which is one-fourth of the historical average annual by job growth, caused by the sudden drop in oil prices that occurred in late 2014. Looking forward in the short-term, Houston’s job market is expected to see lower than average growth in 2016. Local economists have recently revised employment forecasts downward from 21,000 to less than 15,000 for 2016. According to the U.S. Bureau of Labor Statistics, three of Houston’s super-sectors experienced annual losses of more than 10,000 jobs between June 2015 and June 2016. Professional and business services sector was down 15,500 jobs, the manufacturing sector was down 15,200 jobs and mining and logging were down 13,600 jobs. Fortunately Houston’s employment base has diversi�ed over the years and isn’t as heavily in�uenced by the energy industry as it was 20 years ago, thus there were some super-sectors that registered large annual job gains between June 2015 and June 2016 to counterbalance the losses in the energy industry. Those super-sectors include leisure and hospitality, which added 20,900 jobs, followed by the education and health sector which added 18,700 jobs and then by the government sector which added 8,200 jobs.
-150,000
-100,000
-50,000
0
50,000
100,000
150,000
2009 2010 2011 2012 2013 2014 2015 2016YTD
PAGE 6HOUSTON ECONOMIC OUTLOOK
Business ClimateHouston has long been recognized among the most competitive U.S. cities for corporate relocation and expansion activity. Houston ranked second among the nation’s top ten largest metro areas enriched by facility project investment from corporations in2015, according to Site Selection. In addition, Chief Executive Magazine (for the 12th straight year) named Texas the “2016 Best Statefor Business.” In addition to its diverse growth industries and educated/skilled workforce, a key factor underscoring Houston’sbusiness appeal is the fact that it is one of the least expensive major U.S. cities in which to conduct business. Signi�cant bene�tsinclude the absence of state or city income taxes, no state property tax, as well as an exceptionally low cost of living index.
HOUSTON ECONOMIC OUTLOOK
HOUSTON
SEATTLE
DENVER
LOS ANGELES
CHICAGO
MIAMI
NEW YORK
ATLANTA
As a major transportation hub with two major airports, a world-renowned port, and superior rail and road infrastructure, Houston facilitates the interconnection of global business locations. Business alliances with major U.S. and international markets is further enhanced by the presence of 91 foreign consulate o�ces in Houston. As of March 2016, Houston still ranks third in the U.S. – following New York and Los Angeles – in foreign consulate representation. Houston’s ability to foster continued expansion in future-growth industries responsible for generating high quality, well-paid jobs across all business sectors has placed it in the top tier among U.S. cities. With its numerous business advantages, Houston is well-positioned to successfully compete in today’s global marketplace.
Atlanta 793 miles 2.5 66 13
Chicago 1,090 miles 2.5 86 18
Denver 1,119 miles 2.5 60 17
Los Angeles 1,550 miles 3.5 90 24
Miami 1,188 miles 2.5 NA 20
New York 1,631 miles 2.5 NA 20
Seattle 2,443 miles 5.0 60 36
T R AV E L T I M E F R O M H O U S T O N
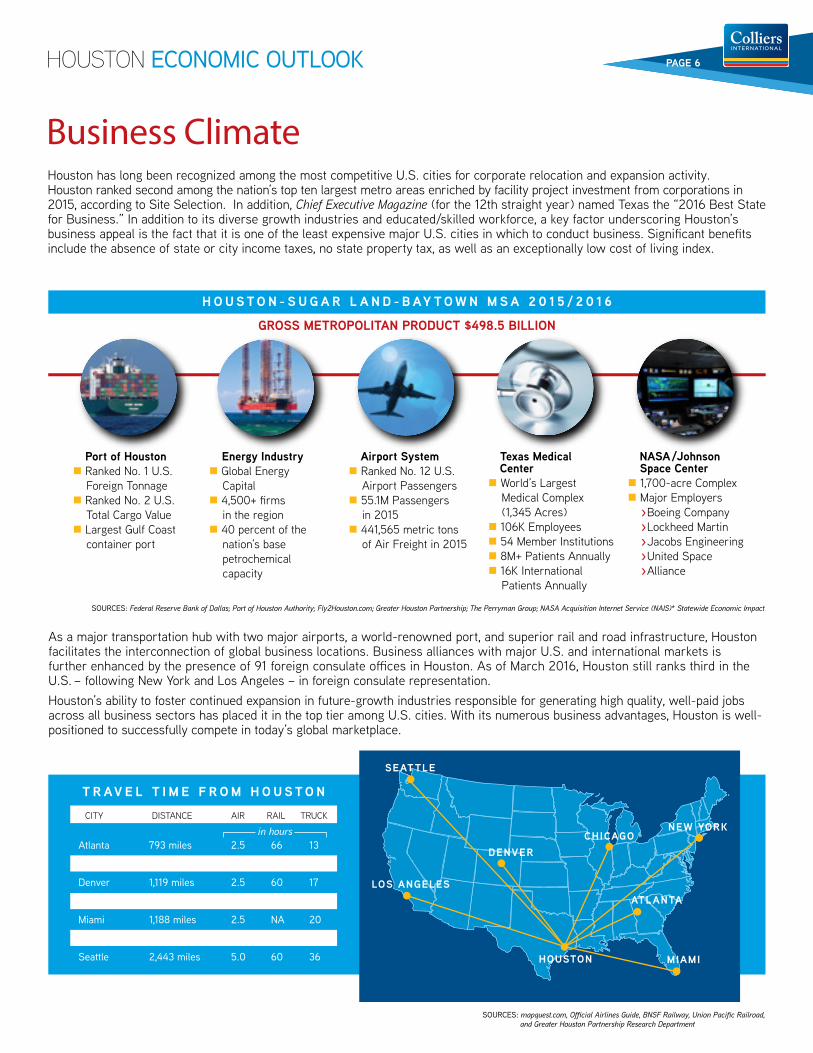
H O U S T O N - S U G A R L A N D - B AY T O W N M S A 2 0 1 5 / 2 0 1 6
GROSS METROPOLITAN PRODUCT $498.5 BILLION
TRUCKRAILAIRDISTANCECITY
in hours
SOURCES: mapquest.com, O cial Airlines Guide, BNSF Railway, Union Paci�c Railroad, and Greater Houston Partnership Research Department
Port of Houston Ranked No. 1 U.S. Foreign Tonnage Ranked No. 2 U.S. Total Cargo Value Largest Gulf Coast container port
Energy Industry Global Energy Capital 4,500+ �rms in the region 40 percent of the nation’s base petrochemical capacity
Airport System Ranked No. 12 U.S. Airport Passengers 55.1M Passengers in 2015 441,565 metric tons of Air Freight in 2015
Texas Medical Center World’s Largest Medical Complex (1,345 Acres) 106K Employees 54 Member Institutions 8M+ Patients Annually 16K International Patients Annually
NASA / Johnson Space Center 1,700-acre Complex Major Employers >Boeing Company >Lockheed Martin >Jacobs Engineering >United Space >Alliance
SOURCES: Federal Reserve Bank of Dallas; Port of Houston Authority; Fly2Houston.com; Greater Houston Partnership; The Perryman Group; NASA Acquisition Internet Service (NAIS)* Statewide Economic Impact
PAGE 4

PAGE 7HOUSTON ECONOMIC OUTLOOK
Global Energy CapitalHouston is internationally recognized as the global energy capital, with virtually every segment of the energy industry represented in the region. It is also known as the global center for integrated power, a fast-growing new sector of the energy industry. In justover a decade, the number of Houston-based energy trading companies has tripled, with petrochemical capacity in the area nearlyfour times larger than the nearest competing U.S. site. All major oil and gas companies have extensive operations in the area,including ExxonMobil, Chevron, BP America, Citgo, ConocoPhillips, Shell Oil Company, BHP Billiton, El Paso Corp., TOTAL, BG Group,LyondellBasell, Halliburton, Occidental Petroleum, Petrobras, Marathon Oil, Anadarko Petroleum, Transocean, Apache, Hess Corporation, New�eld Exploration, Enterprise Products Partners and Plains All American Pipeline.
HOUSTON ECONOMIC OUTLOOK$/
bbl
SOURCES: Energy Information Administration; West Texas Intermediate; Baker Hughes; BP
H I S T O R I C C R U D E O I L P R I C E S
$0
$20
$40
$60
$80
$100
$120
$140
Rig
Cou
nt
1998
2000
2002
2004
2006
2008
2010
2012
2014
2016
U . S . R O TA R Y R I G C O U N T S
$0
700
900
1100
1300
1500
1700
1900
2100
$/M
MB
tu
H I S T O R I C N AT U R A L G A S P R I C E S
$0
$2
$4
$6
$8
$10
$12 Sept 2016: $2.97/MMBtuSept 2005: $13.46/MMBtu
According to Enerdata’s 2015 Global Energy Trends, global energy consumption growth slowed in 2015. According to the study, global primary energy consumptionincreased by 0.5% in 2015, a decrease from the 1.1% in2014, and below the 10-year average of 2.1%. Oil remainsthe world’s leading fuel, at 32.9% of global energy consumption, increasing by 1.9% over the year. Naturalgas’s share of global primary energy consumption is 23.8%. World natural gas consumption grew by 1.7% in2015, below the 10-year historical average of 2.3%.Coal consumption fell by 1.8% in 2015, with a share of29.2%, the lowest share since 2005.
The U.S. Energy Information Administration’s (EIA) Annual Energy Outlook released in May 2016 indicates overall U.S. energy consumption will grow at an average annual rate of 0.3% through 2040. West Texas Intermediate crudeoil prices decreased from $49.20 per barrel in September2015 to $46.97 per barrel in September 2016, and the EIA predicts the price to rise to $50.58 per barrel in 2017.The Henry Hub natural gas prices are projected to remainrelatiely �at over the next year with an average $2.95 perMMBtu in 2017.The U.S. rotary rig count decreased annually by 57.9% to 497 rigs in September 2016, from 859 in September 2015, mostly due to the price of oil decreasing below pro�tability margins.
PAGE 5
1998
2000
2002
2004
2006
2008
2010
2012
2014
2016
1998
2000
2002
2004
2006
2008
2010
2012
2014
2016
$ 14
Sept 2016: 497 Sept 2008: 2,014
Sept 2016: $46.97/bblSept 2008: $111.12/bbl

PAGE 8HOUSTON ECONOMIC OUTLOOK
Petrochemical & Plastics Industry
Air L iquide USAAir ProductsBaker Petrol i te Corporat ionBASF Corporat ionBayer Mater ia l ScienceBP Texas Ci tyCelaneseChevron Phi l l ips ChemicalDow Chemical CompanyE. I . du Pont de Nemours CompanyExxonMobi l ChemicalGoodyear Tire & Rubber CompanyINEOS Ole�ns & PolymersLyondel lBasel l Industr iesLubrizol Corporat ionMarathon PetroleumOxyVinyls , LPRohm and Hass TexasShel l ChemicalSolvay Chemicals , IncTota l Petrochemicals USAValero Re�ning Co
M A J O R H O U S T O N R E G I O NC H E M I C A L P L A N T S
Texas is the largest chemical-producing state, generating $145 billion in annual revenue. Houston is a global leader in manufacturing petrochemicals, with the Houston Ship Channel recognized as the largest petrochemical complex in the U.S. The Houston-SugarLand-Baytown region operates the largest petrochemical plants, including; Bayport Industrial District, Battleground Industrial Complex, Bayport Shipping Terminal and the Houston Ship Channel.
Today, the chemical industry employs more than 100,000 workers directly and another 500,000+ related jobs in Texas, and abouthalf of those jobs are in the Houston region. In 2015, Texas led the nation in crude oil production, with 27 petroleum re�neries producing over 5.1 million barrels of crude oil per day, 29% of total U.S. re�ning capacity. Houston accounts for over 42% of the nation’s base petrochemical capacity.
Texas leads the nation in fossil fuel reserves and is the nation’s leading natural gas producer, accounting for approximately three-tenths of total U.S. natural gas production.
According to the Port of Houston Authority, the development of shale oil and gas increased the demand for container shipping and will increase future exports of plastics and chemicals.
HOUSTON ECONOMIC OUTLOOK
SOURCES: Energy Information Administration; Greater Houston Partnership SOURCES: Oil & Gas Journal; Houston Business Journal; Houston Chronicle
EXPANSIONS, ACQUISITIONS & NEW INVESTMENTS
Sep 2016 Alabama-based Techline Manufacturing expands to Houston
Sep 2016 Enbridge becomes largest North American energy infra- structure company with $28 billion Spectra Energy acquisition
Sep 2016 EOG Resources acquires Yates Petroleum for $2.5 billion
Aug 2016 European energy tech company Hive to open U.S. head- quarters in Houston
May 2016 Halliburton and Baker Huges’ $35 billion merger is dead
May 2016 Oil service companies FMC Technologies and Technip announce $13 billion merger
Apr 2016 Chevron looking for buyer for $1.3 billion in non-core assets
Apr 2016 $37.7 billion Energy Transfer equity merger sours
Mar 2016 TransCanada to acquire Houston-based Columbia Pipeline Group Inc. in $13 billion deal
Mar 2016 Schlumberger Clears Final Hurdle in $14.8 billion Cameron merger
Feb 2016 Oil and Gas M&A down in 2015, but deals are in sight
Feb 2016 Shell announces successful completion of BG merger
Dec 2016 Repsol, Statoil announce asset swap involving Eagle Ford
Nov 2016 Apache Corp. rejects Anadarkos’ $18 billion takeover bid
Sep 2015 Energy Transfer �nally locks down deal for Willaims Company at $37.7 billion
E N E R G Y I N D U S T R Y
PAGE 6
PAGE 9HOUSTON ECONOMIC OUTLOOK
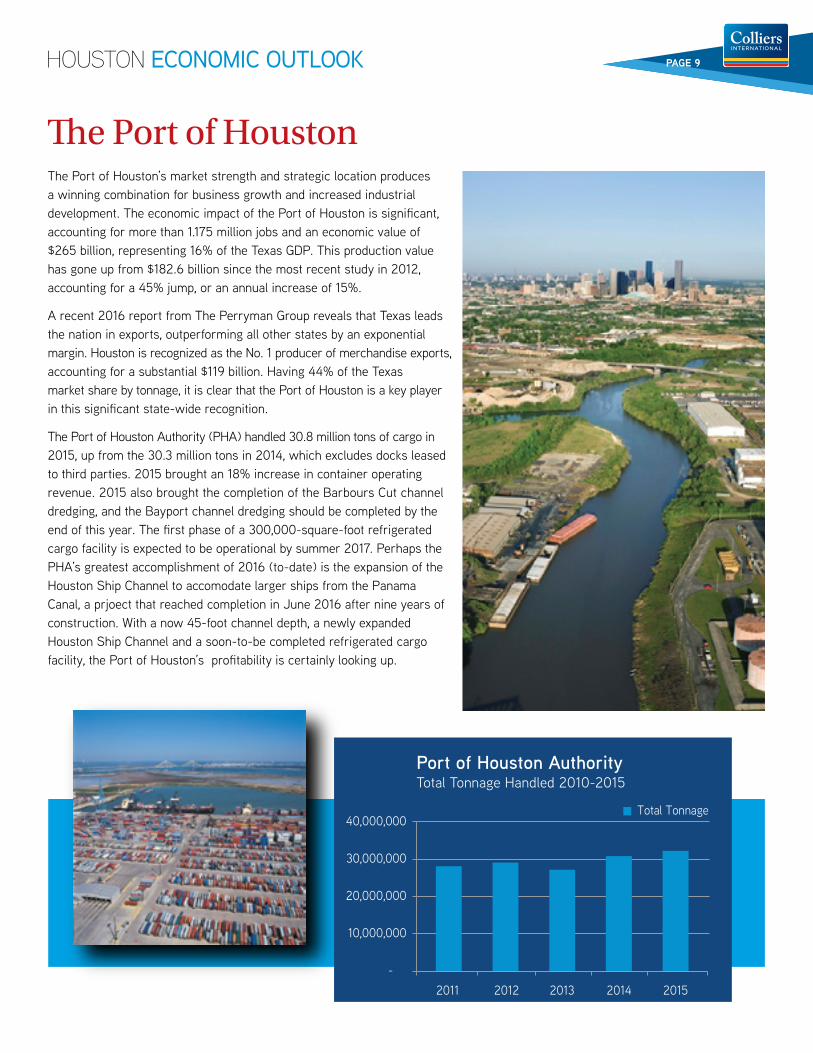
�e Port of HoustonThe Port of Houston’s market strength and strategic location producesa winning combination for business growth and increased industrial development. The economic impact of the Port of Houston is signi�cant, accounting for more than 1.175 million jobs and an economic value of $265 billion, representing 16% of the Texas GDP. This production valuehas gone up from $182.6 billion since the most recent study in 2012, accounting for a 45% jump, or an annual increase of 15%.
A recent 2016 report from The Perryman Group reveals that Texas leadsthe nation in exports, outperforming all other states by an exponential margin. Houston is recognized as the No. 1 producer of merchandise exports, accounting for a substantial $119 billion. Having 44% of the Texas market share by tonnage, it is clear that the Port of Houston is a key player in this signi�cant state-wide recognition.
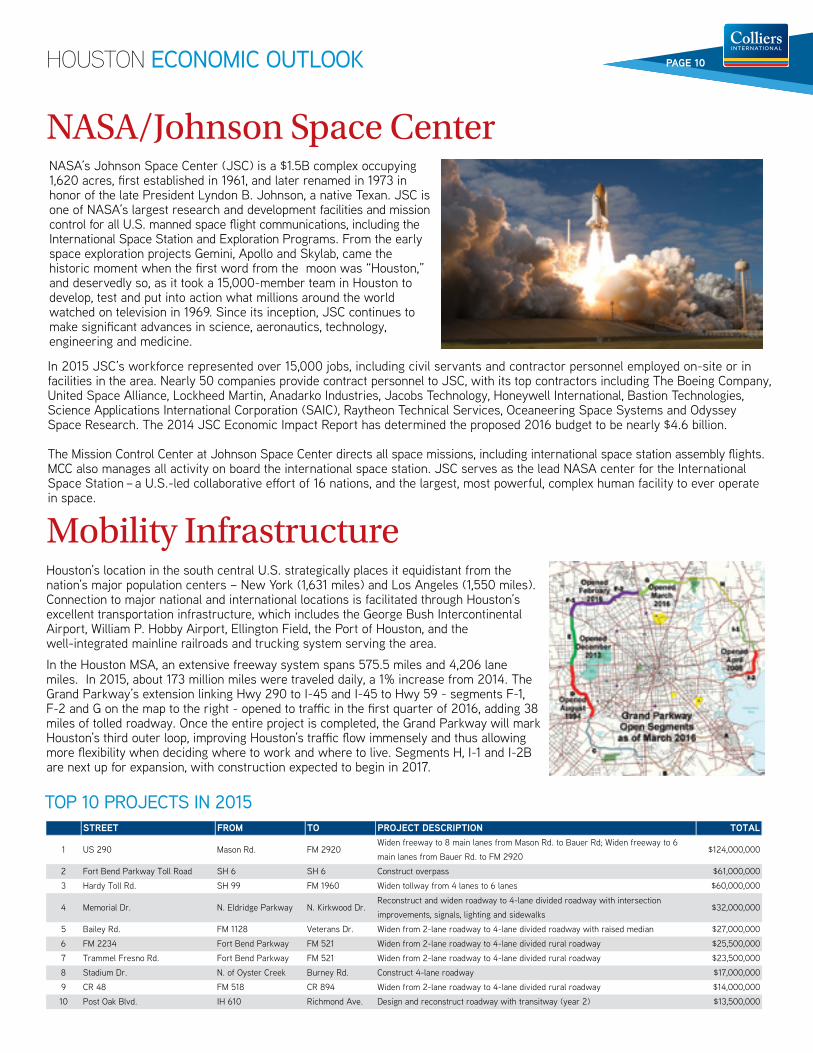
The Port of Houston Authority (PHA) handled 30.8 million tons of cargo in2015, up from the 30.3 million tons in 2014, which excludes docks leasedto third parties. 2015 brought an 18% increase in container operating revenue. 2015 also brought the completion of the Barbours Cut channeldredging, and the Bayport channel dredging should be completed by theend of this year. The �rst phase of a 300,000-square-foot refrigeratedcargo facility is expected to be operational by summer 2017. Perhaps thePHA’s greatest accomplishment of 2016 (to-date) is the expansion of theHouston Ship Channel to accomodate larger ships from the Panama Canal, a prjoect that reached completion in June 2016 after nine years of construction. With a now 45-foot channel depth, a newly expandedHouston Ship Channel and a soon-to-be completed refrigerated cargofacility, the Port of Houston’s pro�tability is certainly looking up.
HOUSTON ECONOMIC OUTLOOK PAGE 7
-
10,000,000
20,000,000
30,000,000
40,000,000
2011 2012 2013 2014 2015
Total Tonnage
Port of Houston AuthorityTotal Tonnage Handled 2010-2015
PAGE 10HOUSTON ECONOMIC OUTLOOK
NASA/Johnson Space Center
In 2015 JSC’s workforce represented over 15,000 jobs, including civil servants and contractor personnel employed on-site or infacilities in the area. Nearly 50 companies provide contract personnel to JSC, with its top contractors including The Boeing Company, United Space Alliance, Lockheed Martin, Anadarko Industries, Jacobs Technology, Honeywell International, Bastion Technologies, Science Applications International Corporation (SAIC), Raytheon Technical Services, Oceaneering Space Systems and OdysseySpace Research. The 2014 JSC Economic Impact Report has determined the proposed 2016 budget to be nearly $4.6 billion.
The Mission Control Center at Johnson Space Center directs all space missions, including international space station assembly �ights.MCC also manages all activity on board the international space station. JSC serves as the lead NASA center for the InternationalSpace Station – a U.S.-led collaborative e�ort of 16 nations, and the largest, most powerful, complex human facility to ever operatein space.
Mobility Infrastructure
HOUSTON ECONOMIC OUTLOOK
2 0 3 5 R T P C A P I TA L P R I O R I T I E S
PAGE 8
Houston’s location in the south central U.S. strategically places it equidistant from the nation’s major population centers – New York (1,631 miles) and Los Angeles (1,550 miles). Connection to major national and international locations is facilitated through Houston’s excellent transportation infrastructure, which includes the George Bush Intercontinental Airport, William P. Hobby Airport, Ellington Field, the Port of Houston, and the well-integrated mainline railroads and trucking system serving the area.
In the Houston MSA, an extensive freeway system spans 575.5 miles and 4,206 lane miles. In 2015, about 173 million miles were traveled daily, a 1% increase from 2014. The Grand Parkway’s extension linking Hwy 290 to I-45 and I-45 to Hwy 59 - segments F-1, F-2 and G on the map to the right - opened to tra¡c in the ¢rst quarter of 2016, adding 38 miles of tolled roadway. Once the entire project is completed, the Grand Parkway will mark Houston’s third outer loop, improving Houston’s tra¡c �ow immensely and thus allowing more �exibility when deciding where to work and where to live. Segments H, I-1 and I-2B are next up for expansion, with construction expected to begin in 2017.
TOP 10 PROJECTS IN 2015
NASA’s Johnson Space Center (JSC) is a $1.5B complex occupying 1,620 acres, ¢rst established in 1961, and later renamed in 1973 in honor of the late President Lyndon B. Johnson, a native Texan. JSC is one of NASA’s largest research and development facilities and mission control for all U.S. manned space �ight communications, including the International Space Station and Exploration Programs. From the early space exploration projects Gemini, Apollo and Skylab, came the historic moment when the ¢rst word from the moon was “Houston,” and deservedly so, as it took a 15,000-member team in Houston to develop, test and put into action what millions around the world watched on television in 1969. Since its inception, JSC continues to make signi¢cant advances in science, aeronautics, technology, engineering and medicine.
STREET FROM TO PROJECT DESCRIPTION TOTAL
1 US 290 Mason Rd. FM 2920Widen freeway to 8 main lanes from Mason Rd. to Bauer Rd; Widen freeway to 6 main lanes from Bauer Rd. to FM 2920
$124,000,000
2 Fort Bend Parkway Toll Road SH 6 SH 6 Construct overpass $61,000,000
3 Hardy Toll Rd. SH 99 FM 1960 Widen tollway from 4 lanes to 6 lanes $60,000,000
4 Memorial Dr. N. Eldridge Parkway N. Kirkwood Dr. Reconstruct and widen roadway to 4-lane divided roadway with intersection improvements, signals, lighting and sidewalks
$32,000,000
5 Bailey Rd. FM 1128 Veterans Dr. Widen from 2-lane roadway to 4-lane divided roadway with raised median $27,000,000
6 FM 2234 Fort Bend Parkway FM 521 Widen from 2-lane roadway to 4-lane divided rural roadway $25,500,000
7 Trammel Fresno Rd. Fort Bend Parkway FM 521 Widen from 2-lane roadway to 4-lane divided rural roadway $23,500,000
8 Stadium Dr. N. of Oyster Creek Burney Rd. Construct 4-lane roadway $17,000,000
9 CR 48 FM 518 CR 894 Widen from 2-lane roadway to 4-lane divided rural roadway $14,000,000
10 Post Oak Blvd. IH 610 Richmond Ave. Design and reconstruct roadway with transitway (year 2) $13,500,000

PAGE 11HOUSTON ECONOMIC OUTLOOK
Airport SystemThe Houston Airport System (HAS) is one of the world’s leading multi-airport facilities and includes George Bush Intercontinental Airport, William P. Hobby Airport and Ellington Field. HAS ranked 12th nationally in passenger volume in 2015, carrying an impressive 55.1 million passengers, its highest capacity to-date, and 441,565 metric tons of air freight, a 6.9% decreasefrom 2014. The Houston Airport System has a local economic impact of more than $27.5 billion annually.
GEORGE BUSH INTERCONTINENTAL AIRPORT/HOUSTON (IAH), situated twenty-three miles north of downtown Houston, is the nation’s 12th busiestairport serving 43 million passengers in 2015 and o�ering more than194 domestic and international destinations, with more than 700 daily departures, including non-stop direct �ights to major cities in Europe, Mexico, Latin America and Asia. IAH added Australasia as a new direct desination in 2015. IAH is served by 29 scheduled passenger airlines and numerouscharter airlines. The airport is served by 12 all-cargo airlines, whichhandled 429,785 metric tons of cargo in 2015, a slight decrease from the previous year. Currently, IAH has �ve terminals, no takeo� and landing curfews, and ample land to expand its facilities as requirements demand. The scope and quality of IAH facilities make it one of the top U.S. airports for international air cargo tra�c.
WILLIAM P. HOBBY AIRPORT (HOU) is located seven miles southeast of down-town Houston and is the nation’s 33rd busiest commercial airport, handling over 12 million passengers in 2015. Hobby Airport also serves asa major regional center for corporate and private aviation, with �ve passengerairlines o�ering scheduled service to approximately 40 U.S. destinations.There are 250 private aircraft based at Hobby, including 91 corporate jets and�ve �xed-base operators serving the airport. The new international terminalopened in October 2015 and had carried a signi�cant 145,000 passengers by the end of 2015, showing great promise for its future. The terminal features�ve gates and will o�er nonstop �ights to Costa Rica, Belize, Jamaica and Mexico.
ELLINGTON FIELD (EFD) is located 15 miles southeast of downtown Houston and supports the operations of the U.S. Coast Guard, Texas Air National Guard, Texas Army National Guard, NASA, and a varietyof general aviation tenants. In June 2015, the city of Houston was approved by the FAA to build and operate a licensed, commercial spaceport. The Houston Spaceport will be a launch site for space-craft and is now one of ten cities in the country holding an approved spaceport license by the FAA. It is currently in the development phase.
HOUSTON ECONOMIC OUTLOOK
SOURCES: Airport Council International; Houston Airport System
2013
2012
2011
2010
2009
2008
2007
2006
2005
A I R PA S S E N G E R SDOMESTIC & INTERNATIONAL
-
10,000.000
20,000,000
30,000,000
40,000,000
50,000,000
60,000,000International Domestic
IAH Air Freight Statistics & Trends IAH ranked 12th largest air cargo hub in the U.S.
IAH has 880,000 square feet of cargo area
with capacity to handle up to 454,000 tons
IAH 2015 air freight cargo exceeded 429,785 metric tons
IAH has state-of-the-art facilities to globally transport time-sensitive products
Houston’s role as a major gateway for import-export trade is expected to continue expanding with the new Panama Canal lock open
IAH is the 12th busiest U.S. airport, serving 43M passengers in 2015. Passenger tra�c grew 4.3% in 2015
PAGE 9
2014
Photo source: �y2houstonspaceport.com
2015
PAGE 12HOUSTON ECONOMIC OUTLOOK
Texas Medical Center
HOUSTON ECONOMIC OUTLOOK
T E X A S M E D I C A L C E N T E R
Member Institutions Baylor College of Medicine CHI St. Luke’s Health Children’s Memorial Hermann City of Houston Department of Health and Human Services Coleman HCC College for Health Services DePelchin Children’s Center Gulf Coast Regional Blood Center Harris Health System Health Science Center Texas A&M University Houston Academy of Medicine Houston Hospice Houston Methodist Institute for Spirituality and Health LifeGift MD Anderson Cancer Center - World’s largest cancer center Memorial Herm Menninger Clinic Michael E. Debakey High School for Health Professions Michael E. Debakey Veterans A�airs Medical Center Nora’s Home Prairie View A&M University Rice University Ronald McDonald House Houston Sabin Vaccine Institute Shriners Hospital for Children St. Dominic Village Texas Children’s Hospital - World’s largest children’s hospital Texas Heart Institute Texas Medical Center YMCA Texas Southern University Texas Women’s University John P. McGovern Museum of Health and Medical Science The Texas Medical Center Library Thermal Energy Corporation (TECO) TIRR Memorial Hermann University of Houston University of St. Thomas UT Health UTMB Health
The University of Texas M.D. Anderson Cancer Center in the Texas Medical Center, ranked #1 in U.S. News & World Reports “Americas Best Hospitals 2016-2017” for cancer care.
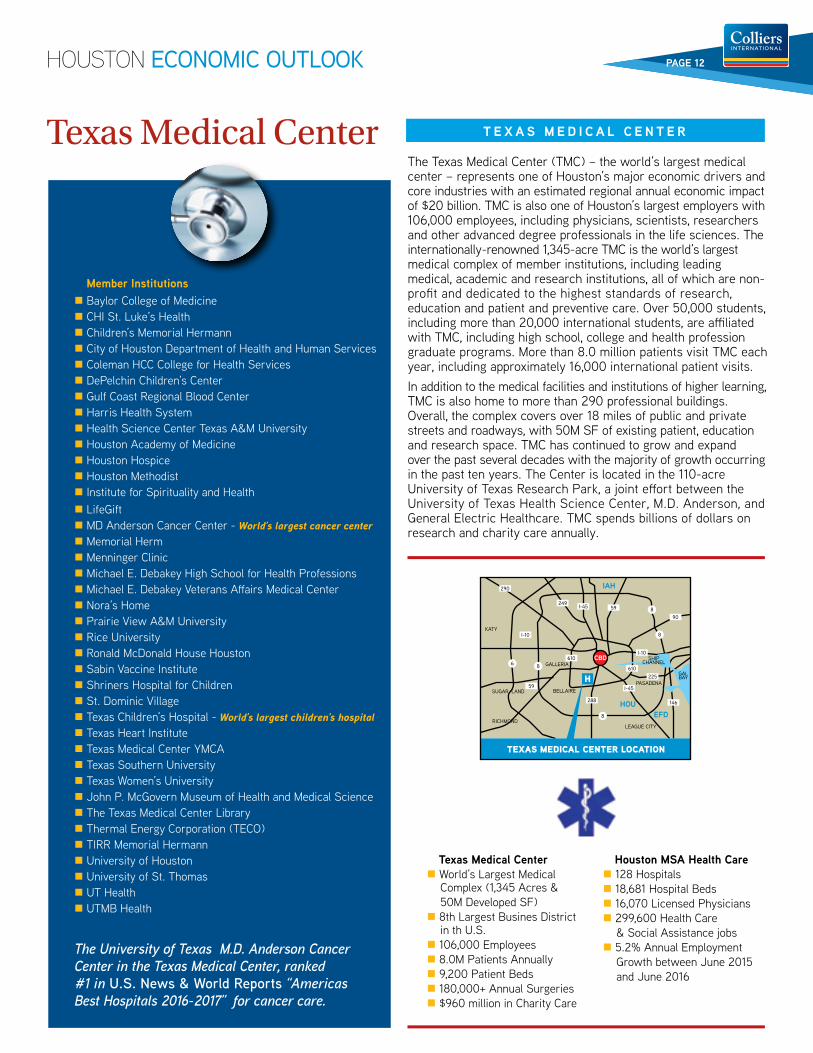
The Texas Medical Center (TMC) – the world’s largest medicalcenter – represents one of Houston’s major economic drivers and core industries with an estimated regional annual economic impactof $20 billion. TMC is also one of Houston’s largest employers with 106,000 employees, including physicians, scientists, researchersand other advanced degree professionals in the life sciences. Theinternationally-renowned 1,345-acre TMC is the world’s largest medical complex of member institutions, including leading medical, academic and research institutions, all of which are non-pro�t and dedicated to the highest standards of research, education and patient and preventive care. Over 50,000 students, including more than 20,000 international students, are a�liated with TMC, including high school, college and health profession graduate programs. More than 8.0 million patients visit TMC each year, including approximately 16,000 international patient visits. In addition to the medical facilities and institutions of higher learning, TMC is also home to more than 290 professional buildings. Overall, the complex covers over 18 miles of public and private streets and roadways, with 50M SF of existing patient, education and research space. TMC has continued to grow and expand over the past several decades with the majority of growth occurring in the past ten years. The Center is located in the 110-acre University of Texas Research Park, a joint e�ort between the University of Texas Health Science Center, M.D. Anderson, and General Electric Healthcare. TMC spends billions of dollars on research and charity care annually.
KATY
GALLERIA
BELLAIRE
RICHMOND
SUGAR LANDPASADENA
LEAGUE CITY
IAH
HOUEFD
CBD
H
610
290
249
90
59
59
610
288
225
146
I-45
I-45
I-10
I-10
8
8
8
8
SHIPCHANNEL
GALBAY
6
Texas Medical Center World’s Largest Medical Complex (1,345 Acres & 50M Developed SF) 8th Largest Busines District in th U.S. 106,000 Employees 8.0M Patients Annually 9,200 Patient Beds 180,000+ Annual Surgeries $960 million in Charity Care
Houston MSA Health Care 128 Hospitals 18,681 Hospital Beds 16,070 Licensed Physicians 299,600 Health Care & Social Assistance jobs 5.2% Annual Employment Growth between June 2015 and June 2016
TEXAS MEDICAL CENTER LOCATION
PAGE 10

PAGE 13HOUSTON ECONOMIC OUTLOOK
Biosciences & BiotechnologyBiotechnology and the life science industry continue to expand in the Houston region with more than 100 institutions and companies attracting over $2.2B in research and development funding annually. Between 2005 and 2015, the Texas Emerging Technology Fund (TET) allocated more than $205 million in funds to 145 early-stage companies and $127 million in grant matching and research superiority funds to Texasuniversities. In 2015, the TET was replaced with a new program called the Governor’s University ResearchInitiative and the TET Fund was relocated under the managment of the Texas Treasury Safekeeping TrustCompany. At that time, there were around 100 active companies still in the TET fund, 60 percent of which focus on life sciences. In 2016, the Governor’s University Research Inititive (GURI) grant program recruited tendistinguished researchers to lead cutting-edge research in Texas universities to spearhead new breakthroughsin science, technology, engineering, mathematics and medicine. The GURI grant awards total $34.3M withone-to-one matching grant commitments from each university. The state-funded Cancer Prevention and Research Institute of Texas (CPRIT) has invested $1.63 billion throughmore than 1,056 grants since 2010. CPRIT funding has attracted nearly 100 cancer researchers and their labs to Texas and prompted $910.8 million in follow-on investment in CPRIT-supported companies. Leading research e�orts in the area represent established and emerging industries, including nanotechnology, pharma-ceuticals, nutraceuticals, genetics/genomics, biodefense and infectious diseases, stem cell research and oncology.
Outside of the TMC, Black Forest Technology Park, located in The Woodlands (30 miles north of downtownHouston), is a long-standing major research center designed speci�cally for scienti�c, research and biotechnology companies. Other established business parks/organizations geared toward biotechnology commercialization in the Houston region include the Genesis Biotechnology Park and BioHouston, Inc. Genesis Biotechnology Park comprises 16 innovative life science companies and researchers located just south of the TMC. The Park was developed to increase venture capital interests in Houston and is committed to supporting start-up companies by providing tenant options for shared o�ce, wet laboratory space (including equipment) and �exible leases. BioHouston, Inc., a non-pro�t corporation founded by Houston-area academic/research institutions, is actively leading a broad-based e�ort to strengthen Houston’s position as a global competitor in life science and biotechnology. BioHouston’s Resource Center, the �rst incubator facility serving theHouston life sciences community, is housed at the Genesis Biotechnology Park, adding a key component to ongoing commercialization e�orts. The Center is speci�cally designed to serve start-up biotech and life sciences companies by o�ering access to shared laboratory space, research resources and networking opportunities with a community of biotech entrepreneurs. The BioScience Research Collaborative built by Rice University is an innovate space where scientists andeducators from Rice University and other TMC institutions work together to perform leading research thatbene�ts human medicine and health. Shortly after opening in 2010, the National Space Biomedical ResearchInstitute (NSBRI) and Baylor College of Medicine’s Center for Space Medicine joined the Collaborative. Funded by NASA in collaboration with Baylor College of Medicine, the NSBRI is studying and solving the health risks and problems related to long-duration space�ight.From its base of cutting-edge research, Houston has taken the next step in its evolution as a primary life science cluster by creating an environment conducive for private companies to develop and market life science products. With key initiatives in place to bring together the public and private sectors, as well as signi�cant improvements to the scope of services and incentives available to private companies, the infrastructure is in place to capitalize on Houston’s strong research base and convert it into commercialized product. With this process now in motion, the biotech future in Houston looks bright.
HOUSTON ECONOMIC OUTLOOK
B I O S C I E N C E S I N 2 0 1 6
AUG 2016 UTMB receives $8.2 million from CPRIT for cancer research and prevention. AUG 2016 Researchers at Houston Methodist have developed an arti�cial intelligence (AI) software that reliably interprets mammograms, assisting doctors with a quick and accurate prediction of breast cancer risk. JUN 2016 Game-changing medical innovation happening at Texas Medical Center. JUN 2016 Texas is growing into a national bioscience power. JUN 2016 UTHealth receives $1.3 million biosafety and infectious disease training grant. MAY 2016 UTMB scientists genetically engineered world’s �rst Zika virus infectious cDNA clone. MAY 2016 New cancer �ghters emerge from lab of Rice University. MAR 2016 Johnson & Johnson Chooses Houston For Next Start-Up Business Accelerator.
PAGE 11

ENTERPRISING CULTURE Colliers International Group Inc. is a global leader in commercial real estate services, with more than 16,000 professionals operating out of 554 offices in 66 countries. Colliers International delivers a full range of services to real estate occupiers, owners and investors worldwide, including global corporate solutions, brokerage, property and asset management, hotel investment sales and consulting, valuation, consulting and appraisal services, mortgage banking and insightful research. In 2015 the firm handled $112 billion in total transaction value for over 80,000 leases and sales. Colliers manages more than 2 billion square feet of commercial properties.
Colliers International Group Inc. generates more than US$2.5 billion in annual revenues. With significant insider ownership and an experienced management team, Colliers International has a long-term trackrecord of creating value and superior returns for shareholders – previously under the ownership of FirstService, and as of June 2015, continuously as an independently owned company. The common shares of Colliers International Group Inc. trade on the NASDAQ under the symbol “CIGI” and on the Toronto Stock Exchange under the symbol “CIG”. More information is available at www.colliers.com.
*Information herein has been obtained from sources deemed reliable, however its accuracy cannot be guaranteed


Lisa joined Colliers in 2010 as Director of Market Research bringing 26 years of commercial real estate experience to the �rm. Lisa initiates proactive market research projects to further the business goals of the company. She writes and prepares 27 market reports annually which include quarterly reports on Houston’s retail, o�ce, industrial and medical o�ce properties. Further, she prepares statistical ownership reports for various clients as well as an annual Houston Economic Overview. Lisa also creates PowerPoint market presentations, trade journal articles, and other marketing materials in supportof the company's business endeavors. She works with senior management in planning the company's marketing strategy and public relations support for local and national conferences, luncheon meetings, recruitment programs, and special events. Lisa works closely with the company's brokers to develop e�ective custom market research material speci�c to both existing and potential clients.
LISA R. BRIDGESDirector of Market Research | HoustonDirect +1 713 830 2125Fax +1 713 830 [email protected]
COLLIERS INTERNATIONAL
1233 W. Loop South
Suite 900
Houston, Texas 77027
Main +1 713 222 2111
Accelerating success.
HOUSTON ECONOMIC OUTLOOK
HANNAH TOSCH Marketing & Research Coordinator Direct +1 713 830 2129Fax +1 713 830 [email protected]