2016 journal of the asfmra economics of … · leaves 360 calves. ... 1000 pounds each, with an aue...
TRANSCRIPT

Economics of Transitioning from a Cow-Calf-Yearling Operation to a Stocker Operation
By Shane P. Ruff, Dannele E. Peck, Christopher T. Bastian,
and Walter E. Cook
One alternative to a traditional cow-calf-yearling operation is a stocker
operation, where weaned calves are purchased, and grazed as yearlings,
before being marketed to a feedlot. Potential reasons to switch from
cow-calf-yearlings to stockers-only might include a desire to avoid winter
feeding, eliminate calving, adapt more quickly to forage availability, or
reduce disease-risks associated with breeding cattle without exiting the
livestock industry entirely.
ABSTRACTOne alternative to a cow-calf-yearling
operation is a stocker operation. Relative
profitability of cow-calf-yearling versus
stockers is well documented. Little is
known, however, about the economics of
the transition process itself. We analyze
benefits, costs, and risks of switching
from cow-calf-yearling to stockers over
a one-year versus seven-year transition
period. Results show a gradual transition
is superior to an abrupt transition. A
gradual transition to stockers generates
more net present value than cow-
calf-yearlings, given a sufficiently high
discount rate or short planning horizon.
Farm managers and consultants should
include transition-period benefits
and costs when analyzing alternative
enterprises.
Shane P. Ruff is Extension Ag Economist, Kansas
Farm Management Association at Kansas State
University. Dannele E. Peck and Christopher T. Bastian
are Associate Professors with the Department of
Agricultural & Applied Economics at the University
of Wyoming. Walter E. Cook is a Clinical Associate
Professor in the Department of Veterinary Pathobiology
at Texas A&M University.
Acknowledgements: This research was funded by a grant from the Wyoming Livestock
Board. Additional funding was provided by the Lowham Research Fund. Opinions
expressed herein are those of the authors and not the funding organizations. The
authors declare they have no relevant or material financial interests that relate to the
research described in this paper.
2016 JOURNAL OF THE ASFMRA
55

2016 JOURNAL OF THE ASFMRA
56
One disease that may prompt an interest in switching
from cow-calf-yearlings to stockers is bovine brucellosis.
Brucella abortus is an infectious bacterium that causes
abortion in domestic and wild ungulates, as well as
undulant fever in humans. Brucellosis is endemic in wild
elk and bison in the Designated Surveillance Area (DSA)
of the Greater Yellowstone Area (GYA). Cattle typically
contract brucellosis by ingesting or inhaling infectious
materials, such as placenta, reproductive fluids, or
contaminated soil and forage, at a site where an infected
animal aborted or gave birth (Schumaker, Peck, and
Kauffman, 2012).
When a suspected case of brucellosis is detected in test-
eligible cattle, the herd is quarantined and tested until all
infected animals are found and culled. Any herds that have
shared a fence-line or comingled with the “index” herd
during the brucellosis risk-period are also quarantined
and tested. This regulatory response can lead to large
decreases in profits for affected producers, depending
on the timing and length of quarantine, availability
and cost of forage during quarantine, and number of
animals culled (Wilson, 2012). Thus cattle producers
in the GYA are searching for alternative management
strategies to reduce the risk and economic consequences
of brucellosis.
Because brucellosis is spread only by reproductively-
intact cattle, the risk of quarantine can be eliminated
by converting from cow-calf-yearlings to stockers only
(steers or spayed heifers). Such a conversion would
allow producers to remain engaged in the cattle industry,
thereby preserving their lifestyle, instead of transitioning
out of the industry entirely. Producers in the GYA have
expressed concern, however, about the profitability and
financial riskiness of stockers (personal communication,
Wyoming Brucellosis Coordination Team, April
12, 2012). They have also expressed concern about
liquidating breeding livestock within a single year. The
objectives of our research are therefore to: (1) quantify
the profitability and financial risk of a stocker operation,
relative to a cow-calf-yearling operation typical of the
GYA; and (2) compare the performance of a one-year
versus seven-year transition from cow-calf-yearlings to
stockers.
Roberts (2011) provides preliminary enterprise budgets
for a cow-calf-yearling operation and a stocker operation
representative of northwest Wyoming. His results
suggest that stockers are less profitable, on average, than
cow-calf-yearling. But his analysis does not consider the
actual process of transitioning to a stocker operation, or
the associated benefits and costs. Nor does he explore
the variability of profit across years due to fluctuating
prices. Anderson et al. (2004) found that stocker cattle in
the southeastern US generate higher returns than leasing
forage or grazing contracts, but those returns are more
variable. Nader et al. (2010) indicated a profit potential
for some stocker cattle systems in California, but not all.
The narrow margin between purchase and sale prices
(the buy-sell margin) is often a significant risk for stocker
operations.
Ritten et al. (2010) found that adding a yearling enterprise
to cow-calf operations – akin to a partial transition
towards stockers – improves profitability and reduces
income variability during periods of drought, compared
to purchasing additional feed or weaning calves early.
Similarly, Doye et al. (2013) concluded that producers
can use stockers to improve cash flow and reduce debt
requirements as they rebuild cow herds after drought-
induced liquidations. Overall, the literature suggests that

2016 JOURNAL OF THE ASFMRA
57
stocker enterprises may be profitable, but highly variable
across production practices and years.
One detail often overlooked in the literature, and perhaps
by farm managers and consultants as well, is that most
studies compare two production systems as if they
existed side-by-side, or could transform instantaneously
from one to the other. Researchers rarely consider the
economics of the transition process itself, which could
generate additional benefits and costs that are relevant
to decision-making. Our study’s unique contribution
is a detailed analysis of two different strategies for
transitioning from a cow-calf-yearling operation to a
stocker operation. The results can help cattle producers,
ranch managers, farm consultants, extension educators,
and policymakers better-understand the tradeoffs
involved with transitioning from cow-calf-yearlings to
stockers, either abruptly (within a single year) or gradually
(over seven years).
Methods
Enterprise budgets
First, we develop enterprise budgets for a baseline cow-
calf-yearling operation (see Ruff et al. 2014a), and a stand-
alone stocker operation (see Ruff et al. 2014b). These
budgets are an adaptation of Roberts (2011), augmented
with information from a producer-group interview
(Northwestern Wyoming Cattle Producers, 2013). Then
we model the process of transitioning from cow-calf-
yearlings to stockers under two different strategies: an
abrupt one-year transition versus a gradual seven-year
transition. For each transition strategy, we develop yearly
budgets that capture changes in production activities,
resource requirements, and associated revenues and
costs. Example changes during the transition include:
the number of cattle in different age-classes and types;
spaying of all heifer calves transferred into the yearling
operation; decreased labor requirements during calving
season; and increased fence maintenance.
Cow-calf-yearling operation
The baseline cow-calf-yearling budget has, at its peak, 480
breeding animals and 280 yearlings. At the time of spring
calving, there are 368 cows and 80 replacement heifers
for a total of 448 breeding animals. The ranch produces
368 calves, but assuming a 2 percent death loss, this
leaves 360 calves. All 180 steer calves are transferred to
the yearling enterprise in mid-November along with 100
heifer calves. The remaining 80 heifer calves are retained
in the cow-calf enterprise as replacement heifers.
Steer and heifer calves are transferred to the yearling
enterprise at 550 pounds and 500 pounds, respectively.
These incoming animals are fed hay throughout the
winter and spring, grazed on rangeland during the
summer, and fed for 10 days before being marketed in
September as long-yearlings, at roughly 18 months of
age.
To determine the number of head the operation can
support on summer grazing, we use an “animal unit
equivalent” (AUE). AUE is calculated using the metabolic
weight (in pounds) of livestock (Manske, 1998). It
provides a more accurate representation of livestock
forage consumption than the standard animal unit
(AU) calculation. AUE is calculated using the following
equation:
(1)
2016 JOURNAL OF THE ASFMRA
58
During summer grazing, there are: 235 adult cows (with
calves), weighing 1200 pounds each, with an AUE of
1.147 per cow; 62 three-year-old cows (with calves),
weighing 1200 pounds each, with an AUE of 1.147
per cow; 71 two-year-old cows (with calves), weighing
1000 pounds each, with an AUE of 1.0 per cow; and
80 replacement heifers, weighing 900 pounds each, with
an AUE of 0.924 per heifer. All cow-calf pairs and
replacement heifers require a total of 485.58 AUs for
summer grazing.
For the yearling enterprise within the cow-calf-yearling
operation, we assume steers go to grass at 700 pounds
and weigh 977 pounds by the end of the grazing season,
for an average grazing-season weight of 838.5 pounds.
Heifers go to grass at 650 pounds and weigh 927 pounds
by summer’s end, for an average grazing-season weight
of 788.5 pounds. Hence the AUE for steers is 0.876 and
0.837 for heifers. Native hay is assumed to be purchased,
either from the operation’s own hay enterprise or off-
farm, to support the herd from November 15 to April
15. Cattle sales for the operation occur in the fall, and
include yearlings and cull animals. Mean livestock prices
underlying this budget are reported in appendix 1. Ruff
et al. (2014a, table 3) provides a complete list of all prices
underlying the budget. Ruff (2013) provides full details
of the cow-calf-yearling operation.
Stocker operation
Alternatively, the operation’s existing forage-base is
assumed to be capable of supporting 969 steers (post-
transition); these steers are purchased May 1 weighing
600 pounds each. We assume a two percent death loss
on stockers throughout the grazing season. Thus, on
September 10, 950 steers are sold at 846 pounds, after
being fed for 10 days prior to marketing. We assume
stockers, in the absence of a cow-herd’s calming
presence, require extra labor when moving and handling.
Specifically, once the transition to a stocker operation
is complete, we assume twice as much labor is needed
during each livestock-management activity, compared to
the cow-calf-yearling operation. Additionally, we assume
fencing costs (repair and replacement) are triple those
of the cow-calf-yearling operation. These assumptions
are based on a producer-group interview (Northwestern
Wyoming Cattle Producers, 2013). Mean livestock prices
assumed in the stocker budget are reported in Appendix
1. Ruff et al. (2014b, Table 3) provides a complete list of
prices underlying the budget. Ruff (2013) provides full
details of the stocker operation.
Transition strategies
One way to transition to a stocker operation is to sell
all breeding cattle at the same time. For this abrupt
transition strategy, we assume the cow-calf-yearling herd
is liquidated in the fall, and replaced with stockers the
following spring. However, it could be difficult to locate
enough stocker calves in the surrounding area within
such a short period, in which case a producer may have
to purchase calves from long distances, incurring large
transportation costs.
A producer could address these challenges through two
adjustments to the transition strategy: 1) by transitioning
over several years, allowing enough time to seek out
reliable long-term suppliers of stocker calves; and 2)
timing the purchase and weight-class of stockers to take
advantage of calving trends in the surrounding area. For
example, most cow-calf operations in Wyoming calve in
the spring (Strauch, Peck, and Held, 2010), so a stocker
operation in northwest Wyoming searching for calves
to purchase in May should expect heavier-weight calves

2016 JOURNAL OF THE ASFMRA
59
(i.e., spring-born calves) to be more abundant at that time
than lighter-weight calves (i.e., fall-born calves). Keeping
these two features in mind – a gradual transition and
stocker-calf availability – we describe a 7-year transition
strategy in more detail below. Lastly, we quantify the two
transition strategies’ costs and benefits relative to the
cow-calf-yearling operation.
Under a 7-year transition strategy, a producer could
transition to stockers gradually by making use of their
cow-calf-yearling operation’s normal culling practices.
Each year in the study area, roughly 15 percent of any
given breeding herd is culled. These culled animals would
not be offset by the usual retention of heifer calves
chosen as future replacements. Instead, those heifer
calves would be spayed and transferred into the yearling
enterprise. As a result, the breeding herd would slowly
shrink, while the yearling herd would expand.
During the first few years of transition, the operation’s
cow-calf enterprise can supply almost enough calves to
the yearling enterprise to consume all AUEs freed-up
by culling. In year 1, only 10 calves must be purchased
off-farm to make full-use of the operation’s grazing
resources. We assume these off-farm calves are purchased
in the fall (the start of the production calendar for year
1), at the same weight as the operation’s own calves, so
they can be managed together. By year 4, more than half
of all calves are purchased off-farm because the breeding
herd is so small.
At the end of the year 6 production calendar–in early
November–the last of the breeding animals are sold, and
their calves are transferred to the yearling enterprise. This
leaves 887 yearlings to graze the following summer (in
year 7); 870 survive the grazing season, to be fed for 10
days before marketing on September 10 at 927 pound (for
spayed heifers) and 977 pounds (for steers). In year 8, the
operation becomes a full-fledged stocker operation – idle
during much of the winter before purchasing stocker-
calves (steers only) in May, at 600 pounds, grazing them
through the summer, and selling them in the fall at 846
pounds. The operation’s forage resources will support
969 of these steers; 950 will survive the grazing season,
to be fed for 10 days before marketing on September 10
(approaching the end of year 8). Full details are provided
in Ruff (2013).
This gradual, multi-year transition is designed specifically
to keep the operation’s production schedules as similar
to the base operation as possible, until year 8, when they
become a stand-alone, spring-purchased, 600-pound
stocker operation. This transition strategy addresses
some challenges that otherwise plague a single-year
strategy. It gradually phases-in labor and management
changes, and gives the producer time to locate reliable
long-term suppliers of stocker calves.
Net present value analysis
Given the different timeframes of the two transition
strategies (one year versus seven years), they should be
compared by estimating their net present value (NPV)
(Barry, et al., 2000, 249-343). This involves discounting a
strategy’s stream of revenues and costs through time to a
common period, before summing across all years to find
NPV, as described in equation (2).
(2)
Pn is the stream of net revenue (or more specifically,
returns over cash costs) experienced over n years; i
is the discount rate; and V is the salvage value (when
2016 JOURNAL OF THE ASFMRA
60
applicable). For the discount rate, we initially assume a
risk-free real interest rate of two percent, to be consistent
with a previous analysis by Roberts (2011). This enables
producers to directly compare “switching to stockers”
with other brucellosis management strategies described
in Roberts (2011).
Recognizing, however, that agricultural loans may be
subject to risk-premiums, and that some producers
place a higher value on the present than the future, we
experiment with a real discount rate of four percent. We
also tested a discount rate of six percent, but it generates
similar conclusions as a four percent discount rate. Thus,
for brevity, we report results only for discount rates of
zero, two, and four percent. A discount rate of zero
percent is included to show dollar values before any
adjustments for time-preferences are made.
We also calculate each strategy’s NPV over three different
planning horizons: 8, 20, and 30 years. Planning horizon
is relevant because the transition strategies are compared
against a baseline strategy, and this baseline might differ
for younger versus older producers. For example, a
younger producer’s baseline strategy might be to, “Run
cow-calf-yearlings until I retire in 30 years, when I will
liquidate the herd...decades from now.” In contrast, an
older producer’s baseline strategy might be to, “Run
cow-calf-yearlings until I retire in 8 years, when I will
liquidate the herd…just a few short years from now.”
Thus, a younger producer who considers the transition to
stockers faces a different decision context than an older
producer. For a younger producer, the transition would
involve liquidating their cow-calf-yearling herd decades
sooner than planned (dramatically changing the present-
value of the herd’s sale-proceeds) and running stockers
for decades thereafter (dramatically changing the flow
of net revenue through time for many years). For an
older producer, the transition would involve liquidating
their cow-calf-yearling herd just a few years earlier than
planned and running stockers only briefly before retiring.
Although both producers debate the same general
question – whether to transition to stockers or not –
the younger producer’s tradeoffs span a very different
timeframe than the older producer’s. Thus the benefits
and costs of transitioning, when discounted into present-
value terms, may be quite different. Furthermore, by
calculating NPV for three different planning horizons
– 8, 20, and 30 years – producers at different stages of
their career can relate directly to our findings without
extrapolation.
Risk analysis
Given the volatile nature of cattle prices (both at
purchase and sale), producers might be concerned not
only about average profit, but also year-to-year variation
in profit. We therefore use Monte Carlo simulation to
quantify and compare financial risk – due to random
variation in prices only – for the cow-calf-yearling and
stocker operations (Robert and Casella, 1999). The
simulation software, @Risk, is an add-in to Microsoft
Excel© (Palisade Corporation, 2013). It recalculates
returns over cash costs (ROCC) and net present value
(NPV) for a given cattle operation 10,000 times (i.e.,
over 10,000 iterations). Each iteration uses a different set
of prices to complete the calculations, which are drawn
randomly from pre-determined probability distributions.
By re-calculating ROCC and NPV 10,000 times for a
given cattle operation, we can report them as probability
distributions, rather than point-estimates. This allows us
to compare the two operation types and two transition
strategies not only in terms of averages, but also standard

2016 JOURNAL OF THE ASFMRA
61
deviation, coefficient of variation, and probability of
experiencing a net gain or loss.
Prices for the following inputs and outputs are allowed to
vary across iterations: steer calves, heifer calves, yearling
steers, yearling heifers, bred heifers (i.e., first-calf heifers),
bred two-year-olds (i.e., second-calf heifers), bred cows
(young, middle, and aged), and hay. All cattle prices
are provided by the Livestock Marketing Information
Center (LMIC), which includes monthly prices for
years 1999 through 2012 (LMIC, 2013). We adjust these
nominal prices to 2010 real prices using the US Bureau
of Labor Statistics’ Producer Price Index for all food.
We then select prices for a 3-month window around the
purchase-date or sales-date of interest. For example,
for 800-900-pound feeder steers sold in September, we
select prices from August through October of each year.
Finally, we fit a probability distribution to this subset of
real price data using @Risk’s “distribution fitting” tool.
This tool uses maximum likelihood estimation to fit
several different distributions to the data; it then uses the
Akaike Information Criterion to measure goodness-of-
fit and recommend a distribution (Vose, 2003).
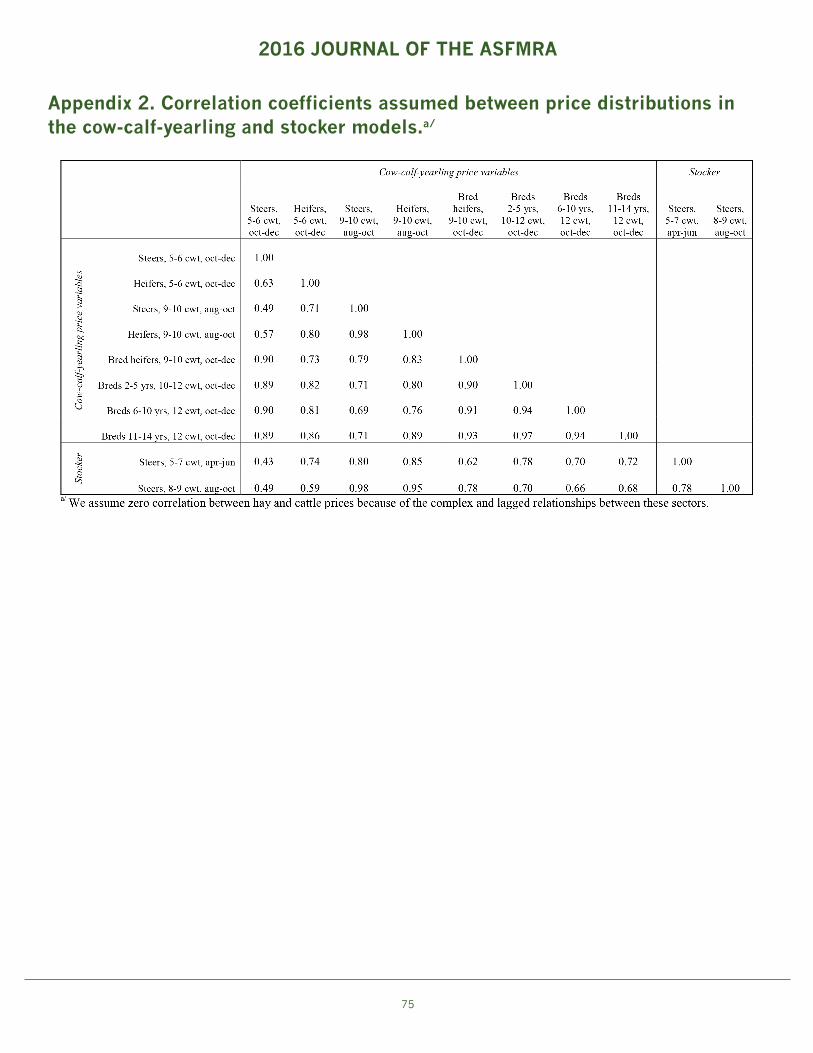
Parameter values for the eleven distributions used in our
risk analysis are described in Appendix 1. In addition to
the standard parameter values, each distribution has a
truncated lower and upper bound (based on the dataset’s
lowest and highest price, and standard deviation), as well
as Pearson’s correlation coefficients between any variables
that tend to move together (reported in Appendix 2).
Results
Enterprise budgets
Comparison of the budget summaries in Table 1 reveals
an advantage for the cow-calf-yearling operation over
the stand-alone stocker operation, measured in returns
over total cost, and based on average prices (which are
reported as means in Appendix 1; for a complete list
of prices, see Table 3 in Ruff et al. 2014a and 2014b).
The cow-calf-yearling operation generates $552,928
in revenue, of which $251,987 is from the cow-calf
enterprise and the other $300,941 is from the yearling
enterprise. Total cash cost for this operation is $511,187.
Major costs for the cow-calf enterprise include: winter
feeding and summer grazing; spring calving; gathering,
trailing and sorting; fuel; replacement bulls, and horse-
related costs. Major costs for the operation’s yearling
enterprise include: purchasing calves, winter feeding and
grazing; and marketing costs. Ruff et al. (2014a) provides
more detailed cost information, but returns over cash
costs (ROCC) are estimated at $41,741. This is more than
twice the stocker operation’s ROCC, which is discussed
later. After accounting for ownership costs of $63,065 –
which includes interest on operating loans, depreciation
of equipment, and owner labor – the cow-calf-yearling
operation’s pre-tax returns over total cost is -$21,324,
on average, which represents a net-loss. If ownership
or other costs are not reduced, this production system
will not be economically sustainable, on average, in the
long-run.
The stand-alone stocker operation (spring purchased,
600-pound steers) offers higher total revenue, $956,724,
than the cow-calf-yearling operation (Table 1). Its largest
expense category is the purchase of stocker calves,
$786,983, which offsets 82 percent of total revenue. The
calves must gain enough weight over the next 132 days
to also cover $150,556 of costs incurred during grazing,
trailing, trucking, marketing and other production
activities. The operation’s ROCC is just $19,185, less
2016 JOURNAL OF THE ASFMRA
62
than half of the cow-calf-yearling operation’s ROCC.
This slim margin between revenues and costs highlights
the importance of the buy-sell margin for stocker cattle
(Nader et al., 2010). After accounting for ownership
costs of $77,795, the stocker operation’s pre-tax returns
over total cost is -$58,789, on average, which represents a
sizable net-loss. Overall, these results show the cow-calf-
yearling operation to be twice as profitable, on average,
as the stocker operation. Neither operation is profitable
on average though.
Next, we vary the most critical prices in the budgets,
using Monte Carlo simulation, to quantify financial risk –
specifically the variability of ROCC. Note that ownership
costs are assumed constant. The simulation results
(bottom half of Table 1) indicate that stockers enjoy a
higher maximum ROCC than cow-calf-yearlings, but
also suffer higher variability in ROCC (as measured by
the coefficient of variation). Furthermore, stockers have
a much higher chance of experiencing negative ROCC
(i.e., a net loss), 43 percent versus 13 percent (Table 1).
Lastly, in 67 percent of iterations, the difference between
ROCC for the two operations shows cow-calf-yearlings
having an advantage over stockers. Collectively, these
results support previous studies’ conclusions that cow-
calf-yearling operations are generally more profitable and
less risky than stocker operations (e.g., Ritten et al., 2010;
Roberts, 2011), when compared side-by-side without
considering a transition process.
Transition analysis
Most studies would go no further in their comparison
of cow-calf-yearling versus stocker operations. After
all, producers would not typically be interested in
transitioning to an enterprise that generates less profit
and more financial risk. Recall, however, that herds in the
GYA face a risk of contracting and being quarantined for
brucellosis. To reduce this risk, some producers might be
interested in transitioning to a stocker operation, even if
it is less profitable and riskier financially. In such cases,
it would be helpful for them to know which transition
strategy performs best, and what additional benefits
and costs might arise during the transition process. The
enterprise budgets we presented earlier ignored the
transition process entirely, along with any associated
benefits and costs, such as shifts in the timing of sale-
proceeds from the cow-calf-yearling herd liquidation.
We therefore turn our attention to the much-overlooked
transition process.
Table 2 shows, for an eight-year planning horizon,
average annual ROCC for each year of the 1-year
(abrupt) and 7-year (gradual) transition strategies, versus
for the cow-calf-yearling operation. The 1-year transition
generates lower total ROCC (assuming a 0% discount
rate) than cow-calf-yearlings. The 1-year transition has
a large ROCC in the first year, $497,438, due to sale-
proceeds from the upfront liquidation of all breeding
livestock (see Ruff [2013] for valuation details). But its
ROCC is much lower in subsequent years ($19,185 versus
$41,741), reflecting the poorer average performance of a
stocker operation during the post-transition phase.
The 7-year transition, in contrast, generates higher total
ROCC (assuming a 0% discount rate) than cow-calf-
yearlings. During years one through seven, in particular,
the 7-year transition’s ROCC is higher than the cow-calf-
yearling operation’s. Year 1 is highest, $169,467, followed
by a slight decline during year 2 to $125,218, then rising
for several years before dropping dramatically in years 7
and 8. This pattern reflects declining sales of breeding
livestock coupled with rising sales of yearlings. Closer

2016 JOURNAL OF THE ASFMRA
63
inspection of this pattern suggests that the optimal mix
of yearlings within the cow-calf-yearling herd might be
higher than assumed in our baseline cow-calf-yearling
budget. This raises an interesting research question that
it is beyond the scope of our paper. Nevertheless, the
7-year transition strategy generates the highest total
ROCC across an eight-year planning horizon, compared
to the 1-year transition strategy and cow-calf-yearling
operation, assuming average prices.
Recognize, though, that the total ROCCs reported in
table 2 ignore price variability, as well as time-value of
money and different planning horizons. Tables 3 and 4,
in contrast, report the Monte Carlo simulation results
for NPV of ROCC over 8, 20 and 30-year planning
horizons, assuming two and four percent discount rates,
respectively.
The first result that emerges from Tables 3 and 4 is that a
1-year transition to stockers always performs worse than
a 7-year transition, measured in terms of mean-NPV.
This holds true across all planning horizons and both
discount rates. The 1-year transition also suffers a greater
risk of negative NPV and a higher coefficient of variation
than the 7-year transition – across all planning horizons
and discount rates. This suggests that a producer can
expect an abrupt transition to stockers to generally be
less profitable and more risky than a gradual transition.
An abrupt transition may also have different tax
implications than a gradual transition, though we do not
conduct a tax analysis in this paper. Accounting methods
(cash versus accrual), deductions, and other tax-relevant
characteristics vary so much across operations that it
would be difficult to provide a meaningful analysis.
Producers should therefore consult with their legal and
tax advisors to discuss other ramifications of a 1-year
versus 7-year transition before making a transition
decision.
A second result that emerges from Tables 3 and 4 is
that the 7-year transition generates higher NPV than the
cow-calf-yearling operation for almost every planning
horizon and discount rate. The only exception is the 30-
year planning horizon with a two percent discount rate,
in which the two operations generate similar mean NPV.
Once the discount rate is increased to four percent,
though, the 7-year transition yields the highest mean
NPV, across all planning horizons. It outperforms not
only the cow-calf-yearling operation, but also the 1-year
transition as mentioned earlier.
The 7-year transition’s performance over the cow-calf-
yearling operation reflects the strong influence of time-
value of money on NPV. A producer who is relatively
impatient – for example, if they have a four percent
personal discount rate, they would be willing to accept
$0.96 today rather than waiting a year to receive $1.00 –
derives more satisfaction from liquidating their breeding
livestock sooner (via the 7-year transition to stockers) than
later (upon retirement as a cow-calf-yearling operator).
That being said, a four percent personal discount rate is
not high enough for the 1-year transition to outperform
the 7-year transition, even though a 1-year transition
would generate sale-proceeds even sooner. This is
because the 1-year transition requires a producer to give
up too much NPV, overall, in exchange for receiving it
sooner. In contrast, a 7-year transition strikes a better
balance between NPV’s magnitude and timing.
Recall from our earlier budget analysis (Table 1) that
average ROCC for a single year is higher for cow-calf-

2016 JOURNAL OF THE ASFMRA
64
yearlings ($41,741) than for stockers ($19,185). It might
come as a surprise then that a 7-year transition to stockers
suddenly looks more appealing than a cow-calf-yearling
operation (Tables 3 and 4). Like most budget analyses,
though, Table 1 completely ignored the transition
process, pretending instead that a cow-calf-yearling
operation could transform instantaneously into a stocker
operation without any transition costs or benefits.
In reality, the transition process does generate additional
ROCC, especially during the first few years of the
planning horizon. Yet the upfront benefit of receiving
this additional ROCC must be large enough to outweigh
the eventual downside of stockers – a lower annual ROCC
($19,185). A producer’s personal discount rate must
therefore be sufficiently high (e.g., 4%), or the planning
horizon sufficiently short (e.g., 20 years). Otherwise, the
upfront benefits will not be large enough to outweigh
the eventual costs – a stocker operation’s lower annual
ROCC (a loss that accumulates with each passing year).
Conversely, if a producer’s personal discount rate is
relatively low (e.g., 2%) and the planning horizon is long
(e.g., 30 years), then the 7-year transition’s upside (i.e.,
receiving additional ROCC upfront) will not outweigh
its downside (i.e., lower annual ROCC in the longer-run).
In this case, the cow-calf-yearling operation will prevail
because its higher annual ROCC ($41,741) will outweigh
the foregone opportunity of greater upfront ROCC
(which is sacrificed by choosing to keeping the breeding
herd until retirement).
Figure 1 illustrates the flow of annual average ROCC
over a 30-year planning horizon for the cow-calf-yearling
operation and two stocker-transition strategies. Panels (a)
and (b) demonstrate the effect of a higher discount rate
on the flow of ROCC. The cow-calf-yearling scenario
is impacted most because the proceeds from herd-
liquidation occur in year 30 (highly discounted), rather
than upfront (lightly discounted). Panels (c) and (d) depict
the accumulation of annual average ROCC through time,
eventually reaching NPV in year 30. In panel (c), where
the discount rate is low (0%) and planning horizon is
long (30 years), the cow-calf-yearling operation achieves
the highest NPV (see data-points at year 30). But in panel
(d), where the discount rate is higher (4%), the 7-year
transition to stockers achieves the highest NPV.
For the 20-year planning horizon (not shown in Figure
1; see Appendix 3), an increase in the discount rate
causes a similar switch in the optimal strategy from
cow-calf-yearling to 7-year transition. When applied to
an 8-year planning horizon (Appendix 3), an increase in
the discount rate has no impact on the optimal strategy.
The 7-year transition to stockers consistently dominates
the cow-calf-yearling operation (in terms of mean NPV).
This illustrates the moderating effect that planning
horizon has on the discount rate; hence, the importance
of defining a specific planning horizon before deciding
whether to transition. Appendix 3 presents, in table
format, the flow of annual average ROCC across the
three planning horizons and three discount rates. These
numbers underlie Figure 1.
Although the 7-year transition to stockers almost always
outperforms cow-calf-yearling, in terms of mean-NPV,
it almost always exhibits greater financial risk, particularly
if the planning horizon is 20 or 30 years. Under these
longer planning horizons, the 7-year transition suffers a
higher coefficient of variation and a higher probability of
NPV being negative than the cow-calf-yearling operation.
This reflects again a stocker operation’s narrow buy-sell
margin. Continue too long as a stocker operator in the

2016 JOURNAL OF THE ASFMRA
65
risky post-transition phase (when breeding livestock
are no longer available to liquidate), and the high levels
of financial risk reported in Table 1 will eventually
overwhelm the low levels enjoyed during the transition
phase (tables 3 and 4).
If the planning horizon is relatively short (e.g., 8 years) –
representing perhaps a producer who is close to retirement
– the 7-year transition to stockers has similar financial risk
as the cow-calf-yearling operation. Given higher mean-
NPV and no-higher risk, a 7-year transition to stockers
appears to be an attractive way to remain active in the
cattle industry while working towards retirement within
the next 8 years. A producer who chooses this option
enjoys proceeds from the gradual herd-liquidation along
the way, rather than having to wait until the final year of
the planning horizon to enjoy an influx of income. That
being said, risk preference, management ability, cattle
price-cycle phase, and tax liability are additional factors
they may want to consider.
Discussion and Conclusions
Previous studies often report lower returns and higher
variability for stocker operations compared to cow-
calf-yearling operations, when compared side-by-side
without considering a transition from one to the other.
Our enterprise budget analysis and stochastic simulation
support these same findings for northwestern Wyoming.
This study’s unique contribution to the literature, though,
is its analysis of the transition process itself, which has
largely been ignored in the literature and perhaps by
some farm managers and consultants as well.
Our results suggest that, when transition-related benefits
and costs are considered, a gradual transition to a
stocker operation can actually generate higher NPV of
ROCC (on average) than a cow-calf-yearling operation,
depending on the transition strategy, planning horizon,
and discount rate. This may seem contradictory at first
to our earlier enterprise budget analysis findings, which
indicated that cow-calf-yearlings are more profitable on
average than stockers. Recall, though, that the budget
analysis completely ignores the transition process, and
instead compares two well-established operations, i.e.,
two operations already in the post-transition phase.
In reality, a producer who wishes to transform their
operation from cow-calf-yearlings to stockers (perhaps
to reduce brucellosis-quarantine risk) cannot achieve
this instantaneously; they must undertake a transition
process. During transition, they will encounter additional
benefits and costs, which standard enterprise budget
analysis does not capture. Our NPV analysis accounts
for these transition benefits and costs. And it suggests
that a gradual transition to stockers, under specific
circumstances, can generate more NPV than a cow-calf-
yearling operation.
Nonetheless, the transition and post-transition phases
of a stocker operation involve greater financial risk than
remaining in the cow-calf-yearling sector, especially if a
producer has a relatively low discount rate or plans to
remain in the cattle industry for 20 years or longer. This
increased financial risk may be of serious concern for
producers, as well as their lenders. The tradeoff between
higher average NPV and higher financial risk becomes
more pronounced as the planning horizon increases,
largely because the chance for stockers to suffer negative
ROCC increases. For producers less than a decade
away from retirement, though, or for those with higher
discount rates, it might be worth considering a gradual
transition away from cow-calf-yearling, and towards
2016 JOURNAL OF THE ASFMRA
66
stockers-only, rather than simply liquidating all breeding
livestock at once when they retire. They could also
consider transitioning gradually out of cow-calf-yearlings
without transitioning into stockers at all (an idea that
requires additional research beyond the scope of our
paper). Again, risk preference, management ability, cattle
price-cycles, and tax liability are additional factors they
may want to consider before making this decision.
For producers in the Designated Surveillance Area of
the GYA – whose herds are at risk of being quarantined
for brucellosis, but who might not want to transition out
of the cattle industry entirely – converting to stockers
would eliminate brucellosis-related risk. And our results
suggest that, if a producer has a relatively high discount
rate or is within eight years of retirement (with no intent
of passing the operation on to the next generation, which
would effectively extend the planning horizon), a gradual
transition to stockers might be worth considering. It
generates higher NPV than running cow-calf-yearlings
until retirement, and it enables them to maintain a
familiar lifestyle, but it also increases their financial risk.
Another shortcoming is that, as long as a herd contains
any breeding cattle (no matter how few) it is at risk of
being quarantined. This complicates the comparison
of a 1-year versus 7-year transition. A 1-year transition
reduces the risk of brucellosis most quickly, but comes
at the cost of a large decrease in mean NPV, and a large
increase in the risk of negative ROCC. Conversely, a
7-year transition lessens the financial cost and risk of
switching to stockers, but leaves the operation vulnerable
to the risk of brucellosis quarantine for longer.
Our results show that switching to stockers cannot reduce
the risk of brucellosis quarantine while maintaining the
same level of profitability and the same level of financial
risk as a cow-calf-yearling operation. Tradeoffs between
different types of risk – brucellosis versus financial –
are unavoidable. When considering these tradeoffs, a
producer in the DSA should weigh the potential benefits
of switching to stockers against its potential costs.
More specifically, they should compare the probability-
weighted cost of their cow-calf-yearling herd being
quarantined for brucellosis during their planning horizon
(Wilson, 2011) against a potential change in mean NPV
and increase in financial risk over that same planning
horizon.
If the benefits of transitioning to stockers seem to
outweigh the costs, they should consider next whether
some other brucellosis management activity (e.g.,
adult-booster vaccination, fencing winter pastures, or
transitioning out of the cattle industry entirely) might
generate even larger net present value (Roberts et al.,
2012; Boroff, 2013). The results of our study provide
certain pieces of information, that are necessary but not
sufficient for ranch managers (along with their advisors
and consultants) to make this difficult and very personal
decision. Our results also provide policymakers with
pieces of information they would need to design, and
debate the merits of, an incentive program related to
cow-calf-yearling operations transitioning to stockers.

2016 JOURNAL OF THE ASFMRA
67
References
Anderson, J.D., C. Lacy, C.S. Forrest, and R.D. Little. 2004. “Expected Utility Analysis of Stocker Cattle Ownership
Versus Contract Grazing in the Southeast.” Journal of Agricultural and Applied Economics 36:719-730.
Barry, P., P. Ellinger, J. Hopkin, and C.B. Baker. 2000. Financial Management in Agriculture. Danville, Illinois: Interstate
Publishers, Inc.
Boroff, K.L. 2013. “Cost-Benefit Analysis of Elk Brucellosis Prevalence Reduction in the Southern Greater
Yellowstone Ecosystem.” M.S. Thesis, University of Wyoming.
Doye, D., R. Sahs, D. Peel, and E.A. DeVuyst. 2013. “Financing Herd Rebuilding after the 2011 Drought.” Journal of
the American Society of Farm Managers and Rural Appraisers 76:19-38.
Livestock Marketing Information Center (LMIC). 2013. “Livestock Marketing Reports.” Accessed February 22,
2013. http://www.lmic.info.
Manske, L.L. 1998. “Animal Unit Equivalent for Beef Cattle Based on Metabolic Weight.” North Dakota State
University Dickenson Research Extension Center. Accessed January 16, 2013. http://www.ag.ndsu.edu/archive/
dickinso/research/1997/animal.htm.
Nader, G.A., L.C. Forero, J.K. McArthur, D. Drake, S. Larson, K.M. Klonsky, and R.L. DeMoura. 2010. “Sample
Costs For Beef Cattle Yearling/Stocker Production: 300 head, Sacramento Valley.” BF-SV-10, University of
California Cooperative Extension Service.
Northwestern Wyoming Cattle Producers. 2013. Producer focus-group meeting hosted by Shane Ruff, Worland,
WY, March 7, 2013.
Palisade Corporation. 2013. “@Risk (version 6.1): Risk Analysis and Simulation Add-In for Microsoft.” Ithaca, New
York: Palisade Corporation. http://www.palisade.com.
Ritten, J.P., C.T. Bastian, S.I. Paisley, and M.A. Smith. 2010. “Long Term Comparison of Alternative Range
Livestock Management Strategies Across Extended Droughts and Cyclical Prices.” Journal of the American Society of
Farm Managers and Rural Appraisers 73:244-253.
Robert, C., and G. Casella. 1999. Monte-Carlo Statistical Methods. New York: Springer.
2016 JOURNAL OF THE ASFMRA
68
Roberts, T.W. 2011. “Costs and Expected Benefits to Cattle Producers of Brucellosis Management Strategies in the
Greater Yellowstone Area of Wyoming.” M.S. Thesis, University of Wyoming.
Roberts, T.W., D.E. Peck, and J.P. Ritten. 2012. “Cattle Producers’ Economic Incentives for Preventing Bovine
Brucellosis Under Uncertainty.” Preventive Veterinary Medicine 107(3-4):187-203.
Ruff, S.P. 2013. “Economics of Transitioning From a Cow/Calf/Yearling Operation to a Stocker Operation in
Response to Brucellosis.” M.S. Thesis, University of Wyoming.
Ruff, S.P., D.E. Peck, C.T. Bastian, and W. Cook. 2014a. “Enterprise Budget for a Cow-Calf-Yearling Operation,
Northwestern Wyoming.” Bulletin MP-120.1, University of Wyoming Cooperative Extension Service.
Ruff, S.P., D.E. Peck, C.T. Bastian, and W. Cook. 2014b. “Enterprise Budget for a Stocker Operation, Northwestern
Wyoming: Spring-purchased, 600 pound steers.” Bulletin MP-120.2, University of Wyoming Cooperative Extension
Service.
Schumaker, B.S., D.E. Peck, and M.E. Kauffman. 2012. “Brucellosis in the Greater Yellowstone Area: Disease
Management at the Wildlife-Livestock Interface.” Human-Wildlife Interactions 6:48-63.
Strauch, B.A., D.E. Peck, and L.J. Held. 2010. “A Case Study of Fall Versus Spring Calving for the Rocky Mountain
West.” Journal of the American Society of Farm Managers and Rural Appraisers 73(1):74-84.
Vose, D. 2003. Risk Analysis: A Quantitative Guide. Chichester, England: John Wiley & Sons Ltd.
Wilson, B.A. 2011. “Economic Impacts of Brucellosis Outbreaks in Wyoming Cattle Herds Under Alternative
Federal Policies.” M.S. Thesis, University of Wyoming

2016 JOURNAL OF THE ASFMRA
69
Table 1. Enterprise analysis for cow-calf-yearling and stocker operations, using average prices initially, followed by simulation of returns over cash costs using price distributions

2016 JOURNAL OF THE ASFMRA
70
Table 2. Estimated annual returns over cash costs for a cow-calf-yearling operation versus a 1-year or 7-year transition to a stocker operation, using average prices and a 0% discount rate.

2016 JOURNAL OF THE ASFMRA
71
Table 3. Monte-Carlo simulation of the net present va.lue of returns over cash costs (pre-tax) for a cow-calf-yearling operation versus a 1-year or 7-year transition to a stocker operation, using an 8, 20, or 30-year horizon, a 2% discount rate, and 10,0000 iterations.

2016 JOURNAL OF THE ASFMRA
72
Table 4. Monte-Carlo simulation of the net present value of returns over cash costs (pre-tax) for a cow-calf-yearling operation versus 1-year or 7-year transition to a stocker operation, using an 8, 20, or 30-year horizon, a 4% discount rate, and 10,000 iterations.

2016 JOURNAL OF THE ASFMRA
73
Figure 1. Flow of annual average ROCC (returns over cash costs), over a 30-year planning horizon, assuming a discount rate of 0 or 4%. Panels (a) and (b) show annual average ROCC by year for cow-calf-yearling, 1-year transition to stockers, and 7-year transition to stockers. Panels (c) and (d) show ROCC accumulating across the planning horizon, where the value at year 30 represents net present value.

2016 JOURNAL OF THE ASFMRA
74
Appendix 1. Distributions, parameter values, and descriptive statistics for prices in the cow-calf-yearling and stocker models.
2016 JOURNAL OF THE ASFMRA
75
Appendix 2. Correlation coefficients assumed between price distributions in the cow-calf-yearling and stocker models.a/

2016 JOURNAL OF THE ASFMRA
76
Appendix 3. Annual average ROCC (returns over cash costs) by year, across a planning horizon of 8, 20, or 30 years (rows) and a discount rate of 0, 2, or 4% (columns). Three strategies are analyzed: cows-calf-yearling, 1-year transition to stockers, and 7-year transition to stockers.