2016 rtp update - electric reliability council of texas · 1/19/2016. 3. 2016 rtp overview...
TRANSCRIPT

1/19/2016 1
2016 RTP UpdateJanuary, 2016

1/19/2016 2
Outline
2016 RTP Overview
2016 RTP Key Input Assumptions
Next steps
1/19/2016 3
2016 RTP Overview
Governing standard, protocol and guide for RTP
o NERC Standard TPL-001-4, ERCOT Protocol Section 3.11 and
Planning Guide Section 3 and 4
ERCOT presented the study scope of 2016 RTP in the Nov-2015 RPG.
The study scope has been updated based on feedback and further
review. The updated 2016 RTP Scope is available in the RPG calendar
website.
ERCOT is preparing cases and working with TSPs for various load,
generation and transmission models

1/19/2016 4
2016 RTP Overview: Summary of Key Updates
Key updates on the 2016 RTP Scope and Process document
o Hydro units: Maximum dispatch levels in the reliability cases will be
determined based on a review of the historical data
o DC Tie flows will be modeled similar to the 2015 RTP, based on a
review of the historical data:
Full import through North and East DC Ties
Full export through Eagle Pass, Laredo and Railroad DC Ties
o High-wind low-load condition will be studied for the off-peak
sensitivity analysis

1/19/2016 5
2016 RTP Overview: Study Year
ERCOT is currently preparing input data to build base cases for
the following study years using the Oct 2015 SSWG cases:
o Base Cases:
Summer peak reliability base cases:
- Year 2018, 2019, 2021 for the near-term horizon
- Year 2022 for the long-term horizon
Off-Peak reliability base case:
- Year 2019: minimum load case
o Sensitivity cases will be developed using secure base cases:
Summer peak sensitivity cases: Year 2018 and 2021
Off-Peak sensitivity case: Year 2019

1/19/2016 6
2016 RTP Overview: Analysis and Tools Key Studies:
o Reliability analysis
Contingency analysis (SCOPF) to evaluate events where load shed
is not allowed and to develop corrective action plans
Multiple element contingency analysis to perform load shedding
analysis and Cascading analysis
Short circuit analysis to identify over-duty breakers and corrective
action plans
Long-lead time equipment analysis to identify impact of unavailability
of long-lead time equipment
o Economic analysis
Tools to be used:
o PowerWorld, TARA, PSS/E, POM Applications, UPLAN

1/19/2016 7
2016 RTP Input Assumptions: Study Weather Zone Load
The RTP cases will use the higher of either the aggregated weather zone load
in the SSWG base cases (October 2015 Version) or the ERCOT 90th
percentile weather zone load forecast.
Study weather zone load assumed for 2016 RTP
Year Coast East North North Central
South Central South West Far West NCP
Total
2018 27,199 2,951 1,734 27,243 13,235 6,564 2,363 3,521 84,810
2019 27,507 2,988 1,769 27,500 13,552 6,660 2,401 3,672 86,050
2021 27,979 3,034 1,820 27,943 14,165 6,840 2,483 3,925 88,190
2022 28,224 3,054 1,843 28,165 14,435 6,971 2,520 4,043 89,255
Notes: • Self served load and Freeport LNG load (655.5 MW) are included. • Losses are not included• Highlighted data are from ERCOT’s 90th percentile forecast• These numbers may change upon further review
(Unit: MW)

1/19/2016 8
2016 RTP Input Assumptions: Future Generation
ERCOT reviewed the Generation Interconnection Status (GIS)
Report and identified new generation that met Planning Guide 6.9
Requirement. Total nameplate capacity of the future generation
(with in-service date of March 2016 and beyond) is shown below.
Fuel Type Coast Far West North North Central South South
Central West Grand Total
Gas 800 - 903 1,042 225 51 - 3,021
Solar - 798 110 - - - - 908
Wind - 120 2,365 96 1,774 - 380 4,735
Grand Total 800 918 3,378 1,138 1,999 51 380 8,664
(Source: GIS Report November 2015 REVISED at http://www.ercot.com/gridinfo/resource/2015)
(Unit: MW)

1/19/2016 9
2016 RTP Input Assumptions: Wind dispatch output levels
Base case capacity factor based on 15th percentile output from vendor-supplied profiles sampled for hours when ERCOT load is higher than the 95th percentile
Dispatch may be increased for resources outside of study region to meet load, loss, and reserve requirements. Maximum dispatch is the Wind Peak Average Capacity Percentage for summer used in the December 2015 CDR
The information from historical data and SSWG cases will be used to determine wind dispatch output level for the minimum load condition and high-wind low-load condition
WeatherZone Base Case** Dispatch Level
Not to exceed
Coast N/A N/A
East N/A N/A
North 3% 12%
North Central 1% 12%
South Central 2% 12%
South 10% 55% (coastal) / 12% (non-coastal)*
West 3% 12%
Far West 3% 12%
* Coastal region defined as Cameron, Willacy, Kenedy, Kleberg, Nueces, San Patricio, Refugio, Aransas, Calhoun, Matagorda, and Brazoria counties per Protocol Section 3.2.6.2.2** Summer peak base cases

1/19/2016 10
2016 RTP Input Assumptions: Other Resources
Solar units will be dispatched at 70% of their nameplate capacity
for summer peak reliability cases based on analysis of vendor-
supplied solar curves similar to that conducted for wind generation.
It will be dispatched to 0 in the minimum load reliability case,
because ERCOT minimum load generally occurs at night or during
early morning
Hydro units will be dispatched based on a review of the historical
dispatch data for all reliability cases.
DC Tie will be modeled similar to 2015 RTP
Appendix has more details of generation including the list of
switchable, mothballed, and retired units

1/19/2016 11
2016 RTP Input Assumptions: Transmission
ERCOT uses the 15SSWG Cases (posted 10/12/2015) as the start
cases to build 2016 RTP base cases
Tier 1, 2 and 3 transmission projects in the cases that do not have
RPG approval will be backed out from the cases to build 2016 RTP
start cases
ERCOT sent the list of projects with no RPG approval dates in the
TPIT for TSPs’ review
1/19/2016 12
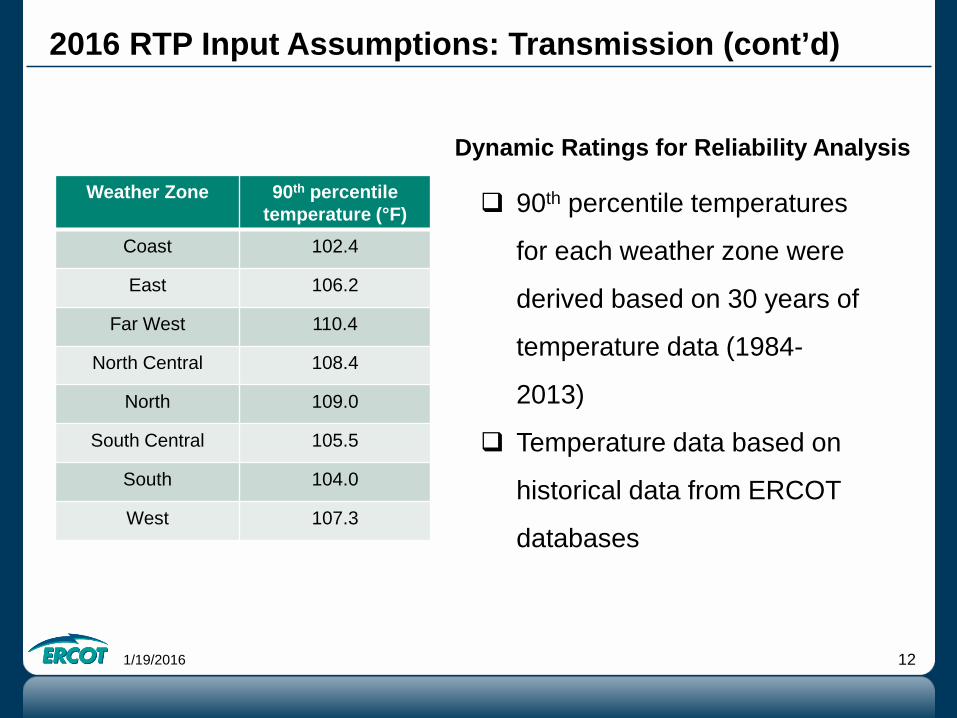
2016 RTP Input Assumptions: Transmission (cont’d)
Weather Zone 90th percentile temperature (°F)
Coast 102.4
East 106.2
Far West 110.4
North Central 108.4
North 109.0
South Central 105.5
South 104.0
West 107.3
90th percentile temperatures
for each weather zone were
derived based on 30 years of
temperature data (1984-
2013)
Temperature data based on
historical data from ERCOT
databases
Dynamic Ratings for Reliability Analysis
1/19/2016 13
Next steps
Continue to work with TSPs for case conditioning to create and
publish RTP reliability start cases
Conduct contingency analysis for the base cases and post
contingency definitions and resulting violations
Corrective action plans such as transmission upgrades or
additions will be tested in collaboration with respective
transmission owners
Create and post N-1 (Set 1: P1 and P7) secure cases
Continue to test P2, P4, and P5. After that, move on to P3 and P6-
2 (G-1+N-1 and X-1+N-1) screen to identify corrective action plans
to address violations

1/19/2016 14
2016 RTP - Current Status
Case conditioning
Initial start cases, and contingency list ready
Set 1 (P1, P7),Set 2 (P2, P4, P5)
contingency analysis for the base cases
Set 3 (P3: G-1+N-1, part of P6: X-1+N-1)
contingency analysis for the base cases
Economic case preparation and analysis
2016 RTP Report
Green box: completeYellow box: in progress
Short circuit study
Long-lead time equipment study
Sensitivity analysis
Other Reliability Studies
Multiple element outage and cascading
analyses

1/19/2016 15
Questions?

1/19/2016 16
Appendix

1/19/2016 17
SSWG load SSWG load based on October 2015 SSWG cases
Includes losses, does not include self served load or Freeport LNG load
Year Coast East North North Central
South Central South West Far
West NCP Total
2017 22,505 3,148 1,800 25,597 13,183 6,033 2,273 3,432 77,971
2018 22,971 3,169 1,833 25,954 13,472 6,163 2,319 3,586 79,467
2019 23,288 3,209 1,875 26,314 13,808 6,270 2,360 3,744 80,869
2020 23,584 3,238 1,909 26,616 14,099 6,389 2,402 3,891 82,127
2021 23,813 3,275 1,947 26,905 14,439 6,420 2,454 4,008 83,260
2022 24,036 3,304 1,977 27,242 14,721 6,612 2,510 4,139 84,542
(Unit: MW)

1/19/2016 18
ERCOT 90th percentile load forecast Includes losses, does not include self served load or Freeport LNG load
(Unit: MW)
Year Coast East North North Central
South Central South West Far
West NCP Total
2017 20,967 2,683 1,556 27,426 12,556 6,060 2,112 3,029 76,389
2018 21,168 2,715 1,554 27,754 12,615 6,199 2,178 3,117 77,082
2019 21,339 2,740 1,556 28,016 12,659 6,298 2,247 3,207 77,975
2020 21,496 2,766 1,560 28,243 12,693 6,386 2,319 3,297 78,760
2021 21,658 2,794 1,563 28,468 12,731 6,482 2,391 3,393 79,480
2022 21,821 2,822 1,565 28,694 12,770 6,579 2,465 3,489 80,205

1/19/2016 19
New generation per PG 6.9 requirements
Project Name In-service Date Capacity Added (MW) Fuel County TDSP Weather
ZonePHR Peakers 3/2016 390 GAS Galveston Centerpoint CoastAntelope & Elk 1 4/2016 369 GAS Hale Sharyland NorthElk 2 4/2016 202 GAS Hale Sharyland NorthElk 3 4/2016 202 GAS Hale Sharyland NorthSky Global Power One 4/2016 51 GAS Colorado SBEC/LCRA South CentralSouth Plains II Phase a 5/2016 152 WIND Floyd Sharyland NorthSouth Plains II Phase b 5/2016 148 WIND Floyd Sharyland NorthBaytown Chiller 6/2016 270 GAS Chambers Centerpoint CoastRedgate G 6/2016 225 GAS Hidalgo AEP/TCC SouthBuckthorn Wind 1 6/2016 96 WIND Erath BEPC North CentralLamar Power Upgrade 6/2016 130 GAS Lamar Oncor NorthRE Roserock Solar 7/2016 150 SOLAR Pecos AEP/TNC Far WestGunsight Mt W 8/2016 120 WIND Howard Oncor Far WestWake Wind 8/2016 300 WIND Dickens WETT NorthHappy Whiteface W 8/2016 157 WIND Deaf Smith Sharyland NorthPaint Creek Solar 8/2016 110 SOLAR Haskell AEP/TNC NorthTorrecillas Wind A 9/2016 200 WIND Webb AEP/TCC South
Source: Based on GIS Report November 2015 Revised

1/19/2016 20
New generation per PG 6.9 requirements (cont’d)
Source: Based on GIS Report November 2015 Revised
Project Name In-service Date Capacity Added (MW) Fuel County TDSP Weather
ZoneTorrecillas Wind B 9/2016 200 WIND Webb AEP/TCC SouthLos Vientos IV 9/2016 200 WIND Starr AEP/TCC SouthWest Texas Solar 9/2016 110 SOLAR Pecos LCRA Far WestVal Verde Wind 10/2016 180 WIND Val Verde AEP/TCC WestRiggins Solar 10/2016 150 SOLAR Pecos AEP/TNC Far WestHidalgo & Starr Wind 10/2016 250 WIND Hidalgo AEP/TCC SouthElectra Wind 10/2016 360 WIND Wilbarger AEP/TNC NorthMidway Wind 12/2016 161 WIND San Patricio AEP/TCC SouthPatriot Wind 12/2016 180 WIND Nueces AEP/TCC SouthColbeck's Corner W 12/2016 200 WIND Carson Sharyland NorthGrandview W 3 12/2016 188 WIND Carson Sharyland NorthSwisher Wind 12/2016 300 WIND Swisher Sharyland NorthSan Roman Wind 1 12/2016 103 WIND Cameron AEP/TCC SouthLonghorn South 12/2016 160 WIND Briscoe Sharyland NorthRedfish W 2a 12/2016 115 WIND Willacy AEP/TCC SouthRedfish W 2b 12/2016 115 WIND Willacy AEP/TCC SouthSalt Fork 1 Wind 12/2016 200 WIND Gray CTT NorthBlanco Canyon Wind 1 12/2016 50 WIND Floyd Sharyland NorthBlanco Canyon Wind 2 12/2016 150 WIND Floyd Sharyland NorthChapman Ranch Wind I 12/2016 250 WIND Nueces AEP/TCC SouthSP-TX-12 12/2016 180 SOLAR Upton LCRA Far WestEast Pecos Solar 12/2016 100 SOLAR Pecos AEP/TNC Far WestRTS Wind 12/2016 200 WIND McCulloch LCRA WestFriendswood G 4/2017 129 GAS Harris Centerpoint CoastFreeport LNG 6/2017 11 GAS Brazoria Centerpoint CoastWolf Hollow 2 7/2017 1042 GAS Hood Oncor North CentralPecos Solar I 10/2017 108 SOLAR Pecos AEP/TNC Far West

1/19/2016 21
Switchable, Mothballed and Retired Units
Unit NameCapacity Available to ERCOT (MW)
Weather Zone Notes2018 SUM 2019 SUM / MIN 2021 SUM 2022 SUM
KMCHI_CC1 623 623 / 665 623 623 North SwitchableKMCHI_CC2 623 623 / 665 623 623 North Switchable
FTR_CC1 580 580 / 640 880 880 North Switchable (300MW unavailable to ERCOT until 2021)
TGCCS_CC1 846 846 / 908 846 846 North SwitchableFRONTERA _CC1 - - - - South SwitchableANTLP_G1 - G3 - - - - North SwitchableELK_G1 - - - - North SwitchableELK_G2 - - - - North SwitchableSILASRAY_SILAS_5 - - - - South Retired
CALAVERS_JTD1 420 - - - South Mothballed
CALAVERS_JTD2 420 - - - South MothballedCTL_GT_103 - - - - Coast MothballedAMOCOOIL_AMOCO_5 - - - - Coast Mothballed
SRB_SRBGT_2 - - - - Coast Mothballed
SRB_SRBGT_G4 - - - - Coast Mothballed
SRB_SRBGT_G3 - - - - Coast Mothballed
SRB_SRBGT_G2 - - - - Coast Mothballed
SRB_SRBGT_G1 - - - - Coast Mothballed
MLSES_UNIT2 805 805 / - 805 805 North Seasonally Mothballed
(Sources: MIS-published Notification of Suspension of Operations (NSO); December 2015 CDR Report)

1/19/2016 22
Hydro Data Analysis
Dec 2015 CDR shows 437.7 MW as the total available capacity based on the High Sustainable Limits (HSL) of hydro units
147 MW was the total average output from hydro units during the top 20 ERCOT peak load hours for the past three years.

1/19/2016 23
DC Tie Historical Data Analysis (Summer of 2013~2015)
Railroad tie capacity doubled last Summer: Approximately 250 MW flows occurred when
South was at peak on August 14, 2015. Approximately 200 MW occurred when
ERCOT was at peak on August 5, 2015

1/19/2016 24
DC Tie Historical Data Analysis (cont’d)
DC Tie Capacity 2015 RTPCDR*
(per current 2016 RTP assumption)
Max/Min/Med**Negative means
exportEast 600 600 Import 581 Import 601/334/599
North 220 220 Import 140 Import 219/-196/166Laredo 100 100 (Export) 56 (Export) 0/-101/-96
Railroad 300 300 (Export) 90 (Export) 0/-201/-151Eagle Pass 30 30 (Export) 13 (Export) 0/-29 /0
* Average flows per 2013~2015 Top 20 ERCOT peak load hours analysis** Max/Min/Median per 2013~2015 Top 20 ERCOT peak load hours analysis
DC Tie Capacity Max/Min/Med***Negative means export
East 600 601/294/599North 220 219/-134/183
Laredo 100 0/-101/-99Railroad 300 0/-251/-151
Eagle Pass 30 0/-29/0
*** Max/Min/Median per 2013~2015 Top 20 South peak load hours analysis