2016 tell oregon an analysis of district level … · 2016 tell oregon: district level teacher...
TRANSCRIPT

2016 TELL Oregon: District Level Teacher Working Conditions and Student Diversity
110 Cooper Street | Suite 500 | Santa Cruz, CA 95060 | (p) 831.600.2200 | www.newteachercenter.org 1
2016 TELL Oregon An Analysis of District Level Teacher Working Conditions
And Student Diversity
2016 TELL Oregon: District Level Teacher Working Conditions and Student Diversity
2
INTRODUCTION
In 2016, Oregon educators shared their perceptions of the teaching conditions at their schools through the
Teaching, Empowering, Leading, and Learning (TELL) Oregon Survey. More than 18,000 of Oregon’s educators
(54%) responded to the survey, and 712 out of 1,245 Oregon schools (57%) met the response rate threshold of
40 percent required for school-level reporting. Of the 199 Oregon school districts surveyed, 77 (39%) met the
35% response rate and minimum 20 respondent threshold required for district-level reporting. Data from the
survey were made available in the spring of 2016 at www.telloregon.org. Disaggregated response rates are
presented on page 4.
The aim of this research brief is to explore the relationship between teacher working conditions and student
diversity in Oregon school districts. Response data from the 2016 TELL Oregon Survey are used to estimate dis-
trict-level teacher working conditions. District-level diversity statistics (proportion of non-white students) as well
as NCES Urban Locale data were provided by the Oregon Department of Education. The purpose of this re-
port is to help stakeholders better understand the relationship between teaching conditions and student diver-
sity in Oregon.
SUMMARY OF FINDINGS
Teacher Working Conditions are less positive in high diversity districts. In general, teaching conditions
are less positive in High Diversity districts (see Figure 1). In particular, results suggest that High Diversity districts
need more support around the area of Managing Student Conduct than do districts with lower levels of diver-
sity (see Figure 2g).
Particular teaching conditions vary by urban locale. Generally speaking, there are no large differences
between urban locales and other locale types when comparing the teaching conditions composite. Howev-
er, results suggest that differences exist between urban locales and other locale types in the areas of Commu-
nity Support & Involvement, Managing Student Conduct, and Use of Time. Whereas educators from less popu-
lated areas tend to report more positive teaching conditions around Managing Student Conduct (see Figure
4g) and Use of Time (see Figure 4h), the opposite trend is found for Community Support & Involvement (see
Figure 4a).
The widest gap in teacher working conditions is between high and low diversity school districts in
cities. Selected districts under the City urban locale designation represent the greatest discrepancy in teach-
ing conditions between high and low diversity districts (average difference of 5% overall). In particular, districts
in the City—High Diversity group appear to need the most support around Managing Student Conduct, an
area representing a 10% gap between the low and high diversity City groups.
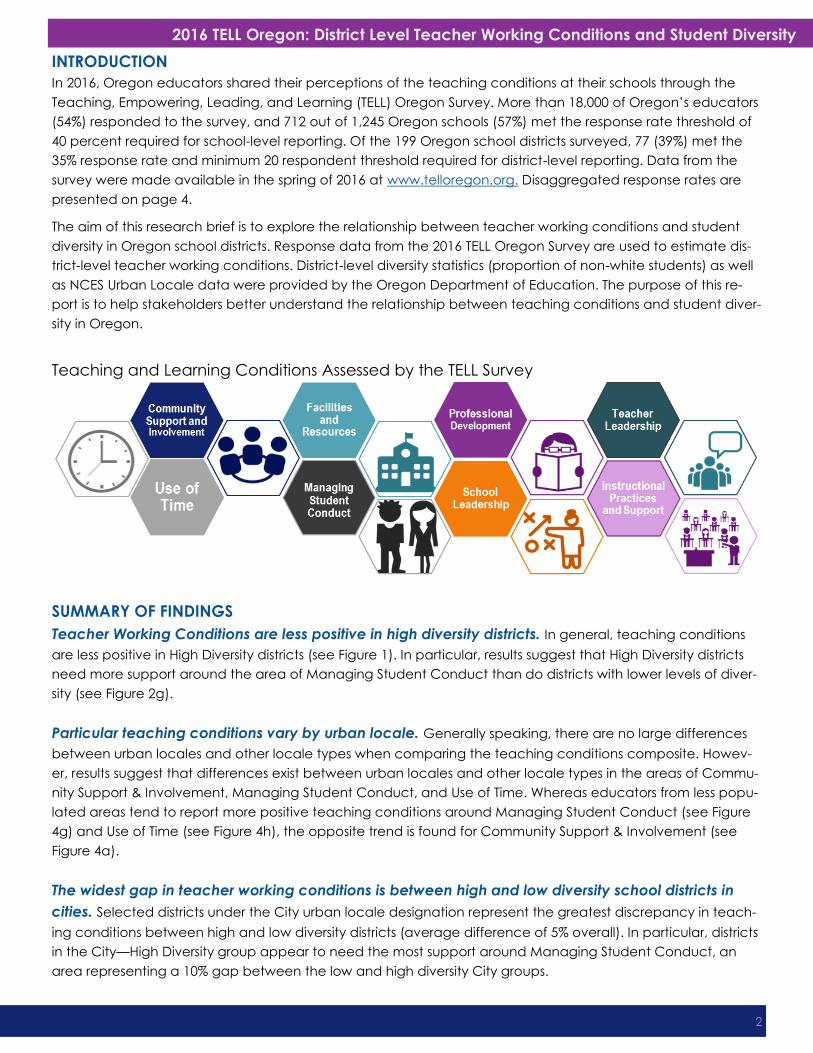
Teaching and Learning Conditions Assessed by the TELL Survey

2016 TELL Oregon: District Level Teacher Working Conditions and Student Diversity
3
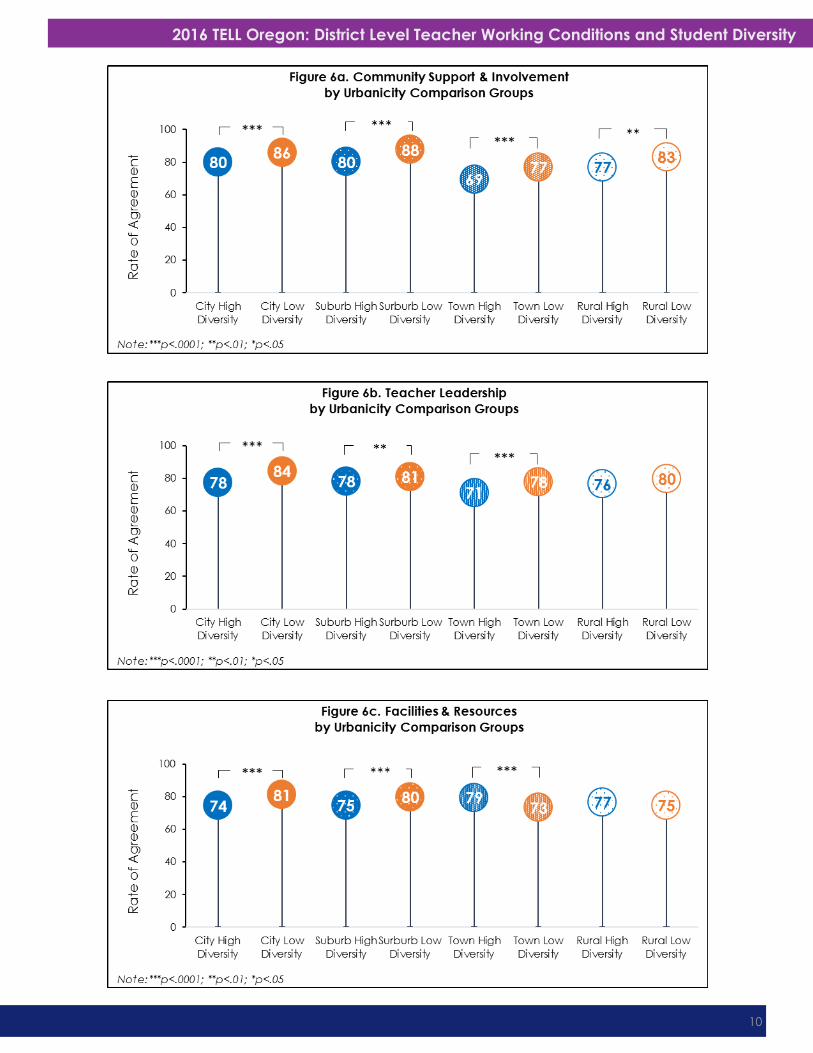
Responses from educators from districts with higher levels of diversity are consistently less positive in
the areas of Community Support & Involvement, Managing Student Conduct, and Teacher Leader-
ship across urban locales . Results suggest that districts with higher levels of diversity across all urban locales
could use support related to Community Support & Involvement (see Figure 5a—average difference of 7%).
Additionally, Managing Student Conduct (see Figure 5g) and Teacher Leadership (see Figure 5b) appear to
be areas that high diversity districts need support. These findings are particularly pertinent when paired with
the findings of the 2014 TELL Oregon Student Achievement Outcomes report which identified Community Sup-
port & Involvement and Managing Student Conduct as teaching condition areas that correlate strongly with
student achievement (New Teacher Center, 2015).
ABOUT TELL
The TELL Oregon Survey is a full-population survey based on the NTC TELL Survey first developed in the North
Carolina Governor’s Office in 2002. It has since been replicated in more than 20 states and captured the voic-
es of more than 1.5 million educators, providing critical data to support school improvement efforts. The TELL
survey is a valid and reliable instrument1 designed to measure educator perceptions about the presence of
teaching and learning conditions that research has shown increase student learning and teacher retention2.
Specifically, the survey is designed to report educators’ perceptions of teaching and learning conditions orga-
nized into the following eight constructs: Time, Facilities and Resources, Professional Development, School
Leadership, Teacher Leadership, Instructional Practices and Support, Managing Student Conduct, and Com-
munity Support and Involvement (see Table 1).
Appendix A presents the individual items that make up each construct. In addition, the formulas used to cal-
culate the overall composite and construct level rates of agreement, the primary TELL metrics used in this brief,
are provided in Appendix A.
Table 1.
Teaching and Learning Conditions Assessed by the TELL Survey
TELL Construct Description
Facilities and Resources Availability of instructional, technology, office, communication, and school
resources to educators
Community Support & Involvement Community and parent/guardian communication and influence in the school
School Leadership Ability of school leadership to create trusting, supportive environments and address
teacher concerns
Managing Student Conduct Policies and practices to address student conduct issues and ensure a safe school
environment
Instructional Practices & Support Data and support available to teachers to improve instruction and student learning
Teacher Leadership Teacher involvement in decisions that impact classroom and school practices
Professional Development Availability and quality of learning opportunities for educators to enhance their
teaching
Use of Time Available time to plan, to collaborate, to provide instruction, and to eliminate
barriers in order to maximize instructional time during the school day
1Swanlund, A. (2011). Identifying working conditions that enhance teacher effectiveness: The psychometric evaluation of
the Teacher Working Conditions Survey. Chicago. IL: American Institutes for Research.
2See selected references.
2016 TELL Oregon: District Level Teacher Working Conditions and Student Diversity
4
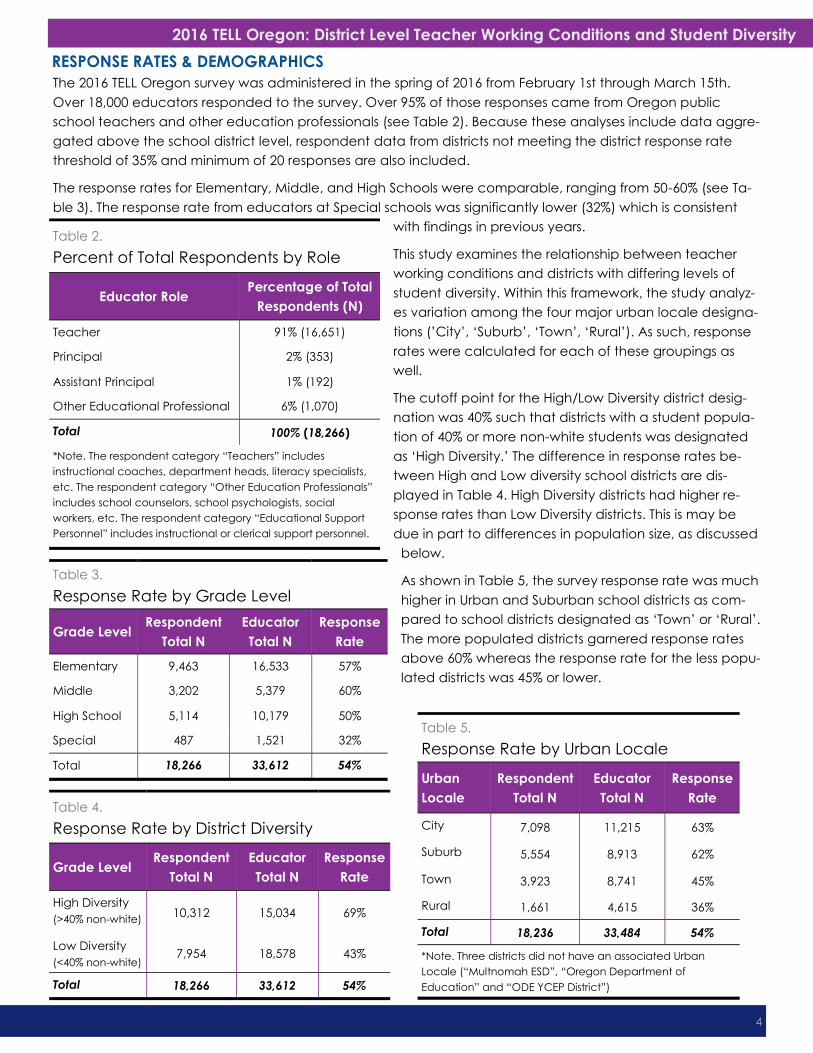
RESPONSE RATES & DEMOGRAPHICS
The 2016 TELL Oregon survey was administered in the spring of 2016 from February 1st through March 15th.
Over 18,000 educators responded to the survey. Over 95% of those responses came from Oregon public
school teachers and other education professionals (see Table 2). Because these analyses include data aggre-
gated above the school district level, respondent data from districts not meeting the district response rate
threshold of 35% and minimum of 20 responses are also included.
The response rates for Elementary, Middle, and High Schools were comparable, ranging from 50-60% (see Ta-
ble 3). The response rate from educators at Special schools was significantly lower (32%) which is consistent
with findings in previous years.
This study examines the relationship between teacher
working conditions and districts with differing levels of
student diversity. Within this framework, the study analyz-
es variation among the four major urban locale designa-
tions (’City’, ‘Suburb’, ‘Town’, ‘Rural’). As such, response
rates were calculated for each of these groupings as
well.
The cutoff point for the High/Low Diversity district desig-
nation was 40% such that districts with a student popula-
tion of 40% or more non-white students was designated
as ‘High Diversity.’ The difference in response rates be-
tween High and Low diversity school districts are dis-
played in Table 4. High Diversity districts had higher re-
sponse rates than Low Diversity districts. This is may be
due in part to differences in population size, as discussed
below.
As shown in Table 5, the survey response rate was much
higher in Urban and Suburban school districts as com-
pared to school districts designated as ‘Town’ or ‘Rural’.
The more populated districts garnered response rates
above 60% whereas the response rate for the less popu-
lated districts was 45% or lower.
Table 3.
Response Rate by Grade Level
Grade Level Respondent
Total N
Educator
Total N
Response
Rate
Elementary 9,463 16,533 57%
Middle 3,202 5,379 60%
High School 5,114 10,179 50%
Special 487 1,521 32%
Total 18,266 33,612 54%
Table 2.
Percent of Total Respondents by Role
Educator Role Percentage of Total
Respondents (N)
Teacher 91% (16,651)
Principal 2% (353)
Assistant Principal 1% (192)
Other Educational Professional 6% (1,070)
Total 100% (18,266)
*Note. The respondent category “Teachers” includes
instructional coaches, department heads, literacy specialists,
etc. The respondent category “Other Education Professionals”
includes school counselors, school psychologists, social
workers, etc. The respondent category “Educational Support
Personnel” includes instructional or clerical support personnel.
Table 5.
Response Rate by Urban Locale
Urban
Locale
Respondent
Total N
Educator
Total N
Response
Rate
City 7,098 11,215 63%
Suburb 5,554 8,913 62%
Town 3,923 8,741 45%
Rural 1,661 4,615 36%
Total 18,236 33,484 54%
*Note. Three districts did not have an associated Urban
Locale (“Multnomah ESD”, “Oregon Department of
Education” and “ODE YCEP District”)
Table 4.
Response Rate by District Diversity
Grade Level Respondent
Total N
Educator
Total N
Response
Rate
High Diversity
(>40% non-white) 10,312 15,034 69%
Low Diversity
(<40% non-white) 7,954 18,578 43%
Total 18,266 33,612 54%
2016 TELL Oregon: District Level Teacher Working Conditions and Student Diversity
5
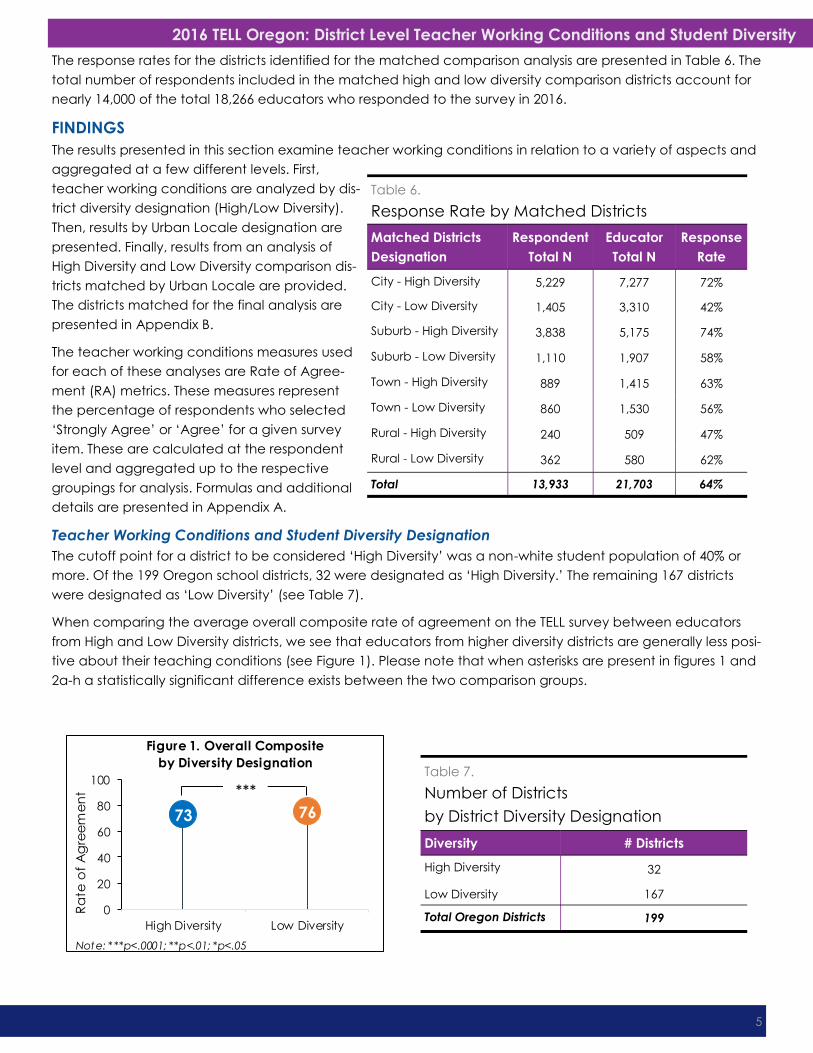
The response rates for the districts identified for the matched comparison analysis are presented in Table 6. The
total number of respondents included in the matched high and low diversity comparison districts account for
nearly 14,000 of the total 18,266 educators who responded to the survey in 2016.
FINDINGS
The results presented in this section examine teacher working conditions in relation to a variety of aspects and
aggregated at a few different levels. First,
teacher working conditions are analyzed by dis-
trict diversity designation (High/Low Diversity).
Then, results by Urban Locale designation are
presented. Finally, results from an analysis of
High Diversity and Low Diversity comparison dis-
tricts matched by Urban Locale are provided.
The districts matched for the final analysis are
presented in Appendix B.
The teacher working conditions measures used
for each of these analyses are Rate of Agree-
ment (RA) metrics. These measures represent
the percentage of respondents who selected
‘Strongly Agree’ or ‘Agree’ for a given survey
item. These are calculated at the respondent
level and aggregated up to the respective
groupings for analysis. Formulas and additional
details are presented in Appendix A.
Teacher Working Conditions and Student Diversity Designation
The cutoff point for a district to be considered ‘High Diversity’ was a non-white student population of 40% or
more. Of the 199 Oregon school districts, 32 were designated as ‘High Diversity.’ The remaining 167 districts
were designated as ‘Low Diversity’ (see Table 7).
When comparing the average overall composite rate of agreement on the TELL survey between educators
from High and Low Diversity districts, we see that educators from higher diversity districts are generally less posi-
tive about their teaching conditions (see Figure 1). Please note that when asterisks are present in figures 1 and
2a-h a statistically significant difference exists between the two comparison groups.
Table 6.
Response Rate by Matched Districts
Matched Districts
Designation
Respondent
Total N
Educator
Total N
Response
Rate
City - High Diversity 5,229 7,277 72%
City - Low Diversity 1,405 3,310 42%
Suburb - High Diversity 3,838 5,175 74%
Suburb - Low Diversity 1,110 1,907 58%
Town - High Diversity 889 1,415 63%
Town - Low Diversity 860 1,530 56%
Rural - High Diversity 240 509 47%
Rural - Low Diversity 362 580 62%
Total 13,933 21,703 64%
Table 7.
Number of Districts
by District Diversity Designation
Diversity # Districts
High Diversity 32
Low Diversity 167
Total Oregon Districts 199
73 76
0
20
40
60
80
100
High Diversity Low Diversity
Ra
te o
f A
gre
em
en
t
Figure 1. Overall Composite
by Diversity Designation
Note: ***p<.0001; **p<.01; *p<.05
***

2016 TELL Oregon: District Level Teacher Working Conditions and Student Diversity
6
79 81
0
20
40
60
80
100
High Diversity Low Diversity
Ra
te o
f A
gre
em
en
tFigure 2a. Community Support &
Involvement by Diversity Designation
Note: ***p<.0001; **p<.01; *p<.05
***
77 81
0
20
40
60
80
100
High Diversity Low Diversity
Ra
te o
f A
gre
em
en
t
Figure 2b. Teacher Leadership
by Diversity Designation
Note: ***p<.0001; **p<.01; *p<.05
***
75 77
0
20
40
60
80
100
High Diversity Low Diversity
Ra
te o
f A
gre
em
en
t
Figure 2c. Facilites & Resources
by Diversity Designation
Note: ***p<.0001; **p<.01; *p<.5
***79 80
0
20
40
60
80
100
High Diversity Low Diversity
Ra
te o
f A
gre
em
en
t
Figure 2d. Instructional Practices &
Support by Diversity Designation
Note: ***p<.0001; **p<.01; *p<.05
**
78 80
0
20
40
60
80
100
High Diversity Low Diversity
Ra
te o
f A
gre
em
en
t
Figure 2e. School Leadership
by Diversity Designation
Note: ***p<.0001; **p<.01; *p<.05
***
69 68
0
20
40
60
80
100
High Diversity Low Diversity
Ra
te o
f A
gre
em
en
t
Figure 2f. Professional Development
by Diversity Designation
Note: ***p<.0001; **p<.01; *p<.05
*
76 81
0
20
40
60
80
100
High Diversity Low Diversity
Ra
te o
f A
gre
em
en
t
Figure 2g. Managing Student Conduct
by Diversity Designation
Note: ***p<.0001; **p<.01; *p<.05
***
53 57
0
20
40
60
80
100
High Diversity Low Diversity
Ra
te o
f A
gre
em
en
t
Figure 2h. Use of Time
by Diversity Designation
Note: ***p<.0001; **p<.01; *p<.05
***

2016 TELL Oregon: District Level Teacher Working Conditions and Student Diversity
7
When examining each of the specific constructs that encompass teacher working conditions, it is clear that
the difference between high and low diversity districts varies depending on the area of focus (see Figures 2a-
2h). For instance, teachers in low diversity districts report particularly more positively about teaching conditions
related to Managing Student Conduct and Use of Time. On the other hand, viewing through this lens also re-
veals that teaching conditions are very similar in specific areas such as Instructional Practices & Support and
Community Support & Involvement and, in one area (Professional Development), educators from high diversi-
ty districts reported more positively than respondents from low diversity districts.
Teacher Working Conditions and Urban Locale
The data in Table 8 show that a higher proportion of districts are in less-populated areas. This finding is compa-
rable to the large disparity between the number of High and Low diversity districts presented in Table 7.
When examining the teaching conditions at the urban locale level, there is no drastic difference in terms of
the overall teaching conditions composite score. Each urban locale designation reported either a 74 or 75
percent rate of agreement in terms of the overall composite (see Figure 3). However, when analyzing the da-
ta by urban locale, variation is found between urban locales around specific teaching conditions. In particu-
lar, the widest variance across locales is seen in the constructs related to Community Support & Involvement,
Managing Student Conduct, and Use of Time. Furthermore, it appears that some urban locales report better
conditions in some areas, but lower in others (see Figures 4a-h). For example, respondents from urban districts
reported the most positively regarding School Leadership and Professional Development but least positively
about Facilities & Resources, Managing Student Conduct, and Use of Time. This finding seems to support the
idea that educator needs vary by urban locale. Please note that when asterisks are present in figures 3 and 4a
-h there is a statistically significant difference among the comparison groups.
Table 8.
Number of Districts by Urban Locale
Urban Locale # Districts
City 11
Suburb 19
Town 55
Rural 111
Missing/Not Coded 3
Total 199
74 75 74 75
0
20
40
60
80
100
City Suburb Town Rural
Ra
te o
f A
gre
em
en
t
Figure 3. Overall Composite
by Urban Locale
Note: ***p<.0001; **p<.01; *p<.05
*
81 8275 78
0
20
40
60
80
100
City Suburb Town Rural
Ra
te o
f A
gre
em
en
t
Figure 4a. Community Support &
Involvement by Urban Locale
Note: ***p<.0001; **p<.01; *p<.05
***
79 79 77 80
0
20
40
60
80
100
City Suburb Town Rural
Ra
te o
f A
gre
em
en
t
Figure 4b. Teacher Leadership
by Urban Locale
Note: ***p<.0001; **p<.01; *p<.05
**

2016 TELL Oregon: District Level Teacher Working Conditions and Student Diversity
8
Teacher Working Conditions and Matched Student Diversity Designation by Urban Locale
The Oregon Department of Education partnered with NTC to identify 50 districts across each of the Diversity
Designation/Urban Locales to be compared. Half (25) of the districts from each of the four urban locales are
high diversity districts and the comparison group are low diversity. The specific districts included are presented
in Appendix B.
As shown in Figure 5, respondents from the high diversity groups consistently report less positive teaching con-
ditions in terms of the overall teaching conditions composite. The overall composite rates of agreement are
relatively stable across urban locales with the exception of the Town-Comparison group which is five percent-
75 76 77 76
0
20
40
60
80
100
City Suburb Town Rural
Ra
te o
f A
gre
em
en
tFigure 4c. Facilities & Resources
by Urban Locale
Note: ***p<.0001; **p<.01; *p<.05
**
79 80 79 79
0
20
40
60
80
100
City Suburb Town Rural
Ra
te o
f A
ge
rem
en
t
Figure 4d. Instructional Practices &
Support by Urban Locale
Note: ***p<.0001; **p<.01; *p<.05
**
79 79 79 78
0
20
40
60
80
100
City Suburb Town Rural
Ra
te o
f A
gre
em
en
t
Figure 4e. School Leadership
by Urban Locale
Note: ***p<.0001; **p<.01; *p<.05
69 69 68 66
0
20
40
60
80
100
City Suburb Town Rural
Ra
te o
f A
gre
em
en
t
Figure 4f. Professional Develeopment by
Urban Locale
Note: ***p<.0001; **p<.01; *p<.05
**
76 78 80 82
0
20
40
60
80
100
City Suburb Town Rural
Ra
te o
f A
gre
em
en
t
Figure 4g. Managing Student Conduct
by Urban Locale
Note: ***p<.0001; **p<.01; *p<.05
***
52 54 57 62
0
20
40
60
80
100
City Suburb Town Rural
Ra
te o
f A
gre
em
en
t
Figure 4h. Use of Time
by Urban Locale
Note: ***p<.0001; **p<.01; *p<.05
***

2016 TELL Oregon: District Level Teacher Working Conditions and Student Diversity
9
age points lower than the city or suburban comparison groups (78%) and three points below Rural-
Comparison districts (76%). Please note that when asterisks are present in figures 5 and 6a-h a statistically signif-
icant difference exists between the paired comparison groups.
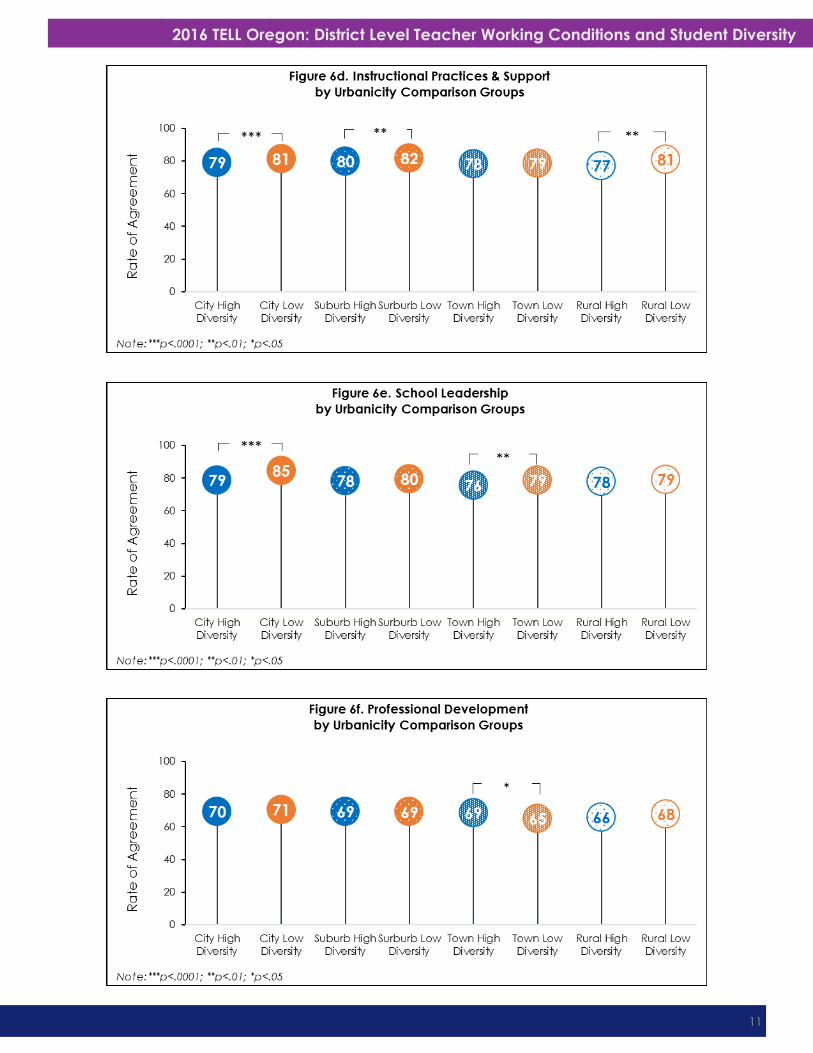
Figures 6a through 6h present the results for each group by con-
struct. Of the four matched groups, the biggest average differ-
ence across all constructs was between the City—High Diversity
and the City—Comparison group (-5%). Of the eight constructs,
Managing Student Conduct represents the largest difference (-
10%) between the two City groups. Similarly, Managing Student
Conduct also represents the greatest difference (-8%) between
the Rural groups. The biggest difference (-8%) between Suburban
–High Diversity and Suburban–Comparison groups is around Use
of Time.
The outlier of these comparisons is revealed when analyzing the
Town level results. First, there is a much smaller average differ-
ence (-1%) between Town–High Diversity and Town–Comparison
groups, suggesting that perhaps teaching conditions are very
similar in these districts regardless of diversity level. Furthermore,
respondents from the Town–High Diversity group responded more
positively than their comparison group in the areas of Facilities &
Resources (+6%), Professional Development (+4%), Managing Stu-
dent Conduct (+2%), and Use of Time (+2%).
The biggest difference at the construct level across all groups is in
the area of Community Support & Involvement with an average
of seven percent difference between High Diversity districts and their comparison groups. Other notable areas
in which results suggest a consistent difference between High Diversity districts and their comparisons are Man-
aging Student Conduct (-5%) and Teacher Leadership (-5%).
Table 9.
Number of Districts
by Matched District Designation
Matched District
Designation # Districts
City - High Diversity 5
City - Low Diversity 5
Suburb - High Diversity 6
Suburb - Low Diversity 5
Town - High Diversity 10
Town - Low Diversity 11
Rural - High Diversity 4
Rural - Low Diversity 4
Total 50
*Note: See Table 6 for N Counts
2016 TELL Oregon: District Level Teacher Working Conditions and Student Diversity
10
2016 TELL Oregon: District Level Teacher Working Conditions and Student Diversity
11

2016 TELL Oregon: District Level Teacher Working Conditions and Student Diversity
12
SUMMARY
In general, teaching conditions are less positive in High Diversity districts (see Figure 1). In particular, results sug-
gest that High Diversity districts need more support around the area of Managing Student Conduct than do
districts with lower levels of diversity (see Figure 2g). Generally speaking, there are no large differences be-
tween urban locales when comparing the teaching conditions composite. However, results suggest that dif-
ferences exist between urban locales in the areas of Community Support & Involvement, Managing Student
Conduct, and Use of Time. Whereas educators from less populated areas tend to report more positive teach-
ing conditions around Managing Student Conduct (see Figure 4g) and Use of Time (see Figure 4h), the oppo-
site trend is found for Community Support & Involvement (see Figure 4a).
Based on the results of the comparison groups analysis, it appears that the teaching conditions in the selected
comparison (low diversity) districts are more positive across urban locales with the exception of the compari-
son at the town level (difference in overall composite of 1%). Selected districts under the City urban locale
designation represent the greatest discrepancy in teaching conditions between high and low diversity districts
(average difference of 5% overall). In particular, districts in the City—High Diversity group appear to need the
most support around Managing Student Conduct, an area representing a 10% gap between the low and high

2016 TELL Oregon: District Level Teacher Working Conditions and Student Diversity
13
diversity City groups (see Figure 6g). Furthermore, results suggest that high diversity districts across all urban lo-
cales could use support related to Community Support & Involvement (see Figure 5a—average difference of
7%). Additionally, Managing Student Conduct (see Figure 5g) and Teacher Leadership (see Figure 5b) appear
to be areas that high diversity districts could particularly use support. These findings are particularly pertinent
when paired with the findings of the 2014 TELL Oregon Student Achievement Outcomes report which identifies
Community Support & Involvement and Managing Student Conduct as teaching condition areas which most
highly correlate with student achievement outcomes (New Teacher Center, 2015).
LIMITATIONS
One limitation of this study is the relatively low survey response rate for the less-densely populated districts
(Town—45% and Rural—35%). Although the voices of more than 18,000 educators were captured overall, the
effort fell short in the more rural areas (see Table 5). Ideally, the response rate would be higher overall (54%
overall) but, particularly, an increase in response rate for the less-populated areas would allow for greater
confidence that the inferences drawn from these locales are truly representative of the respective popula-
tions. Given that there appears to be a relationship between the population density of a school district and
the level of diversity, the response rate issue is relevant in terms of districts with lower levels of diversity (see Ta-
ble 4).

2016 TELL Oregon: District Level Teacher Working Conditions and Student Diversity
14
REFERENCES
Borman, G., & Dowling, N. (2008). Teacher attrition and retention: A meta-analytic and narrative review of the
research. Review of Educational Research, 78(3), 367–409.
Boyd, D., Grossman, P., Ing, M., Lankford, H., Loeb, S., & Wyckoff, J. (2011). The influence of school administra-
tors on teacher retention decisions. American Educational Research Journal, 48(2), 303–333.
Buckley, J., Schneider, M., & Shang, Y. (2004). The effects of school facility quality on teacher retention in ur-
ban school districts. Chestnut Hill, MA: National Clearinghouse for Educational Facilities.
Bryk, A. S., & Schneider, B. (2002). Trust in schools: A core resource for improvement. New York: Russell Safe
Foundation.
Cortina, J. (2002). Big things have small beginnings: An assortment of “minor” methodological misunderstand-
ings. Journal of Management, 28(3), 339–362.
Ferguson, R., (with Hirsch, E.) (2014). How working conditions predict teaching quality and student outcomes.
In T. J. Kane, K. A. Kerr, and R. C. Pianta (Eds.), Designing teacher evaluation systems: New guidance
from the Measures of Effective Teaching project (pp. 332–381). San Francisco: Jossey-Bass.
IDRA Research Technology Group. (n.d.) Annotated SPSS output factor analysis. Retrieved from http://
www.ats.ucla.edu/stat/spss/output/factor1.htm
Johnson, S., Kraft, M., & Papay, J. (2011). How context matters in high-need schools: The effects of teachers’
working conditions on their professional satisfaction and their students’ achievement. Teachers College
Record, 114(10), 1–39.
Johnson, S. M. (2006, July). The workplace matters: Teacher quality, retention, and effectiveness. NEA Working
Paper. Washington, DC: National Education Association.
Johnson, S. M., & the Project on the Next Generation of Teachers. (2004). Finders and keepers: Helping new
teachers survive and thrive in our schools. San Francisco: Jossey-Bass.
Kraft, M. A., & Papay, J. P. (2014, Jan. 30). Can professional environments in schools promote teacher develop-
ment? Explaining heterogeneity in returns to teaching experience. Educational Evaluation and Policy
Analysis, 36(4), 476–500.
Ladd, H. (2009). Teachers’ perceptions of their working conditions: How predictive of policy relevant out-
comes? CALDER Working Paper 33. Washington, DC: National Center for Analysis of Longitudinal Data
in Education.
Leana, C. R., & Pil, F. K. (2006). Social capital and organizational performance: Evidence from urban public
schools. Organization Science, 17(3), 353–366.
New Teacher Center. (2015). 2014 TELL Oregon Survey Student Achievement and Teacher Retention Analyses.
Santa Cruz, CA: New Teacher Center. Retrieved from https://telloregon.org/uploads/File/OR%
20student%20ach%20&%20teach%20retent%20brief%20final_feb_2015.pdf

2016 TELL Oregon: District Level Teacher Working Conditions and Student Diversity
15
Loeb, S., Darling-Hammond, L., & Luczak, J. (2005). How teaching conditions predict teacher
turnover in California schools. Peabody Journal of Education, 80(3), 44–70.
McLaughlin, M. W., & Talbert, J. E. (2001). Professional communities and the work of high school teaching.
Chicago: University of Chicago Press.
Pogodzinski, B., Youngs, P., Frank, K., & Belman, D. (2012). Administrative climate and
novice teachers’ intent to remain teaching. The Elementary School Journal, 113(2), 252–275.
Steele, J., Hamilton, L., & Stecher, B. (2010). Incorporating student performance measures
into teacher evaluation systems. Santa Monica, CA: RAND Corporation.

2016 TELL Oregon: District Level Teacher Working Conditions and Student Diversity
16
APPENDIX A
TELL Items, Constructs, and Composite Calculations
Table A1.
TELL Constructs and Associated Items
Construct Survey Items
Use of Time—Available
time to plan, to collabo-
rate, to provide instruc-
tion, and to eliminate bar-
riers in order to maximize
instructional time during
the school day
Class sizes are reasonable such that teachers have the time available
to meet the needs of all students.
Teachers are allowed to focus on educating students with minimal in-
terruptions.
The non-instructional time provided for teachers in my school is suffi-
cient.
Efforts are made to minimize the amount of routine paperwork teach-
ers are required to do.
Teachers have sufficient instructional time to meet the needs of all stu-
dents.
Teachers are protected from duties that interfere with their essential
role of educating students.
Teachers have time available to collaborate with colleagues.
Facilities and Resources—
Availability of instructional,
technology, office, com-
munication, and school
resources to teachers
Teachers have sufficient access to appropriate instructional materials.
Teachers have sufficient access to instructional technology, including
computers, printers, software and internet access.
Teachers have access to reliable communication technology, includ-
ing phones, faxes and email.
Teachers have sufficient access to office equipment and supplies such
as copy machines, paper, pens, etc.
Teachers have sufficient access to a broad range of professional sup-
port personnel.
The school environment is clean and well maintained.
Teachers have adequate space to work productively.
The physical environment of classrooms in this school supports teaching
and learning.
The reliability and speed of Internet connections in this school are suffi-
cient to support instructional practices.

2016 TELL Oregon: District Level Teacher Working Conditions and Student Diversity
17
APPENDIX A
Community Support &
Involvement—
Community and parent/
guardian communica-
tion and influence in the
school
Parents/guardians are influential decision makers in this school.
This school maintains clear, two-way communication with parents/
guardians and the community.
This school does a good job of encouraging parent/guardian involve-
ment.
Teachers provide parents/guardians with useful information about stu-
dent learning.
Parents/guardians know what is going on in this school.
Parents/guardians support teachers, contributing to their success with
students.
Community members support teachers, contributing to their success
with students.
The community we serve is supportive of this school.
Managing Student Con-
duct—Policies and prac-
tices to address student
conduct issues and en-
sure a safe school envi-
ronment
Students at this school understand expectations for their conduct.
Students at this school follow rules of conduct.
Policies and procedures about student conduct are clearly understood
by the faculty.
School administrators consistently enforce rules for student conduct.
School administrators support teachers' efforts to maintain discipline in
the classroom.
Teachers consistently enforce rules for student conduct.
The faculty work in a school environment that is safe.
Teacher Leadership—
Teacher involvement in
decisions that impact
classroom and school
practices
Teachers are recognized as educational experts.
Teachers are trusted to make sound professional decisions about in-
struction.
Teachers are relied upon to make decisions about educational issues.
Teachers are encouraged to participate in school leadership roles.
The faculty has an effective process for making group decisions to solve
problems.
In this school we take steps to solve problems.
Teachers are effective leaders in this school.

2016 TELL Oregon: District Level Teacher Working Conditions and Student Diversity
18
APPENDIX A
School Leader-
ship—The ability
of school leader-
ship to create
trusting, support-
ive environments
and address
teacher concerns
The faculty and leadership have a shared vision.
There is an atmosphere of trust and mutual respect in this school.
Teachers feel comfortable raising issues and concerns that are important to
them.
The school leadership consistently supports teachers.
Teachers are held to high professional standards for delivering instruction.
The school leadership facilitates using data to improve student learning.
Teacher performance is assessed objectively.
Teachers receive feedback that can help them improve teaching.
Teachers in this school receive feedback about their teaching on an ongoing
basis.
The procedures for teacher evaluation are consistent.
The school improvement team provides effective leadership at this school.
The faculty are recognized for accomplishments.
The school leadership communicates clear expectations to students and par-
ents.
Professional De-
velopment—
Availability and
quality of learning
opportunities for
educators to en-
hance their
teaching
Sufficient resources are available for professional development in my school.
An appropriate amount of time is provided for professional development.
Professional development offerings are data driven.
Professional learning opportunities are aligned with the school’s improvement
plan.
Professional development is differentiated to meet the needs of individual
teachers.
Professional development deepens teachers' content knowledge.
Teachers are encouraged to reflect on their own practice.
In this school, follow up is provided from professional development.
Professional development provides ongoing opportunities for teachers to work
with colleagues to refine teaching practices.
Professional development is evaluated and results are communicated to
teachers.
Professional development enhances teachers' ability to implement instruction-
al strategies that meet diverse student learning needs.
Professional development enhances teachers' abilities to improve student
learning.
Professional development in this school supports teachers in developing forma-
tive assessments aligned to standards.
2016 TELL Oregon: District Level Teacher Working Conditions and Student Diversity
19
APPENDIX A
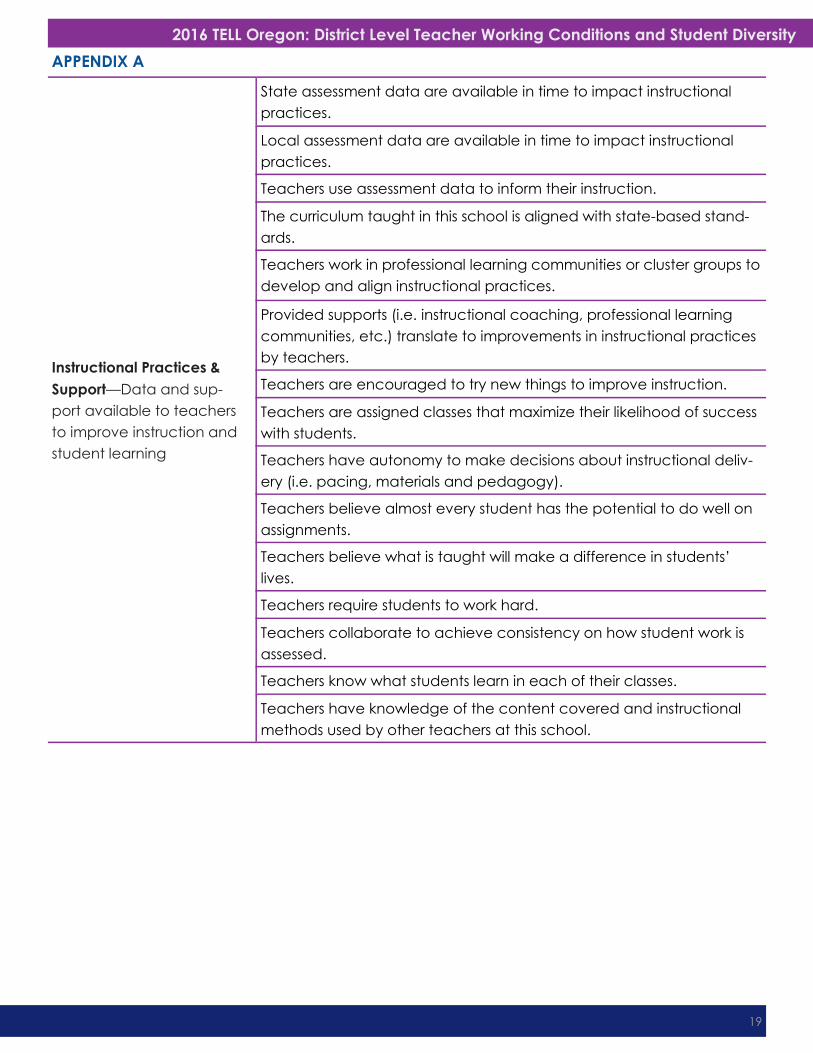
Instructional Practices &
Support—Data and sup-
port available to teachers
to improve instruction and
student learning
State assessment data are available in time to impact instructional
practices.
Local assessment data are available in time to impact instructional
practices.
Teachers use assessment data to inform their instruction.
The curriculum taught in this school is aligned with state-based stand-
ards.
Teachers work in professional learning communities or cluster groups to
develop and align instructional practices.
Provided supports (i.e. instructional coaching, professional learning
communities, etc.) translate to improvements in instructional practices
by teachers.
Teachers are encouraged to try new things to improve instruction.
Teachers are assigned classes that maximize their likelihood of success
with students.
Teachers have autonomy to make decisions about instructional deliv-
ery (i.e. pacing, materials and pedagogy).
Teachers believe almost every student has the potential to do well on
assignments.
Teachers believe what is taught will make a difference in students’
lives.
Teachers require students to work hard.
Teachers collaborate to achieve consistency on how student work is
assessed.
Teachers know what students learn in each of their classes.
Teachers have knowledge of the content covered and instructional
methods used by other teachers at this school.

2016 TELL Oregon: District Level Teacher Working Conditions and Student Diversity
20
APPENDIX A
Composite and Construct Average Calculations
The construct averages and overall composite average are calculated at the respondent level and then ag-
gregated to the school level for these analyses. All of the items included are on the same Likert agreement
scale where 1 = Strongly Disagree, 2 = Disagree, 3 = Agree, 4 = Strongly Agree, and 5 = Don’t Know. For these
calculations, responses of “Strongly Disagree” and “Disagree” were coded as 0, responses of “Agree” and
“Strongly Agree” were coded as 1, and responses of “Don’t Know” were coded as missing.
The construct averages were then calculated by averaging the coded responses for the items associated
with each given construct (shown in Table 1A) at the respondent level. The equation (1) for the respondent-
level calculation is shown below.
The Overall Composite Average was calculated by averaging the Construct Averages at the respondent lev-
el. The equation (2) for the respondent-level Overall Composite is shown below.
Once calculated at the respondent level, these figures are then averaged across respondents at the school
level. The school-level equations are shown below.

2016 TELL Oregon: District Level Teacher Working Conditions and Student Diversity
21
APPENDIX B
District Groupings Matched by Diversity Level and Urban Locale
Table B1.
TELL Oregon 2016 Diversity Analysis—District Groupings
Matched District Designation School District District
Response Rate
Number of
Respondents
City—High Diversity
David Douglas SD 40 92.6 586
Hillsboro SD 1J 35.0 411
Parkrose SD 3 18.9 36
Portland SD 1J 72.7 2,232
Salem-Keizer SD 24J 88.9 1,964
City—Low Diversity
Bend-LaPine Administrative SD 1 70.3 680
Bethel SD 52 28.8 89
Corvallis SD 509J 52.8 195
Eugene SD 4J 22.5 206
Medford SD 549C 31.3 235
Suburb—High Diversity
Beaverton SD 48J 85.8 1,976
Centennial SD 28J 58.5 224
Forest Grove SD 15 38.3 133
Gresham-Barlow SD 10J 71.4 479
Reynolds SD 7 58.7 442
Tigard-Tualatin SD 23J 81.2 584
Central Point SD 6 70.6 154
Suburb—Low Diversity
Lake Oswego SD 7J 56.6 228
Oregon City SD 62 51.8 242
Sherwood SD 88J 86.2 232
West Linn-Wilsonville SD 3J 46.2 254

2016 TELL Oregon: District Level Teacher Working Conditions and Student Diversity
22
APPENDIX B
Matched District Designation School District
District
Response Rate
Number of
Respondents
Town—High Diversity
Brookings-Harbor SD 17C 57.7 45
Gervais SD 1 36.7 22
Hermiston SD 8 85.3 255
Jefferson County SD 509J 51.8 102
Milton-Freewater Unified SD 7 51.5 51
Mt Angel SD 91 71.7 38
North Wasco County SD 21 50.0 95
Stanfield SD 61 85.3 29
Umatilla SD 6R 47.1 40
Woodburn SD 103 66.3 212
Town—Low Diversity
Canby SD 86 54.3 138
Coos Bay SD 9 65.7 111
Crook County SD 54.2 83
Grants Pass SD 7 46.4 143
Junction City SD 69 58.2 64
Oregon Trail SD 46 69.8 157
Reedsport SD 105 37.1 13
Riddle SD 70 60.0 18
Seaside SD 10 50.0 49
Sheridan SD 48J 56.9 37
Siuslaw SD 97J 56.6 47
Rural—High Diversity
Dayton SD 8 66.2 47
Hood River County SD 36.1 88
North Marion SD 15 63.4 71
Nyssa SD 26 41.5 34
Rural—Low Diversity
Rainier SD 13 65.5 38
Silver Falls SD 4J 61.2 156
Sisters SD 6 53.2 42
South Lane SD 45J3 67.0 126