2016 traffic safety report - larimer county · 3 2016 traffic safety report. general trends -crash...
TRANSCRIPT

1 2016 Traffic Safety Report
Engineering Department
2016 Traffic Safety
Report

2 2016 Traffic Safety Report
Introduction This report covers the unincorporated roadways in Larimer County that the County has responsibility to
maintain. Unincorporated Larimer County has more than 900 miles of roadways, 80 in urban areas sur-
rounding communities, and 820 in the rural portions of the county.
Larimer County strives to make roadways as safe as
possible. The Traffic Safety Program Goal is to re-
duce the number and severity of crashes on our
roadways.
Focus on Fatal Crashes: The Federal Highway
Administration (FHWA) adopted a policy formulat-
ed in 2009 called Toward Zero Deaths: A National
Strategy on Highway Safety. The goal of zero
deaths was set for something to strive towards. In 2014
the national fatality rate did drop by 2.7 percent com-
pared to the year before. However, that trend has not
prevailed in 2015 which saw fatalities rise 6%.
The Colorado Department of Transportation (CDOT)
also adopted this national policy and set performance
measures to achieve this goal. The Colorado Strategic
Highway Safety Plan, October 2014, sites that
“Colorado has made tremendous progress in reducing
the deaths and preventable injuries caused by traffic
crashes. In the last 10 years (2002 to 2012), traffic-
related fatalities in Colorado dropped 36 percent and
serious injuries declined 35%.” However, since 2013,
fatal crashes have steadily increased with a 10% in-
crease between 2015 and 2016.
Larimer County saw 7 fatal crashes resulting in 7 fatali-
ties, in 2016. While the number of fatalities in Larimer
County has remained flat over the last two years, this
has not been the Federal and State trend.
Larimer County injury crashes increased by nearly 16%
in 2016 moving away from the Traffic Safety Program
Goal.
This report summarizes crashes in unincorporated Lar-
imer by a variety of factors that are focused on areas of
interest and identification of trends to be addressed
through safety improvements.
2016 Colorado Deaths
Caused by…
Cardiovascular Disease1 9,564
Influenza & Pneumonia2
659
Motor Vehicle Crash3 607
Avalanche4
5
Unincorporated Larimer County Roadway Crashes
7
Lightning Strike5 2
Sources: 1http://www.chd.dphe.state.co.us/Resources/vs/2015/Colorado.pdf; 2http://wonder.cdc.gov/ucd-icd10.html; 3https://www.codot.gov/library/traffic/safety-crash-data/fatal-crash-data-city-county/2016-monthly-fatals/view; 4http://www.avalanche.org/accidents.php?date=2015-2016; 5http://www.lightningsafety.noaa.gov/fatalities.shtml

3 2016 Traffic Safety Report
General Trends - Crash Information
Fatal crashes: 7 crashes and 7 fatalities same as 2015
Injury crashes: Increased by 16%
Property Damage Only: Decreased by 4.5%
2016 CRASH TRENDS
There were an average of 425 crashes on unincorporated roads in Larimer County between 2012 and
2016. The 2016 crashes increased by about 9% compared to the 5 year average. In 2016, the total
number of crashes decreased slightly by about 1% compared to 2015, flattening out the upward
trend since 2012.
There is generally a correlation between an increase in Vehicle Miles Traveled (VMT) and the number
of crashes. Approximately 8 million more miles were traveled in 2016 compared to 2015, a 2.7% in-
crease. The 2.7% increase in miles traveled exceeded the 0.8% growth in population, estimated by the
Colorado Department of Local Affairs. However, the rate of growth for both population and VMT are
less than previous years.

4 2016 Traffic Safety Report
Overall This Traffic Safety Annual Report summarizes the general trends in roadway safety, analyzes specific areas
of interest, and monitors ongoing traffic safety efforts in the County. Crash data are obtained from Colorado
State Patrol crash reports.
The chart below shows the number of crashes in 2016 relative to a variety of factors. Crashes may be listed
in more than one category. The table below shows the trends in each category.
Unincorporated Larimer County Crashes – 2016
Compared to 2015,
Roadway Departure crashes continue
to be the most common in Larimer
County, and increased 4%
Driving Under the Influence (DUI)
are down 7%
Distracted dr iving is up 4%
Crashes that have an animal involved
increased 9%
Older Drivers (60+) were involved in
4% fewer crashes in 2016 than the pre-
vious year, going against the 5 year
trend of steady increase.
Crash Characteristics% Change between
2015 and 2016
2016
Total Crashes
Roadway Departures 4% 254
Intersection Related 12% 197
Motorcyclists 0% 44
Younger Drivers -7% 68
Bicyclists 0% 7
Alcohol/Impaired -7% 42
Older Drivers -4% 66
Distracted 4% 79
No Seat Belt 50% 36
Snow/Ice -10% 60
Animals 9% 35
Commercial Trucks 83% 11
Work Zone -25% 3
Railroad Crossing -100% 0
Pedestrians 0% 1
5 2016 Traffic Safety Report
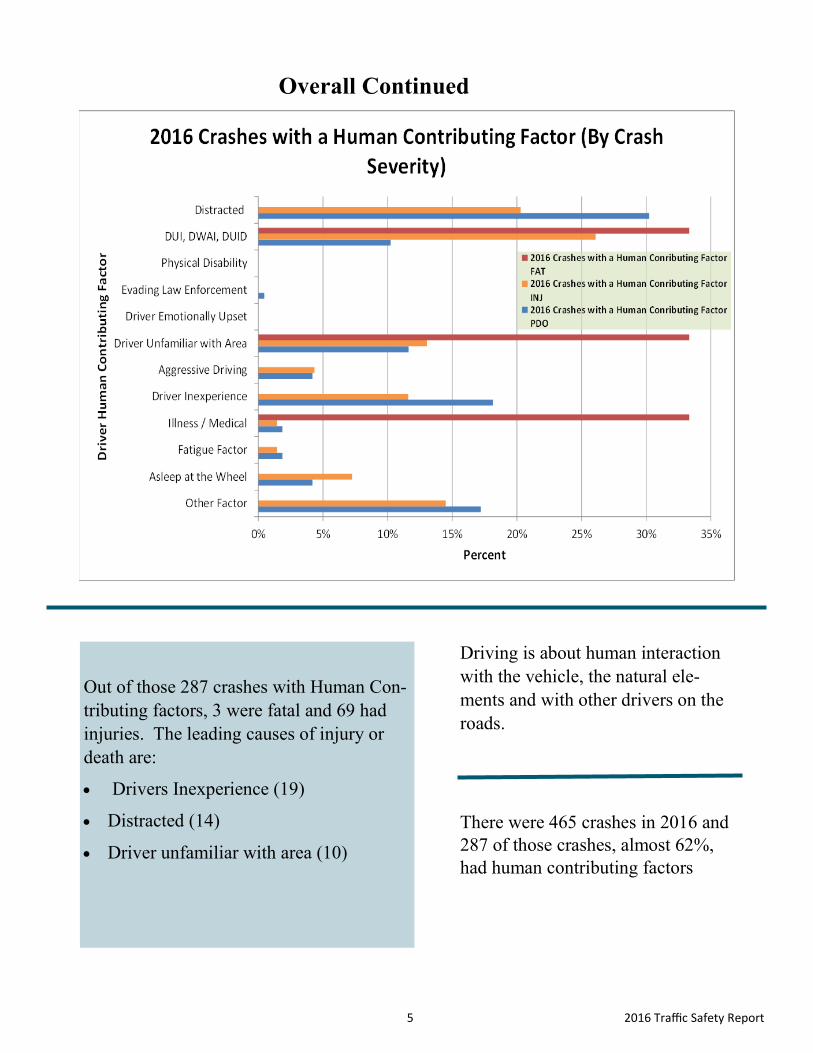
Driving is about human interaction
with the vehicle, the natural ele-
ments and with other drivers on the
roads.
There were 465 crashes in 2016 and
287 of those crashes, almost 62%,
had human contributing factors
Overall Continued
Out of those 287 crashes with Human Con-
tributing factors, 3 were fatal and 69 had
injuries. The leading causes of injury or
death are:
Drivers Inexperience (19)
Distracted (14)
Driver unfamiliar with area (10)

6 2016 Traffic Safety Report
Crash Rates
To account for varying amounts of traffic, a measure of crash RATE is used in addition to
crash NUMBERS. A crash rate is expressed in the number of crashes per 100 million ve-
hicles miles traveled.
This graphic shows the crash rate by severity, and indicates that the property damage only
crash rate decreased 8% and the injury crash rate increased 4% respectively in the past
year. Fatal crash rates decreased slightly from the previous year. This decrease is due to
the higher number of vehicle miles traveled while the number of fatal crashes remained
steady. This trend is contrary to state and national trends, where fatal crash rates have in-
creased over the last few years.
Cities and towns do not report crash rates making it difficult to compare crash information
within Larimer County. The Colorado Problem Identification Report, Colorado Department
of Transportation, Fiscal Year 2016, shows the average 6 year (2009-2014) statewide injury
crash rate per 100 million VMT is 20.92 while Larimer County (2011-2016) is 28.2.
The crash rates on the unincorporated County road system are higher than the State system
that includes both interstate and state highway systems.

7 2016 Traffic Safety Report
Distracted and Impaired Crashes
In 2016, 121 crashes were the result of distracted or impaired drivers, nearly identical to the previous year.
These crashes resulted in 62 injuries and 1 fatality.
According to CDOT, Distracted driving fatalities are increasing in Colorado. In 2015, 68 (13 percent) of the 546 Colorado traffic fatalities were caused by distracted driving. Most notably, cell phone distraction increased by 26% over 2015.
Ninety-eight percent of national survey respondents know distracted driving is dangerous; nearly 75 percent admit to having done it. — Center for Internet and Technology Addiction

8 2016 Traffic Safety Report
Fatal Crash Review
There were seven fatal crashes on the unincorporated County road system in 2016 that resulted in 7 fatalities,
matching 2015 numbers. The generally low number of fatalities makes it difficult to establish statistically sig-
nificant details about the crashes. Using the total number of fatalities in the past five years (2012-2016), gen-
eralities or trends can be noted.
Sources: National Highway Traffic Safety Administration (2015) Colorado: NHTSA Fatality Analysis Reporting System by State (2015) and CDOT Fatal Crash Data (2016) Larimer County value from: County records (2016)
Overturn
59%
Motorcycles
32%
DUI
32%
Male
86%
Note: Fatality rates are based on the most recently available data for a full calendar year. The US and Colorado rates are based on
2015 data. Larimer County’s fatality rate is based on 2016 data.
5 of the 7 fatal crashes involved roadway departures
Overturning was the most harmful event in 5 of the 7 fatal crashes
58% are Exceeding a Safe Speed or Lane Violation

9 2016 Traffic Safety Report
2016 Fatal Crash Descriptions/Locations
County Rd 25G 760 feet west of CR 23 - 1/13/2016: Driver of an SUV experienced a medical emer-gency, causing the vehicle to travel off the left side of the road, striking a tree, rock, and then over-turning; resulting in one fatality. This crash occurred on a curve on-grade with dark and unlighted conditions.
County Rd 74E 0.34 miles west of Phantom Ranch Rd (Red Feather Lakes area) 2/22/2016: A sin-
gle vehicle crash, the driver lost control in snowy conditions around a sweeping right hand curve on a downgrade. The vehicle traveled down an embankment, where the driver was ejected, and the vehicle rolled one and a half times, including rolling over the top of the driver; resulting in one fatality This crash occurred during dark and unlighted conditions with adverse weather including snow.
County Rd 74E 0.9 miles east of Deer Meadow Way – (McNay Hill area) 3/17/2016: Single vehicle
crash on a snow packed/icy road. The vehicle slid off the roadway, hit a fence and rolled 3/4 times; resulting in one fatality. The crash occurred during daylight and the suspected cause is exceeding a safe speed.
County Rd 21C 434 feet south of Island Place (Over land Trail) – 6/20/2016: A single vehicle DUI
accident; The vehicle collided with a guardrail, then continued 0.5 mile at a high rate of speed. There, the vehicle traveled off the right side of the roadway, up an embankment, collided with a fence, went airborne for 38 feet, and finally rolled 2-1/2 times before coming to final rest; resulting in one fatali-ty. This crash occurred on a dry roadway in daylight conditions.
County Rd 23 0.25 miles nor th of CR 38E (Horsetooth Reservoir area)– 9/15/2016: Single vehicle
crash, a motorcycle traveling at a high rate of speed lost control and collided with a guardrail multi-ple times, ejecting the driver; resulting in one fatality. This crash occurred on a curve on-grade during daylight conditions. The suspected causes of this fatal crash were excessive speed and driver DUI.
County Rd 8E 0.244 miles west of CR 27E (Car ter Lake area) – 9/20/2016: Multiple vehicle crash
involving a bike; The bike was behind a non-contact vehicle that slowed suddenly, causing the bike to swerve to avoid a collision. The bike crossed into opposing traffic and was struck by a pickup, re-sulting in one fatality. This crash occurred on a straight on-grade roadway at dusk.
County Rd 8 At County Road 21 (Ber thoud area) – 10/5/2016: Three vehicle crash at an intersection,
a vehicle proceeded through a stop sign into traffic on the cross street. The vehicle was struck by an eastbound vehicle and spun before colliding with a westbound vehicle; resulting in one fatality. This crash occurred on a straight on-grade roadway during daylight conditions.

10 2016 Traffic Safety Report
Roadway Departure Crashes
Two-lane rural roads are the most dangerous part of the road system.
In 2016, 50% of all crashes involved a vehicle leaving the roadway
(roadway departure crash). Here’s what we know about those crashes:
Road Condition: 74% of the crashes occurred on dry
roads
Light Condition: 56% occurred during daylight hours
Fatal Crashes: 71% are Roadway Departure Crashes
2016 Roadway Departure Top 5 Worst Locations
CR 27 [14 Crashes Total] - Hotspots north of CR 44H and south of CO SH 14
CR 19 (Taft Hill Rd) [11 Crashes Total] - Hotspots near CR 28 and Ideal Lane
CR 38E [11 Crashes Total] - Hotspot near Lake View Drive (south end of Horsetooth Reservoir)
CR 52E [11 Crashes Total] - Most concentrated between CR 25E and CR 54G
CR 29 [10 Crashes Total] - Concentrated between CR 18E and US HWY 34
Roadway departure crashes
are frequently severe and ac-
count for the majority of high-
way fatalities. In the United
States during 2015, there were
18,695 fatalities as a result of
roadway departure, which is
over 53% of all fatalities.*
In Larimer County, there is no
singular cause of roadway de-
parture crashes; in fact most
have no apparent contributing
factor. Trends over the past
five years have been very con-
sistent with about 50% of the
causes classified as either not
apparent or other.
*https://safety.fhwa.dot.gov/
roadway_dept/

11 2016 Traffic Safety Report
Motorcycles Crashes The total number of motorcycle crashes and the percent of motorcycle crashes compared to the total number
of crashes has remained fairly constant over the last few years, typically around 9%. However, the chance
of injury or death is disproportionally higher. In
2016, 82% of motorcycle crashes resulted
in injury or death compared to 16% in
other vehicles.
Similar to 2015, 2016 saw an in-
crease in motorcycle crashes with
drivers in the 51-60 age group. The
number of crashes grew from 6 to
13 in this age group for the year.
Also, there were fewer crashes in
the 18-30 age group, with 11 in
2016 versus 17 in 2015
Coloradoan, 2014
Most crashes are in the foothills and
speed contributes to nearly half of all
crashes.
The majority of motorcycle crashes
are caused by Inattentive Driving,
Speed, or Lane Violations, accounting
for 74% between these three causes.

12 2016 Traffic Safety Report
Bicycle Crashes
Bicycling is a popular activity in Larimer County
whether riding for commuting or pleasure. Many of
the cities and towns actively promote bicycling and
many events are requested and held on county roads in
the summertime.
The number of bicycle crashes has remained fairly
steady over the past three years. However, similar to
motorcycles, the severity of the crashes is much high-
er than for a motor vehicle.
57% of the bicycle crashes resulted in injury
or death.
Coloradoan June 2015
Pedestrian Crashes
The number of pedestrian
crashes is low in Larimer
County with 8 during the last
five years. As the crashes re-
ported here are in the unincor-
porated area of the county there
are generally fewer pedestrians.
The City of Fort Collins aver-
ages 45 total pedestrian crashes
per year. The majority of these
crashes occur at signalized in-
tersections or non-designated
pedestrian crossing locations in
areas with high pedestrian vol-
umes. Larimer County does not
have many areas with high vol-
ume pedestrian traffic; which
reflects the low number of pe-
destrian crashes.
32 2
3 3
69
44
3
1
0
2
4
6
8
10
12
14
2012 2013 2014 2015 2016
Nu
mb
er
of
Cra
she
s
Bicycle Crashes
FAT
INJ
PDO
1
1
2
0
2
0
1
2
0
1
00
1
2
3
4
5
6
7
8
9
10
2012 2013 2014 2015 2016
Nu
mb
er
of
Cra
she
s
Pedestrian Crashes
INJ
PDO

13 2016 Traffic Safety Report
Animal Related Crashes
The total number of animal crashes in
2016 was 35, an increase from 32 the
previous year.
The most common animal crash was
with deer, 71% of all animal crashes.
The total number of animal collisions in 2016 was 35, up
from 2015. This is an increase in animal related crashes
from the previous year of 9%, all but one crash involved
large animals, both wild and domestic, that can cause
more damage and injury
Coloradoan, Oct 25, 2014
22
19 20
28 2989 5
46
0
5
10
15
20
25
30
35
40
2012 2013 2014 2015 2016
Nu
mb
er
of
Cra
she
s
Year
Collisions with Animals (2012-2016)
DomesticAnimal
Wild Animal
Deer, 25, 71%
Elk, 3, 8%
Moose, 1, 3%
Horse, 1, 3%
Dog, 1, 3%
Cow, 3, 9%
Burro, 1, 3%
Accidents by Type of Animal
Deer Elk Moose Horse Dog Cow Burro
October & November
have the most frequent
collisions, about 50%.
Most occur at night on
unlit roads.

14 2016 Traffic Safety Report
Traffic Safety Program Review
During the past 10 years Larimer County has converted 5 crossroad intersections to roundabouts. The loca-
tions are CR 19 at CR 48 (Vine Dr), CR 9 at CR 30, CR 19 at CR 70, CR 11C at CR 30 and CR 11 at CR
30. A composite—comparison of crashes before and after the roundabout installations is displayed below.
There has been a small drop in the number of overall crashes even with increased traffic at each of the
roundabouts. The biggest benefit is the huge reduction in serious crashes at these 5 locations.
Intersection to Roundabout Crash Comparison

15 2016 Traffic Safety Report
Traffic Safety Mitigation Safety improvements completed on the County Road system during 2016
CR 11C - Pedestrian Hybrid Beacon: A pedestr ian / bicycle crossing on County Rd 11C located ap-
proximately 0.5 mi south of CR 30 was upgraded from a simple flasher system to a pedestrian hybrid bea-
con. The conversion was started at the end of 2016 and completed in early 2017. Advance flashers located
750 feet in advance of the beacon are coordinated to operate with the beacon upon pedestrian activation.
The new beacons require a stop by vehicles on CR 11C and new pedestrian countdown displays were added
which should improve the pedestrian and bicycle safety at this crossing.
CR 13E - Monroe Ave and CR 28 - 57th St Traffic Signal: A new traffic signal was installed at the
CR 13E and CR 28 intersection during 2016. Traffic studies had shown the intersection was meeting sever-
al of the Manual on Uniform Traffic Control Devices (MUTCD) warrants for a traffic signal including an
ongoing problem with right angle crashes. The permanent mast arm signal includes pedestrian push buttons
and count down displays to enhance pedestrian safety at the intersection. The project also included the ad-
dition of a northbound right turn lane on CR 13E to improve overall traffic flow at the intersection. The
signal was completed just before the start of the road reconstruction project on CR 11C. With some peak
hour signal timing adjustments, the signal significantly improved detour traffic flow.
CR 11C - Road Reconstruction: CR 11C was reconstructed from the Horseshoe Lake outlet to
Boyd Lake to just south of CR 28 - 57th St. The road was widened to include 6 foot paved bike shoulders
on each side of the road. This is a big safety improvement for a heavily traveled commuter roadway that
is also popular with bicyclists and handles a lot recreational vehicle traffic. The portion of the road from
the outlet south to CR 24E will be reconstructed in 2017.
Low Cost Safety improvements during 2016 included:
On CR 5 south of State Highway 392 a cooperative project was completed with the Poudre Valley Ru-
ral Electric Association (REA) and the county. An access to the REA property just south of SH 392
that was located very close to the SH 392 intersection was closed off and a new main entrance to the
REA property to the south was created. The county provided striping removal, installed thermoplastic
markings and painted new pavement markings to create a new dedicated southbound left turn lane into
the new entrance.
CR 25E — at the intersection of CR 52E (Rist Canyon Rd) there have been a couple of recent crashes
involving vehicles running the southbound stop sign on CR 25E. Residents reported several near miss-
es at the intersection. Signing was upgraded approaching the intersection and at the intersection on CR
25E and preformed Thermoplastic Stop Bars were placed on CR 25E to emphasize the stop condition
to drivers on CR 25E.
Pavement markings were upgraded and replaced using preformed thermoplastic markings at various
locations throughout the county.

16 2016 Traffic Safety Report
Traffic Safety Mitigation 2017
The following section highlights some of the safety projects that the Engineering Department will be focusing on in
2017.
Low Cost Safety:
County wide evaluation of all crash data and select locations for individual safety audits. This includes the
top 5 worst roadway departure crashes to determine potential mitigation measures and estimated cost.
Installation of speed radar signs on County Rd 23 and County Rd 52E approaching the Bellvue area
Additional measures at the County Rd 8 and County Rd 21 intersection to include solar flashing beacons.
2017 Safety Projects:
The installation and upgrade of mile markers on many of the county roads in the foothills and mountain-
ous areas of Larimer County. Markers were installed and upgraded on several county roads in 2016. The
remaining roads will be completed in 2017. The milepost markers will have geographically referenced
locations on the Larimer County GIS road inventory system. Milepost markers are used for reference in
emergency response situations, crash locations and road maintenance.
The southern portion of County Rd 11C between County Rd 24E and County Rd 28 will be reconstructed
during 2017. Improvements include a new entrance to Boyd Lake State Park with a dedicated left turn
lane on CR 11C and the addition of 6 foot paved bike lanes on each side. This will complete project no.
305, reconstruction of CR 11C.
Contact Information
Larimer County Engineering Department
Address
200 West Oak Street Suite 3000 Fort Collins, CO 80521 Mailing Address
PO Box 1190
Fort Collins, CO 80522-1190
Phone / Fax
(970) 498-5700
(970) 498-7986
Office Hours
8:00 a.m. - 4:30 p.m.
Monday - Friday
On The Web At:
www.larimer.org/engineering